
Abstract
Springback of SUS430/AA1050/TA1 (SAT) laminated sheet in multi-point forming (MPF) is difficult to predict due to its complex microstructure. In this work, the polycrystalline texture and crystal structure of the three materials were measured firstly by electron backscatter diffraction (EBSD). Crystal plasticity finite element method (CPFEM) considering twinning and slip was used to predict the anisotropy and tension-compression yield asymmetry (TCYA) of the materials. The data obtained by virtual simulation are validated and used to calibrate the phenomenological yield criteria. In the springback prediction model, the three materials were modeled using the layered modeling method. The anisotropic yield criteria were implemented into finite element software ABAQUS via a user-defined material subroutine VUMAT to fully consider the anisotropy of the SAT laminated sheet. The comparison between the forming experiment and simulation results shows that the model can predict the springback accurately. Finally, the effect of plastic deformation, strain path, and TA1 layer thickness on springback were discussed.
Introduction
SAT laminated sheet which combines the high strength, wear resistance, corrosion resistance of stainless steel and titanium, the small specific gravity of aluminum, as well as easy processing and high thermal conductivity, is widely applied in shipbuilding industry. 1 However, it is difficult to predict the springback because of the complex composition of SAT laminated sheet, which makes it difficult to predict the springback, which makes the design of forming tools tougher and costlier. One of the methods to effectively deal with the problems in the design of tools and process optimization for these advanced materials is to apply accurate calculation simulations, which requires the correct description of the materials’ deformation characteristics. 2
Strong in-plane anisotropy, which has a non-negligible effect on springback during the stamping forming process, is found in stainless steel, aluminum, and titanium. In particular, the deformation of titanium with TCYA is more complicated due to its hexagonal close-packed (HCP) structure.
3
Li et al.4,5 concluded that for FCC and BCC materials, it is sufficient to describe the anisotropy of aluminum and stainless steel based on the linear transformation method and the generalized stress invariance method. Nevertheless, for HCP materials, twinning is required for the lack of slip systems to accommodate plastic deformation, which causes the most significant anisotropy and asymmetry such as Mg-alloy6–9 and Ti-alloy.10–13 In earlier research, TCYA was mainly studied with the two-surface plasticity model14,15 and it is more widely used to incorporate the third stress invariant during the last decade. Lee et al.
16
introduced a uniaxial analytical method to study the elastic-plastic pure bending and bending-under-tension of AZ31B magnesium alloy sheets. The comparison between the experiments and the analytical method illustrates that the proposed model has the capability to predict the law of springback in Mg-alloy sheets. Nixon et al.
17
presented a comprehensive tentative and theoretical research on the deformation behavior of
Except for experimental purposes (usually involving uniaxial tension and compression in different directions),21–23 CPFEM is also used as a good example to study the inhomogeneous mechanical response of the materials. Gurao et al.
24
used a viscoplastic self-consistent (VPSC) model with a secant method to corroborate the evolution of microstructure and texture under homeothermy compression of pure-Ti with several different initial values. Knezevic et al.
25
adopted a polycrystal self-consistent model embedded in finite elements to simulate the deformation of textured α-titanium under quasi-static conditions. Lim et al.
26
develop an atomistically informed CPFEM model for
The present work is aimed to establish a model to predict the springback of SAT laminated sheet. First, the layered method was used to model materials. And the in-plane anisotropy of stainless steel and aluminum was described using Yld2004-18p. 32 For titanium, the anisotropic description of the TCYA is performed using the asymmetric yield criterion CB2004 based on the third invariant. CPFEM based on the polycrystalline texture and crystal structure of the three materials is used to predict the anisotropic mechanical properties. 33 The tensile and compressive yield stresses in various directions were obtained for parameter identification of Yld2004-18p and CB2004. Finally, MPF experiments and simulations of SAT laminated sheet were carried out and compared so that the results of springback prediction were verified.
Constitutive equation
Crystal plasticity
As in previous studies, 34 details of the crystallographic constitutive model for FCC and BCC materials were presented. However, for the HCP crystal structure, the plastic part of the velocity gradient is comprised of contributions from twinning, basal slip, <c+a> pyramidal slip and <a> prismatic slip, which are respectively denoted as:

where
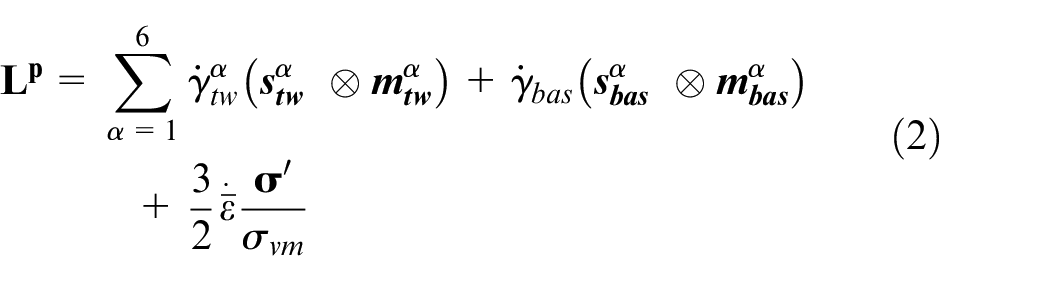
where
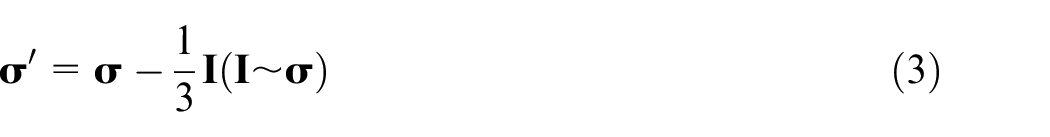
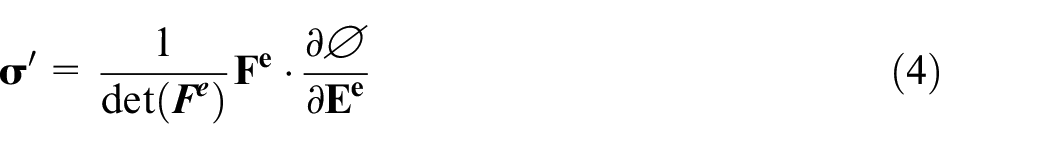
The stress is based on an unspecified elastic strain energy function Ø, which depends on the elastic part of the deformation gradient,
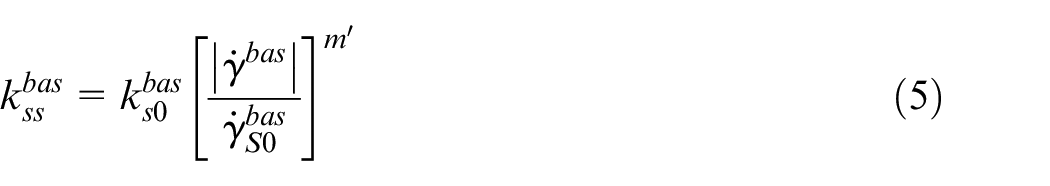
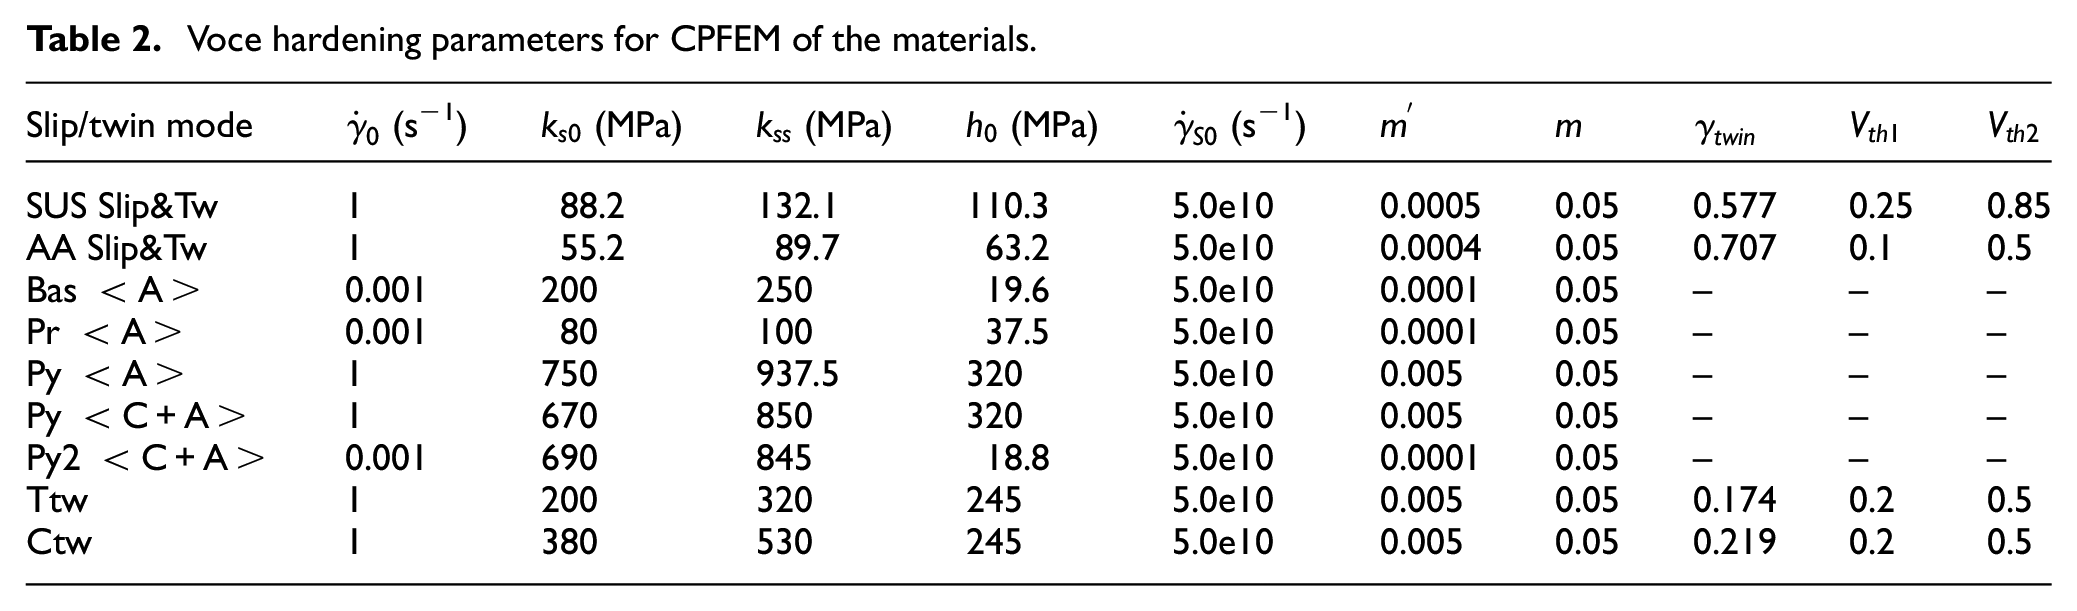
According to prior works, basal <a> slip and twinning, which were assumed to be rate-independent, were modeled respectively using Voce hardening:
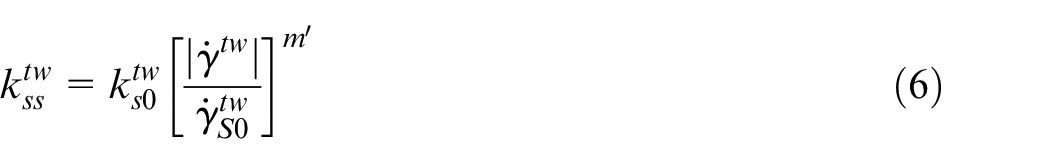
where
Yield function
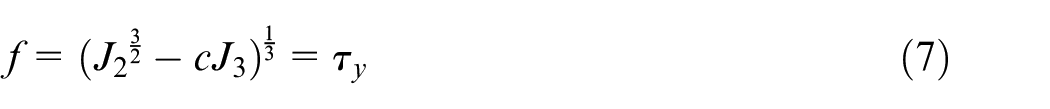
In this research, the CB2004 yield function is applied to capture the tension-compression asymmetry, which is given by:
where,
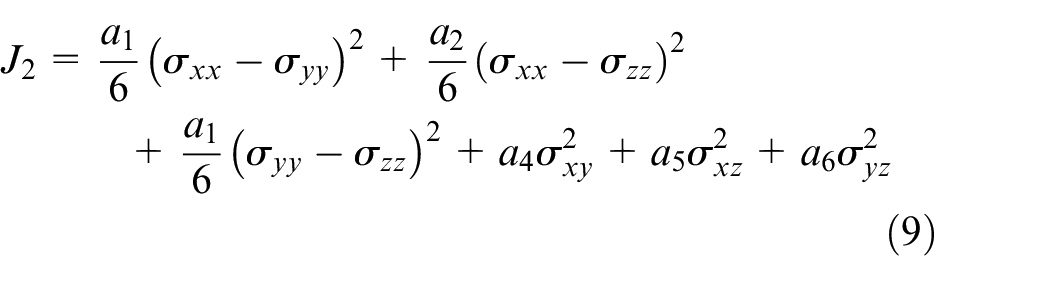
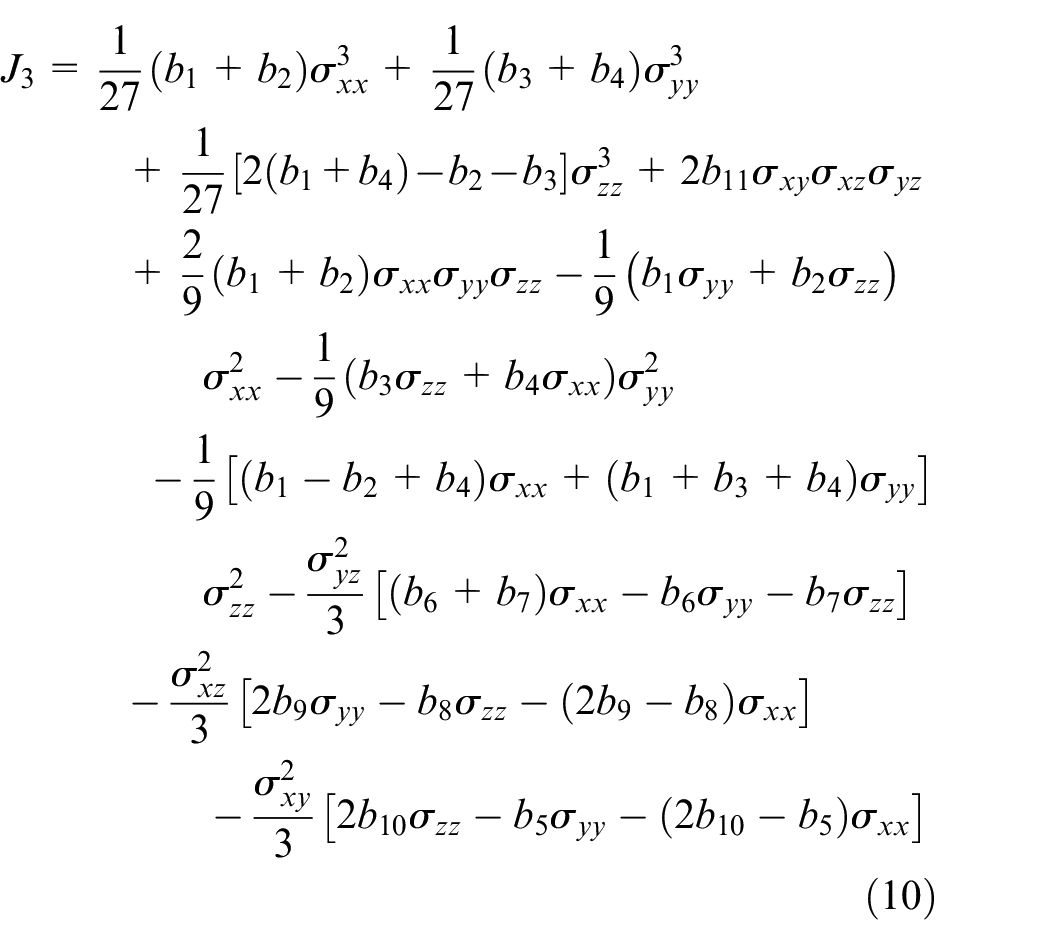
where x, y, and z represent RD, TD, and ND respectively. All the coefficients
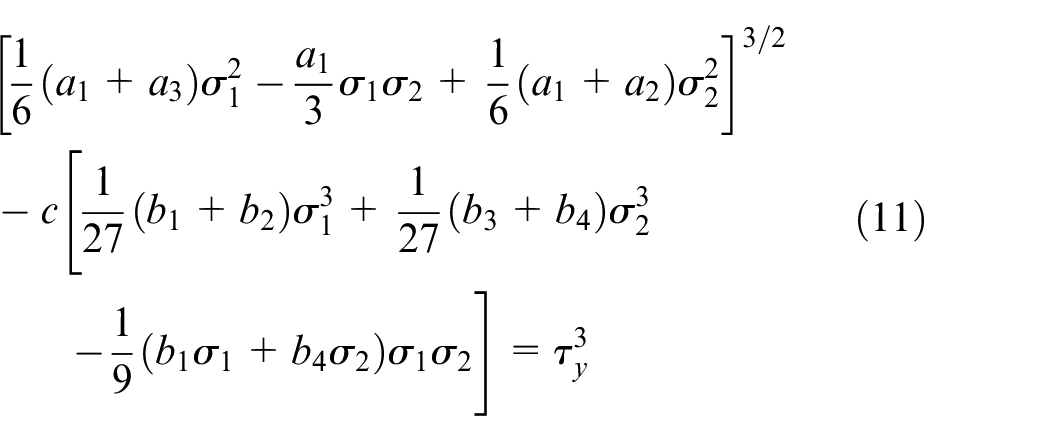
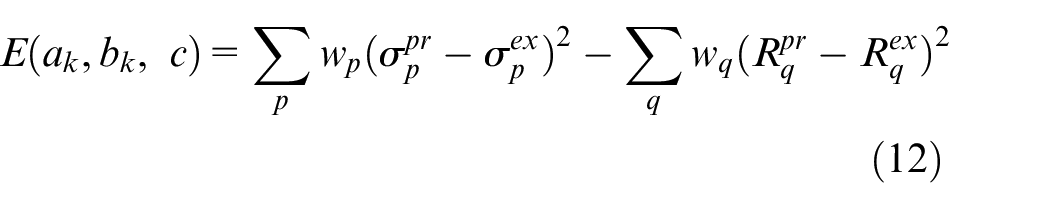
In the case of a sheet, the anisotropy coefficients of the CB2004 yield criterion are fitted based on the experimental yield stress and the single r-value available using the Levenberg-Marquardt (LM) algorithm. The error function was defined as:
where
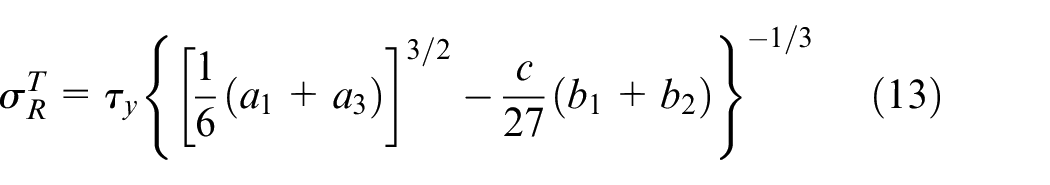
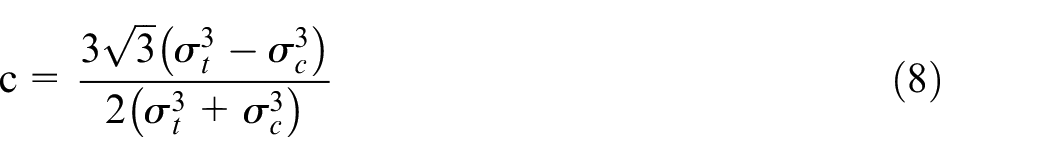
The yield stress in tension (
Yielding under equibiaxial tension occurs when
while yielding under equibiaxial compression occurs when
The plastic anisotropy parameter
Hereinafter the CB2004 anisotropic criterion will be applied to describe the anisotropy and asymmetry of the TA1. The Yld2004-18p anisotropic criterion will be applied to SUS430 and AA1050 sheet which present the obvious anisotropy and the neglected asymmetry.
Determination of phenomenological constitutive model using CPFEM
Texture based virtual mechanical tests
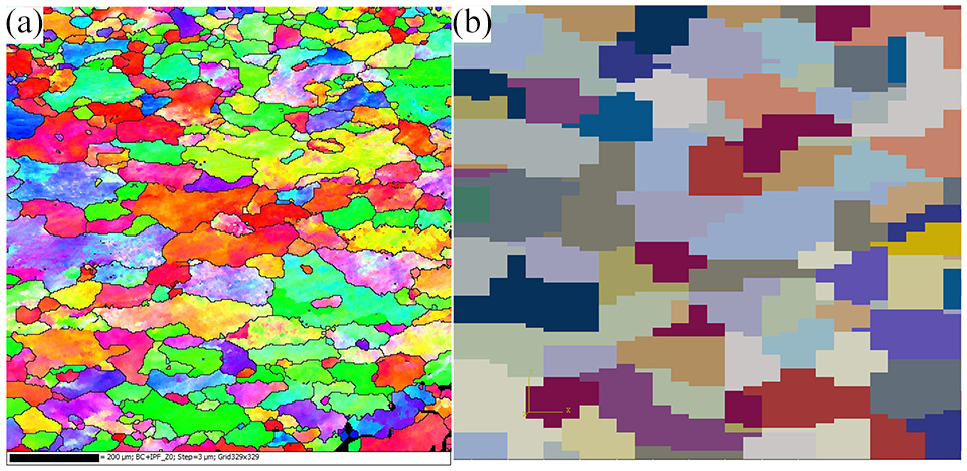
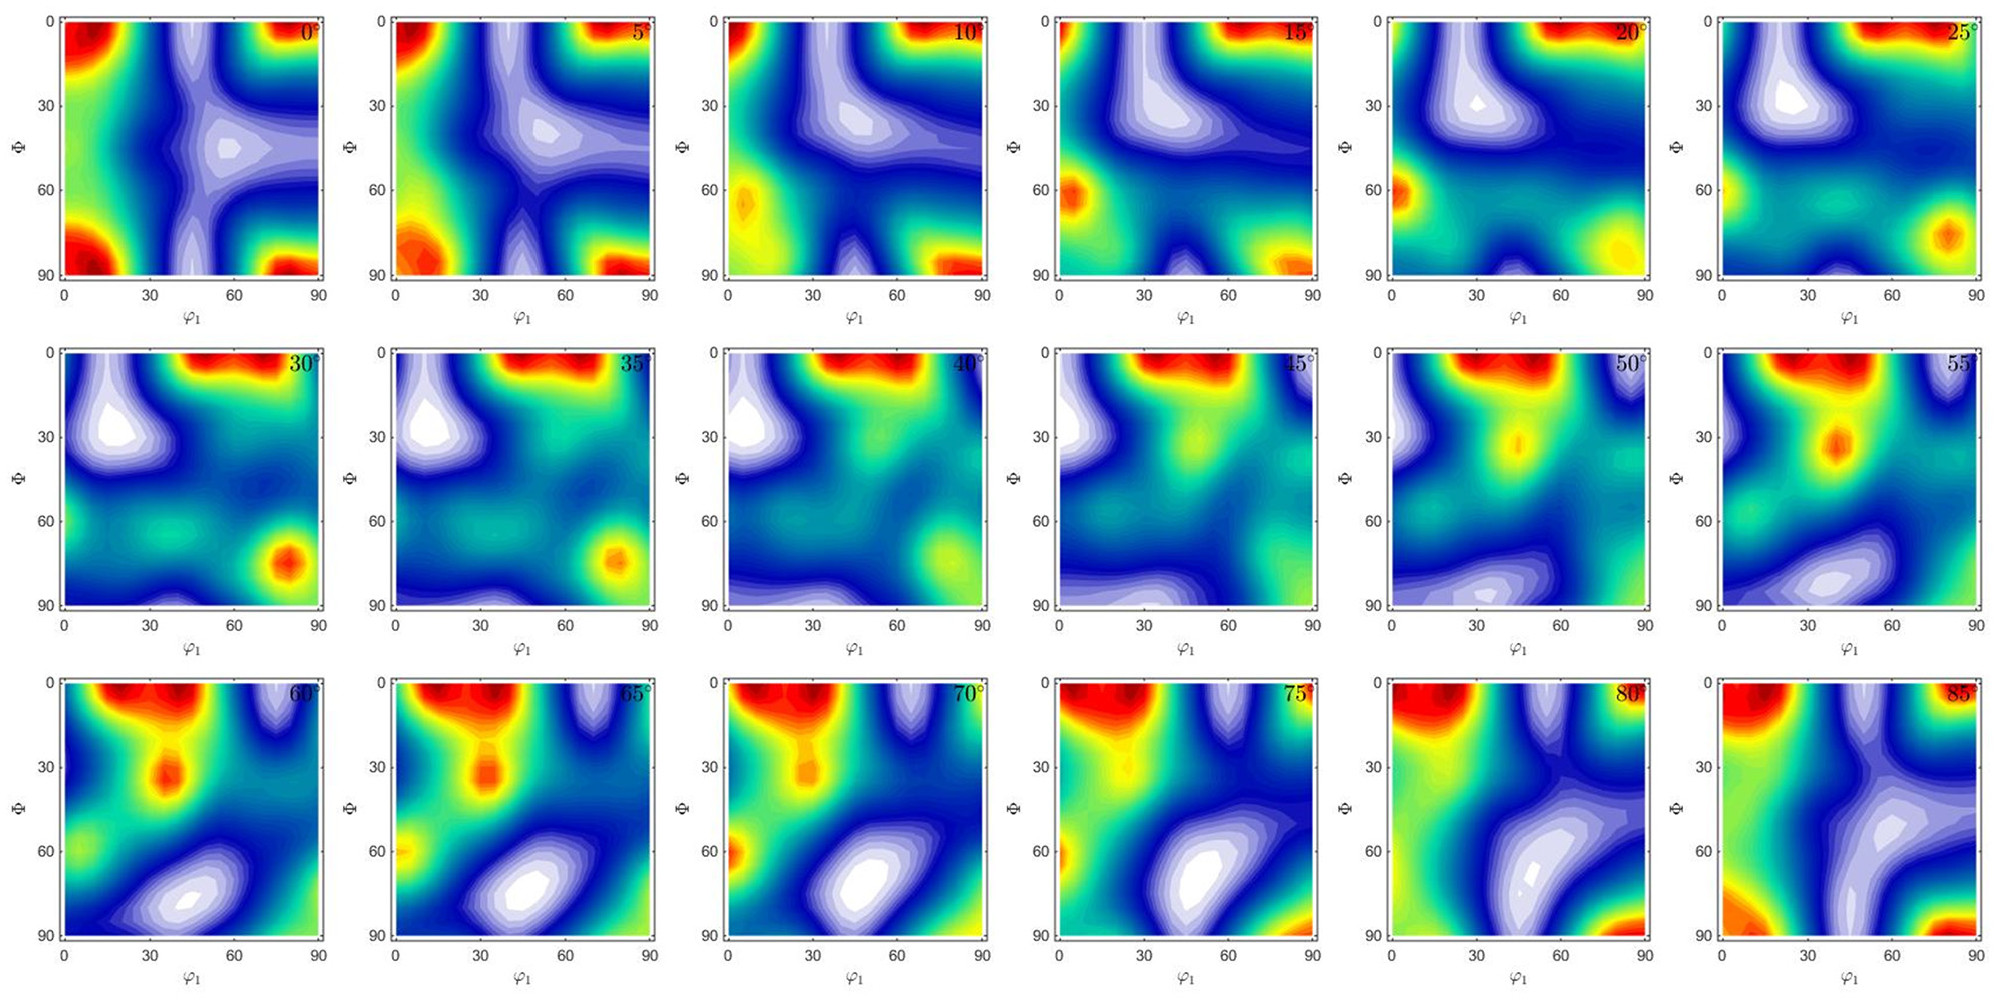
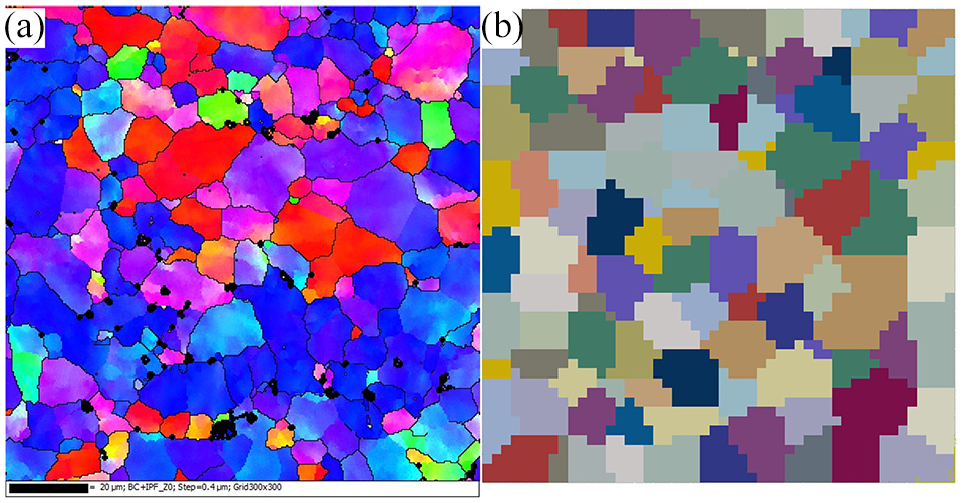
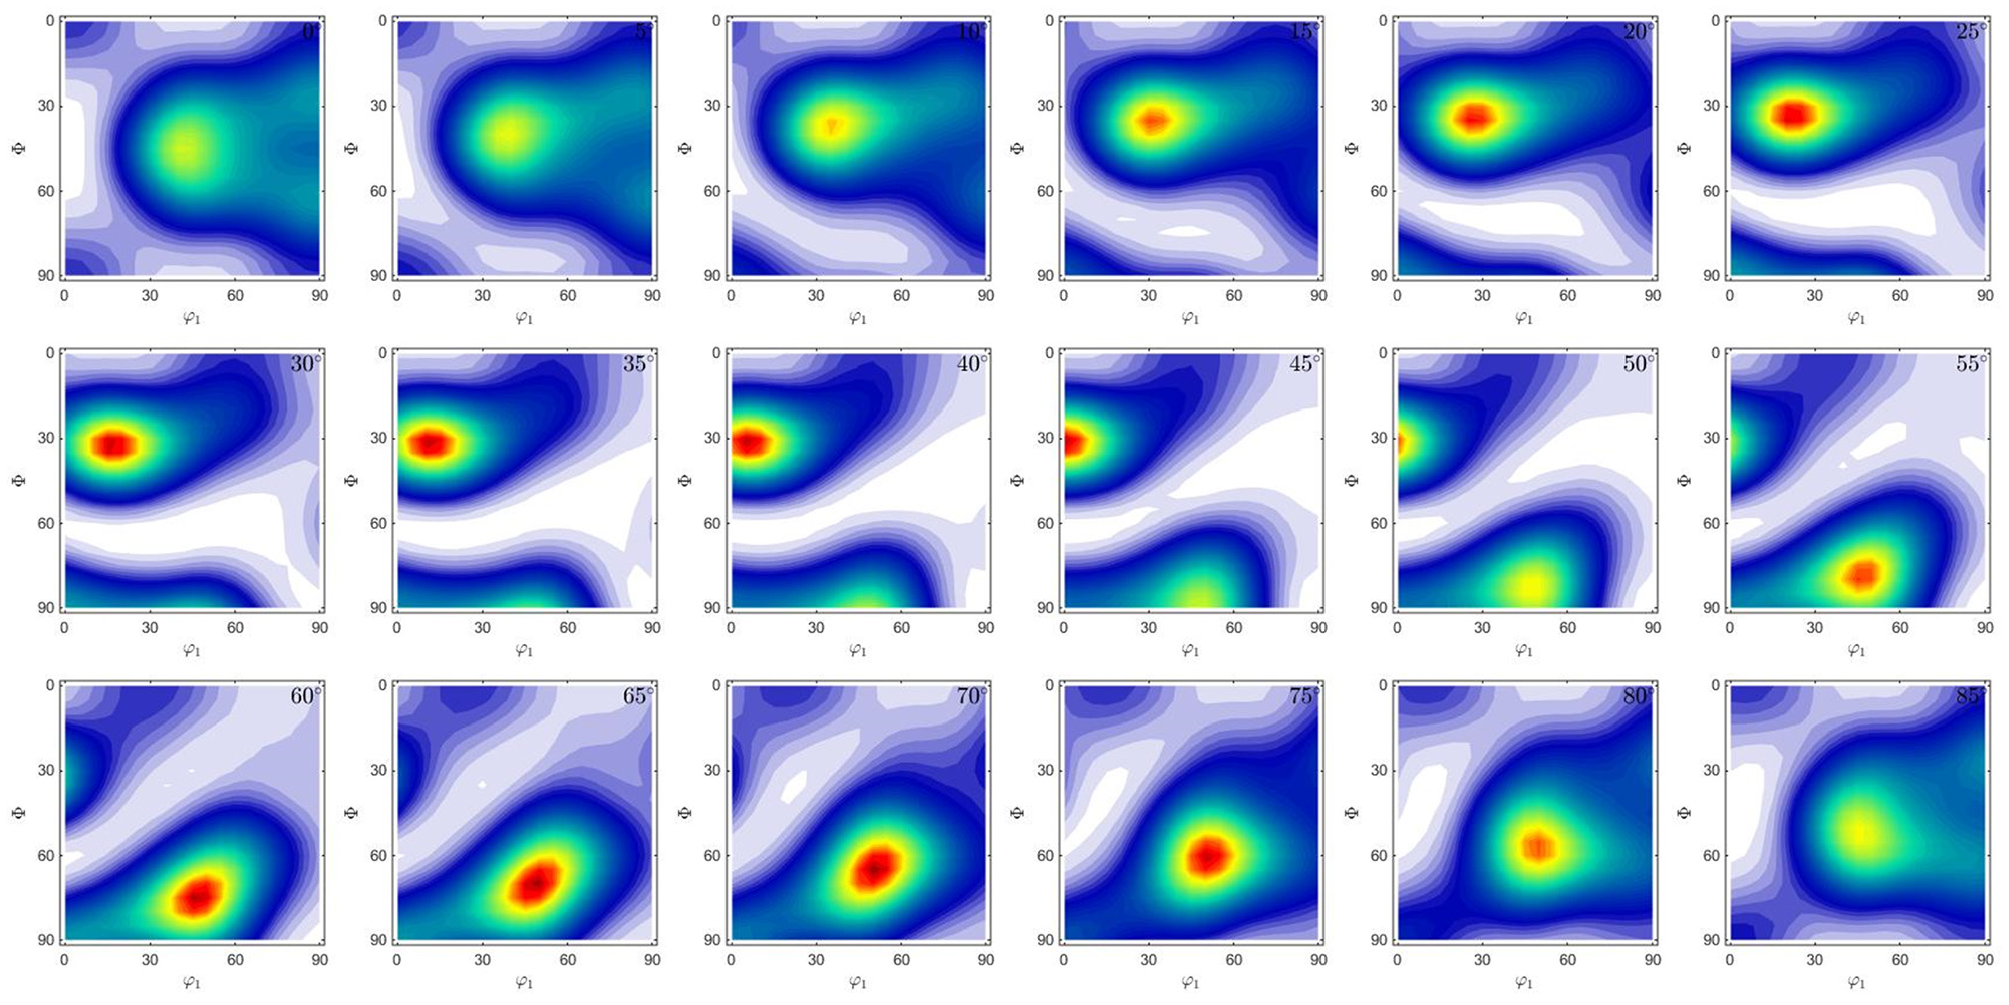
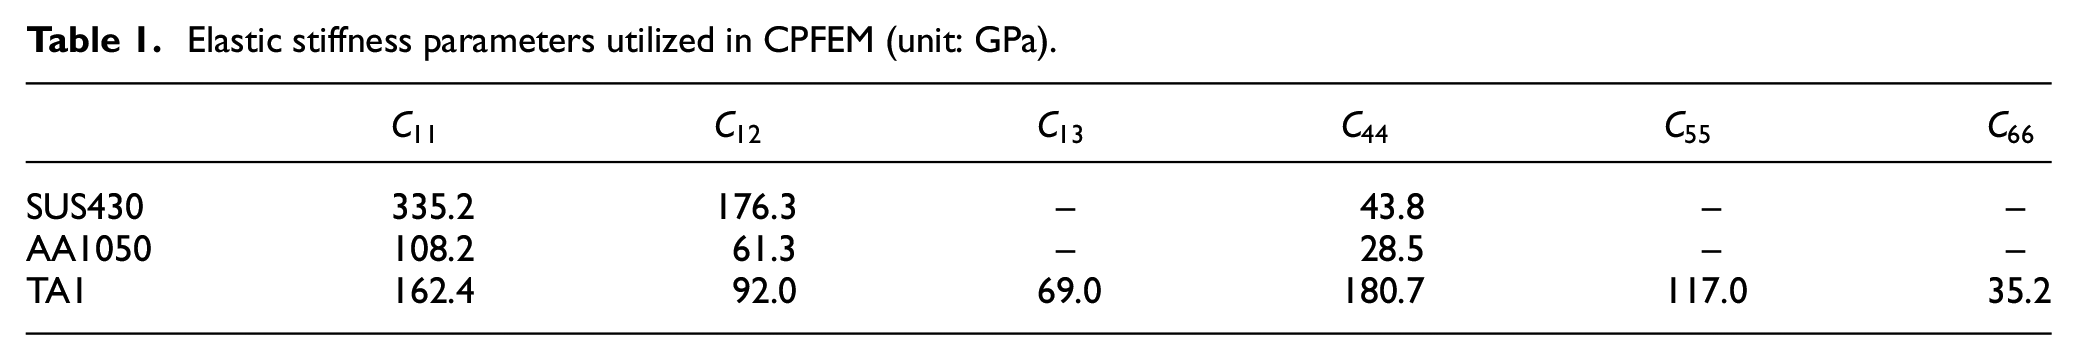
The crystallographic texture of AA1050, SUS430, and TA1 were measured by EBSD to construct the representative volume elements (RVEs). The IPF of TA1 obtained by EBSD and RVEs are shown in Figure 1. 3 The pole figure of TA1 is revealed in Figure 2. The IPF and ODF of AA1050 and SUS430 are respectively displayed in Figures 3 to 6. As identified in Section 2, the dominant mechanisms for TA1 include five gliding systems {0001} <11–20> (Bas<A>), {−1100} <11–20> (Pr<A>), {10–11} <11–20> (Py<A>), {10–11} <11–23> (Py<C+A>), and {11–22}<−1–123> (Py2<C+A>), two twinning modes tensile twinning {10–12} <10–1–1> (Ttw) and compressive twinning {11–22} <11–2–3> (Ctw). Moreover, it shows in Figures 7 and 8 the stress-strain curves for the three materials obtained by CPFEM and tensile test. The parameters used in the simulation are listed in Tables 1 and 2. The CPFEM which was consistent with the tensile test can be applied to determine the parameters of CB2004 and Yld2004-18p.
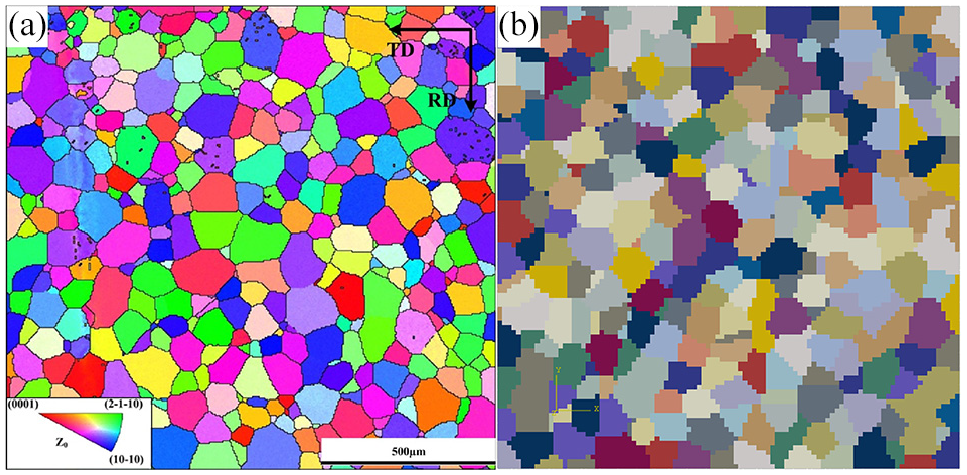
Comparison of the IPF between (a) EBSD and (b) RVE of TA1.
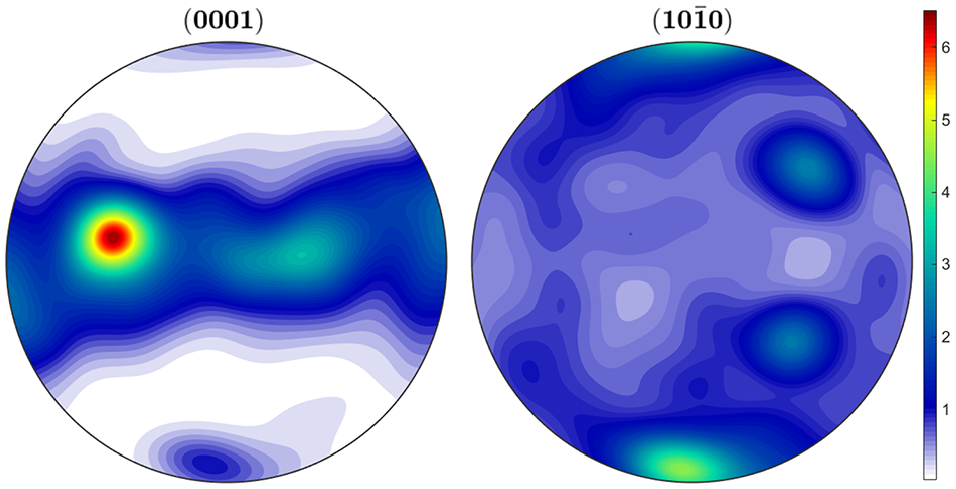
Pole figure of TA1.
Comparison of the IPF between (a) EBSD and (b) RVE of AA1050.
ODF of AA1050.
Comparison of the IPF between (a) EBSD and (b) RVE of SUS430.
ODF of SUS430.
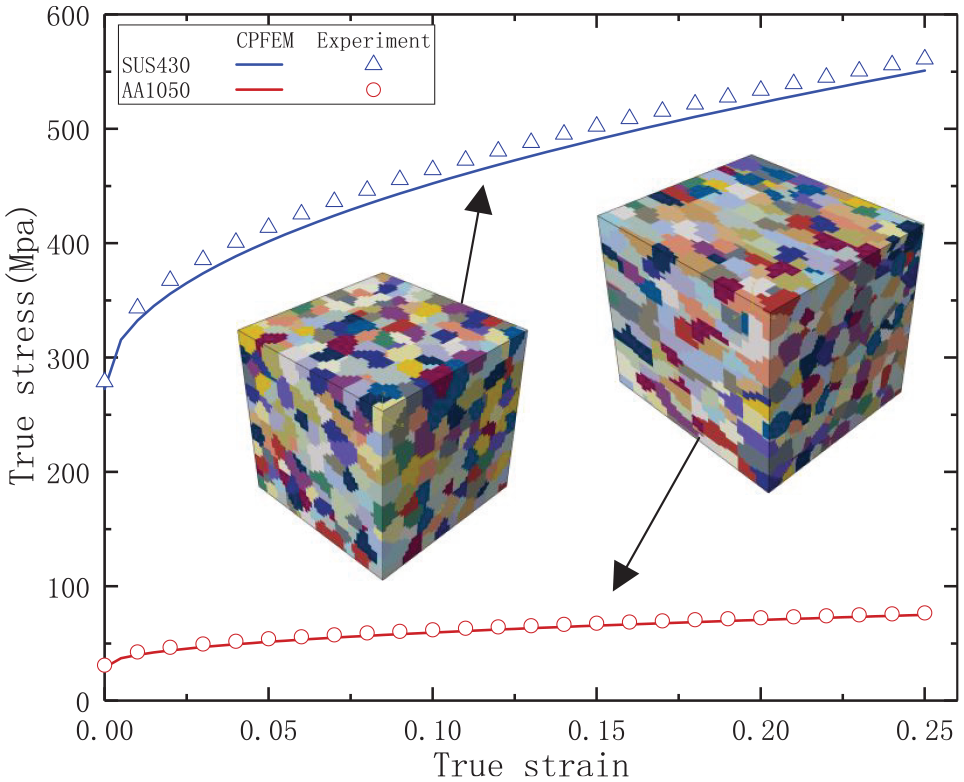
Comparison between CPFEM results and experimental data corresponding to the uniaxial loading in RD for SUS430 and AA1050 and their RVEs.
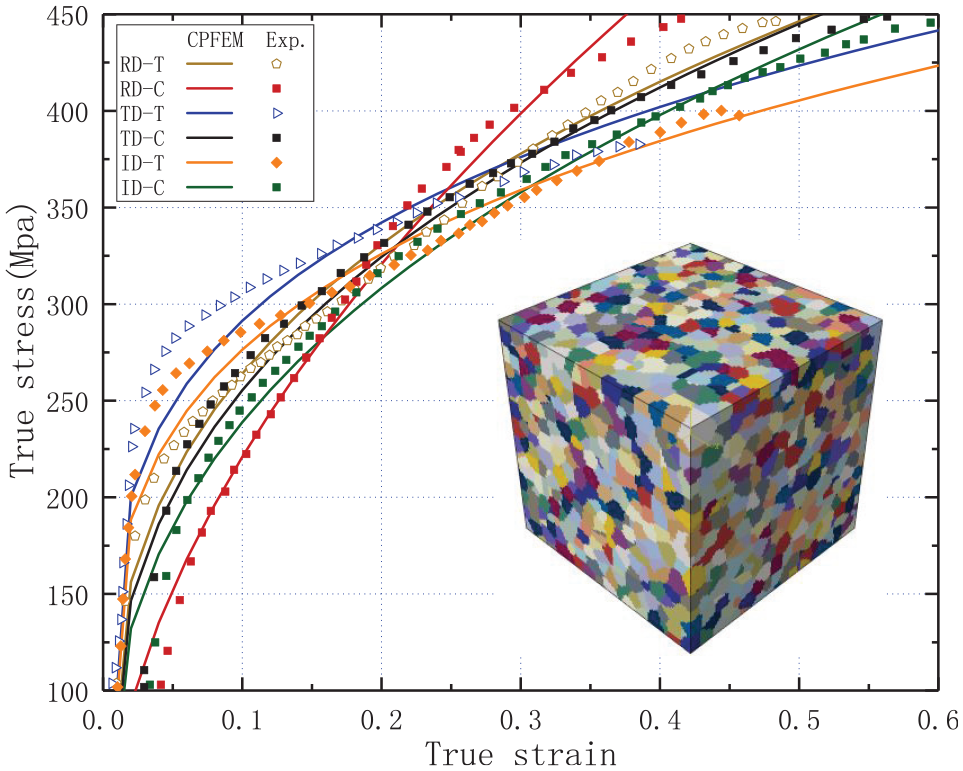
Comparison between CPFEM results and experimental data corresponding to the uniaxial tension (T) and compression (C) in RD, TD, and ID for TA1 and its RVE.
Elastic stiffness parameters utilized in CPFEM (unit: GPa).
Voce hardening parameters for CPFEM of the materials.
Determination of the yield surfaces with CPFEM results
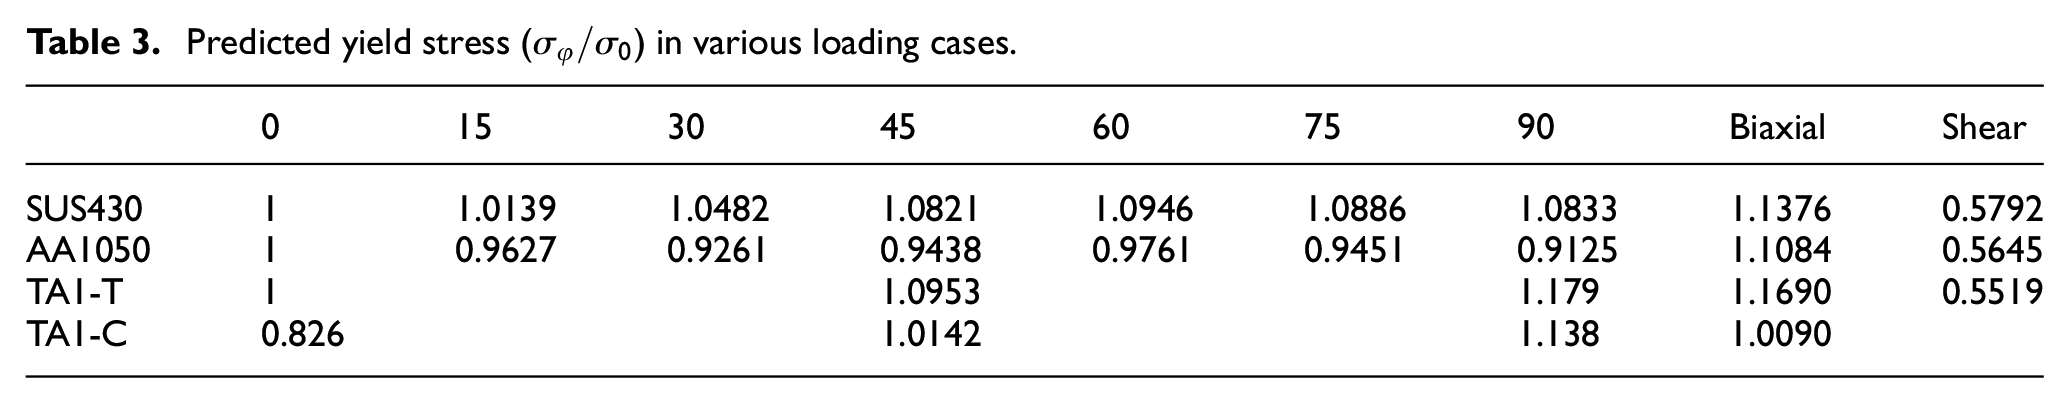
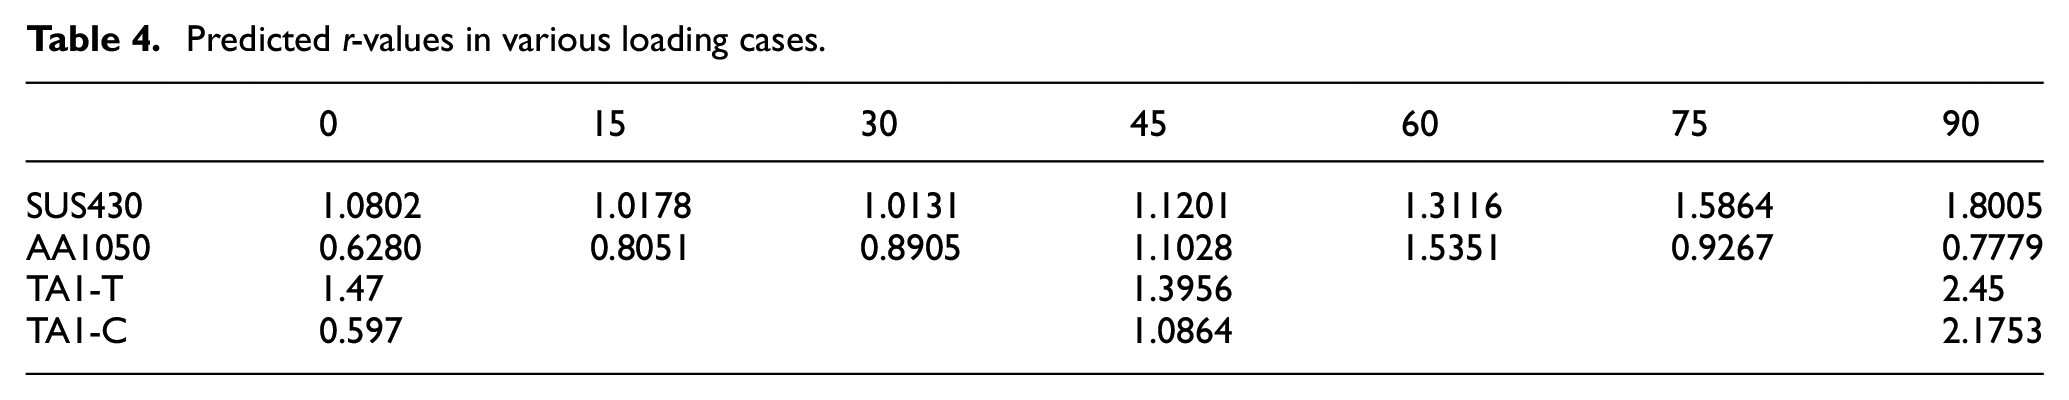
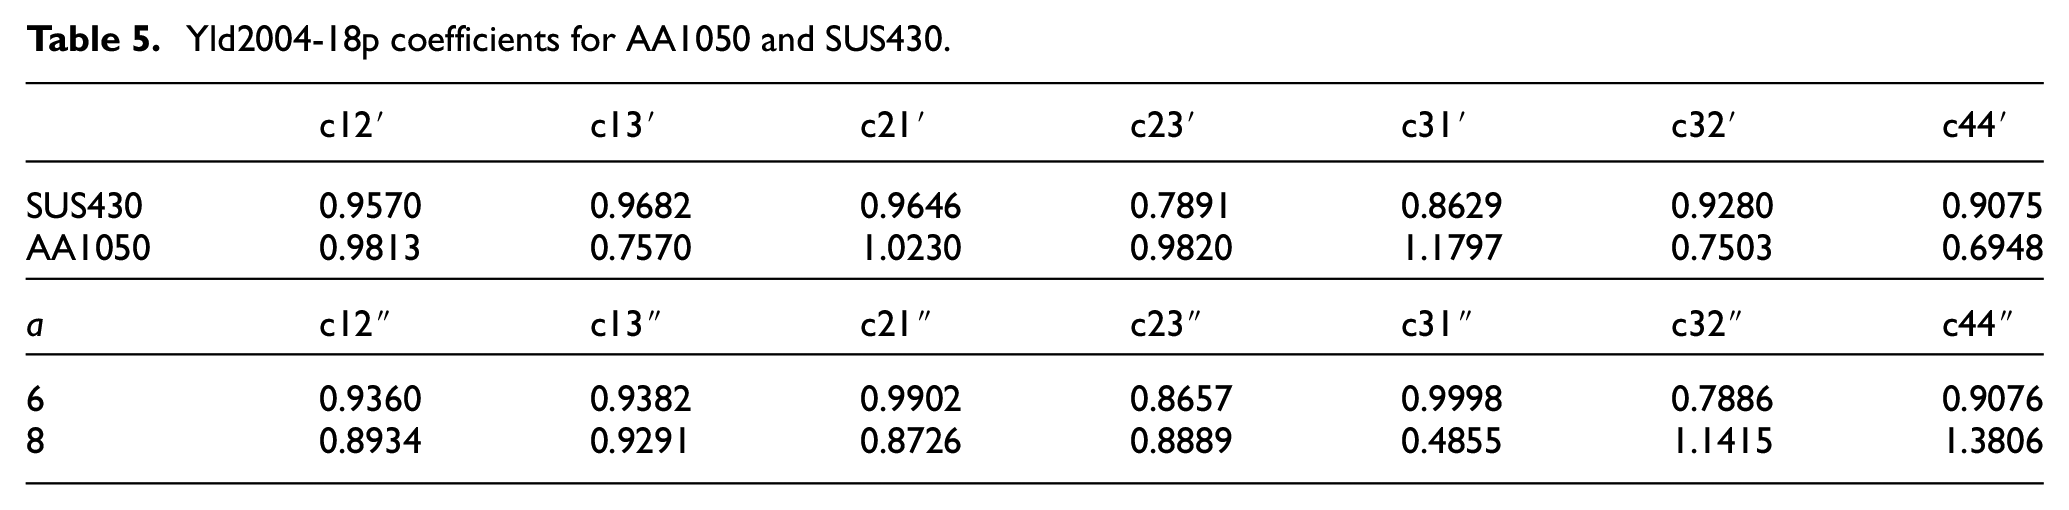
The yield stress and r-values in different loading cases predicted by CPFEM for the three materials are shown in Tables 3 and 4. The parameters for Yld2004-18p and CB2004 yield functions were summarized in Tables 5 and 6, respectively.
Predicted yield stress (
Predicted r-values in various loading cases.
Yld2004-18p coefficients for AA1050 and SUS430.
Identified parameters of CB2004 yield function.
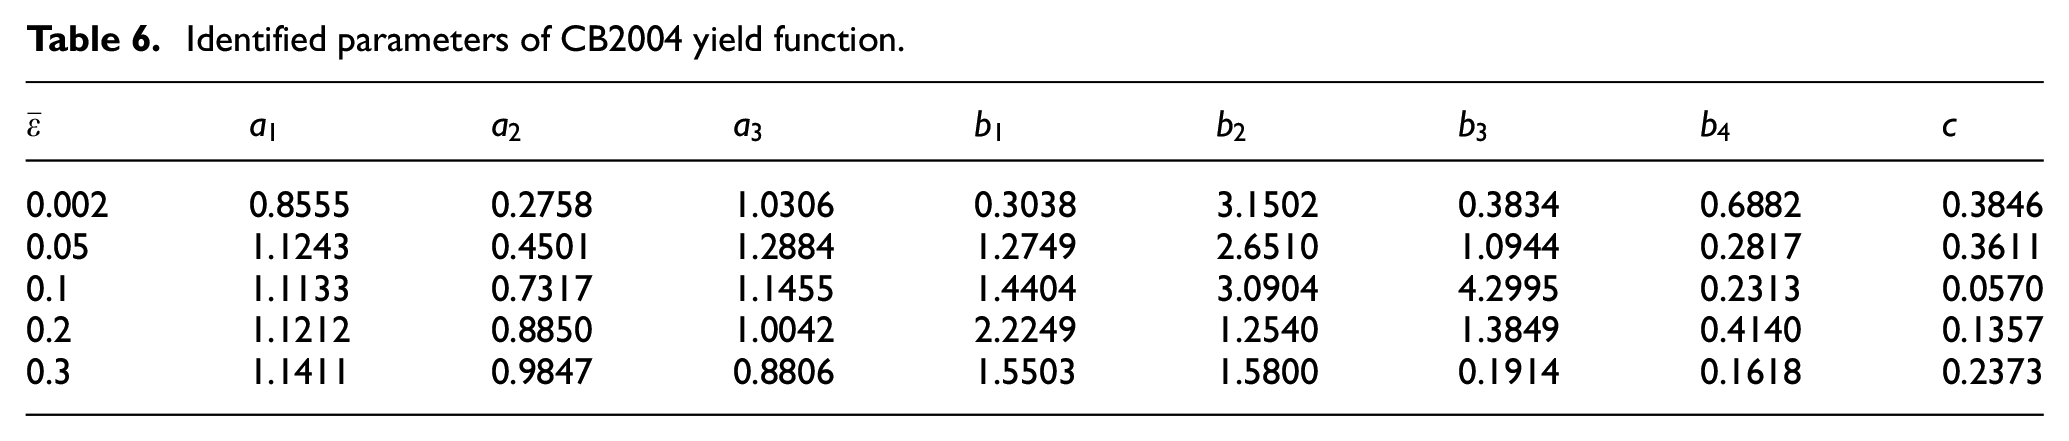
Figure 9(a) and (b) show the comparison of the r-values and normalized uniaxial yield stress calculated by yield functions with those obtained by CPFEM. Both Yld2004-18p and CB2004 functions are found to provide accurate evaluations of the r-values in tensile and compression deformation area. In the figures, the curves show that these models do well in capturing the anisotropic distribution of both r-values and flow stresses of the materials. It is noteworthy that the normalized stress for SUS430, TA1-T, and TA1-C are almost share the same trend with their r-values while AA1050 is otherwise, which is because that the normalized stress and r-values are mainly affected by texture. It can be seen from the ODF and pole figure that the main texture for SUS430 is the orientation with Euler angles (0,30,45) while for TA1, it is the basal texture. These textures are relatively stable during deformation and therefore exhibits regularity values versus with angle of rolling direction. Whereas for AA1050, the main texture is Cube (0,0,0), which is prone to rotation during deformation, thus leading to irregularities in the normalized stress and r-values versus with angle of rolling direction. The yield surfaces of the three materials for different plastic deformation are displayed in Figure 10. As can be seen from Figure 10(a) and (b), the yield surfaces constructed by Yld2004 has good convexity, which consequently could be used to represent the material behavior of AA1050 and SUS430. Therefore, it can be concluded that the second invariant-based Yld2004-18p function is sufficient to describe the regular yielding evolutions of AA1050 and SUS430. In Figure 10(c), CB2004 function is shown to provide an accurate prediction on yield stresses in almost all tension and compression cases. To conclude, CB2004 function is capable of successfully capturing the evolving anisotropy and asymmetry by involving the third invariant.
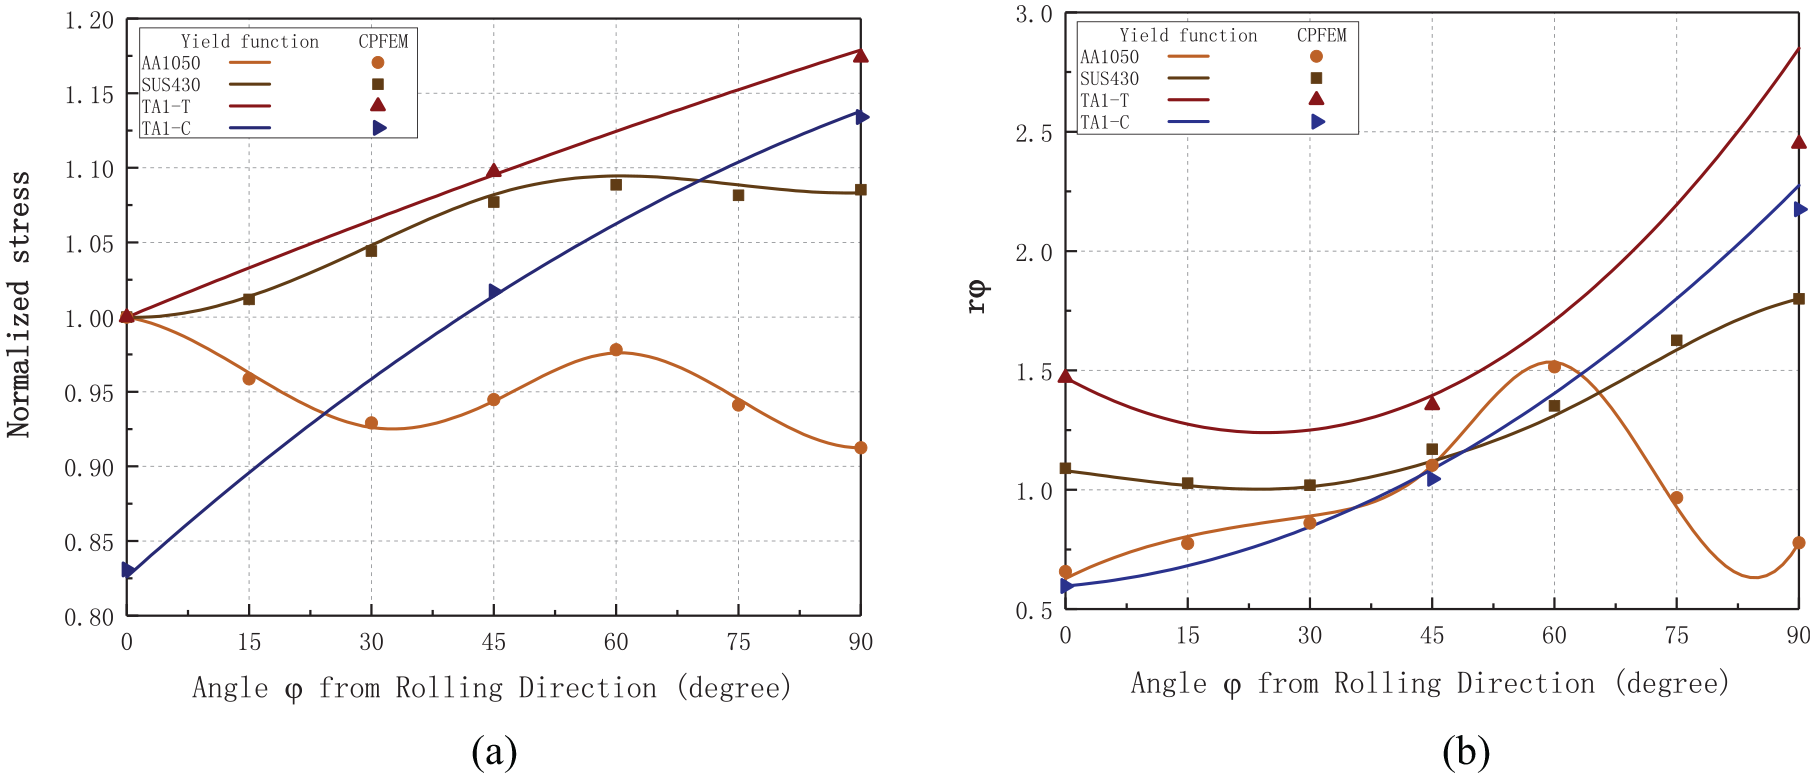
(a) Uniaxial yield stress and (b) r-value for the three materials calculated by the yield functions and those predicted by CPFEM.
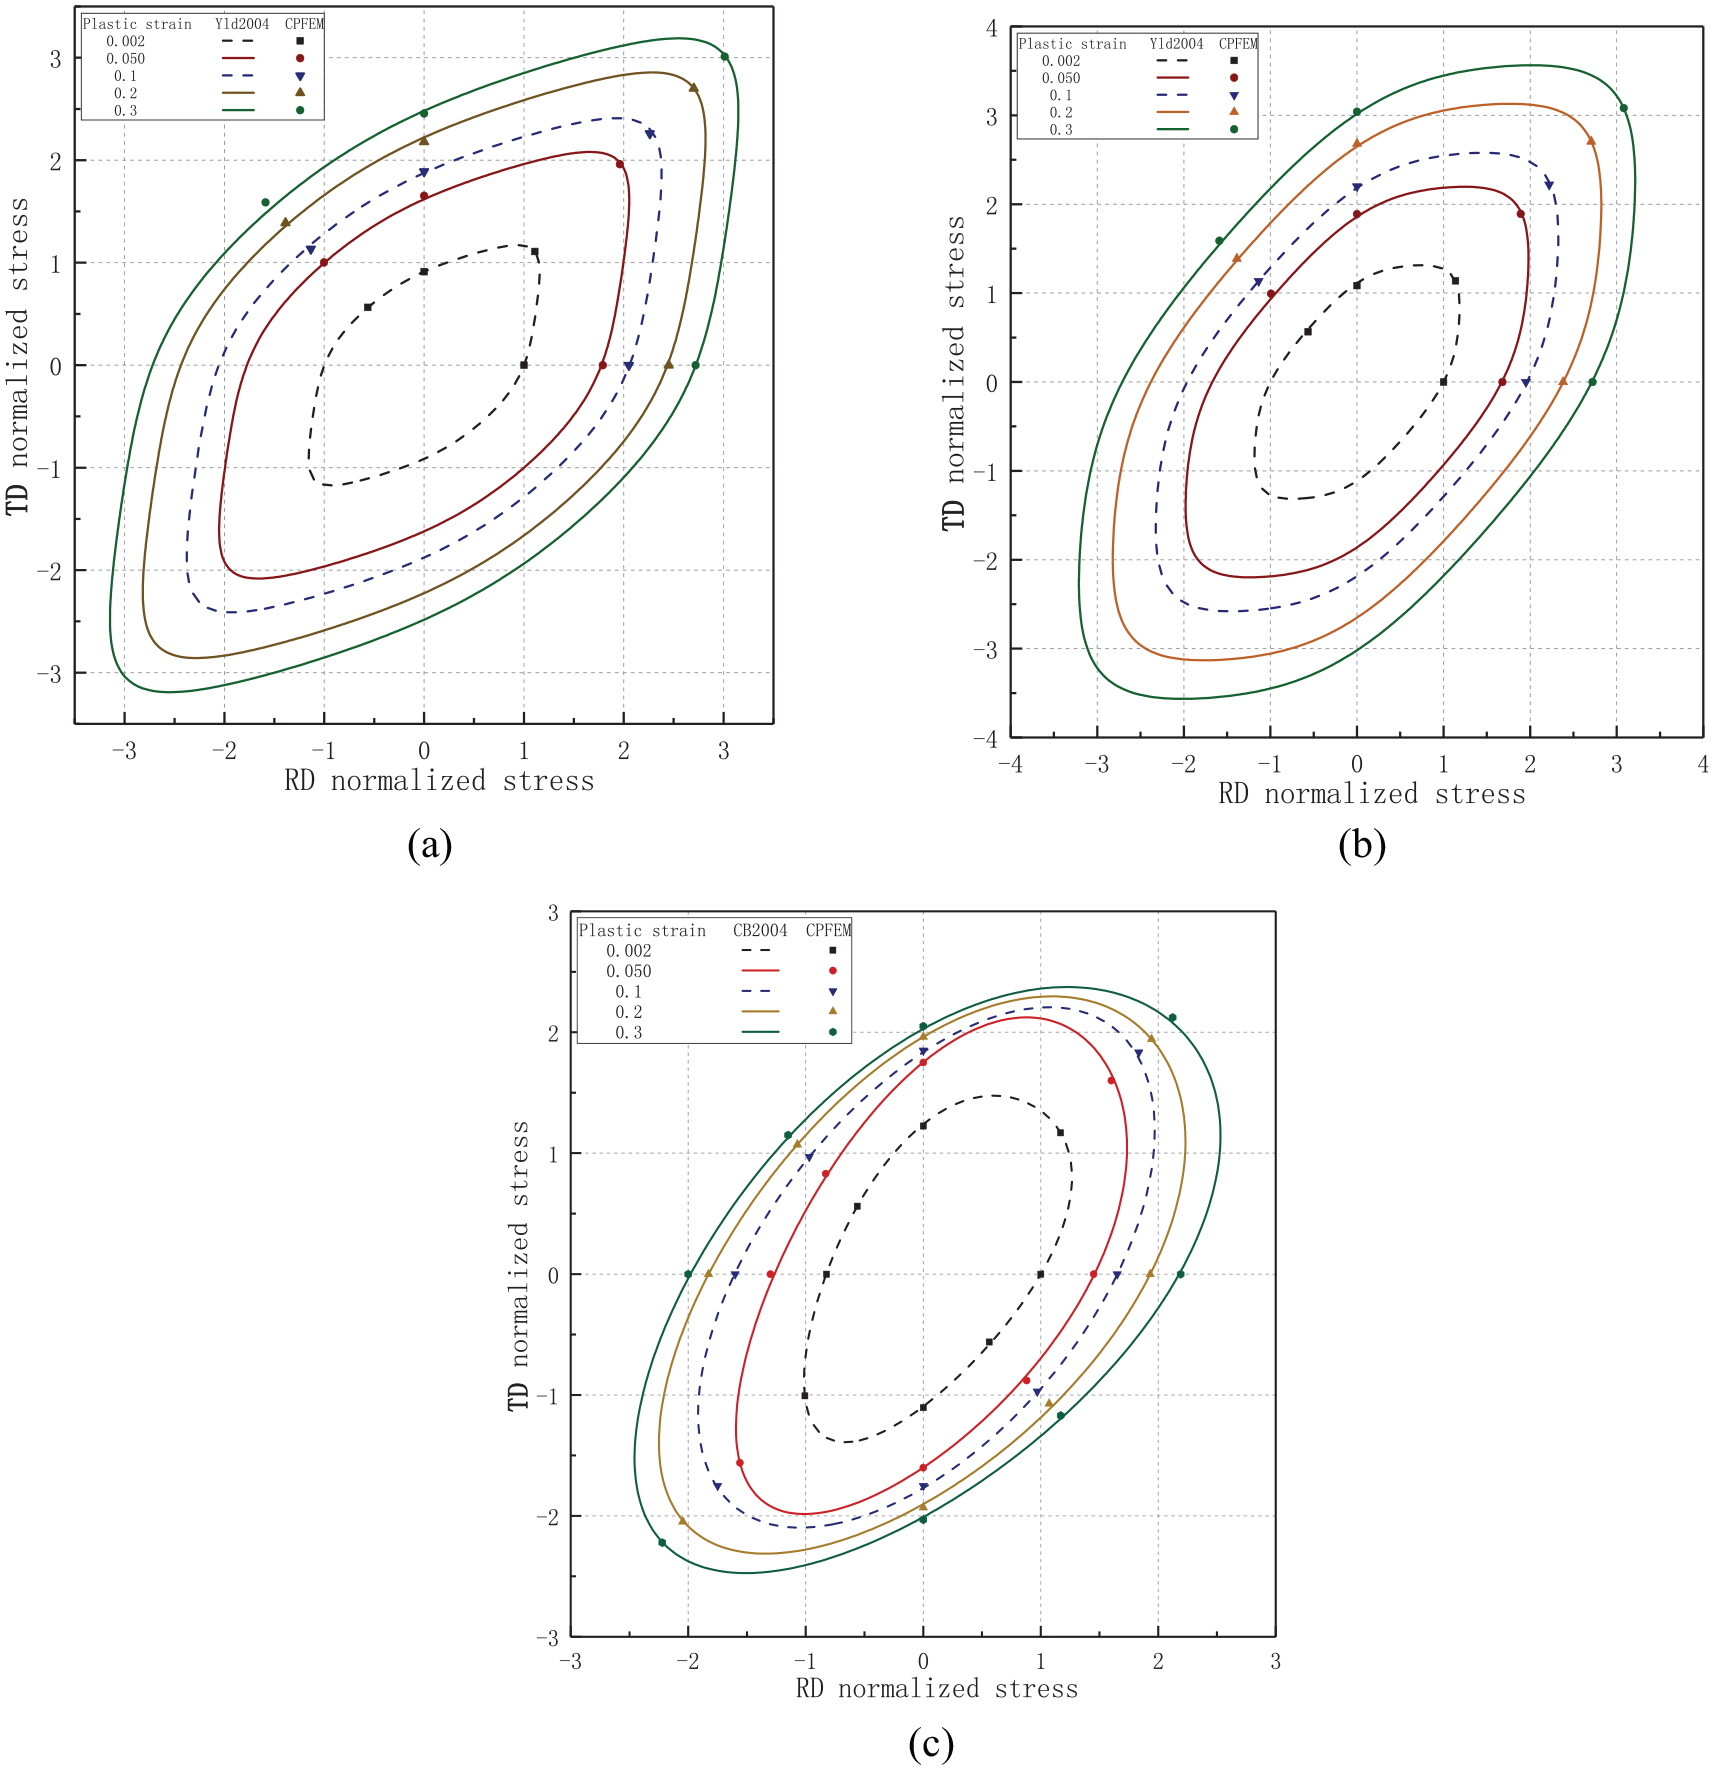
Yield surfaces of (a) AA1050, (b) SUS430, and (c) TA1 for different strain level.
Flow stress
In this work, Ludwig equations are selected to illustrates the size of the yield function during deformation. The hardening models of equivalent stress (
SUS430:
AA1050:
TA1:
FEM and experiment of MPF process
Verification of SAT constitutive model
To verify the accuracy of the hierarchical modeling method for describing the constitutive model of SAT laminated sheet, tensile test simulations and experiments were performed along RD, ID, and TD. In the simulations, the elastic modulus E and the poisson’s ratio ν were set, which are E = 69.3 GPa and ν = 0.33 for AA1050, E = 108.2 GPa and ν = 0.28 for TA1, while E = 215 GPa and ν = 0.34 for SUS430. The CB2004 and Yld2004 yield functions and the hardening rules were implemented in VUMAT subroutines. The stress-strain curves obtained from FEM were compared with the experiments in Figure 11. And the stress in the simulation is taken as the average stress of the elements over the parallel length. The agreement between these sets of data is so excellent that proves the accuracy of the hierarchical modeling method. In the experiment, the bonding interface is not as good as that in the simulation, which results in the amount of damage in the experiment at the initial stage of tensile test.
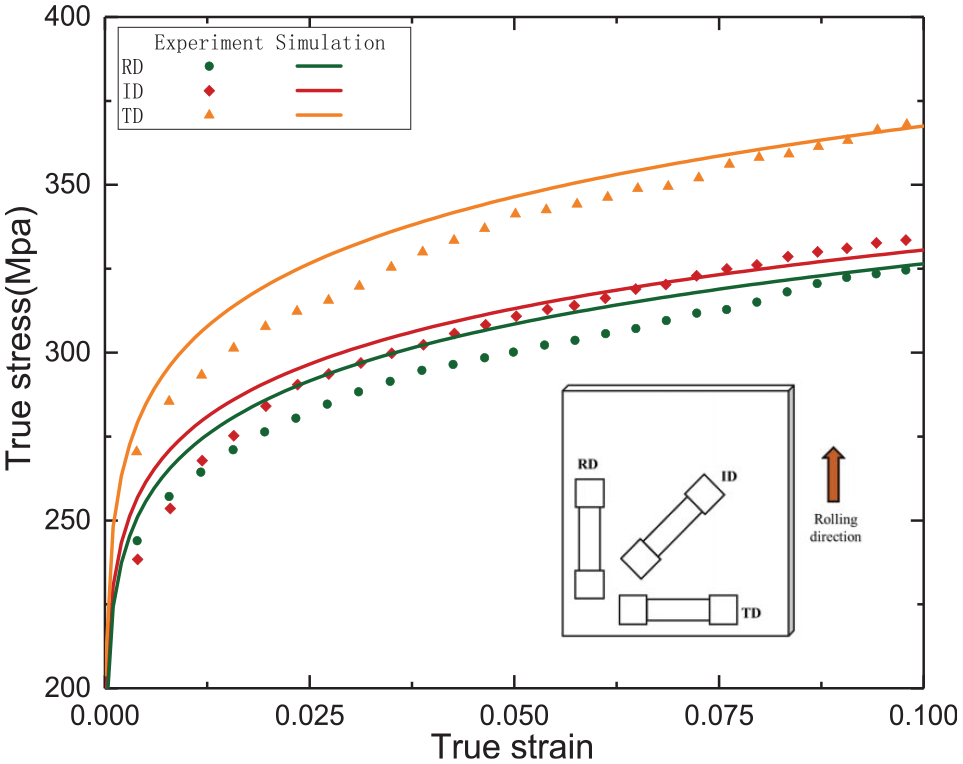
Stress-strain curves of SAT laminated sheet in RD, ID, and TD obtained from simulation and experiment.
MPF modeling
ABAQUS/explicit was used to perform the FE simulation of the loading process. As shown in Figure 12, the model consists of multi-point die (MPD), elastic cushion, and sheet. As the effect of bonding interface on the springback prediction is ignorable, the bonding interface of the sheet was assumed perfect. The dimension of the sheet and the elastic cushion was 200 mm × 200 mm (length and width), with a thickness of 10 mm for the elastic cushion while that of the sheet was 2.5 mm, where SUS430 is 0.5 mm, AA1050 is 1.7 mm, and TA1 is 0.3 mm. The friction coefficient was set as 0.15. The element type, loading speed, and unloading process can refer to the previous work. 34 The element size of the elastic cushion is 2 mm × 2 mm × 2 mm, while that of the sheet is 1 mm × 1 mm (length and width). Additionally, both TA1 and SUS430 were divided into one layer of mesh in the thickness direction, in which AA1050 was divided into three-layer grids. The total number of elements for TA1, SUS430, and AA1050 are respectively 40,000, 40,000, and 120,000.
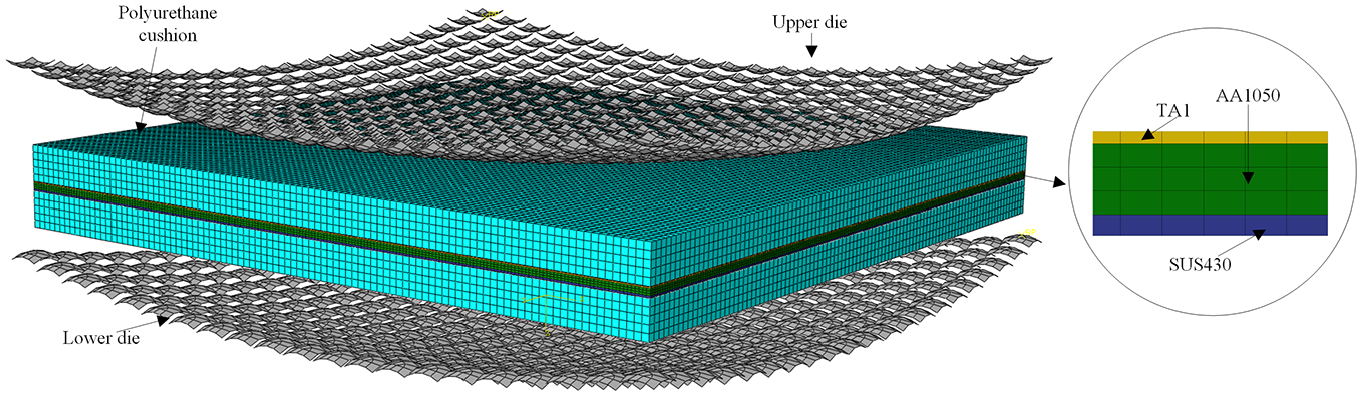
FE model of MPF.
MPF experiment
The MPF experiments were performed by the YAM-200 MPF press. The dimension of the sheet is identical to that of the FEM. The die surface is a spherical surface of R500 mm as shown in Figure 13(a). During forming, the upper die punch unit is driven by the press downwards, so that the sheet material is gradually bent to fully fit the mold surface. The elastic pad was placed between the die and the sheet. In this work, two experiments were conducted separately when the TA1 layer is put on the upper end (TA1-U) as well as the lower end (TA1-D). The formed parts are shown in Figure 13(c) and (d). After forming, the workpiece was measured by the NDI Procam 3000 3D laser scanner, which is shown in Figure 13(b).
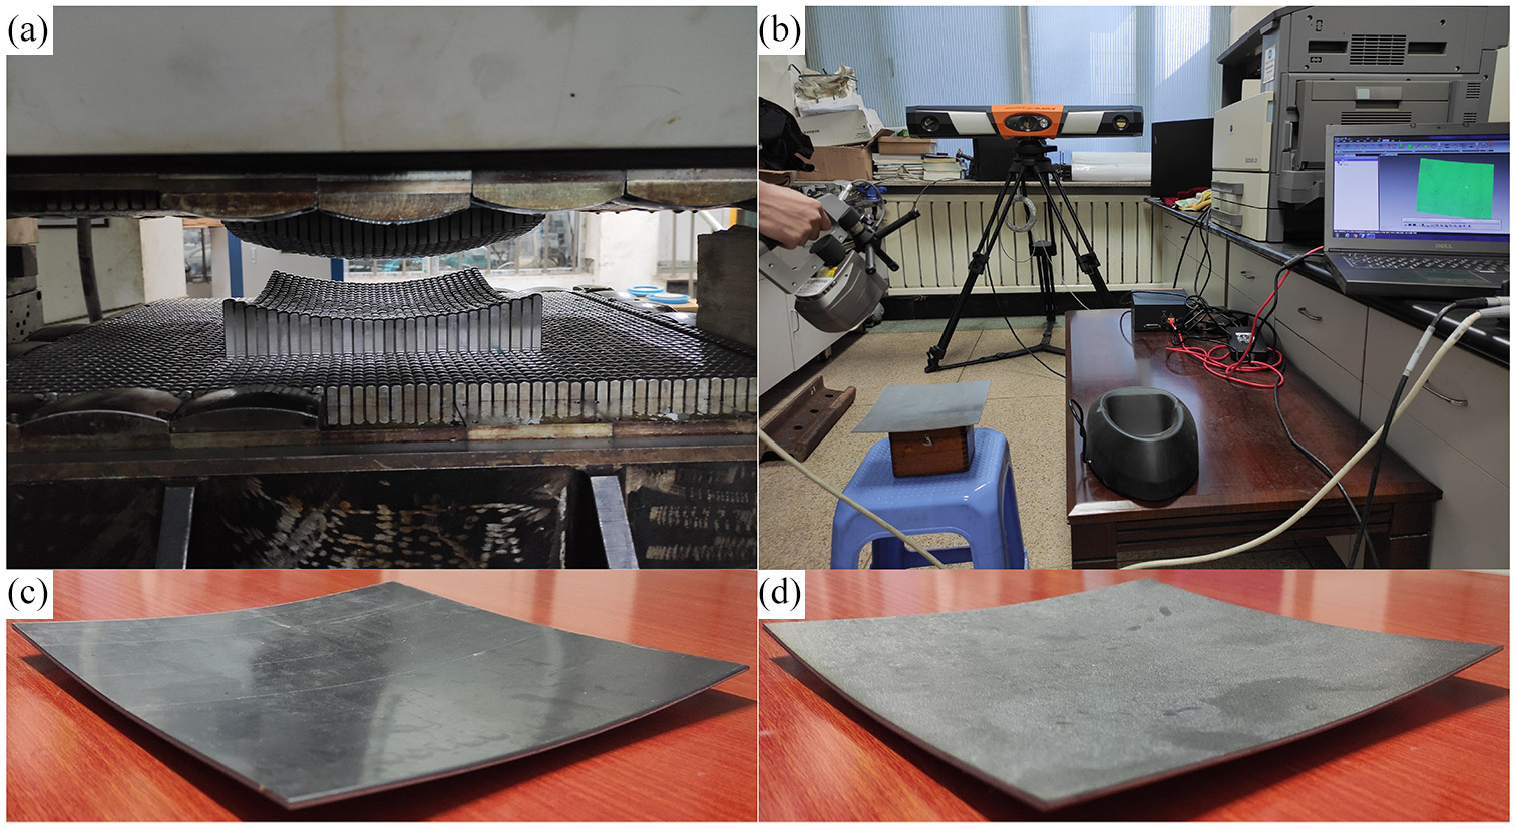
(a) MPD, (b) the 3D laser scanner, (c) the formed TA1-D, and (d) TA1-U part.
Results and discussion
Comparison and verification of TA1-D and TA1-U workpiece
In Figure 14, it shows the displacement distribution in the z-direction of TA1-D and TA1-U part during springback. And the two parts are respectively simulated for isotropic (ISO) and anisotropy (ANI). The shadow in the figure is the outline of the part before springback. The greater the springback, the greater the displacement in the z-direction. It can be seen from the figure that during the springback, the center position of the sheet moves in the negative direction of the z-axis, while the corners move oppositely, which causes the decrease in the curvature and sagitta of the sheet. The magnitude of the displacement legend in the figure can indicates the decrease in sagitta. It is obvious that the springback of TA1-U is greater than that of TA1-D, which is possibly caused by the movement of the neutral layer. Meanwhile, since the elastic strain on the tension side is easier to release than the compression side, the springback effect of the overall laminate is asymmetrical. When SUS430 is under tensile stress, a greater amount of springback can be released, which is because SUS430 has a larger elastic modulus and is more prone to elastic recovery. For both TA1-D and TA1-U part, the springback predicted by ANI model is larger than that by ISO model. For ISO model, the magnitude of the displacement legend of TA1-D part is 3.55 mm while that of the TA1-U part is 4.97 mm. The difference between the two is 1.42 mm. And for ANI model, the magnitude of the displacement legend of TA1-D part is 4.86 mm while that of the TA1-U part is 5.61 mm. The difference between the two is 0.85 mm, which is less than that of ISO model. It may be due to the TCYA of TA1, whose springback under biaxial tensile stress is greater than that of the biaxial compression for R500 mm.
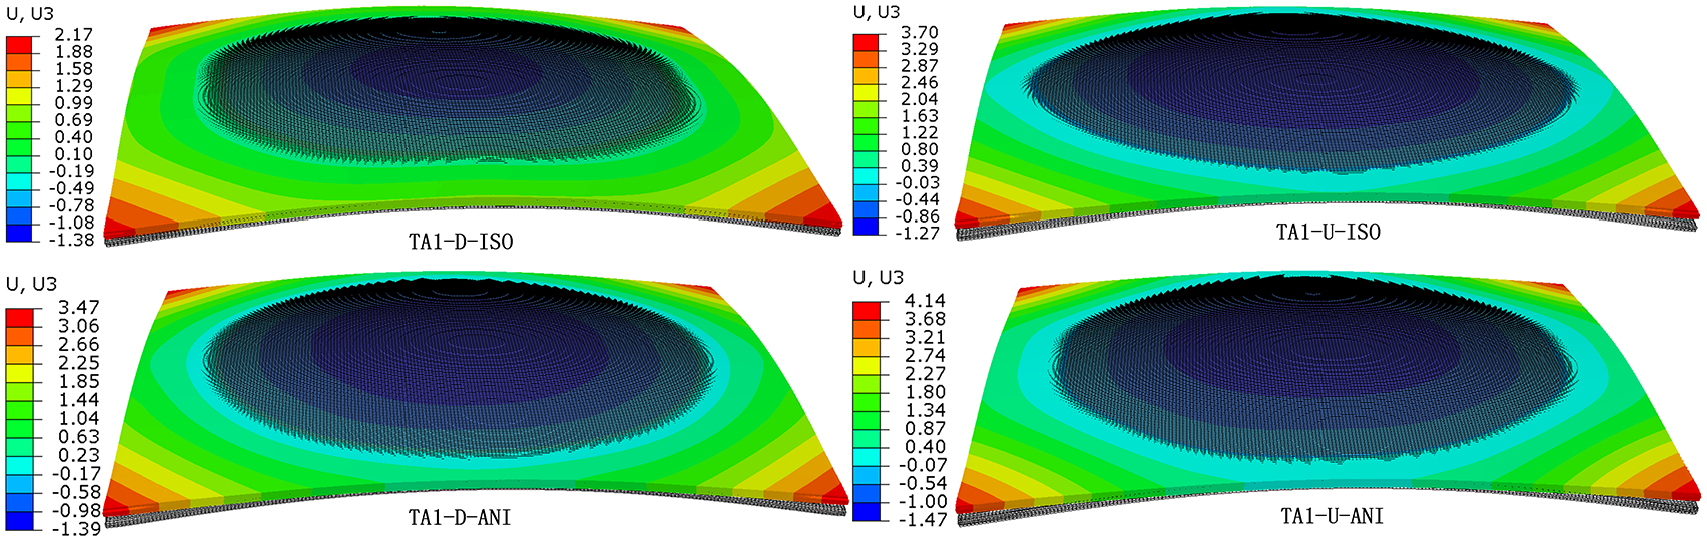
Displacement distribution of TA1-D and TA1-U part in the z-direction during springback.
It compares in Figure 15 the profiles of the formed TA1-D and TA1-U parts between the experiments and the FEM results after springback. The maximum error of sagitta for ISO model is less than 0.292 mm for TA1-D part and does not exceed 0.253 mm for TA1-U part. For ANI model, the maximum error of sagitta is less than 0.200 mm for TA1-D part and 0.187 mm for TA1-U part, which respectively are 68.5% and 73.9% of that of ISO model. As can be seen, for both TA1-D and TA1-U parts, the consistency of the ANI model is better than that of the ISO model. Therefore, the modeling method proposed in this work is proved to be able to effectively predict the springback of SAT laminated sheet.
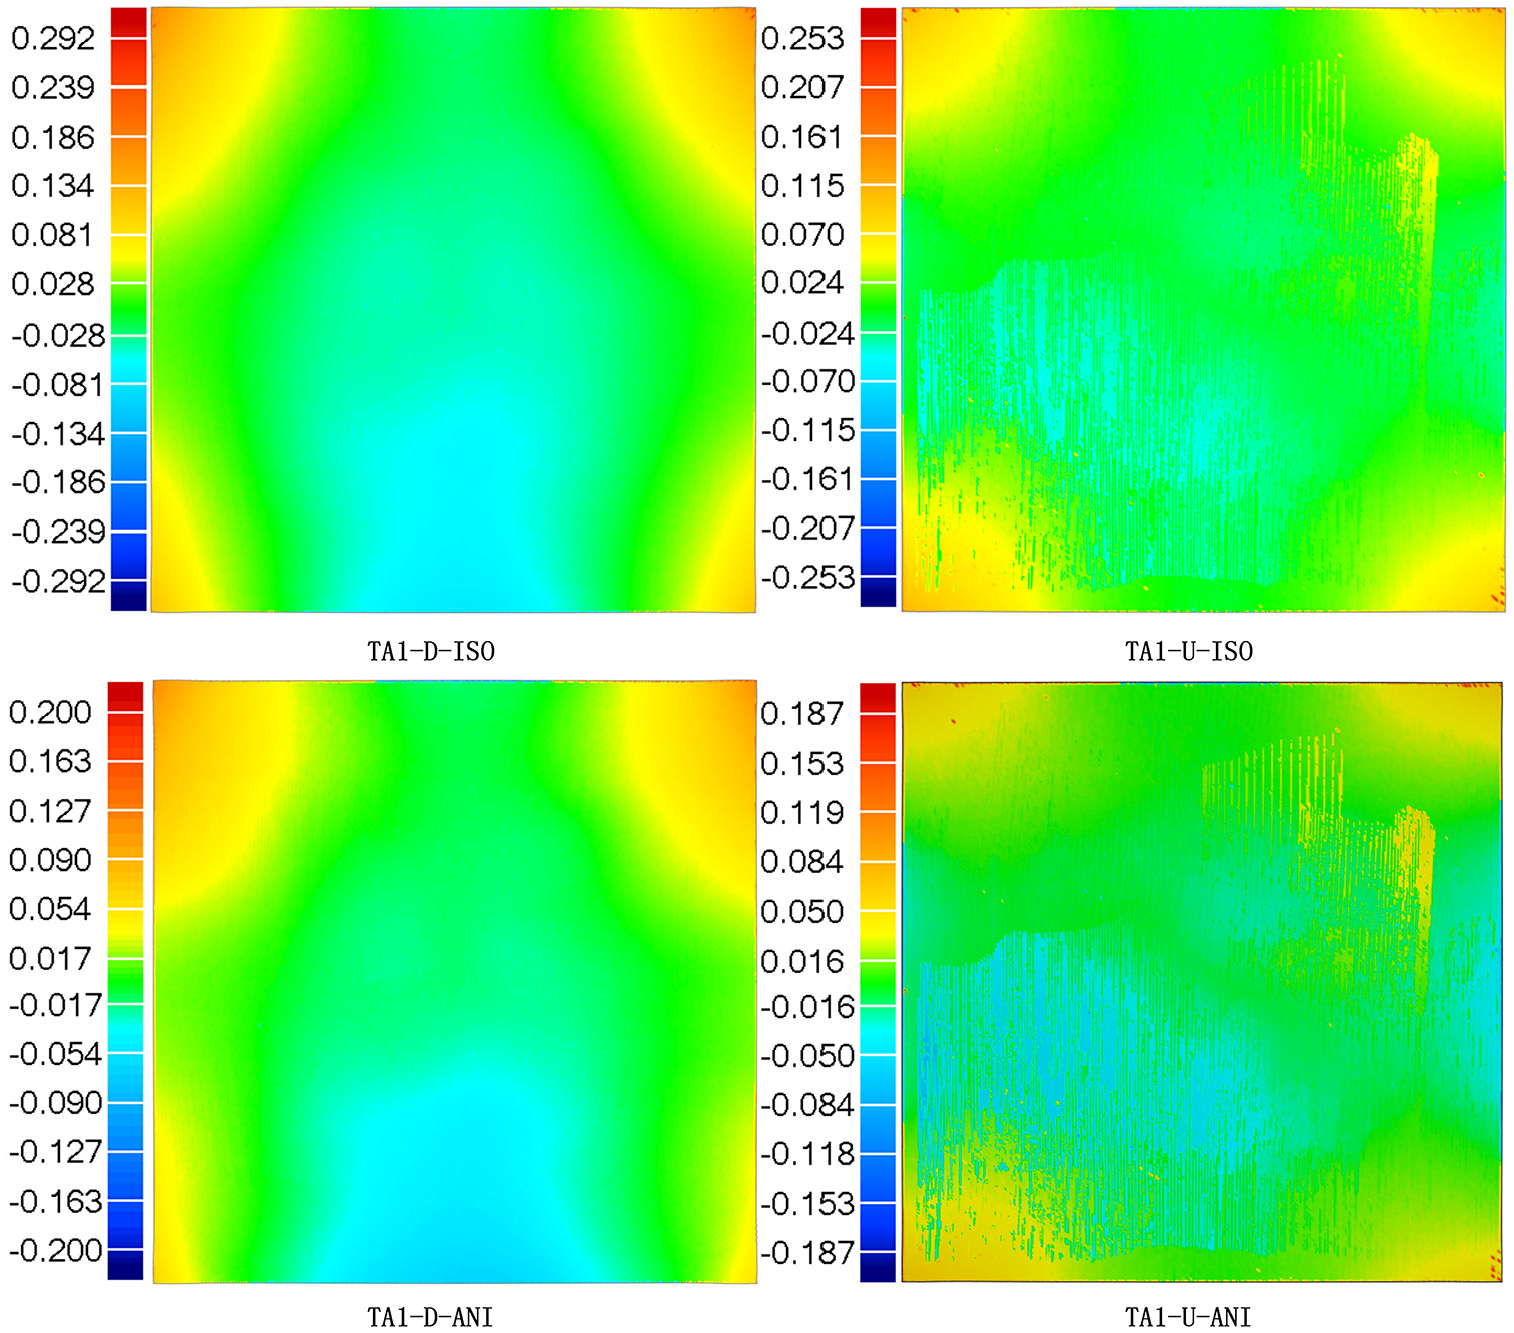
Profile comparison of the formed TA1-D and TA1-U part between experiments and FEM results after springback.
Effect of bending radius on springback
In general, smaller bending radius will result in larger plastic deformation. Figure 16 presents the displacement in the z-direction with varied bending radii during springback. The bending radii in the x-direction and that in the y-direction are identical. As displayed in Figure 16, the displacement versus forming radius apparently indicates the springback rise on the decreasing of plastic deformation. In addition, the springback of TA1-U is greater than that of TA1-D for all bending radii.
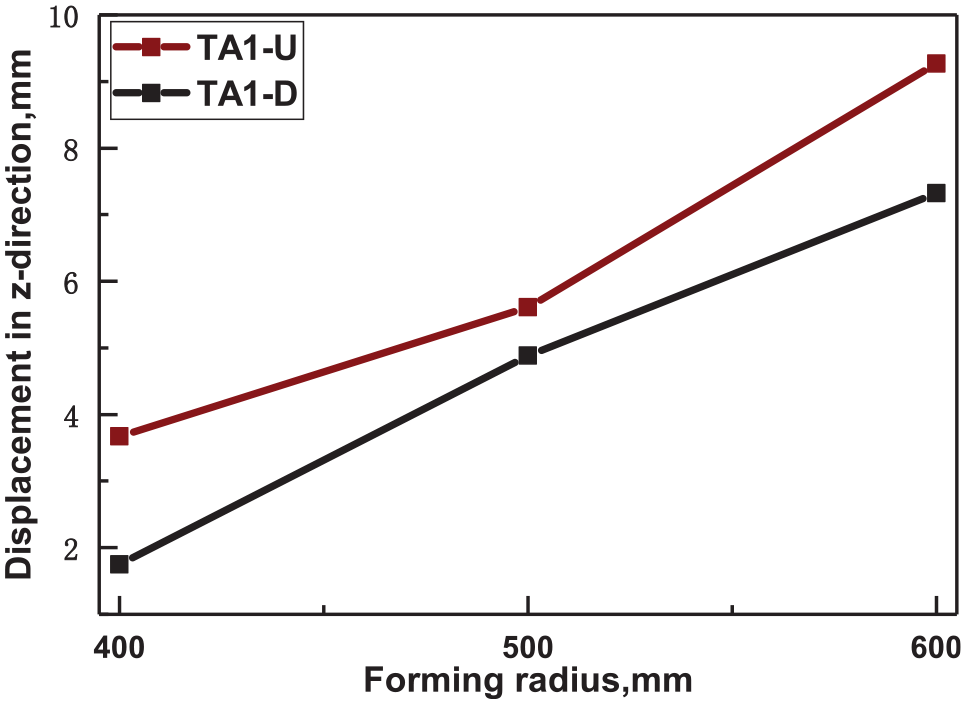
Displacement for different bending radius.
To study the effect of strain path on springback, inconsistent bending radii in the x-direction and the y-direction are also simulated. Two cases are set respectively. One is varied in y-direction when the bending radius fixed at R500 in the x-direction (x500), while the other is varied in x-direction when the radius fixed at R500 in the y-direction (y500). Figure 17 shows the displacement in the z-direction with different bending radii during springback. It can be seen that the springback of y500 is greater than that of x500 for TA1-U, while the case is contrary for TA1-D. This difference is mainly due to the TCYA on the yield surface. Thus, it could be concluded that TCYA has the different effects on springback under various strain paths. It is significant to consider TCYA in FEM.
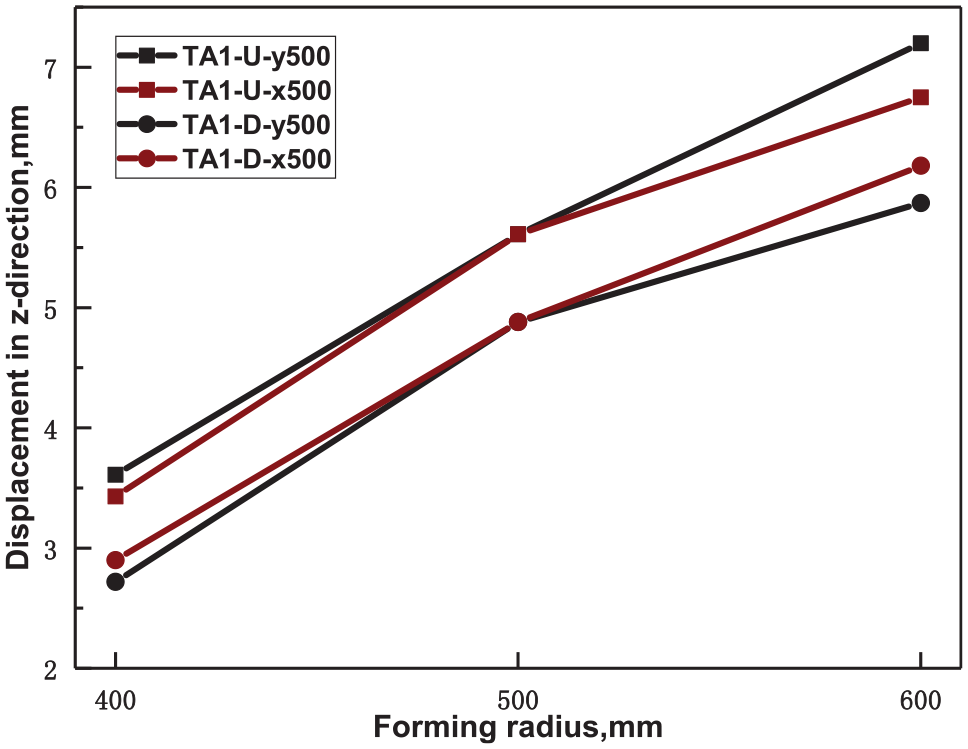
Displacement for bending radius varied in x- and y-direction.
Effect of layer thickness on springback
The corrosion resistance of SAT laminated sheet increases with the thickness of the TA1 layer. If the total thickness of the SAT sheet and the SUS430 layer stay the same, the thickness of the TA1 layer is inversely correlated with that of the AA1050 layer. Therefore, it is necessary to study the effect of different thickness of TA1 and AA1050 layer thickness on springback. In Figure 18, it shows the displacement in the z-direction during springback with varied thickness of AA1050 and TA1 layer. It can be seen from the figure that as the thickness of AA1050 layer increases, the springback becomes smaller for both TA1-U and TA1-D part. When the thickness of the TA1 layer is greater than 0.3 mm, the springback decreases as the thickness of the TA1 layer increases for both TA1-U and TA1-D part. However, when the thickness of the TA1 layer is less than 0.3 mm, the springback of TA1-U and TA1-D show a rising trend with the increase of the thickness of the TA1 layer. The red column in Figure 18 presents the displacement in the z-direction during springback of TA1 layer varied between 0.1 and 0.5 mm. The total thickness of the SAT sheet is constant at 2.5 mm while that of the SUS430 layer is 0.5 mm. The springback becomes larger with the increasing thickness of TA1-U. Nevertheless, the springback displacement decreases when the thickness of TA1 exceeds 0.4 mm, which is because the springback restraint effect of the increase in the thickness of the TA1 layer gradually exceeds the promotion effect of the decrease of the AA1050 layer.
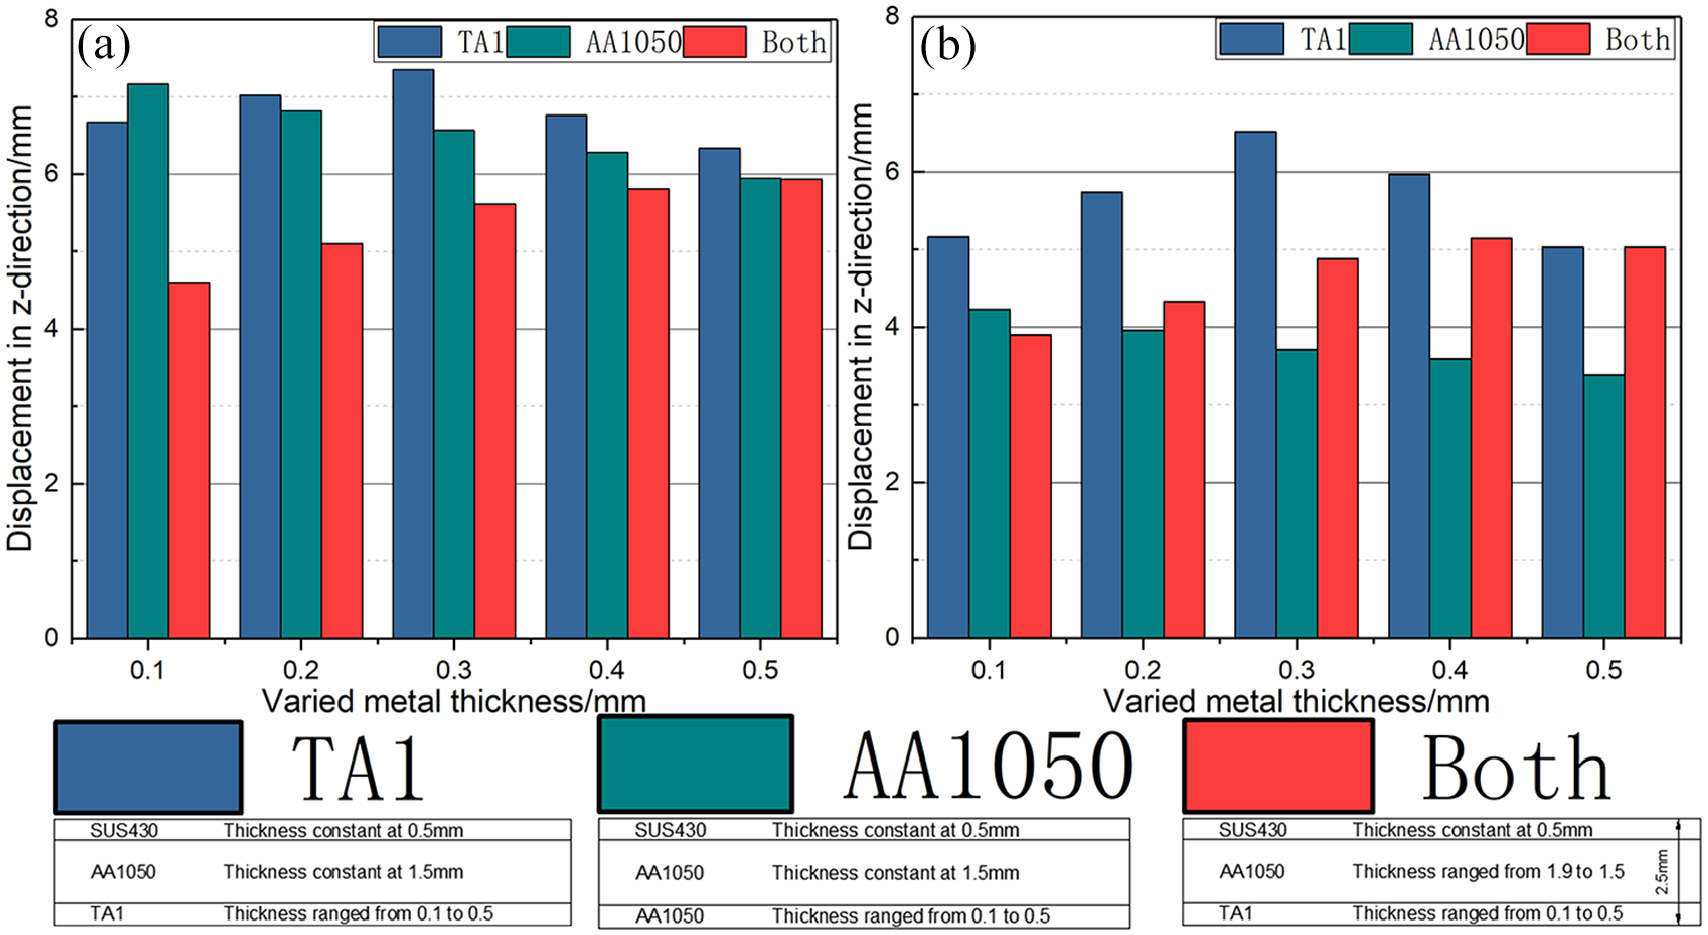
Displacement in the z-direction during springback for varied metal thickness: (a) TA1-U part and (b) TA1-D part.
Conclusions
A new FE model based on CB2004 and Yld2004-18p yield functions has been developed to investigate the bending and the springback behaviors of SAT laminated sheet. CPFEM was verified to capture the anisotropy of the three materials. According to the current study, the following conclusions can be drawn:
CPFEM with consideration of twinning and slip can be used to predict the anisotropy of FCC, BCC materials and the asymmetry of deformation behavior of HCP materials. Therefore, it can be considered as an alternative to uniaxial tension, compression, and biaxial stress experiments to calibrate the orthogonal and non-orthogonal anisotropy yield criterion.
By the layered method based on phenomenological yield functions to model the bending process of SAT laminated sheet, the abnormal behavior of springback caused by material anisotropy can be captured. And it is found from the comparison of experimental and simulation results that the springback predicted by the proposed model is more accurately than that by the isotropy model.
The springback of laminate sheet is significantly influenced by the elastic modulus, the bending radius, and the thickness of the metal layer. When the metal layer with larger elastic modulus is under tensile stress, the springback is more obvious. In addition, the smaller the bending radius and the thicker the metal, the smaller the springback.
Footnotes
Appendix
Declaration of conflicting interests
The author(s) declared no potential conflicts of interest with respect to the research, authorship, and/or publication of this article.
Funding
The author(s) received no financial support for the research, authorship, and/or publication of this article.