
Abstract
The numerical simulation of the post-weld shot peening (SP) process was performed to analyze the influence of various SP parameters on the final induced compressive residual stress (CRS). Firstly, the welding process was simulated based on the Finite Element Method (FEM) using ABAQUS CAE and FORTRAN user subroutine code, from which the initial welding-induced tensile residual stresses (TRS) were obtained. The FE model was validated using the results obtained from the TIG welding of the aluminum 2219 alloy (AA 2219) plate. Then, the post-weld SP process was numerically simulated using the combined discrete and finite element methods (DEM-FEM). The computed CRS from the simulation was compared with the experimentally measured outcome to validate the DEM-FEM model, and good agreement was observed from the compared results. Finally, the post-weld SP model was applied to extensively analyze the influence of the various SP parameters related to the peening media and target material on the final CRS.
Keywords
Introduction
Welding is one of the various manufacturing processes that produce high detrimental tensile residual stress (TRS) on metallic components,1,2 which have adverse effects on their fatigue strength, corrosion resistance, and leads to cracking as well as distortion during the subsequent manufacturing processes. 3 Relaxing these stresses is necessary to avoid failure acceleration when external tensile loads are applied. The post-weld Shot Peening (SP) treatment has been adopted by many manufacturing industries such as aerospace, heavy equipment, automobile, etc. as one of the reliable, easy, and cost-effective techniques for enhancing the mechanical performance of the as-weld parts.3–5 The SP treatment improves the resistance of parts to failures due to fatigue, stress corrosion, and hydrogen assisted cracking, etc. 6 After the SP treatment, a continuous beneficial compressive layer is developed on the component’s surface, which replaces the detrimental TRS layer. Hence, the failure acceleration that typically occurs due to the welding RS is avoided, and fragile areas are repaired. Also, the reliability of the component is enhanced because cracks will not initiate or propagate in a compressively stressed region; this enables the part to achieve its maximum potential. In addition to enhancing the fatigue characteristics of the part, 7 complex shapes on thin metallic materials such as aerodynamic curvatures of aircraft’s parts can be produced using SP.
During the SP, each impacted particle acts like a very small peen hammer, this results in the formation of concave depressions (dimples) on the treated surface, which produces a high CRS at the indents’ vicinities. The energy used in firing the shots is delivered via a centrifugal force from a wheel or pneumatic pressure. 8 The magnitude and distribution of the final CRS induced by the SP are significantly dependent on the process parameters, that is, shot density, shot velocity, shot shape and material, shot size, angle of impact, nozzle geometry, and size, etc.9,10 At times, costly experimental approaches are used to select the best parameters to be adopted for any particular base material. This technique requires the treatment of many samples using different SP parameters, then fatigue examination is performed, from which the most resilient to fatigue is selected as a reference. However, a feasible and accurate numerical approach can provide a much more cost-effective, less time-consuming, and versatile analysis of the required SP process parameters.
The most commonly used numerical approach for simulating the SP process is the FEM, Wu et al.
11
analyzed the CRS induced by SP on the AISI 304 stainless steel using the FEM by considering the effects of mesh density and friction coefficient. The optimized surface characteristics were obtained using the friction coefficient of 0.2 and element size of about
Furthermore, the concave indent produced by any shot in the actual SP is very small, which is dependent on the media size. To properly model the target region using the FEM, finer elements are required to be assigned so that the variation of the CRS in the indentation zones can be accurately captured. This leads to the generation of a huge number of elements when modeling a larger target area, which significantly increases computation time, as well as the complexity of the model. Therefore, a numerical method with the capability of simulating the multiple random shots impact, as well as effectively including shot-shot interactions as in the real SP is presented. The modeling and simulation were performed using the combination of discrete and finite element methods (DEM-FEM) in ABAQUS. In this approach, impact friction, strain-rate variation, and complex material models can be accommodated. Also, the mesh of the target region can be adjusted to minimize the simulation duration, which does not have a significant effect on the induced CRS. The final CRS is computed based on the impacted multiple random shots, whereby the strain-hardening of the positions being stroke more than once during the process is captured. This adopted approach explores the capability of the two numerical tools (FEM and DEM) to accurately computes the CRS induced by SP. The technique possesses some advantages over using the FEM alone to compute the CRS induced by the post-weld SP. The method is capable of effectively and accurately modeling the interaction between numerous particles (shot–shot), as well as the interaction of the particles and base material (shot–target) as in the actual SP. Hence, the CRS is calculated based on the multiple shot impacted particles, which corresponds with the actual SP process.
Some researchers have successfully employed the use of the combined discrete and finite element methods to simulate the SP process. Bhuvaraghan et al. 20 analyzed the resulting CRS induced by SP of IN718 using the coupled DEM-FEM and FEM alone, they used the EDEM to model the DEM. Process parameter optimization was performed by Murugaratnam et al. 10 whereby the combined DEM-FEM was applied to simulate the SP according to the rigid body dynamics. Also, the DEM was used to analyze shot-target and shot-shot interactions extensively by Bhuvaraghan et al., 21 Hong et al., 22 and Han et al. 23 in which both the base material surface and media were assumed to be rigid bodies.
However, none of the reported literature considered the effect of the initial RS produced from the previous manufacturing process. Also, there are limited reports on the SP models with numerous random shots impacting the base material, which results in the final induced CRS. Furthermore, other parameters that can influence the final CRS such as the strain-hardening of the position being stroke more than once during the SP process are commonly neglected. Hence, all the aforementioned are significantly taken into account in this work. The final CRS induced by the post-weld SP is dependent on many parameters related to the base material and peening media. It is essential to determine the optimum parameters that can produce higher CRS and deeper compressive layer, which can effectively nullify the induced welding RS. In this paper, the combined DEM-FEM is implemented to analyze the CRS produced by SP on the as-weld AA 2219 plate. The welding RS computed from FE simulation was applied to the base material as predefined stress in the SP model. The post-weld SP was simulated based on the elastic-plastic and Johnson-Cook material model. The numerical model was validated by comparing the simulation results with the measured outcomes. Finally, the influence of shots size, base material model, friction coefficient, and impact angle on the final CRS was analyzed.
Experimental procedure
In this work, SP was performed experimentally to relieve the RS induced by the two-pass TIG welding of the AA 2219 plate. The surface of the as-weld specimen was treated by SP, in which a beneficial CRS is produced on the specimen, which replaces the detrimental TRS, and enhances the fatigue strength of the sample.
Welding experiment
Two AA 2219 (Al–Cu–Mn) plates with approximate dimensions of 300 mm × 150 mm × 6 mm were joined to form a single as-weld part. The weld joint was manufactured using two-pass TIG welding with filler material ER70S-6 (Ø 1.6 mm). The average heat deposited during the first and second passes are 0.646 and 0.600 kJ/mm, respectively. The induced transverse and longitudinal RS on the as-weld plate were measured using the X-ray diffractometer (XRD) (Xstress 3000 G2/G2R, X-ray Stress Analyzer) manufactured by Stresstech Oy, Tikkutehtaantie 1, 40800 VAAJAKOSKI, Finland. The as-weld AA 2219 specimen is presented in Figure 1.
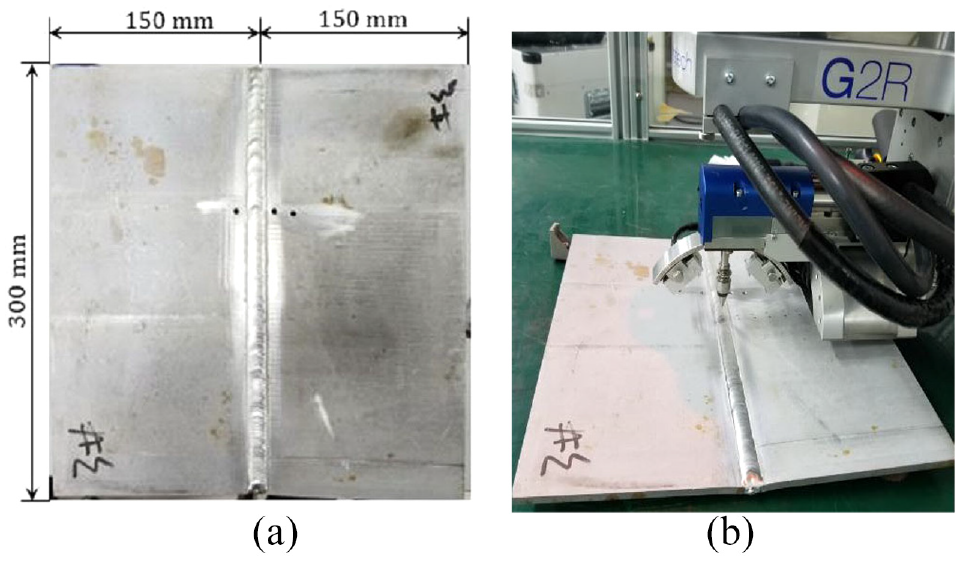
(a) As-weld AA 2219 plate and (b) residual stress measurement using the XRD.
Moreover, the welding process was numerically simulated based on the thermo-elastic-plastic (TEP) approach using ABAQUS and DFLUX user subroutine code via FORTRAN. The RS map obtained from the numerical simulation is shown in Figure 2(a). The FE model was validated using the experimentally measured temperature and RS. The temperature history was measured using the thermocouples attached at the specified positions away from the weld centerline (WCL), which corresponds with the position assigned on the FE model. The welding-induced transverse and longitudinal RS were examined experimentally using the X-ray diffraction technique (XRD) and were compared with the simulated stress profiles as shown in Figure 2(b) and (c), respectively. The induced RS obtained from the welding simulation was used as the initial RS in the post-weld SP model.
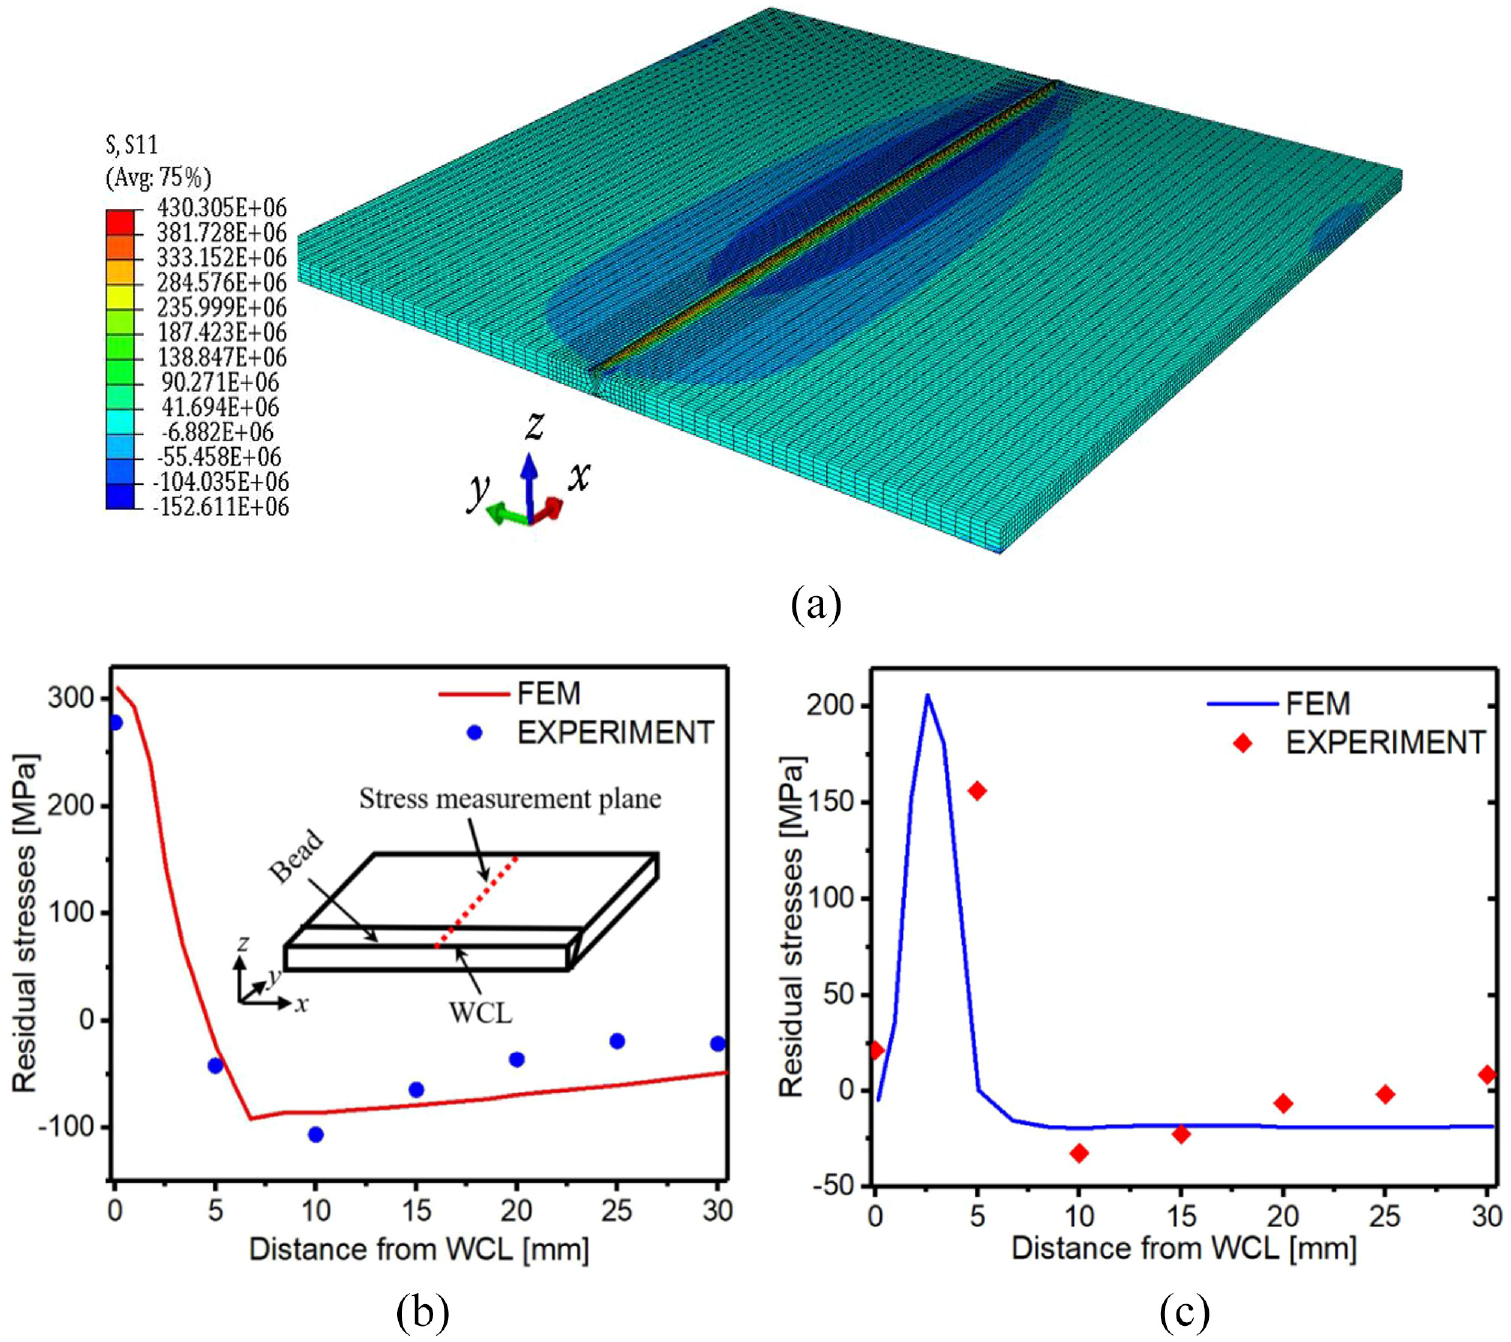
Induced welding residual stress: (a) stress map, (b) longitudinal residual stress (S11), and (c) transverse residual stress (S22).
It can be observed from Figure 2(b) that, significantly high tensile RS is induced on the material along the WCL, which can lead to component failure when subjected to external tensile load. Also, other problems associated with the TRS such as crack initiation and propagation at ambient temperature, brittle fracture, failure acceleration as well as fatigue cracks can occur, which adversely affects the mechanical performance of the as-weld parts. Hence, relaxing the RS becomes compulsory to enhance the reliability of the specimen under service conditions.
Post-weld SP experiment
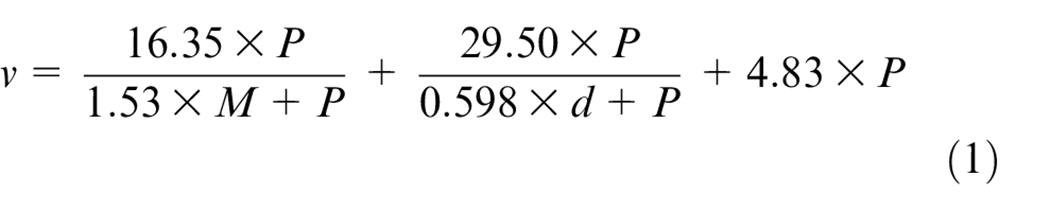
The as-weld specimen was shot-peened to relax the detrimental TRS induced on the material during welding. The post-weld SP treatment produces a beneficial compressive layer, which replaces the TRS on the surface of the specimen, and balances the core TRS by forming equilibrium with the surface CRS. Thus, enhancing the fatigue performance of the specimen. The experiment was conducted using a typical SP machine energized by pneumatic air pressure, in which 4.5 bar was used for the peening process. The peening particles were fired at an average mass flow rate of 2.5 kg/min. The cast steel shots of size 0.4 mm in diameter were used. A selected area of approximate dimension 50 mm × 50 mm on the specimen’s surface was shot-peened to almost 100% coverage. The weld zone and its vicinity were chosen as the target area for the SP due to the presence of peak TRS. The impact speed of the shots was calculated using equation (1) presented by Wu et al. 11 which relates the average speed of the peening particles v (m/s) as a function of the SP pressure P (bar), the mass flow rate of the shots M (kg/min), and shot’s diameter d (mm).
The average speed of the shots was calculated by substituting the process parameters used in the experiment, whereby v was determined to be 58.58 m/s. The XRD was used to analyze the induced CRS. The Cr tube was used and the exposure time of 8 s was considered for calibration. The collimator tube of 3 mm diameter was used, which is at a distance of 10.39 mm from the workpiece surface. The rotation and tilt angles of (0°–90°) and (−45° to 45°) were used, respectively. The number of tilt (5/5), as well as the number of rotations (2), were also applied. To enable the characterization of the stresses in the subsurface region of the as-peened specimen, the positions to be examined were electrolytically polished to a specified depth (0.01, 0.02, 0.05, 0.1, and 0.2 mm). Then the XRD measurement was carried out, and the obtained results were compared with the simulated to validate the DEM-FEM SP model. The XRD was used to measure the resulting stresses after the SP treatment, in which the Cr tube was used, while the exposure time of 8 s was applied for calibration. The Collimator tube of diameter 3 mm was used, and its distance from the workpiece surface is 10.39 mm. Due to the limitation of this method in measuring the deeper subsurface region of the material, only the near-surface regions of the through-thickness were examined, each at the exposure time of 10 s. The shot-peened surface is shown in Figure 3.
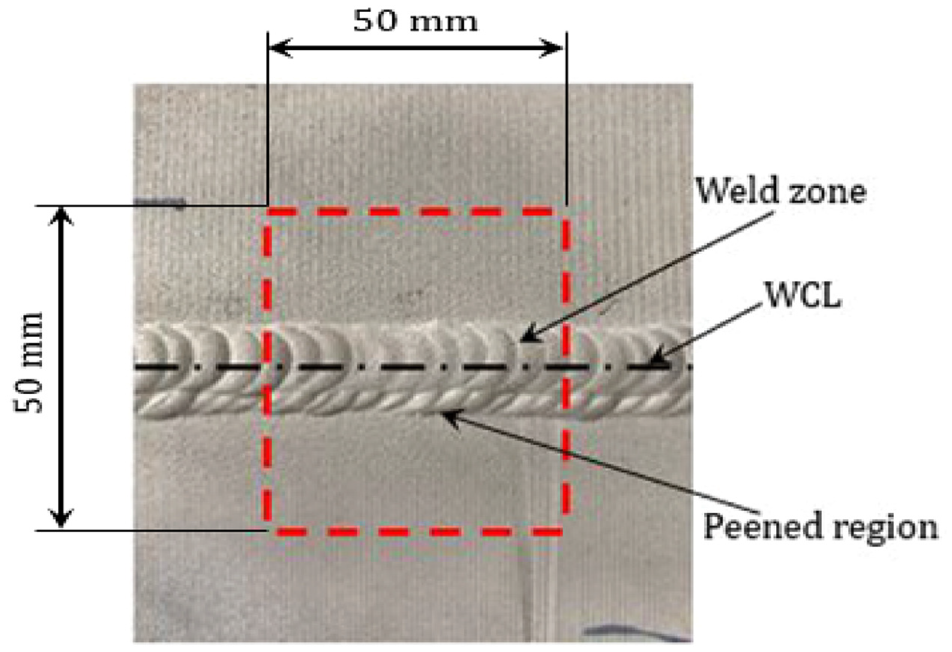
Shot-peened surface.
Modeling of the post-weld SP process using the combined DEM-FEM
A feasible and valid numerical approach was implemented by coupling the DEM and FEM via code in ABAQUS to simulate the SP process, which provides room for much extensive analysis of the resulting CRS.
Material modeling
In this paper, two different material models (Elastic-plastic and Johnson-Cook) were used to simulate the SP process using the combined DEM-FEM approach. The elastic-plastic and Johnson-Cook’s plasticity model were simulated independently to determine the material model that produces the CRS profile that is much closer to the experimental results, which can be adopted in the future. Hence, the induced RS obtained from the post-weld SP simulation based on the elastic-plastic and Johnson-Cook’s material models were compared with the measured outcomes in the model’s validation. The applied constitutive models are briefly described below.
Elastic-plastic material model
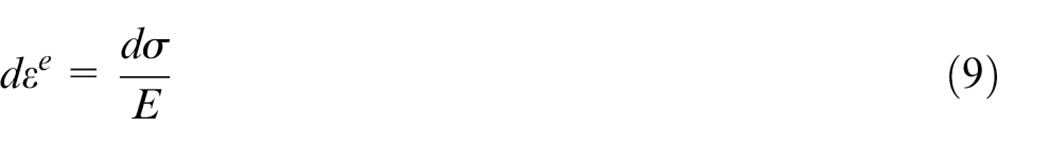
The elastic-plastic model describes the material’s behavior where the applied stress exceeds the yield point. Its basic characteristics include the ability to capture the loading and unloading stress-strain relations, as well as the condition of the multi-axial stress corresponding to the beginning of the plastic deformation (yield Criterion). Based on this, the target material (AA 2219) is modeled as isotropic, elastic-plastic with isotropic hardening, and strain-rate dependent properties. For this implemented material model, the response of the material to the applied SP stress is characterized based on elastic and plastic behaviors. The elastic deformation occurs at the region where the applied SP stress

Where

For the rate-insensitive plastic deformation, the relationship between the stress increment with the corresponding elastic strain increment is of linear form in the plastic region, it can express as shown below (equation (4)):

In which:
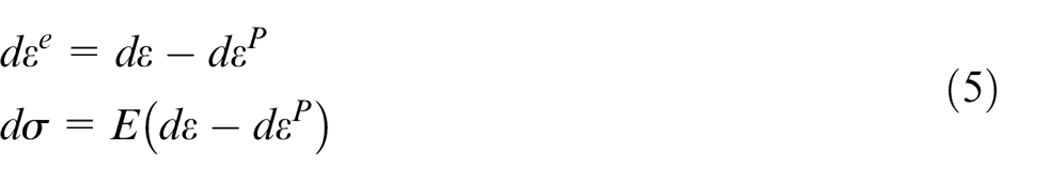
The elastic and plastic regions are differentiated by the yield point (at applied stress =

Where k represents the hardening parameter. Usually, the plastic strain
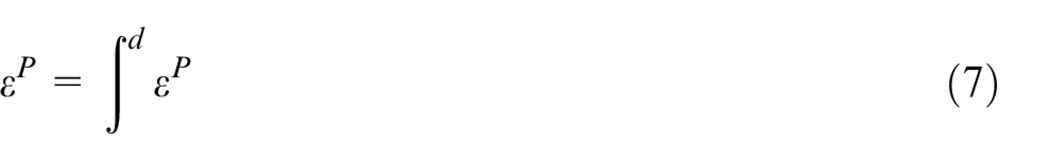
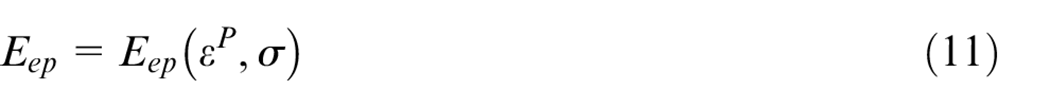
By applying the strain decomposition in equations (3) and (7), and considering the elasto-plastic modulus formed at the plastic region,
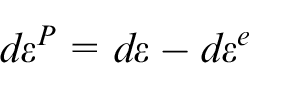
In which:
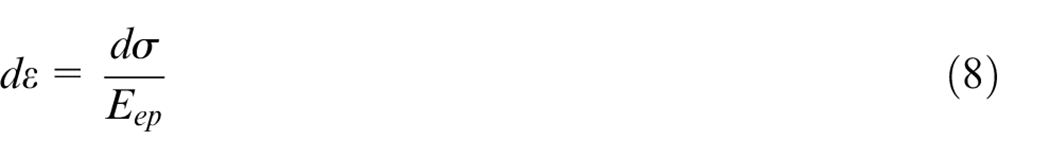
Therefore,
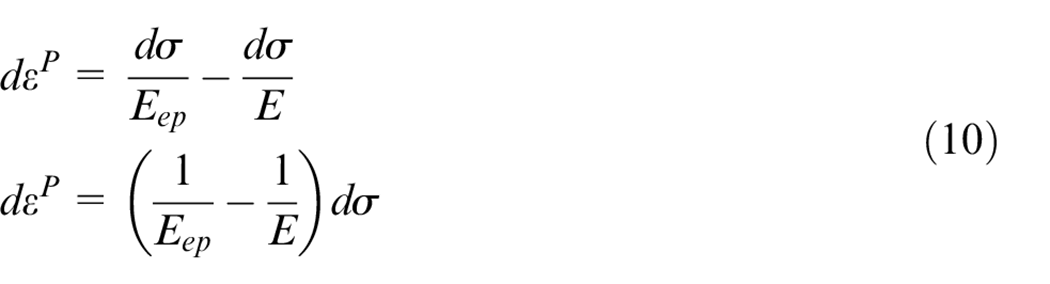
Whereby the elasto-plastic modulus is considered to be the function of plastic strain and stress.
Johnson-Cook material model
Basically, the Johnson-Cook constitutive model is a plasticity model used for computing material flow stresses as a function of strain hardening, strain-rate hardening, and thermal softening during deformation.27,28 In the SP process, the impact of the shots takes place within a very short period, so the model considers the effect of strain rate on the material’s response to the applied irregular cyclic loading. In this case, the target (AA 2219) is modeled as Johnson-Cook plasticity-based material model with rate dependent. The model expresses the equivalent yield stress
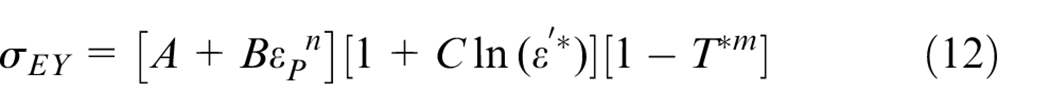
Where
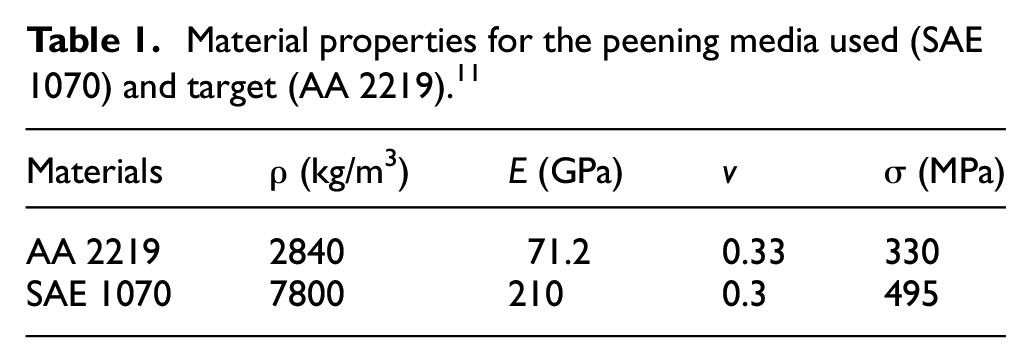
Material properties for the peening media used (SAE 1070) and target (AA 2219). 11
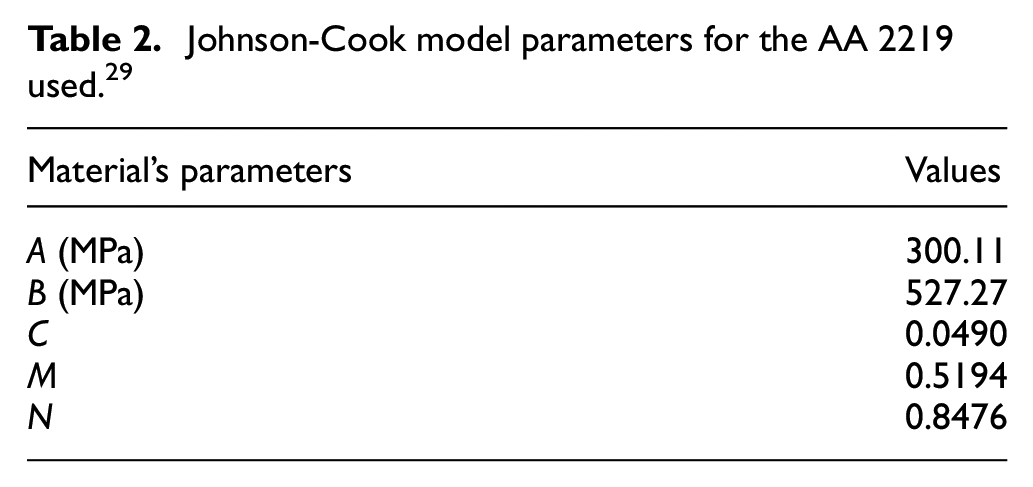
Johnson-Cook model parameters for the AA 2219 used. 29
Dynamic explicit simulation of the post-weld SP
The numerical modeling of the SP process is a bit difficult as it involves impacting the target surface with multiple random shots at a specified flow rate, which is time-dependent. Also, amongst the complexity of the process is the correct formulation of the shot-shot interaction behavior to depict the actual SP process, which is a significant phenomenon during the process, as it affects the final CRS. Additionally, modeling multiple random shots has been one of the problems associated with the commonly used FEM. Hence, these difficulties have been resolved by coupling the FEM and DEM to simulate the process, as illustrated in Figure 4, which portrays the actual process.
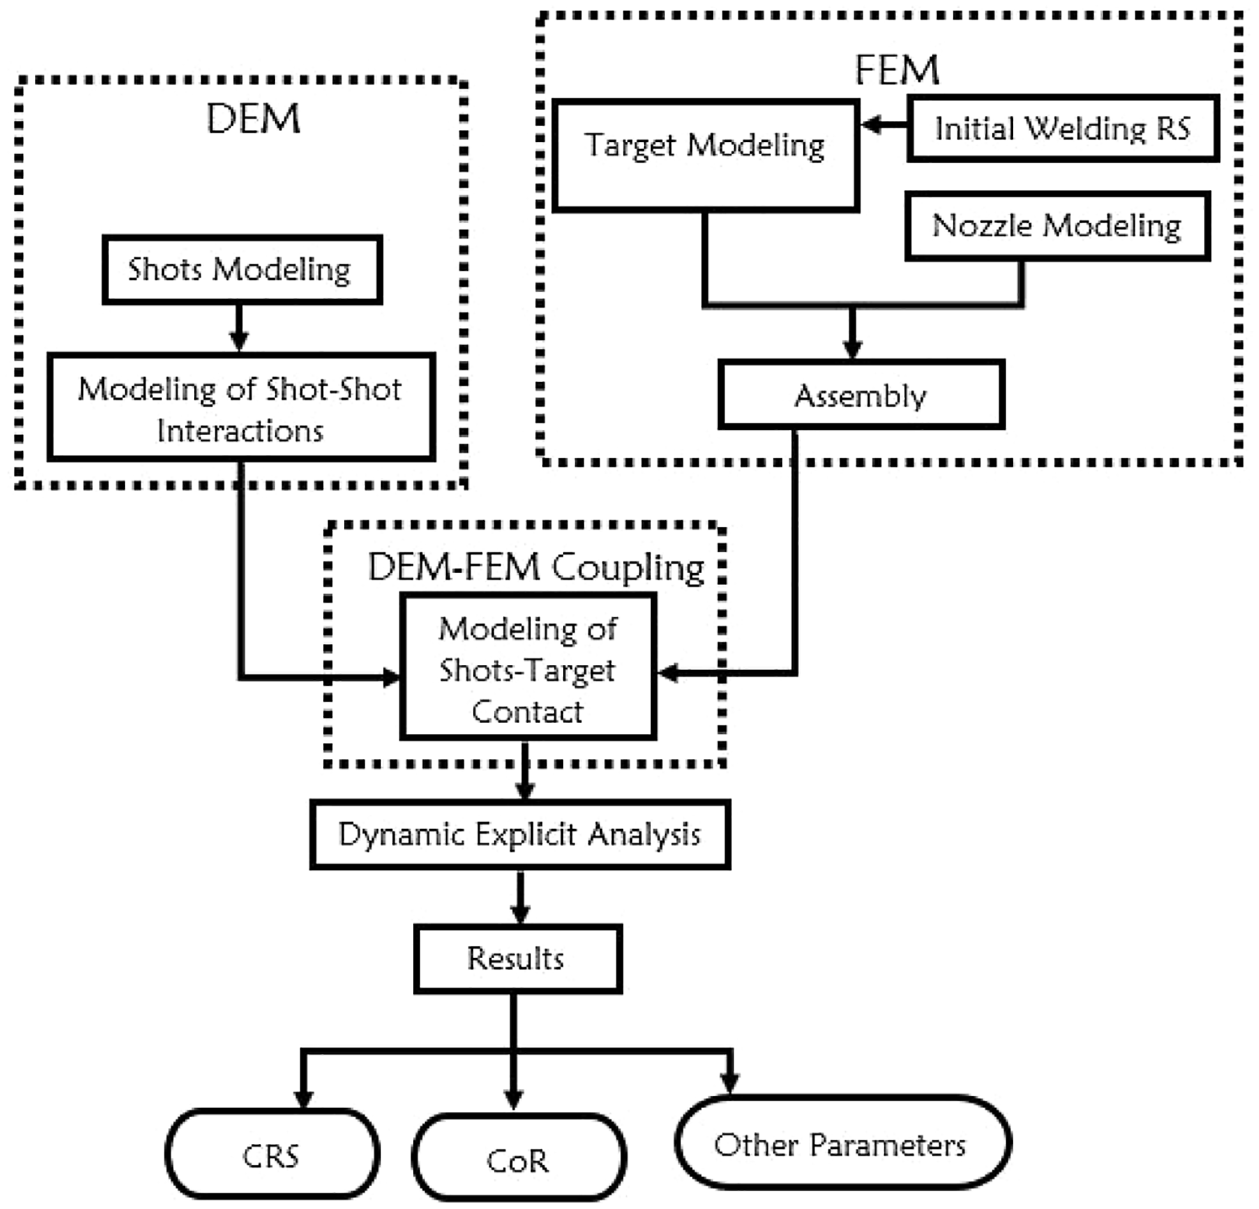
Coupling process of the DEM-FEM.
In this approach, the DEM code is used to generate multiple random shots of a specified radius at a certain impact velocity. The shots were designed as solid, rigid objects via DEM. While the target of 40 mm × 20 mm × 6 mm dimension is designed as a solid deformable part together with the nozzle of diameter 13 mm using the FEM. Also, the width of the weld zone is 13 mm, which corresponds with the nozzle diameter, so that the area to be impacted on the weld zone can be fully covered. The peening particles are fired from the nozzle inlet, which is set perpendicularly opposite to the target surface, as illustrated in Figure 5. The induced welding RS was added to the target as predefined stress. The presence of the peak TRS at the FZ and its vicinity makes it the most vulnerable region of the as-weld part, as such it was considered as the target area for the SP in the numerical model, which corresponds with the experiment.
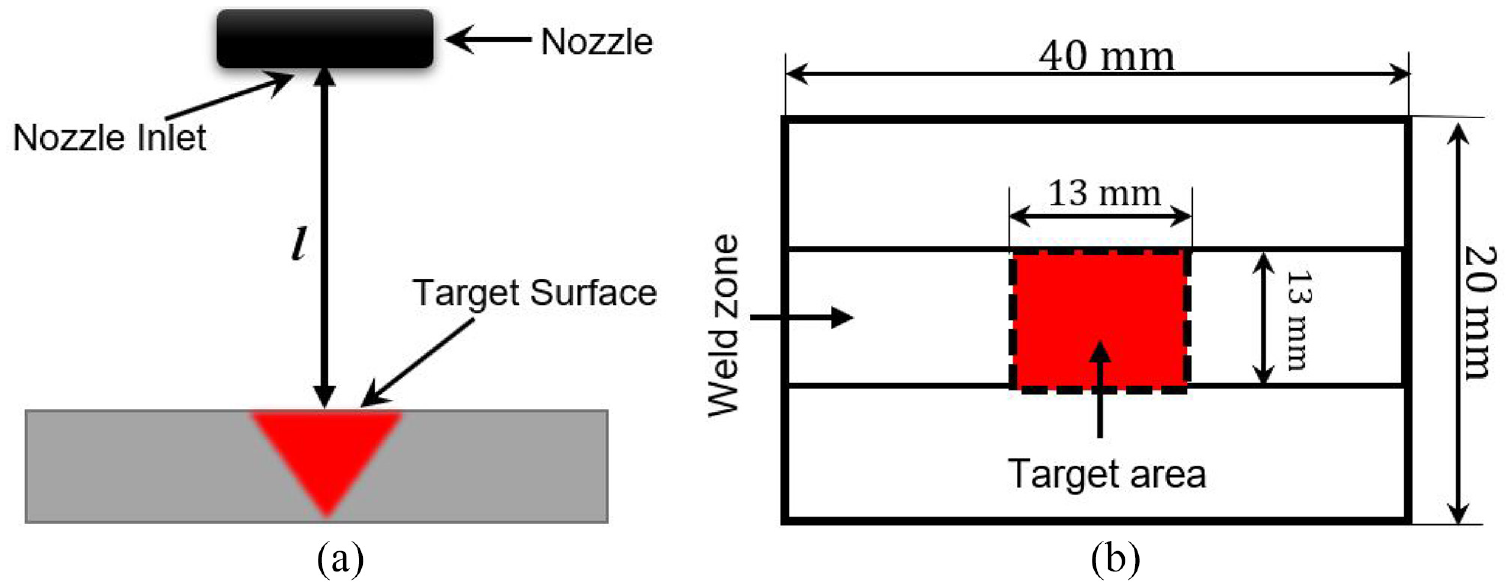
Description of the SP model: (a) nozzle and target surface and (b) plate dimension and target area.
For the FE-based model, the three-dimensional-stress (3D-stress) of the type linear hexahedral elements (Hex C3D8T) were assigned to both the base material and nozzle. The target area to be shot-peened was fine-meshed to accurately capture the stress distribution in all directions. For the DEM-based shots, each peening particle is modeled as a rigid sphere of specified radius, with displacement and rotational degree of freedom, which are generated as single-node elements of the type PD3D. A total of 1,399,680 elements associated with 1,459,759 nodes were generated on the whole base material. While coarse mesh containing four elements and 18 nodes are assigned to the nozzle, which is big enough to allow the insertion of the peening particles. Figure 6 shows the three-dimensional FE and DE mesh.

Three-dimensional discrete and finite element mesh.
Contact formulation
In modeling the SP process using the coupled DEM-FEM approach, contact is one of the most essential parameters. The behavior of shot-target contact, as well as shot-shot contact, must be accurately formulated. They are the primary mechanisms for inducing the final CRS on the target. The normal and tangential contact behaviors between the target surface and peening particles were specified in the general contact, in which the friction coefficient was defined. The general contact was used to explicitly include all the interacting surfaces using contact inclusions. The shot-shot contact behavior was established based on the Hertz contact model, and the particles are specified as element-based surfaces. As expressed by the Hertz contact model, the contact force
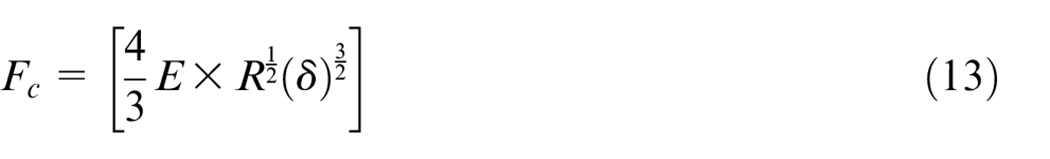
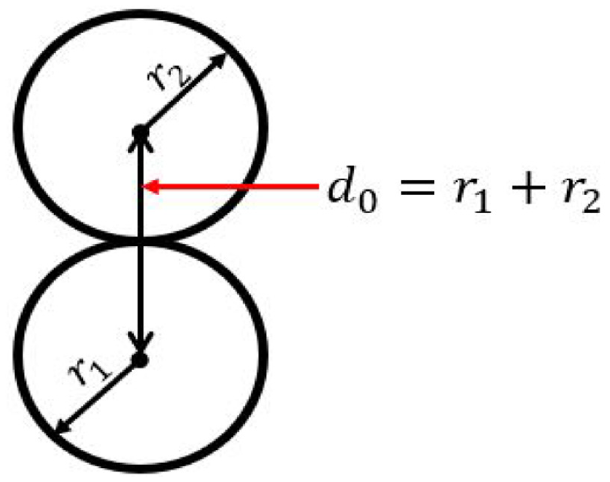
Shot-shot contact model.
In which:
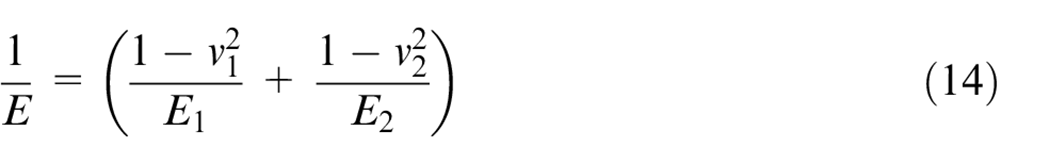
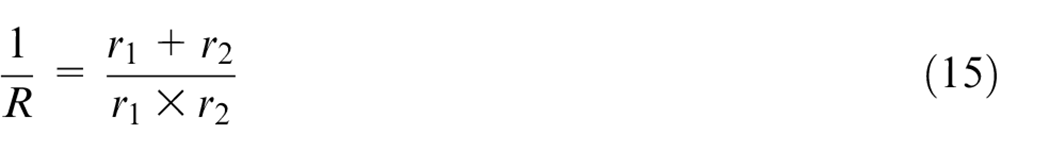
Where
Results and discussions
Model validation
The DEM-FEM SP model was validated using the post-weld SP experiment presented earlier. The same base material (AA 2219), impact angle (90°), as well as impact velocity (58.82 m/s) used in the experiment, were applied to the numerical model. The elasto-plastic material model was used in the simulation, and the induced CRS was computed based on the multiple shots impact. The simulation results show good agreement with the experimental as presented in Figure 8. This illustrates the accuracy and feasibility of the computational approach used. Hence, the numerical model was applied to extensively investigate the influence of some SP parameters that can affect the final CRS.
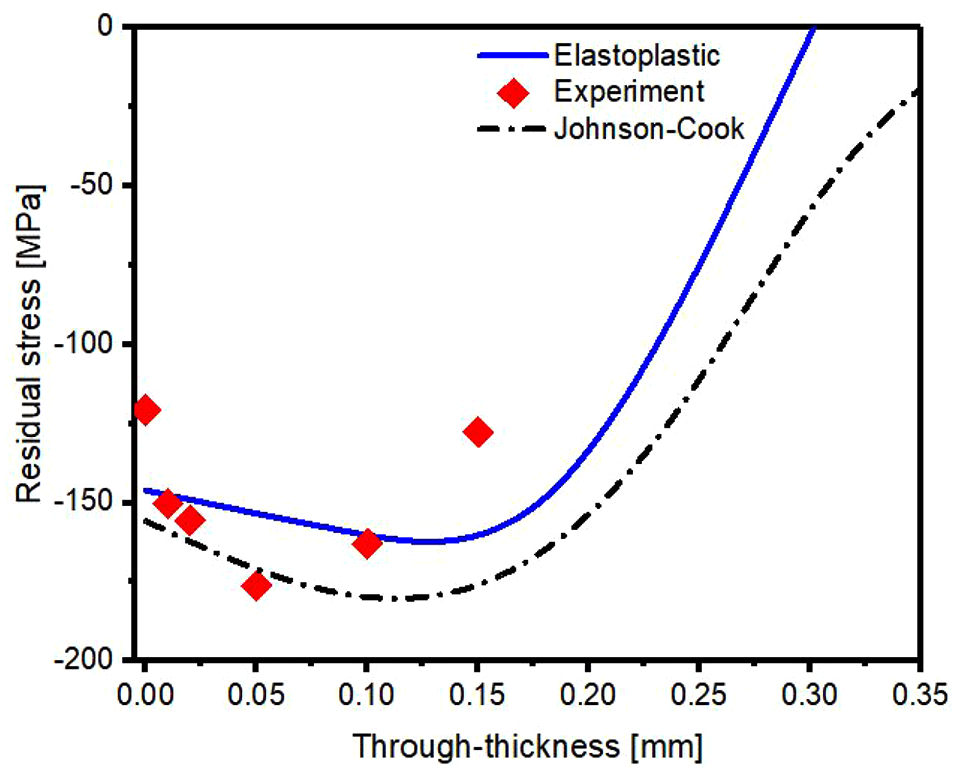
Compared experimental and simulation results.
Influence of shots and base material parameters on the final CRS
Influence of shot diameter on the CRS
To analyze the influence of shot diameter on the final CRS distribution, as well as the depth of the compressively stressed area produced, five cases with different shot diameters were simulated. The shot peening media of 0.2, 0.4, 0.6, 0.8, and 1 mm diameter were used. The impact speed of 60 m/s at a 90° angle of impact was used in all cases. The maps and residual stress profiles are presented in Figure 9. The induced residual stress was extracted from the regions that have not been strain-hardened by multiple impacts on the same position. Significantly high surface CRS were induced in all the five cases simulated, in which the 1 mm diameter produces the highest surface CRS of −232.245 MPa. The shot size alone does not have a significant influence on the magnitude of the surface CRS, but multiple impacts on the position do. As presented in Figure 9(f), the magnitude of the subsurface CRS increases with an increase in the shot diameter. Also, the depth of the compressive region, as well as the size of indents produced, are dependent on the shot diameter, an increase in the shot size results in a significant increase in the thickness of the compressive layer. This is due to deeper penetration caused by the larger diameter particle. The distribution of the subsurface stress changes when the shot size varies. The 1 mm diameter shots induce the highest subsurface longitudinal CRS of −428.805 MPa at 0.86 mm through-thickness depth, which reduces continuously as the shot diameter decreases. Also, the smallest shots (0.2 mm diameter) produce the least subsurface CRS of −264.398 MPa at 0.097 mm through-thickness depth. The magnitude of the induced CRS, as well as the thickness of the compressive layer, are significantly influenced by the diameter of the impacted shot, which is consistent with the conclusion of Schwarzer et al. 12 A larger diameter induces higher surface and subsurface CRS, and also thicker compressive layer is produced, this is in contrast with the work of Ullah et al. 13 which states that the magnitude of both surface and maximum subsurface CRS are almost similar for various shots sizes.
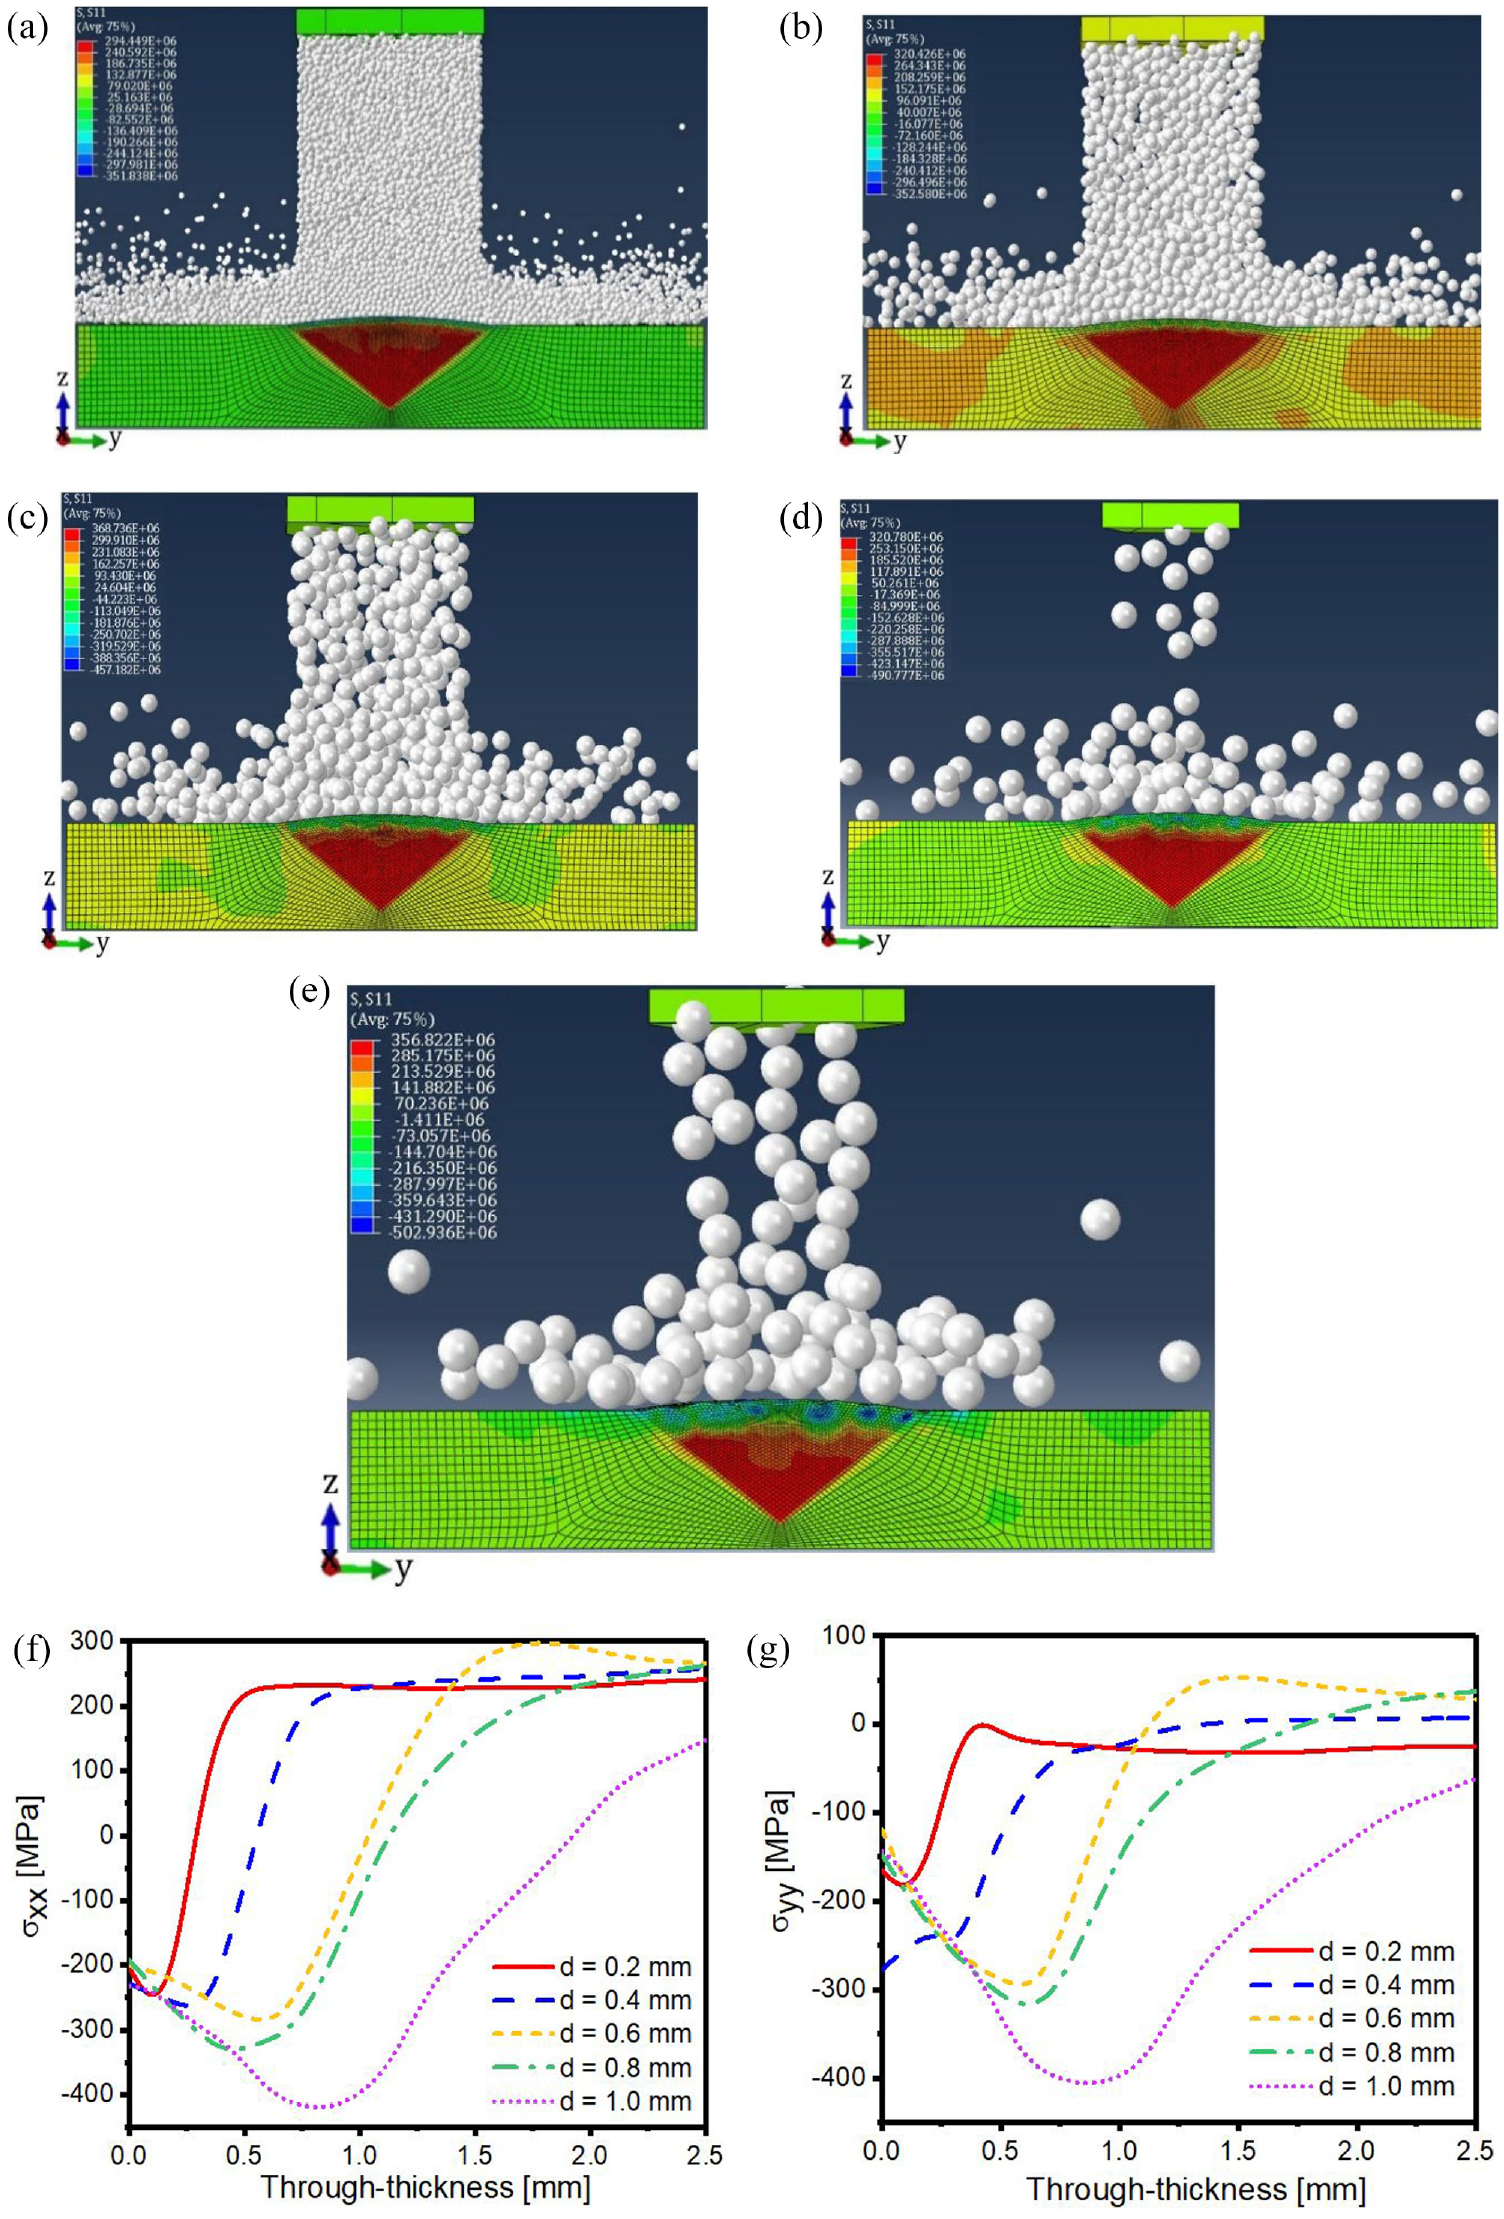
Stress maps and profiles for different shot diameters: (a) stress map for d = 0.2 mm, (b) stress map for d = 0.4 mm,(c) stress map for d = 0.6 mm, (d) stress map for d = 0.8 mm, (e) stress map for d = 1 mm, (f) longitudinal stress profiles, and(g) transverse stress profiles.
Influence of material model on the final CRS
The effect of the base material’s model on the final CRS profile and its response to the highly irregular SP impact was investigated using the combined DEM-FEM model. Two cases were simulated with multiple random shots using the following SP parameters (v = 60 m/s, µ = 0.2, d = 0.8 mm, θ = 90°). The elasto-plastic and Johnson-Cook material models were separately applied as the base materials, and the resulting stress profiles, as well as the depth of compression induced in the two models, were compared. Figure 10 presents the longitudinal and transverse RS profiles of the simulated models. The highest surface and subsurface CRS of −206.498 and −375.987 MPa were induced in the Johnson-Cook material model compared to −192.102 and −340.961 MPa for the elasto-plastic model, respectively. Conversely, the deepest compressive layer of 1.024 mm was produced in the elasto-plastic model in comparison with 0.717 mm induced in the Johnson-Cook model. Additionally, a similar profile was observed in the longitudinal residual stresses with a little variation between 0.3 and 1.7 mm through-thickness depth, which is associated with the variation in the parameters influencing the elastic and plastic deformation for the applied material models. Comparing the induced CRS from the SP experiment with the simulation results based on the different material models used, the resulting CRS based on the Johnson-Cook’s constitutive model of AA 2219 was observed to be much closer to the experimental. This is as a result of the model’s ability to accurately capture material’s response to highly irregular cyclic loading induced by the SP process, as well as effectively describe the material response to high strain rate deformation. Hence, it can be adopted in future simulations of the SP process for the same material.
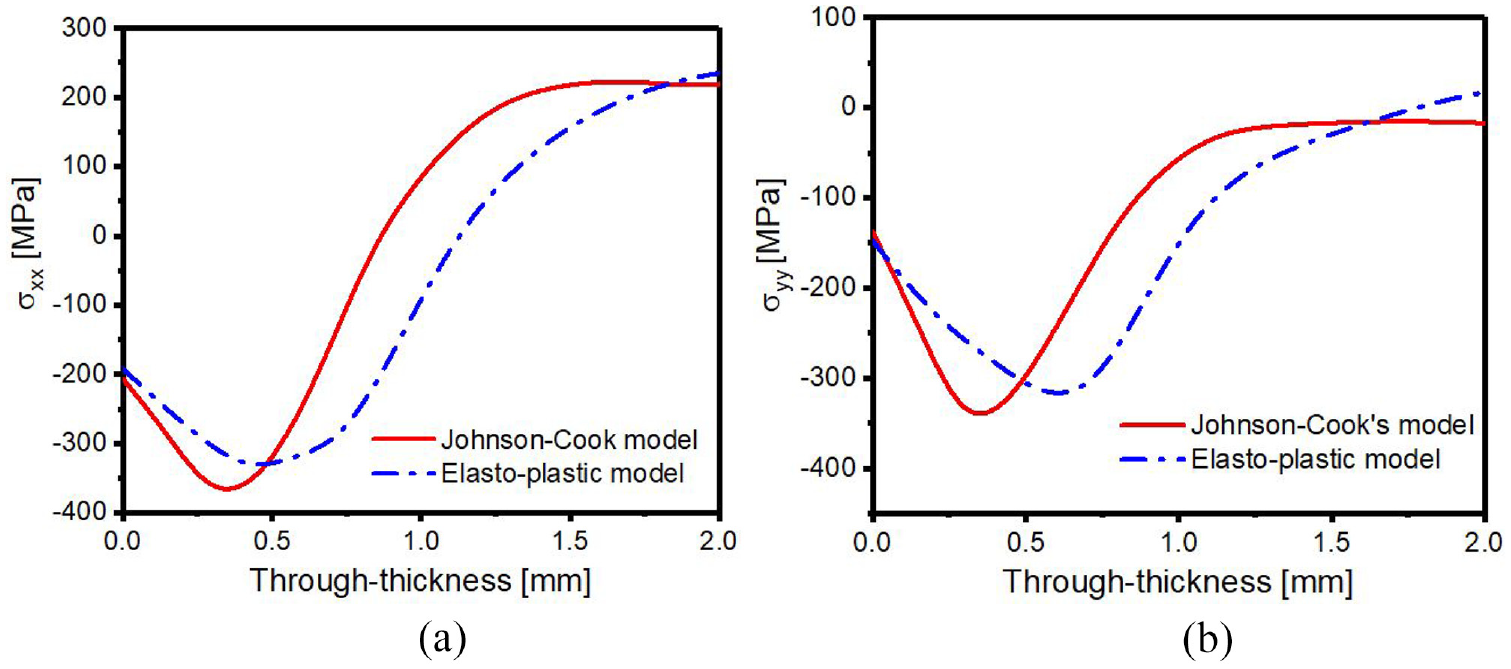
Stress profiles induced due to the two material models: (a) longitudinal stress profiles and (b) transverse residual stress profiles.
Influence of impact angle on the final CRS
To investigate the effect of the impact angle on the induced CRS, as well as the resulting compressive area produced, the SP process was simulated using various impact angles (90°, 75°, 60°, 45°, and 30°). The peening media of 0.8 mm diameter, impact speed of 60 m/s, and a friction coefficient of 0.2 were used in all cases. Also, the same material parameters of the peening media and base material were applied throughout. Figure 11 shows the maps and residual stress profiles produced for all the simulated angles of impact. The peak longitudinal surface CRS of −192.102 MPa is induced at a 90° impact angle, which also produces the deepest compressive layer. It was observed that similar peak subsurface CRS were induced at 75° and 90° impact angles, but the positions at which stresses were produced vary. The deepest penetration of the particles is observed at the 90° impact angle, which leads to the formation of the deeper compressive zone produced. As presented in Figure 11(f), it is obvious that the continuous decrease in the impact angle results in a continuous decrease in the depth of the compressive region. Also, it was observed that CRS of −68 MPa is induced at 1.024 mm of the through-thickness, which is the deepest compressive position produced at a 90° impact angle. It can be observed that significantly high CRS with adequate depth of compression was obtained at the impact angles between 60° and 90°, which is in agreement with the work of Wu et al. 11 The relationship between the depth of the compressive zone versus the impact angle is shown in Figure 12.
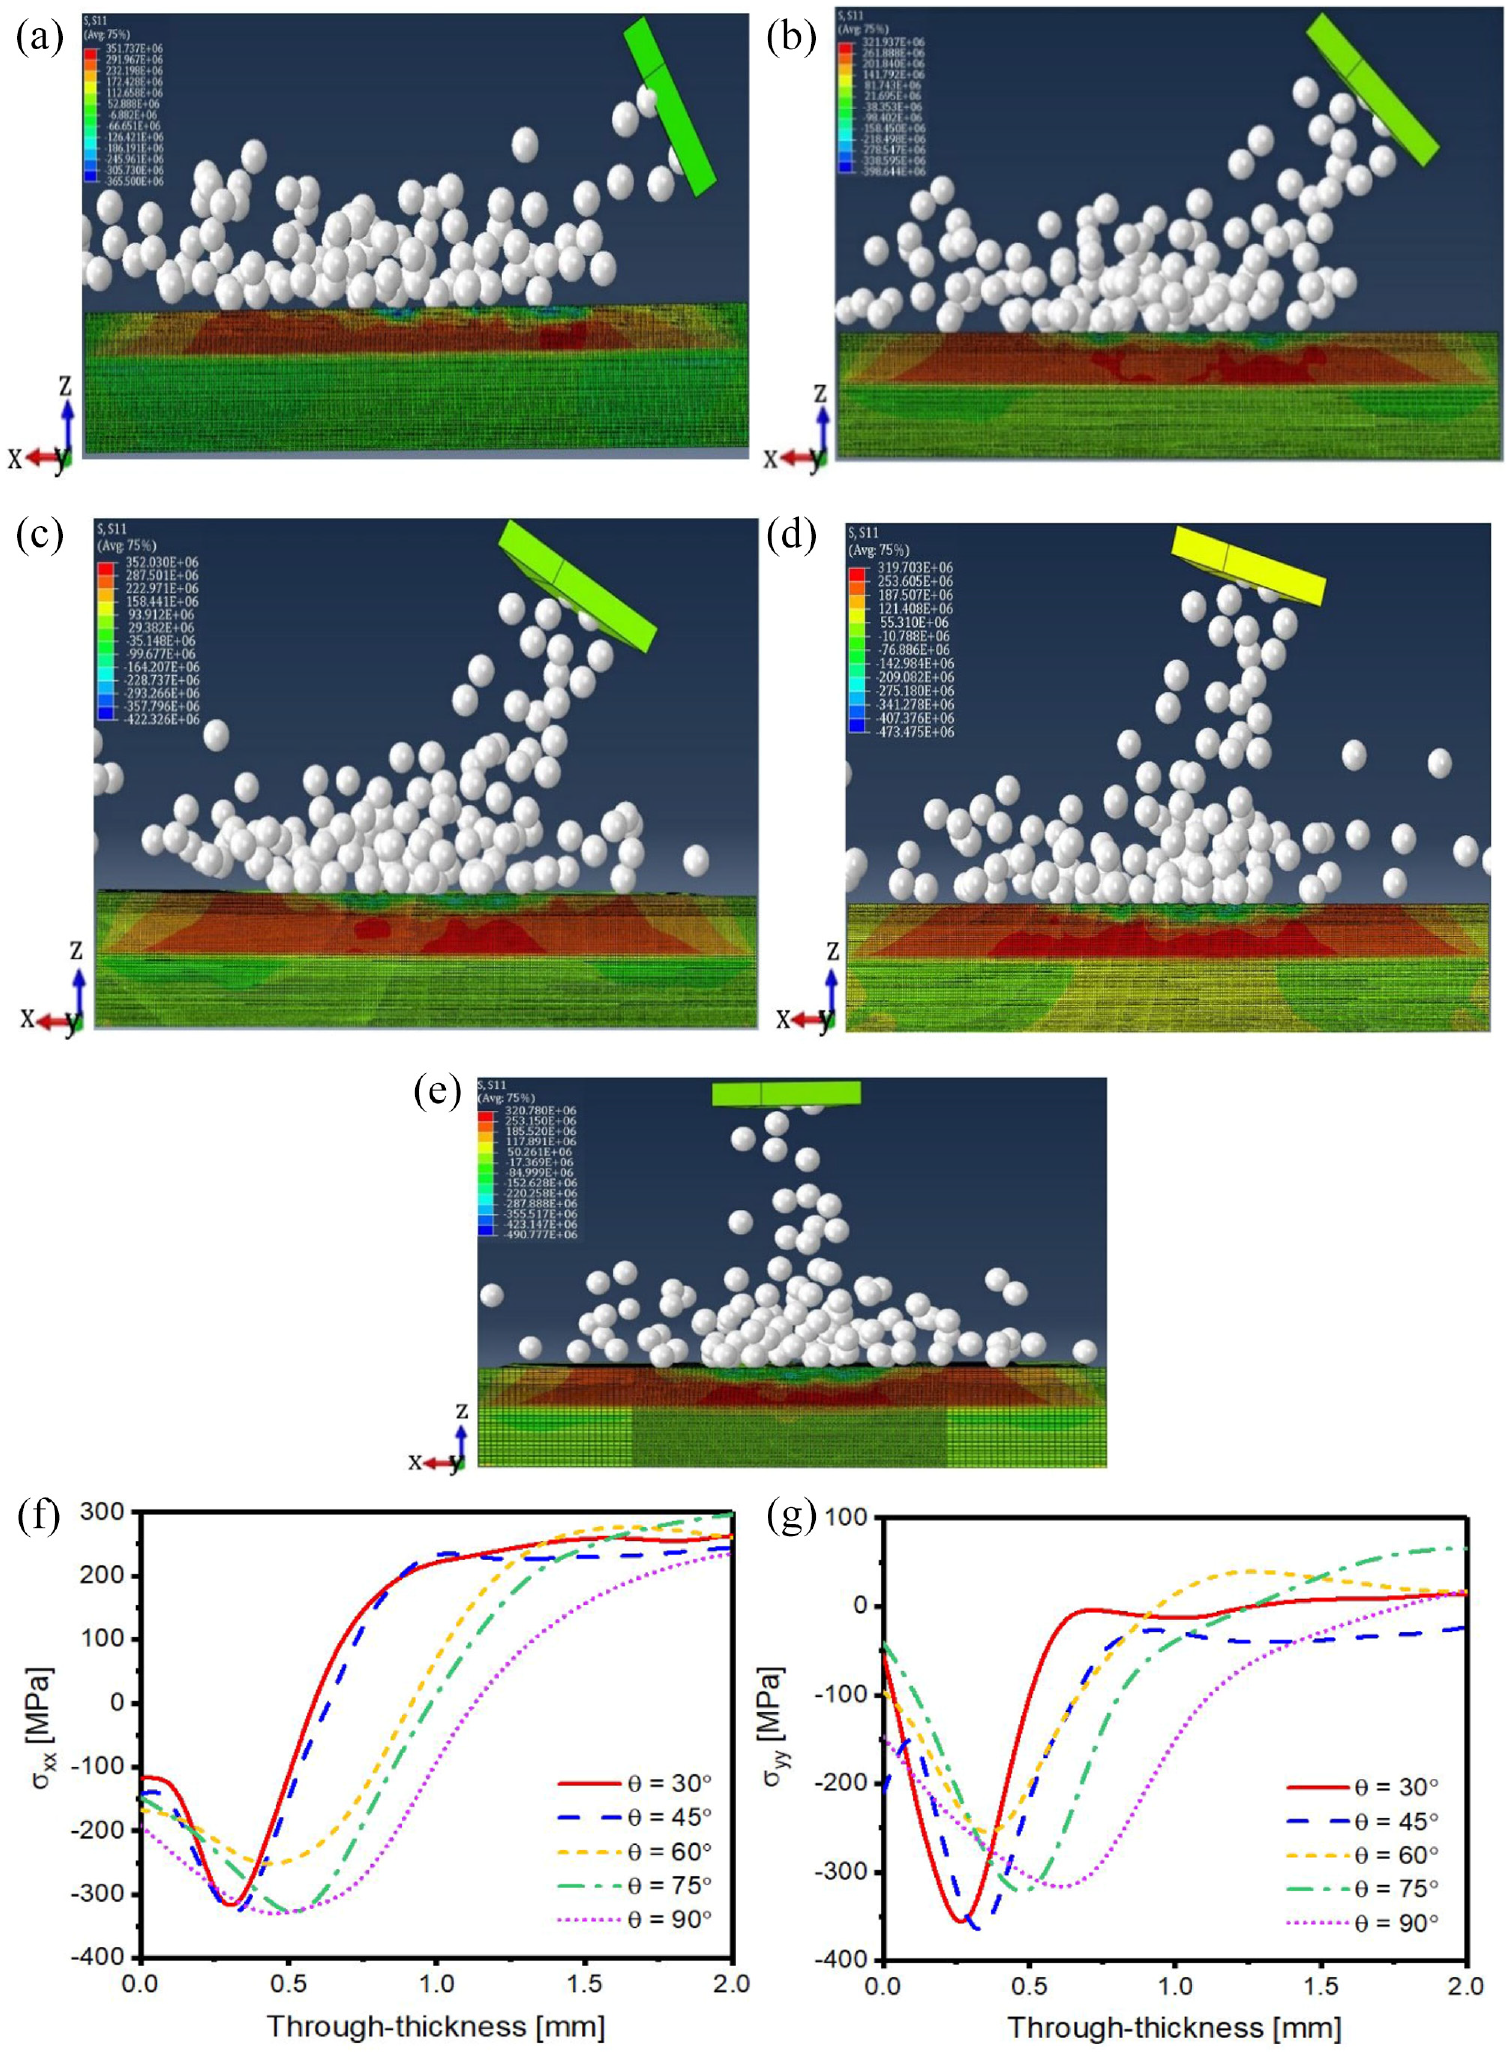
Resulting residual stresses at different impact angles: (a) residual stress map for 30° impact angle, (b) residual stress map for 45° impact angle, (c) residual stress map for 60° impact angle, (d) residual stress map for 75° impact angle, (e) residual stress map for 90° impact angle, (f) profile of the longitudinal stresses (S11), and (g) profile of the transverse stresses (S22).
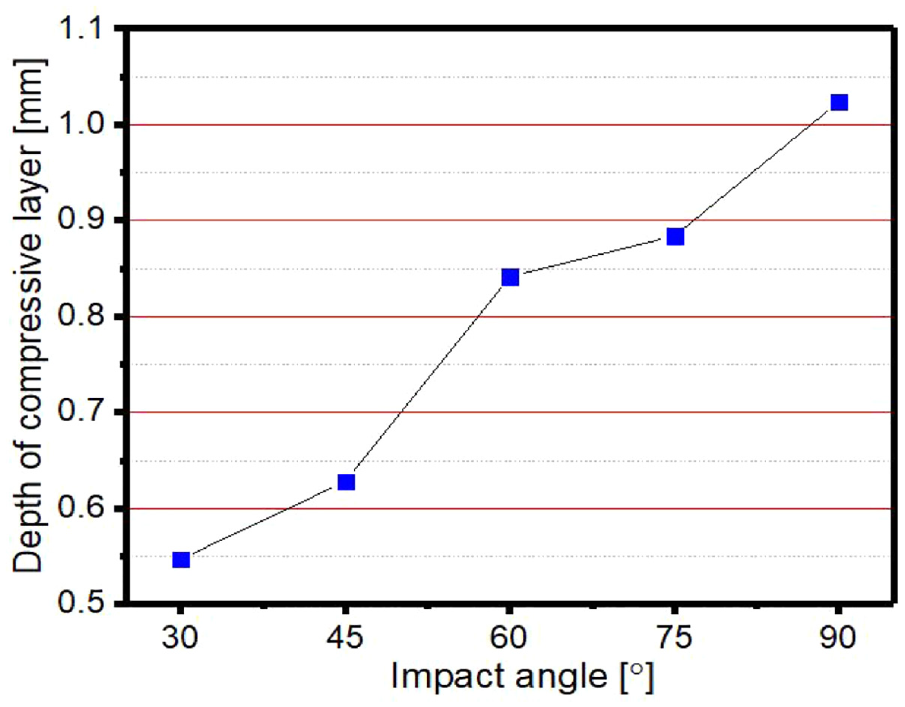
Depth of compressive layer versus impact angle.
Influence of friction coefficient on the final CRS
The influence of the friction coefficient between the shots and target surface on the final CRS profile and the compressive layer was investigated, the SP process was simulated using various coefficients of frictions. Four DEM-FEM shot peening models with the same parameters (v = 60 m/s, d = 0.8 mm, θ = 90°) were simulated using the elastic-plastic model as the base material. Four different friction coefficients (µ = 0.2, 0.3, 0.4, 0.5) were applied independently to analyzed their influence on the induced CRS. Figure 13 shows the compared longitudinal and transverse residual stress profiles.
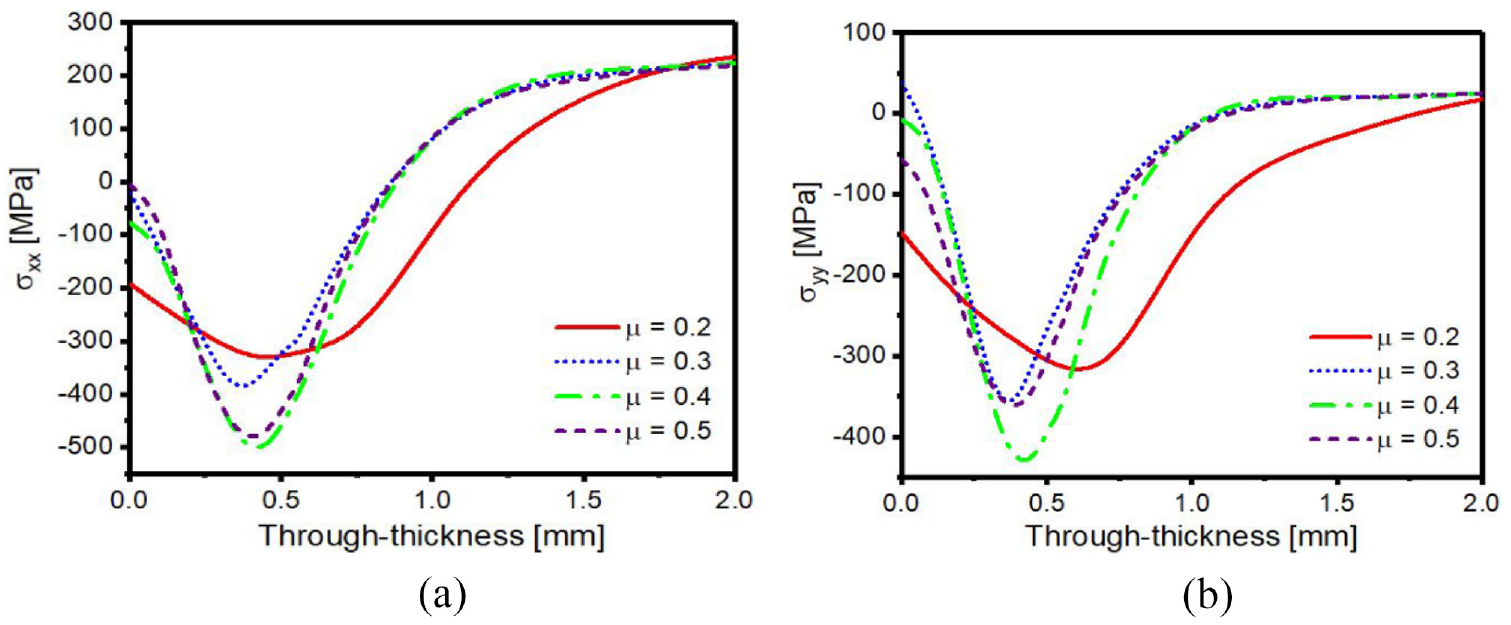
Induced stresses at various friction coefficient: (a) longitudinal residual stresses (S11) and (b) transverse residual stresses (S22).
The magnitude of the subsurface CRS increases with an increase in the coefficient of friction within the range of 0.2 ≤ µ ≤ 0.4. The peak subsurface CRS of −503.04 MPa was induced at µ = 0.4 around 0.45 mm through-thickness, which is almost similar to the highest CRS produced at µ = 0.5 around 0.39 mm subsurface depth. The peak surface CRS of −192.102 MPa was induced at µ = 0.2, whereby the subsurface CRS of −340.961 MPa was produced at the same friction coefficient. At µ = 0.5, the least surface CRS was observed, which is determined to be close to zero, this indicates that the contact established between the shots and base material’s surface almost creates equilibrium between the welding-induced and post-weld SP stresses at the impacted region. As it can be observed, the optimum stress profile that corresponds with the experimental is obtained using µ = 0.2 which falls within the range of friction coefficient recommended by Wu et al. 11 and Klemenz et al. 15 This represents the finest value of the friction coefficient for AA 2219 base material, which produces adequate surface and subsurface CRS. Hence, it can be applied for future SP simulations.
Influence of the base material model on the CoR
The influence of the base material model on the CoR is investigated by comparing the resulting CoR computed based on the elasto-plastic and Johnson-Cook’s material models. The two cases were simulated using the same SP parameters (v = 60 m/s, θ = 90°, d = 0.8 mm, µ = 0.2). Higher rebounding velocity is observed for the elasto-plastic material model compared to Johnson-Cook’s, which can be influenced by the material parameters related to the elastic and plastic deformation induced during the SP process. Hence, the CoR determined based on the elastic-plastic and Johnson-Cook’s material model for the SP parameters given above are 0.562 and 0.453, respectively.
Influence of post-weld SP on HAZ grains
To analyze the effect of the post-weld shot peening on the HAZ grain, crystallographic samples of the unaffected base materials, HAZ of the as-weld sample, and shot-peened HAZ were taken. The specimens were ground, polished, and washed with Keller solution. The grain size variations were observed using the Optical Microscope (OM). Furthermore, the samples were then electrolytically polished with HClO3 + CH3CH2OH solution in the ratio of 1:9 and the Electron backscatter diffraction (EBSD) technique was used to characterize the micromorphology of the prepared samples. The OM and EBSD maps of the characterized specimens are presented in Figures 14 and 15, respectively.
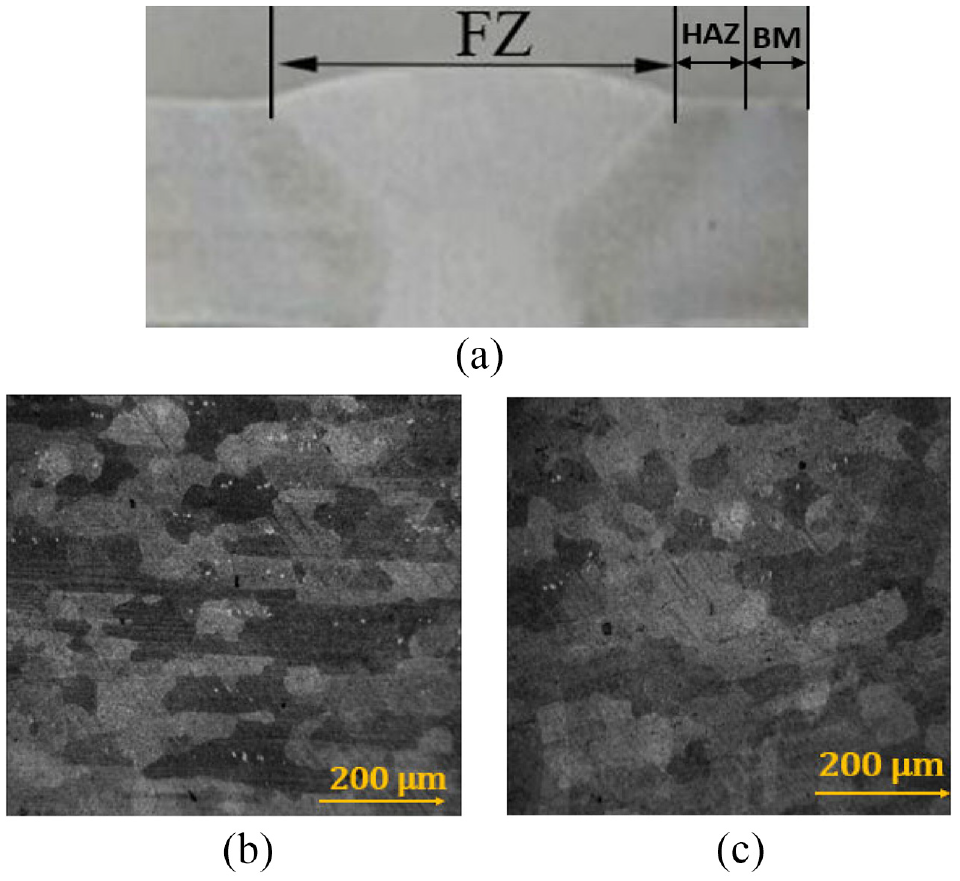
OM results: (a) OM macrograph of the targetarea, (b) micrograph of the unaffected base material, and(c) micrograph of the shot-peened HAZ.
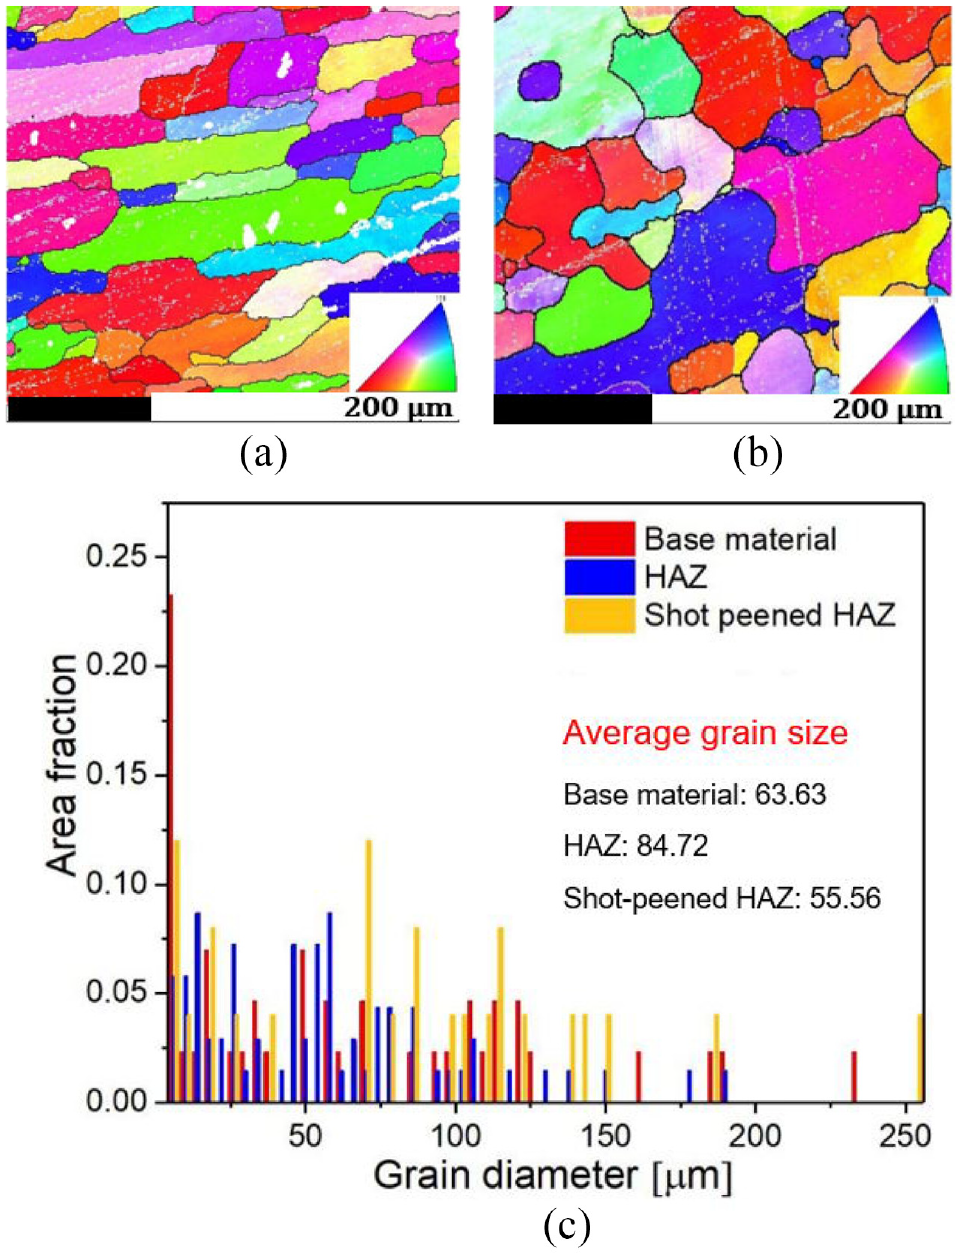
EBSD results: (a) unaffected base material, (b) shot-peened HAZ, and (c) grain size variation.
Based on the results presented in Figure 15(c), grain refinement occurs at the shot-peened HAZ because grains under deformation are stressed and divided into smaller sizes, which corresponds with the conclusion of Kahraman et al. 30 The grain size of the unaffected base material was determined to be 63.639 µm. However, the grain size of the shot-peened HAZ was determined to be 55.56 µm, which is much finer compared to the base material. The shot-peened HAZ grain is 12.7% smaller than that of the base material, which indicates that the post-weld shot peening leads to grain refinement at the impacted HAZ.
Conclusion
The effect of SP on welding RS relaxation is analyzed in this paper. Numerical simulation was performed using combined DEM-FEM to investigate the effects of the SP parameters on the final CRS. Experimental data were used to validate the accuracy of the numerical model. Based on the results obtained, the following conclusions can be drawn:
The observed good agreement between the experimental and simulation results indicates that the implemented numerical approach is reliable, feasible, and can accurately compute the CRS induced by the post-weld SP.
The final CRS induced, as well as the depth of the compressed area produced by SP depends on the size of the SP media used. By increasing the shot size, the magnitude of the subsurface CRS increases. Also, the depth of the compressive region increases when the shot diameter increases, and the size of the indent formed depends on the media size used. The magnitude of the surface CRS is not significantly influenced by the shot diameter alone, but the subsurface stress profile does.
As the impact angle decreases between 90° and 30°, the thickness of the compressive layer decreases continuously. At a 90° impact angle, the deepest compressive layer of (1.024 mm) is obtained.
At µ = 0.2, the deepest compressive region with sufficiently high CRS was observed. A continuous increase in the subsurface CRS was observed at 0.2 ≤ µ ≤ 0.4.
Applying the peening media of 0.8 mm diameter at an impact speed of 60 m/s, 90° angle of impact, and µ = 0.2, high subsurface and surface CRS, as well as a significantly deep compressive area, can be achieved. Also, the two simulated material models show distinct characteristics, the highest CRS is observed on the elasto-plastic model, while the deepest compressive layer is induced on the Johnson-Cook material model.
Footnotes
Appendix
Acknowledgements
The authors are grateful to the College of Mechanical and Electrical Engineering Management, Central South University, China for providing all the necessary facilities used in accomplishing this research.
Declaration of conflicting interests
The author(s) declared no potential conflicts of interest with respect to the research, authorship, and/or publication of this article.
Funding
The author(s) disclosed receipt of the following financial support for the research, authorship, and/or publication of this article: This work was supported by the National Natural Science Foundation of China (Grant Number: 51327902).