
Abstract
A numerical investigation is provided to study the residual stress states in multi-pass TIG welding of stainless steel SUS304 pipe. An uncoupled thermomechanical three-dimensional finite element model is developed using the ABAQUS software for a circular weld design around the pipe. The effects of weld pass numbers, electrode moving speed, and heat input on the internal and external surface tensions of the pipe are investigated. The simulation results show that by increasing the welding speed, the axial tensile stresses decrease on the pipe surfaces. In the case of hoop stress, as the welding speed raises, the tensile and compressive stresses are increased for both two- and three-pass welding. However, the width of the stress zone becomes narrower in higher welding speeds. The hoop stresses, in comparison with the axial stresses, are more strongly influenced by the welding speed and the heat input. Furthermore, using the three-pass welding process results in much lower stresses in comparison with the two-pass one.
Introduction
As an efficient metal joining process, welding produces joint strength equal or sometimes higher than the base metal strength. The welding processes have found widespread applications in almost all branches of the industry and constructions.1–4 The circumferential butt weld is the most common type of the joints employed in the power plants for the fabrication of stainless steel piping systems.5,6 In these piping systems, due to the rather large wall thickness, the welding process is completed normally in more than one pass of the weld. Due to the condensation of heat in the welding, the regions around and inside the weld zone experience thermal cycles causing uneven heating and cooling cycles in the metal. 7 Therefore, the diverse plastic deformation will occur and the presence of residual stresses would be inevitable, which can damage the performance of the weldment. Tensile residual stresses are mostly damaging, improving the susceptibility of the weldment to the fracture, fatigue, and corrosion cracking. 8 In the risk assessment for defects growth, that is, cracks in piping systems, sometimes rather than the stress made by design loads, the residual stress made by the welding could be a crucial part of the total stress field.5,9 Furthermore, to hinder inter-granular stress corrosion around the stainless steel weldments, it is essential to control the metal properties, the process situation, and the residual stresses caused probably by the welding. 10 As a result, a proper evaluation of the residual stress fields is important. The residual stress distribution in the welding is a function of some main parameters such as heat input, material properties, weld pass number, structure dimensions, constraints, and process sequencing.11,12 Therefore, in multi-pass welding, the complexity of distribution for the residual stresses is obvious, and its prediction can be very challenging.
Over the past studies, some numerical models have been provided to evaluate the temperature and residual stress distributions for the single and multi-pass welding of steel pipes.6–10,13–16 Abid et al. 17 presented a 3D simulation of stationary gas tungsten arc welding (GTAW) to study the arc and weld pool developments in different joint types of L-shape, V-shape, and open-corner. The temperature, heat flux, current density, and gas shear stress were utilized in the arc as input parameters to achieve the heat, the fluid flow and the weld pool shape.
Prasad et al. 18 considered the effects of welding parameters on the residual stress produced over the TIG welding of pipes. Their 3D numerical simulation using the ANSYS code predicts the residual stress distribution in circumferential TIG welding. They reported the effects of welding current and pipe thickness on the residual stress and temperature distribution. Farahani et al. 19 provided a 3D finite element (FE) model to simulate the circumferential welding of the medium carbon steel pipes by taking into consideration of both the solid-state austenitic to martensitic transformation and the post-weld heat treatment effects. Deng and Murakawa 20 employed both 2D and 3D models for predicting temperature distributions and residual stress and compared them with experimental results. They indicated good accordance between the experimental and simulation results. In addition, they concluded that, although 2D models need less time to simulate the welding process, it is not suitable for circumferential butt welding of pipes.
The past studies suggest that 3D models provide more reliable results than the 2D ones in circumferential butt welding of pipes due to showing a more accurate distribution of the residual stresses.
In the present study, a 3D FE model is developed using ABAQUS software, to simulate the circumferential TIG welding of SUS304 stainless steel pipes. To verify the proposed model, experiments are performed to produce two-pass welding samples and measure the residual stresses. Then, the influence of welding speed, heat input, and welding pass number on the stress distribution and temperature fields are examined in the internal and external surfaces of the pipes.
Experiment description
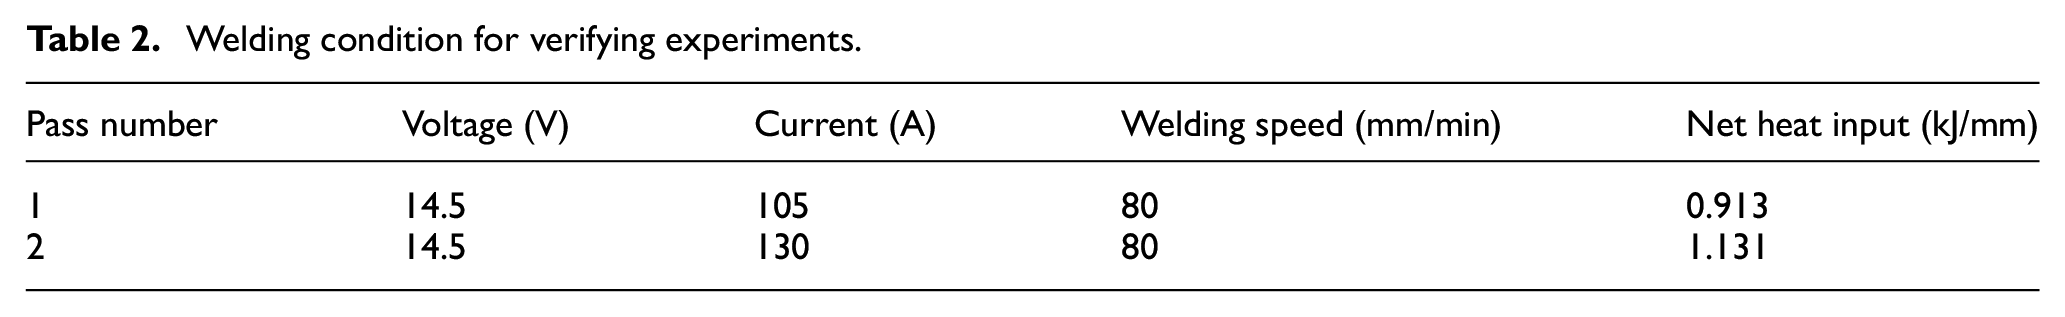
The considered material is SUS304 pipe with the inner diameter, thickness, and length of 115, 6, and 150 mm, respectively. The chemical composition of the used stainless steel is listed in Table 1. Figure 1 shows the pipe and groove dimensions along with the welding direction. To verify the presented FEM model, a two-pass weld is conducted. The condition of this weld is listed in Table 2. The net heat input is calculated based on the arc energy multiplied by the arc efficiency (
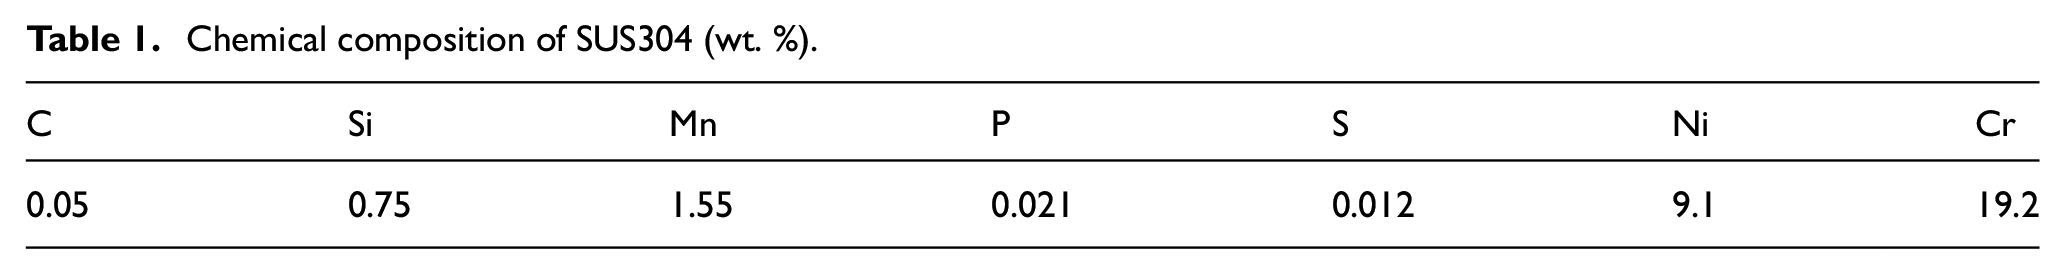
Chemical composition of SUS304 (wt. %).
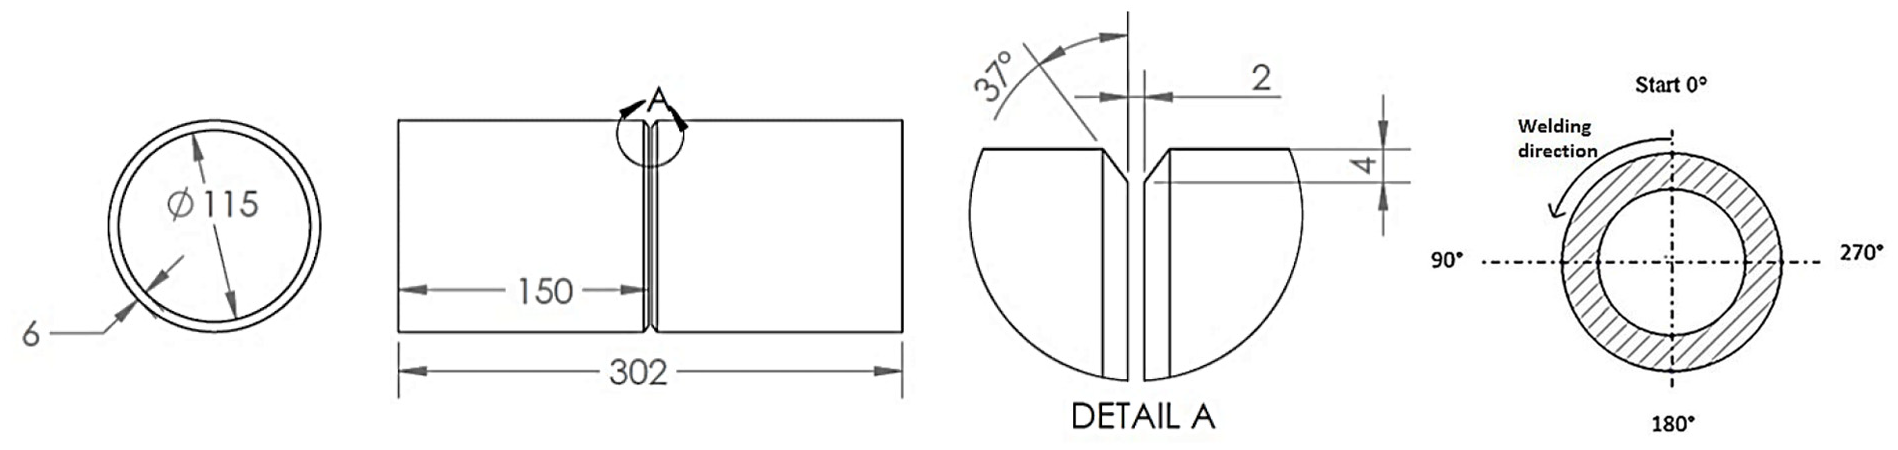
Dimensions of the pipes and the Y groove for welding along with the direction of the welding.
Welding condition for verifying experiments.
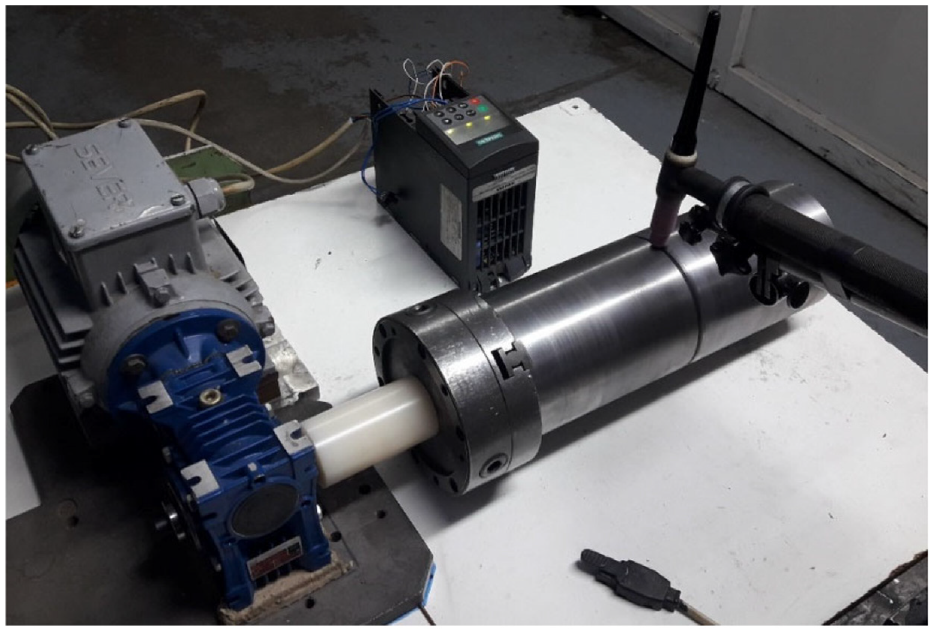
The experimental setup.
All the measurements for the temperature and residual stress are taken at the angle of 45° from the start point. Two passes of TIG welding are applied to each pipe, and then the welded samples are taken into consideration by X-ray diffraction (XRD) analysis to evaluate the residual stress.22,23
3D FE modeling
In this work, a 3D FE model is developed to attain accurately the temperature fields and distribution of the residual stress around the weld line on the pipe. Since the dimensional variations and mechanical work in arc welding are insignificant in comparison with the thermal energy issued from the arc, the uncoupled formulation is employed to simulate the thermomechanical behavior of the weld metal over the welding. Uncoupled formulation solves the heat conduction problem without considering the stress field and its dependency on the temperature history. On the other hand, the thermal expansion, as well as the temperature-dependent thermo-physical and thermo-mechanical properties, as the relations of the transient temperature field to the stress analysis, are taken into consideration. Therefore, initially, the thermal analysis produces the thermal history, and then, to evaluate the residual stress field, the temperature history is considered as the thermal load on the relative nodes in the mechanical analyzing step. Then, the effects of the welding speed, heat input, and welding pass number on the internal and external surface stresses of the pipes are investigated.
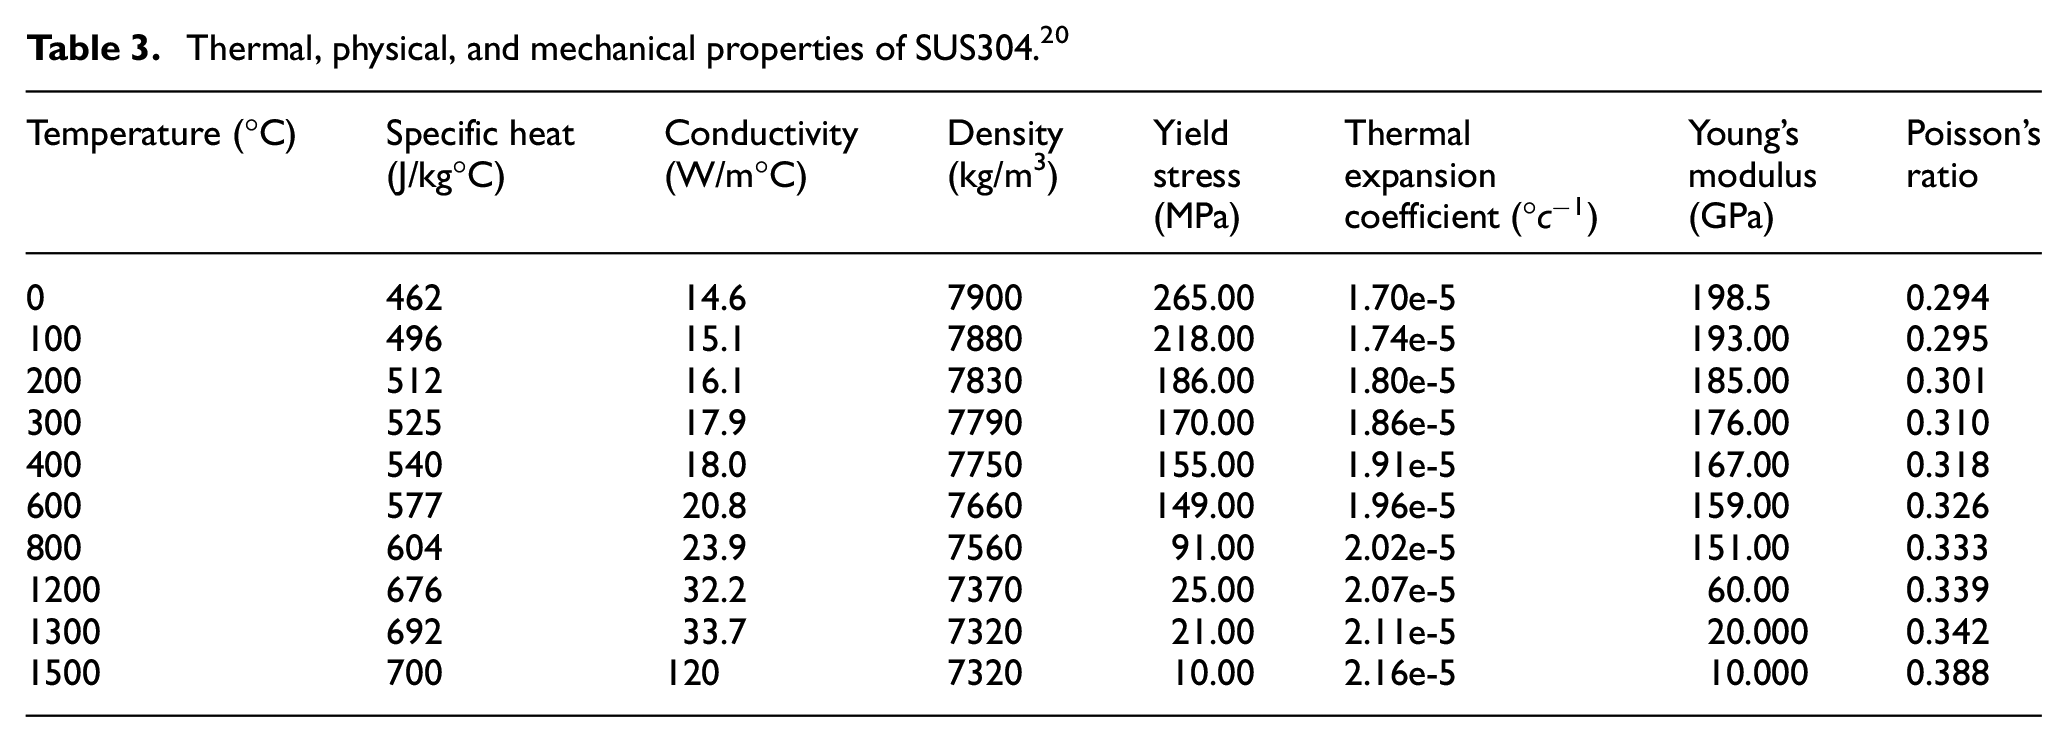
This simulation model for TIG welding is developed using ABAQUS 6.16 and FORTRAN codes. The weld design is selected to be circular around the pipe and to take the moving heat source into consideration, an appropriate transmission matrix is coded. To calculate the temperature variations on the surface, as a result of the heat transfer; and also to calculate the amount of the heat transfer, the Film subroutine is used. 24 To consider the volumetric thermal flux on the workpiece, the “GOLDACK” method is utilized. 25 The weld-depositing model is applied based on element birth and death method. In this study, the heat transfer coefficients for both radiation and convection are employed. To take the moving heat source into consideration, an appropriate transmission matrix is coded. The filler metal used in the TIG welding process was Y308L. The weldment and base metal properties are almost the same and their temperature-dependent mechanical and thermal properties are listed in Table 3. It should be noticed that, for the temperatures above 1500°C the ABAQUS software uses the properties provided for the last highest temperature.
Thermal, physical, and mechanical properties of SUS304. 20
Thermal analysis
Figure 3 shows the created 3D finite element model composed of 9360 elements and 12150 nodes. Due to the symmetry with respect to the weld line, just one of the pipes is modeled. Then the FE results for the residual stress and temperature distribution are mirrored. Additionally, the meshes around the weld line are finer and by increasing the distance from the weld line, the mesh size is increased. The minimum size of the elements is 0.5 mm × 1.5 mm × 3.5 mm. The pipe dimensions such as the length, the external diameter, and the thickness are 150, 127, and 6 mm, respectively.
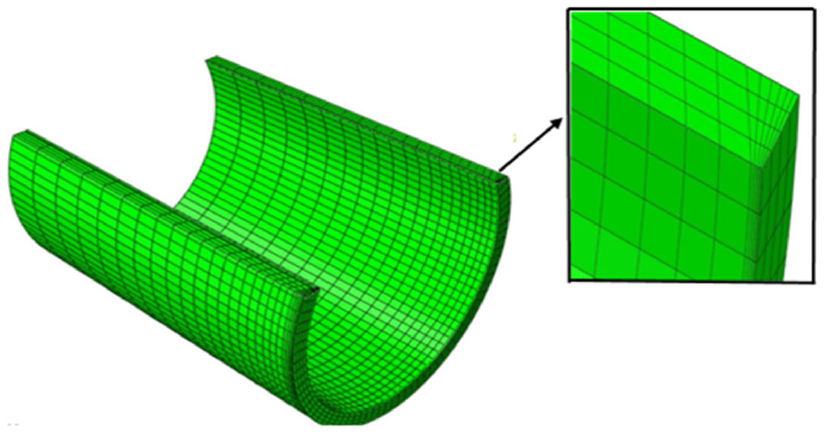
The 3D model of the pipe and weld metal in the proposed FE model.
For the welding region, based on the number of passes, different element zones are defined. Elements of the second (and third) pass were inactive during the first pass and were not participated in the analysis. After finishing the first pass, elements of the second pass weld metal were participated into the simulation model to perform the second welding pass, while the first pass weld metal is taken into consideration. The weld-depositing model is applied by using the element birth and death method. In this method, an element row is deactivated along the weld path in an initial dummy step, and then the modeling of the pipes’ fusion is completed by activating the subsequent elements. During the welding process, impermanent heat transfer analysis in the weld region is 8 :
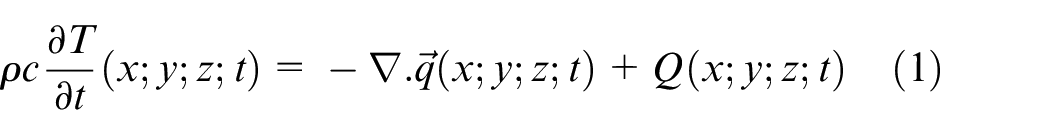
where ρ is the material density; c, the special heat capacity; T, the present temperature; ∇, the spatial gradient operation symbol; q, the thermal flux vector; Q, the interior heat production rate; x, y, and z, the peculiarities in the referral system; and t is the time. The isotropic nonlinear Fourier thermal flux fundamental equation is 8 :

where k is the thermal conductivity, which is a temperature-dependent parameter. A volumetric heat source, defined by the ellipsoid heat flux distribution and obtained by the Goldack model, is used for the generated heat from the welding arc. 8 Equations (3) and (4) define the front and rear heat sources, respectively.
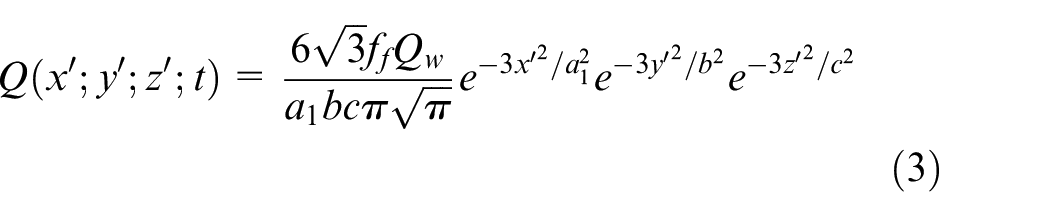
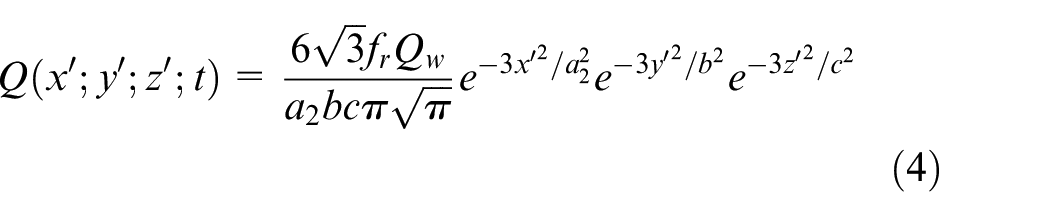
where,
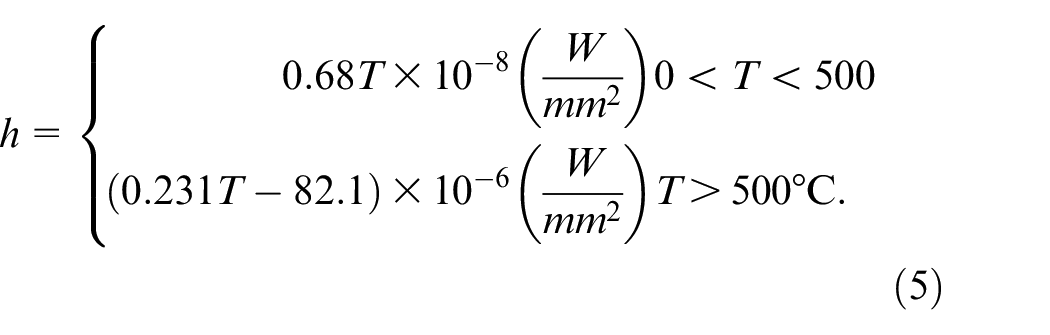
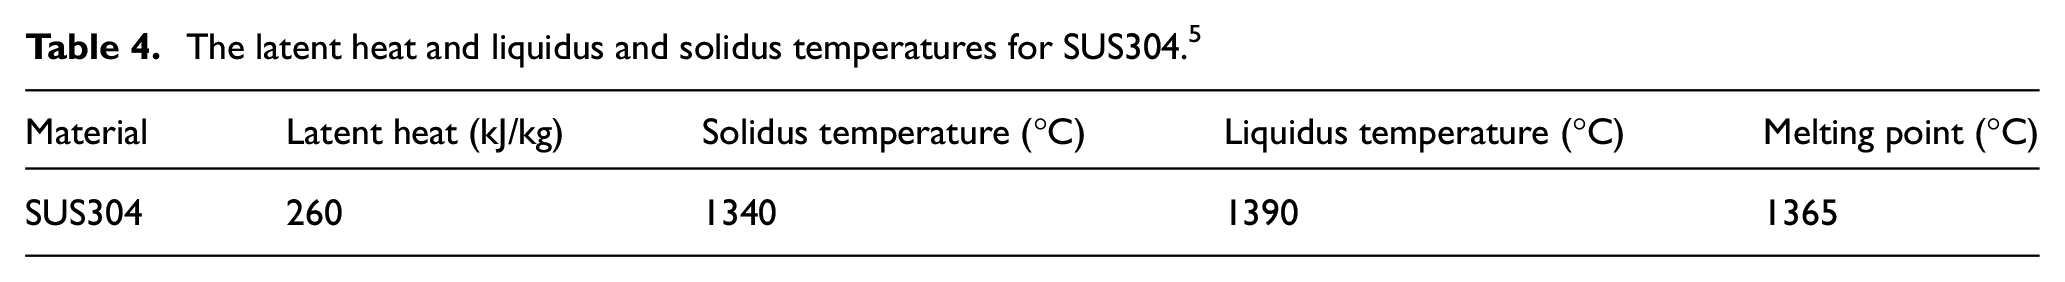
where, T is the temperature. For temperatures above the melting point, an artificially high thermal conductivity is supposed. This is used to take the heat transfer effects into consideration as a result of the fluid flow in the weld pool, which is several times larger than its value at room temperature.27,28 The mentioned thermal boundary condition is applied to all free boundaries of the model in the first pass; and running the second weld pass it will contain the boundaries produced from the first pass. In addition, latent heat of fusion is considered for modeling the thermal effects arising from solidification of the weld pool. The latent heat, liquidus temperature, and solidus temperature used in this study for the SUS304 pipe material are listed in Table 4.
The latent heat and liquidus and solidus temperatures for SUS304. 5
Mechanical analysis
The mechanical analysis is performed using the temperature histories, attained from the thermal analysis. Supposing that no phase transformation occurs in the solid-state weldment and the base metal, the total strain rate

where
Validation
To validate the presented FEM for the multi-pass TIG welding of stainless steel pipe, its results are compared with the experiments. To this aim, an SUS304 stainless steel pipe is welded by a two-pass butt welding process. As presented in Table 1, the current values for the first and the second passes were 105 and 130 A, respectively. In this study, first, the proposed model is verified by the temperature history as well as the residual stresses in the two-pass welded SUS304 pipe. Then, the effects of the welding pass number, heat input and welding speed on the temperature history and the residual stresses are considered.
The cross-section macrograph of the welded sample is shown in Figure 4, in which the Y grooves in the SUS304 pipes is filled with two passes of TIG welding.
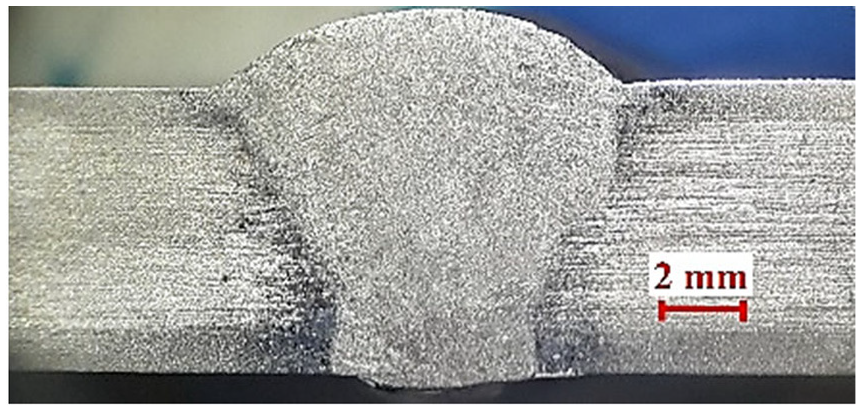
Cross-section macrograph of a two-pass welded SUS304 pipe.
Temperature history validation
The conditions for the two-pass TIG welding of SUS304 pipe are listed in Table 2. The parameters for the first and the second passes are mentioned separately. The amounts of the voltage and welding speed in both welding passes were constant and equal to 14.5 V and 80 mm/min, respectively. Figure 5 shows the numerical temperature history curve in the center of weld, along with the numerical and the experimental temperature history curves in 7 and 13 mm distance from the weld line in the first and the second passes of welding process. The results reveal that there is a good agreement between the numerical and experimental temperature histories in 7 and 13 mm distance from the weld line. The temperature history curves are detected on the outer surface of the pipe. Since the center of the weld on the outer surface is free of material (before applying the second pass of the weld), its temperature is constant and equal to the room temperature.
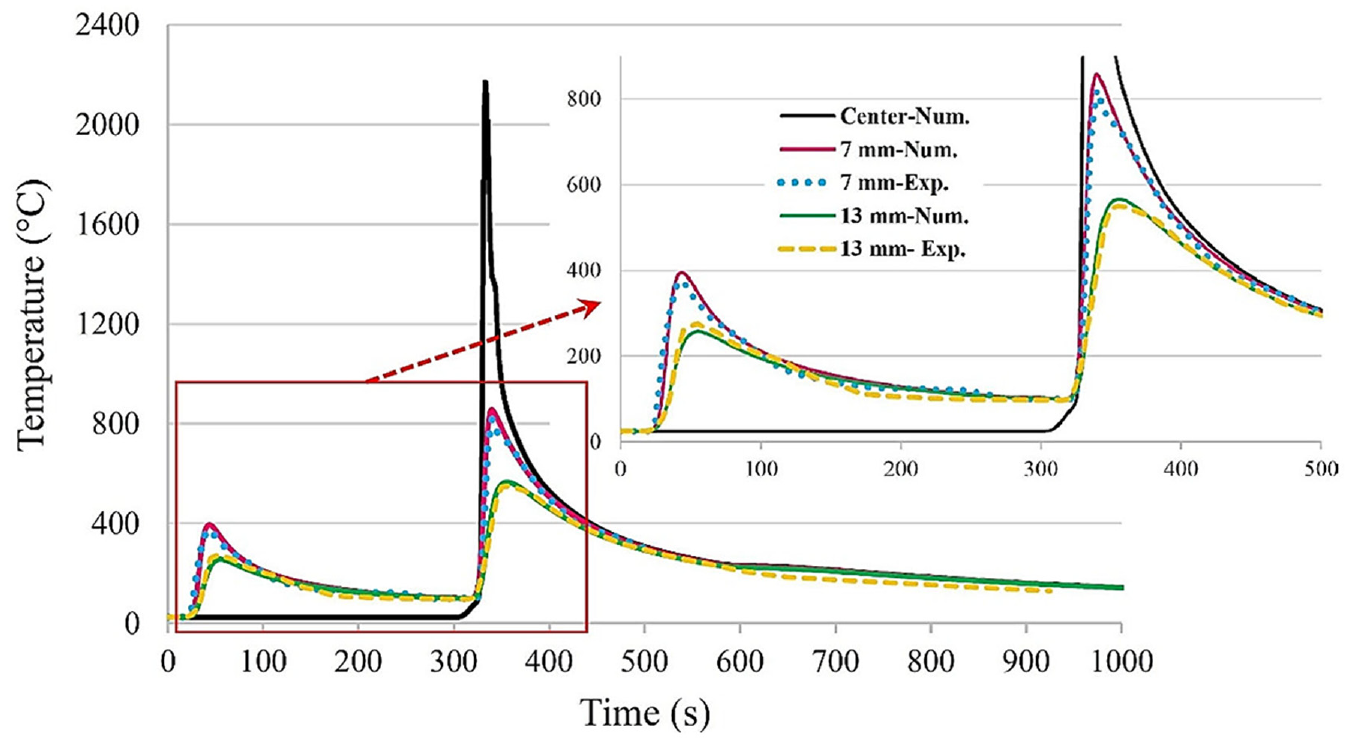
Time-Temperature cycles for the first and the second passes of TIG welding of SUS304 at the pipe outer surface and the distances of 7 and 13 mm from the weld line. The results are taken at the angle of 45° after the weld start. Welding speed: 80 mm/min.
By comparing the curves in Figure 5, it can also be concluded that the peak temperature experienced by three points (0, 7, and 13 mm distance from the weld center) are severely different. This phenomenon definitely will cause residual stresses around the weld zone. In this study, the residual stresses, taken into consideration, are axial and hoop stresses in the inner and outer surfaces of the welding pipe. Residual stresses in the welded joints are generated due to severe temperature changes over the weld thermal cycle including the heating, reaching the peak temperature, and cooling down steps. These severe changes are experienced by the weldment and regions close to the weld pool that is, heat-affected zone (HAZ). Type and magnitude of the residual stresses change over the different steps of the welding.
Residual stress validation
As shown in Figure 6(a) to (d), the pipe axial and hoop residual stresses on the outside and inside surfaces demonstrate good correlations between the numerical results and the experimental data. Therefore, the presented FEM is suitable to simulate the multi-pass butt weld on the stainless steel pipe, and to consider the thermal and mechanical analyses.
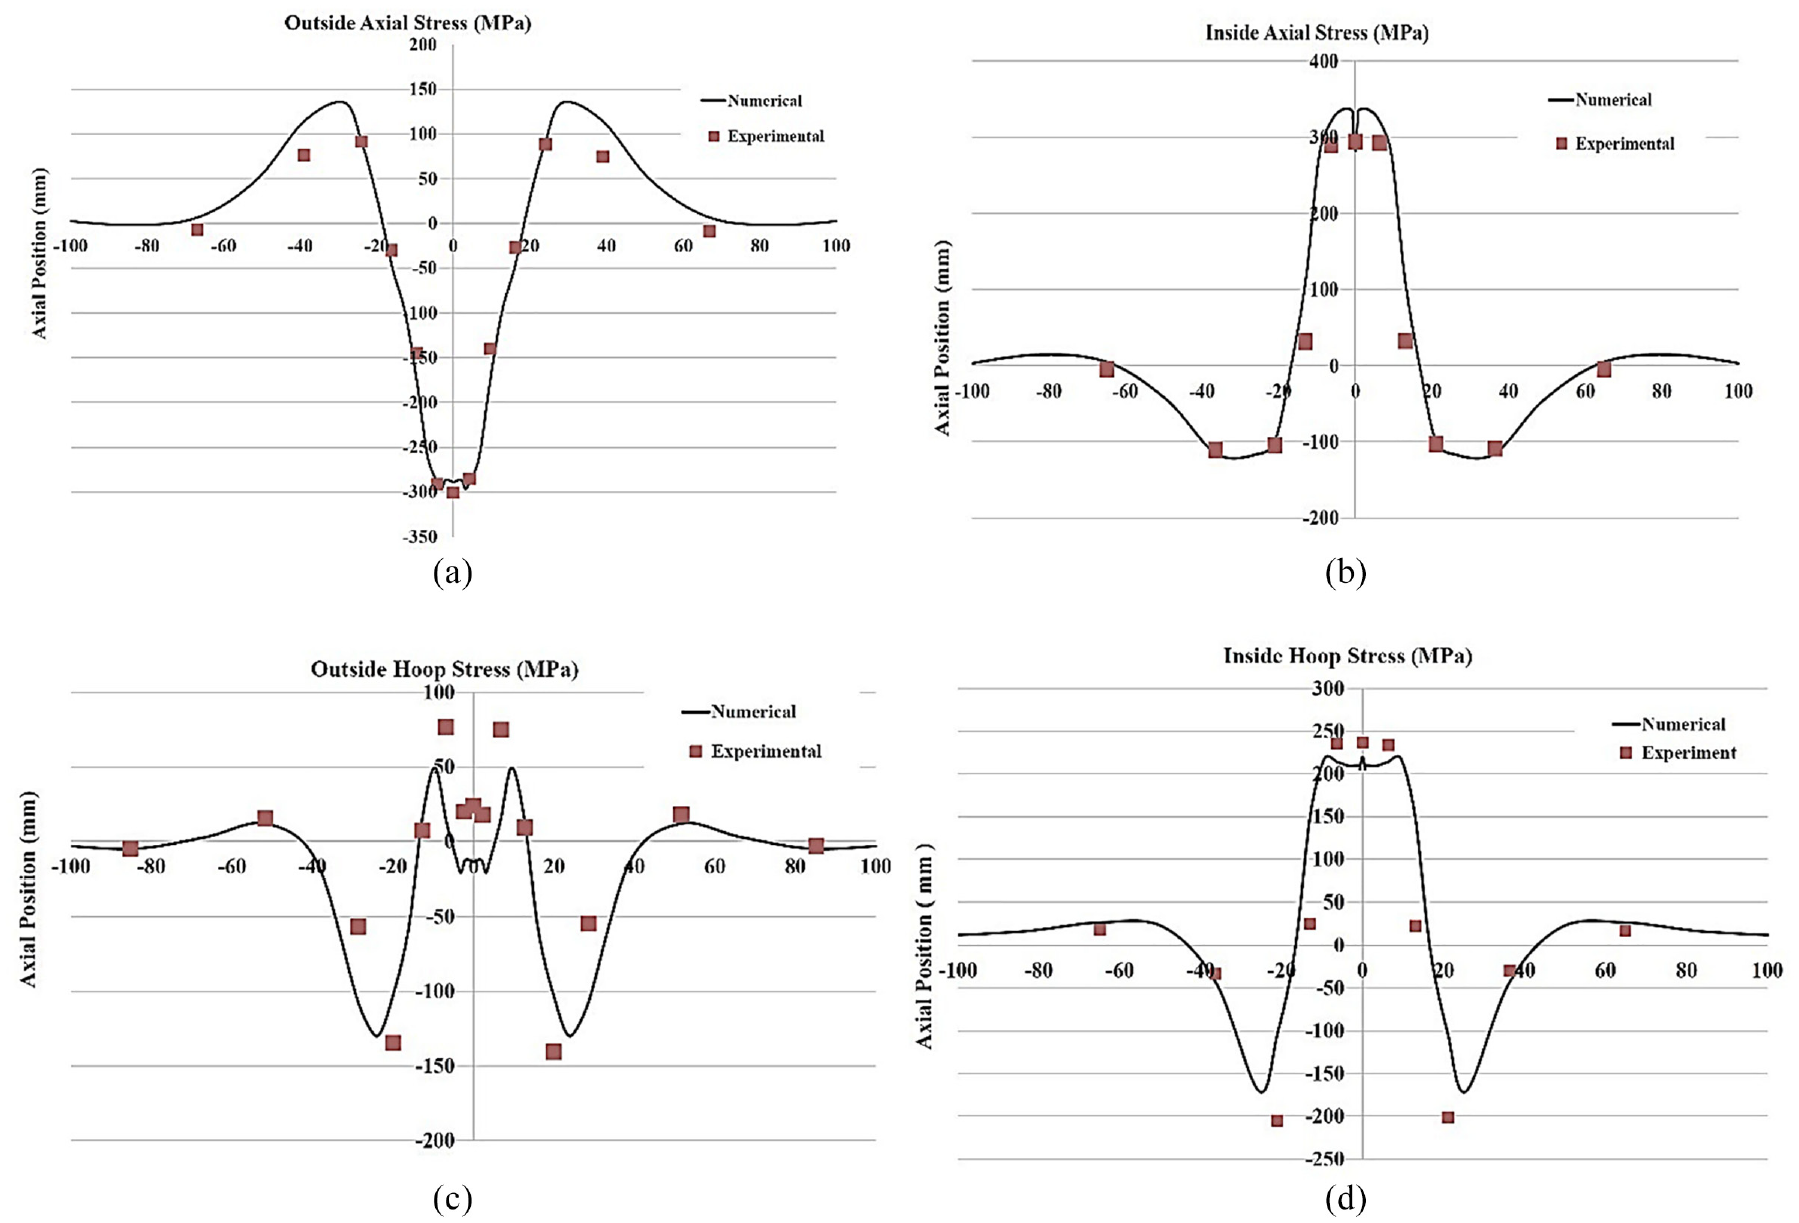
Comparison of stress results obtained from presented numerical model and the experiments: (a) outside axial stress, (b) inside axial stress, (c) outside hoop stress, and (d) inside hoop stress.
Results and discussions
After verifying the presented model, the effects of the welding speed, heat input, and the number of the weld passes are examined on the residual stress curves and temperature fields. The results are discussed in the following subsections.
Temperature distribution versus the welding speed
The conditions for the multi-pass TIG welding of the SUS304 stainless steel pipe are listed in Table 5. The parameters for the two- and three-pass welding procedures are cited separately for the different passes. The amount of the voltage in all welds is constant and equal to 14.5 V. However, the current (and consequently the heat input) is increased in the second and third passes. For the first case, the welding speed was 80 mm/min; while it is 120 and 180 mm/min for the second and the third cases.
Welding conditions in the two- and three-pass TIG welding of SUS304 stainless steel pipe.
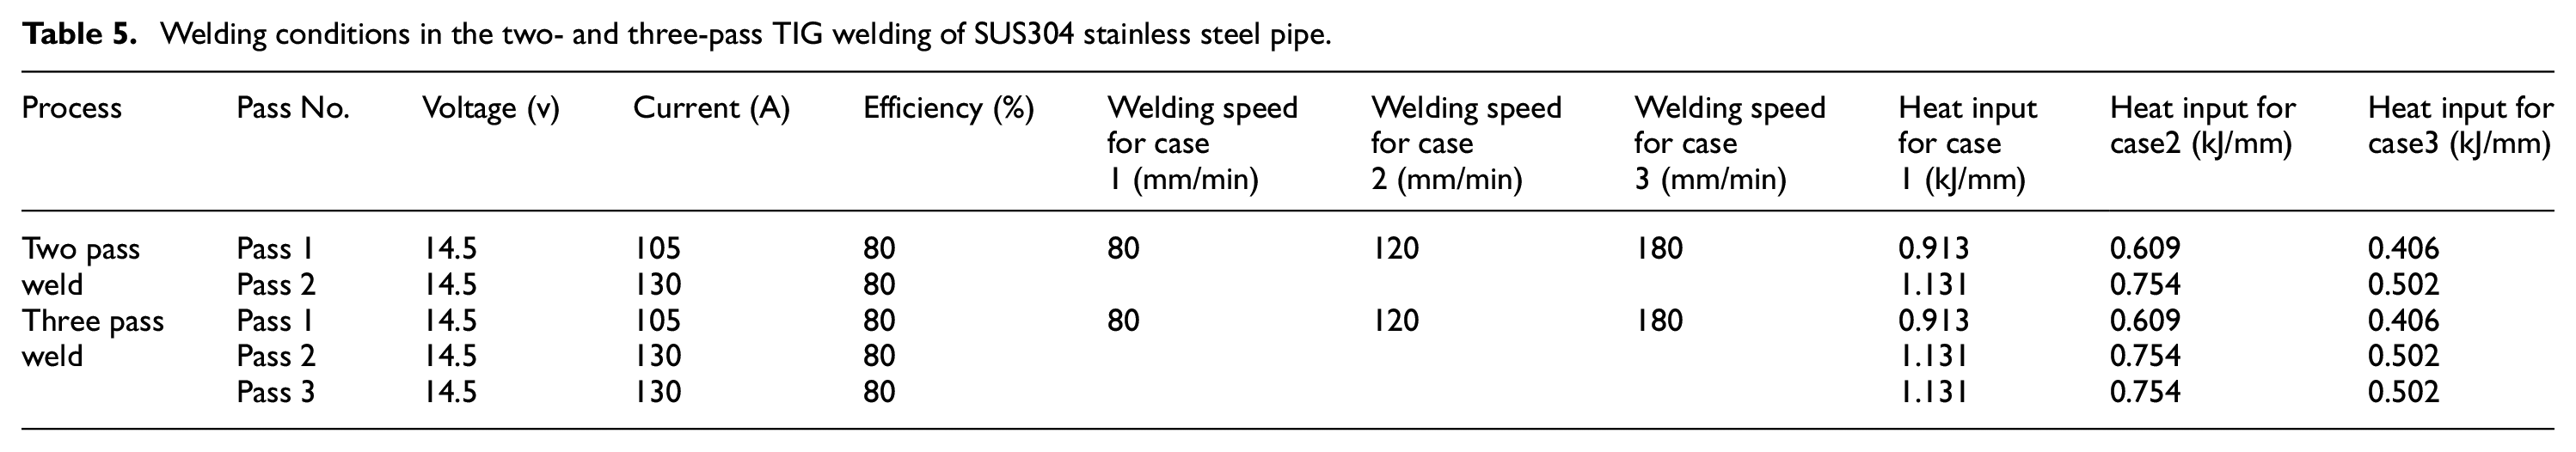
Figure 7 shows clearly the variations of the temperature distribution around the weld zone, when the heat source is located at the angle of 45° after the start point of the pass No. 2 in the specimens produced with different welding speeds in the two- and three-pass welds. It is observed that by increasing the welding speed, the peak temperature is reduced due to the lower heat input, for both two- and three-pass welds. Also, the temperature gradient for the three-pass welding (with the same heat input and welding speed) is higher than that for the two-pass welding. This is due to the lower volume of the deposited weld metal in each pass and thus, a larger share of the heat input at any point in the three-pass welding process.
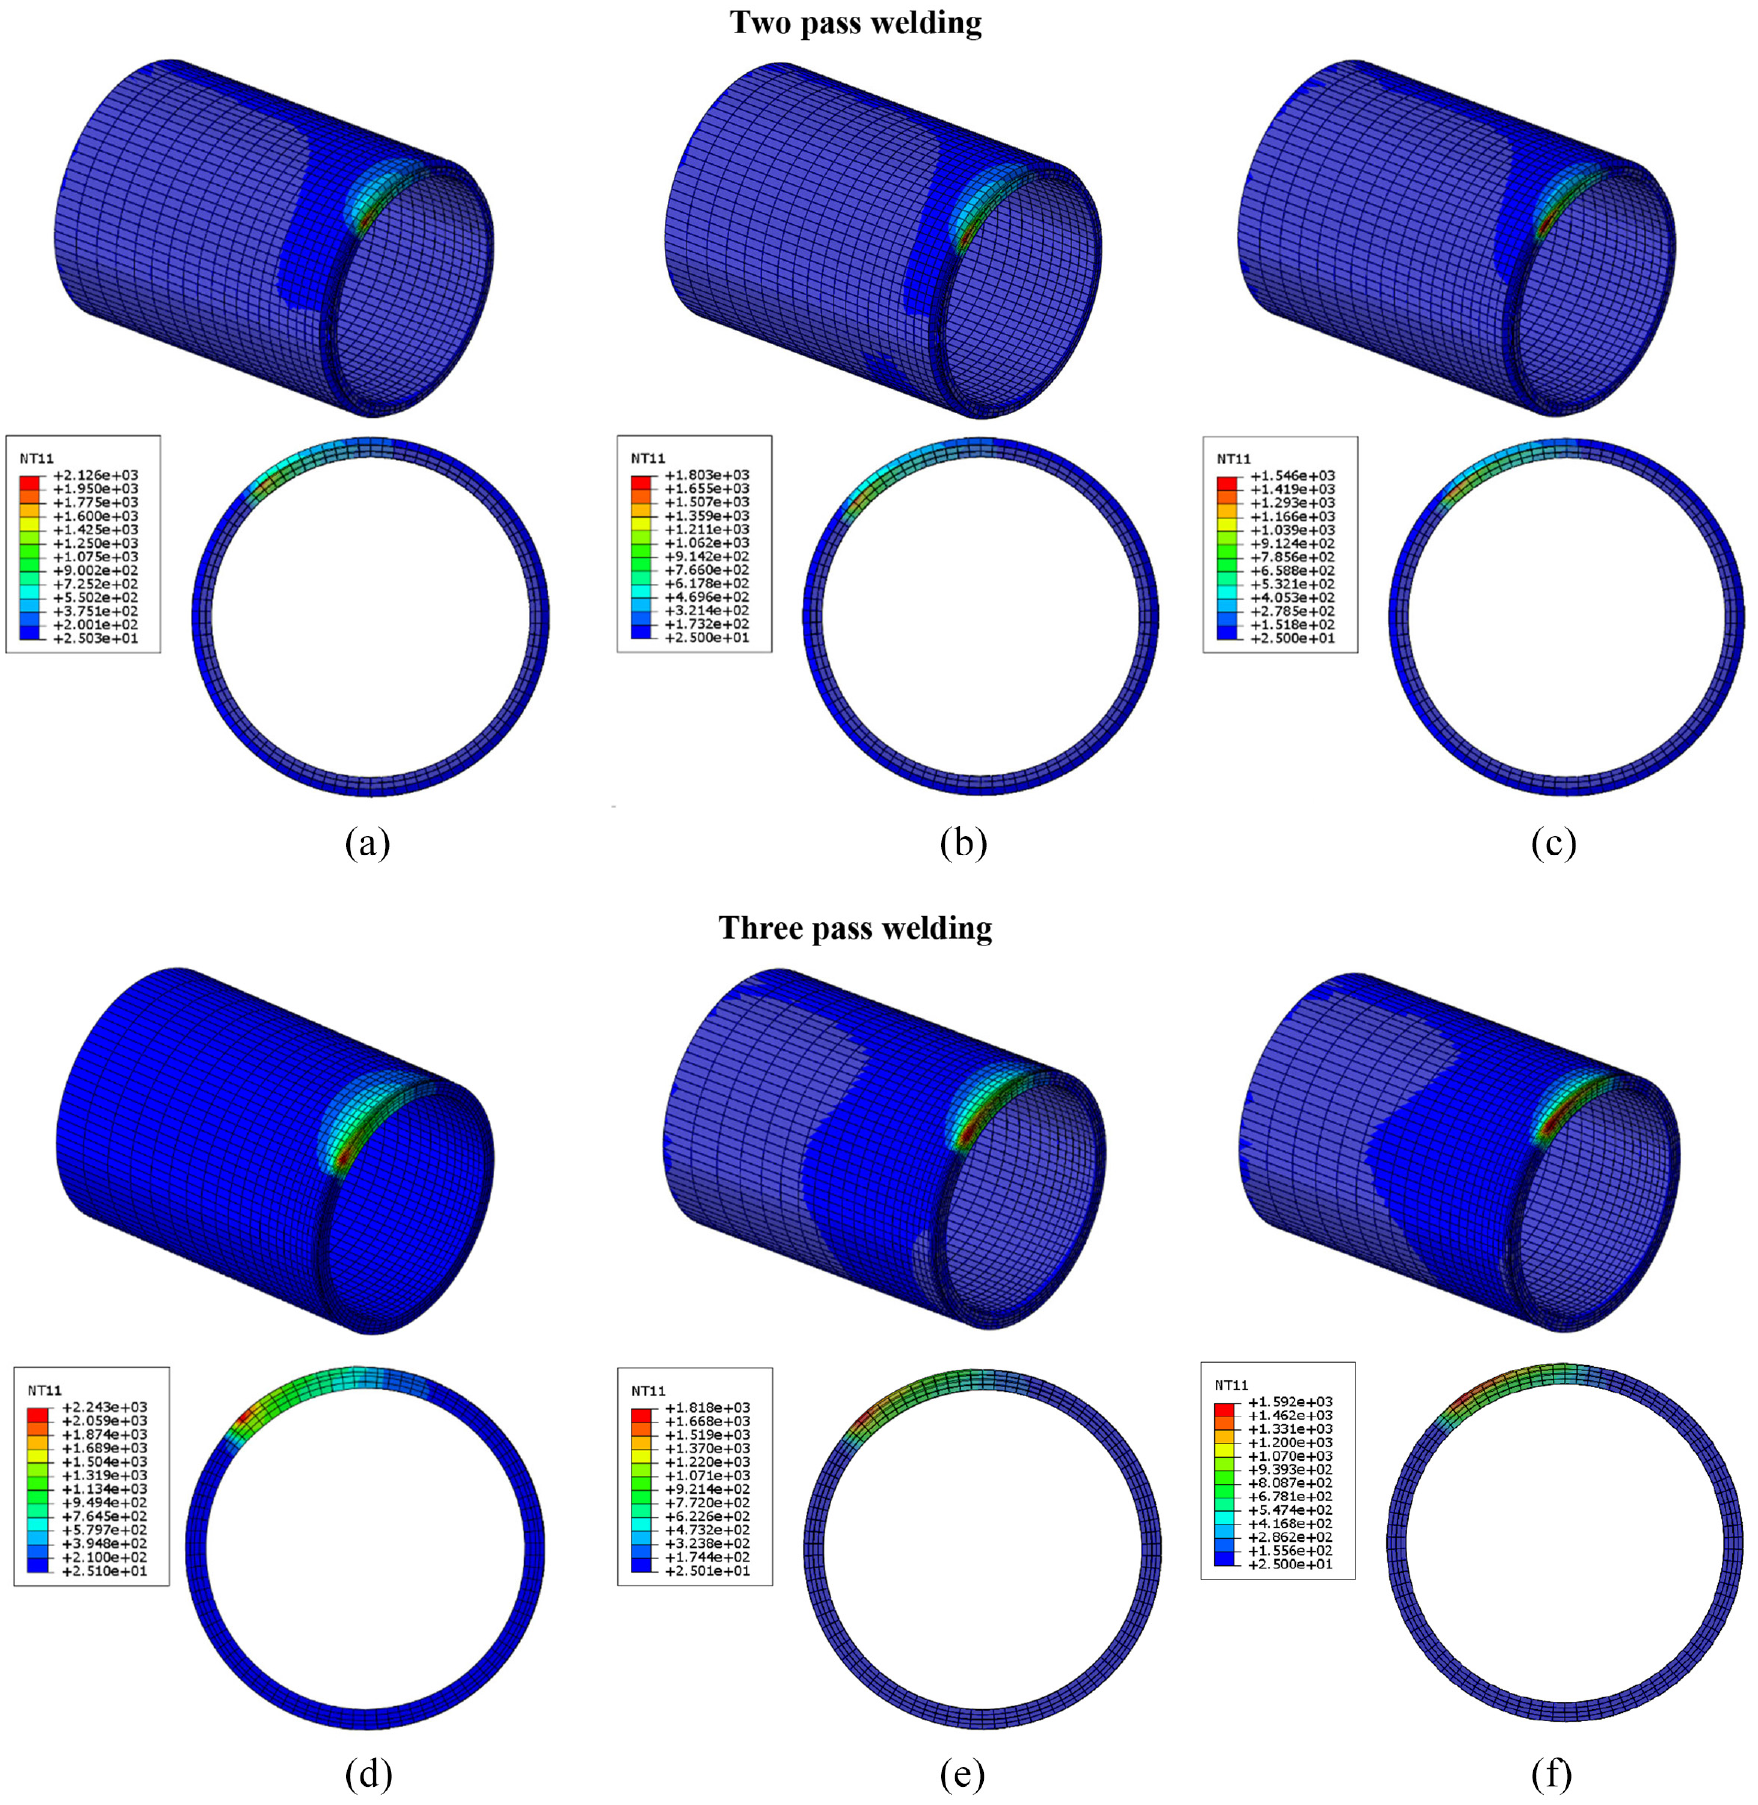
Temperature distribution around the weld line at the angle of 45° after the start point of the welding pass No. 2. Welding speed was: (a and d) 80, (b and e) 120, and (c and f) 180 mm/min. (a–c) two-pass welding, and (d–f) three-pass welding.
It should be noticed that, depending on the type and the position of the non-uniform volumetric changes, the residual stresses can emerge as a tensile or compressive one. The differential volumetric changes are both at the macroscopic and microscopic levels. 20
Figure 8 shows the peak temperature distribution curves in the cross-section of the weld for the first and the second welding passes at the outer and inner surfaces of the pipe. The peak temperature is higher for the samples produced with a lower welding speed. In Figure 8(a), while the first pass is applying on the pipe, the peak temperature is just 458°C for the sample welded by the speed of 80 mm/min and this peak temperature is detected in a distance far from the center. Because, while applying the first pass, there is no material at the center of the pipe on the outer surface. However, the peak temperature in the inner surface is reached to1420°C at the inner surface with the welding speed of 80 mm/min (Figure 8(b)).
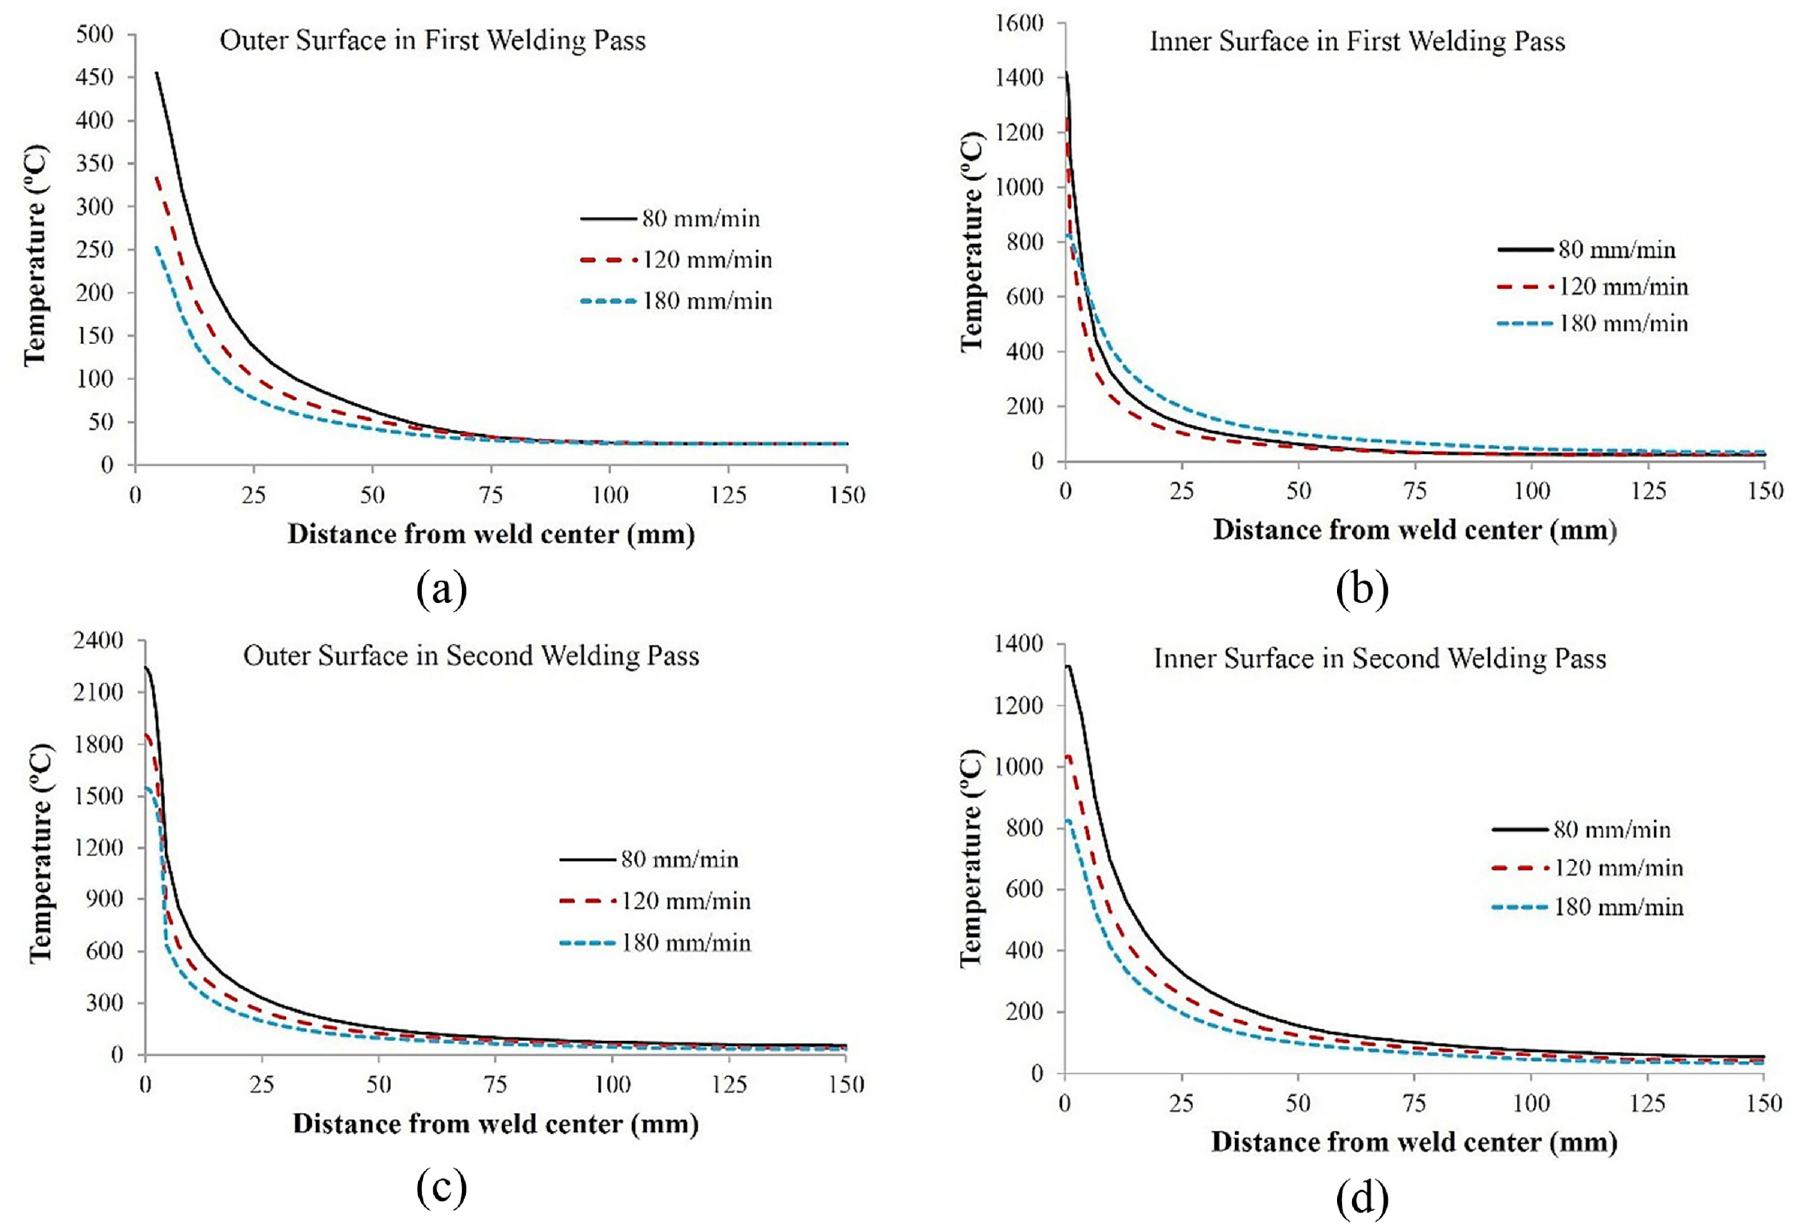
The peak temperature distribution with distance perpendicular to the weld center line for the: (a and c) outer surface and (b and d) inner surface. (a and b) first pass of the weld and (c and d) second pass of the weld.
During the second pass, the peak temperature at the outer surface (Figure 8(c)) goes beyond the melting point and has reached to ∼2200°C (for the sample produced with the speed of 80 mm/min) due to the contact with the arc at the pipe outer surface. However, lower peak temperatures are expected at the lower layers toward the inner surface and it drops down to 1350°C at the inner surface of the sample produced with the welding speed of 80 mm/min (Figure 8(d)).
Volumetric change in macroscopic level
Macroscopic volumetric changes are due to the different expansion and cooling rates that occur in the top and the bottom surfaces of the weld as well as the welding zone and the HAZ. Indeed, the temperature variations during the welding will result in strength and volumetric variations in the weldment and the surrounding material. Therefore, the thermal expansions will be restricted by the inclosing material which are themselves changing in the strength and volume. These changes lead to generation of different stress types at different locations.
During the welding, the surfaces of the weldment have a higher cooling rate than the core of the weld. This leads to differential expansion and contraction along the thickness of the weldment. While the materials in the core zone are still hot the contraction of the metal near the surface occurs leading to generation of the tensile and compressive residual stresses at the surface and in the core of weldment, respectively (Figure 6). 31
Volumetric change in microscopic level
Microscopic volumetric changes are due to the metallurgical transformations. During welding of the steel, the weld nugget and the HAZ experience inevitably transformation of austenite into other phases such as pearlite, bainite or martensite, causing an expansion in the specific volume of metal at a microscopic level. Austenite to pearlite and bainite transformations, taking place at high temperatures, will result in an increase in the specific volume. Additionally, these phases normally have low yield strength and high ductility. Also, the phase mixture occurs at the high temperatures (above 550°C). Austenite to martensite transformation occurs at the very low temperatures with significant expansion in specific volume.
Thus, these transformations significantly cause the development of residual stresses. As mentioned before, the residual stresses could be tensile or compressive depending upon the type and the position of this transformation. For instance, in shallow hardening, the austenite to martensite transformation occurs at the surface layers and generates compressive residual stress at the surface and, for the balancing, in the core the tensile stress will be generated. However, through section hardening will result in a reverse trend in the residual stresses, as the tensile residual stress will be formed at the surface layers and the compressive one in the core.
In this study, the axial stress is observed in the outer and inner surfaces. In the outer surface due to shallow hardening resulted from quenching and austenite to martensite transformation, the axial residual stress in the weld center is compressive. Oppositely, due to the shrinkage, it is tensile in the points between ∼15 to ∼60 mm far from the weld center (Figure 6(a)). Both tensile and compressive residual stresses exist in a welding component, but they are distributed at different locations. Specific treatments in certain locations, according to the residual stress distribution data, would be effective for the residual stress reduction and attaining a better quality of the weldment. Therefore, recognition of the welding residual stress distribution is crucial to gain better weld quality and reduce the destructive effects in the welded components.
The residual stress distribution is almost opposite in the outer and inner surfaces in a welded pipe. The axial residual stress at HAZ on the inner surface is compressive, while it is tensile on the outer surface of the pipe (Figure 6(a) and (b)).
Considering the hoop stress, it is mostly tensile except in small regions with a lower amplitude of the compressive stress in comparison to the axial stress.32,33 The residual hoop stress distributions have a wavy form in distances lower than ∼50 mm (Figure 6(c) and (d)). The distribution of hoop stresses on the inner surface are the same as the axial stress whereas the magnitude of the tensile stress at the weldment centerline is much smaller. The axial residual stresses have a key role to determine the hoop residual stresses in the fusion zone and its surrounding area for the equilibrium on the inner surface. Furthermore, the axial tensile residual stress at the weld root is very crucial because potentially initiates the fatigue crack. Thus, focusing on the axial residual stresses is essential. 30
Stress versus the welding speed
Figures 9 and 11 show the contour plot and peak value curves of the axial, hoop, and von-Mises, residual stresses on the outer and inner surfaces of the welded pipes at different welding speeds in two- and three-pass welds. The results of these figures along with the effect of the welding speed and the pass number is discussed in the following subsections.
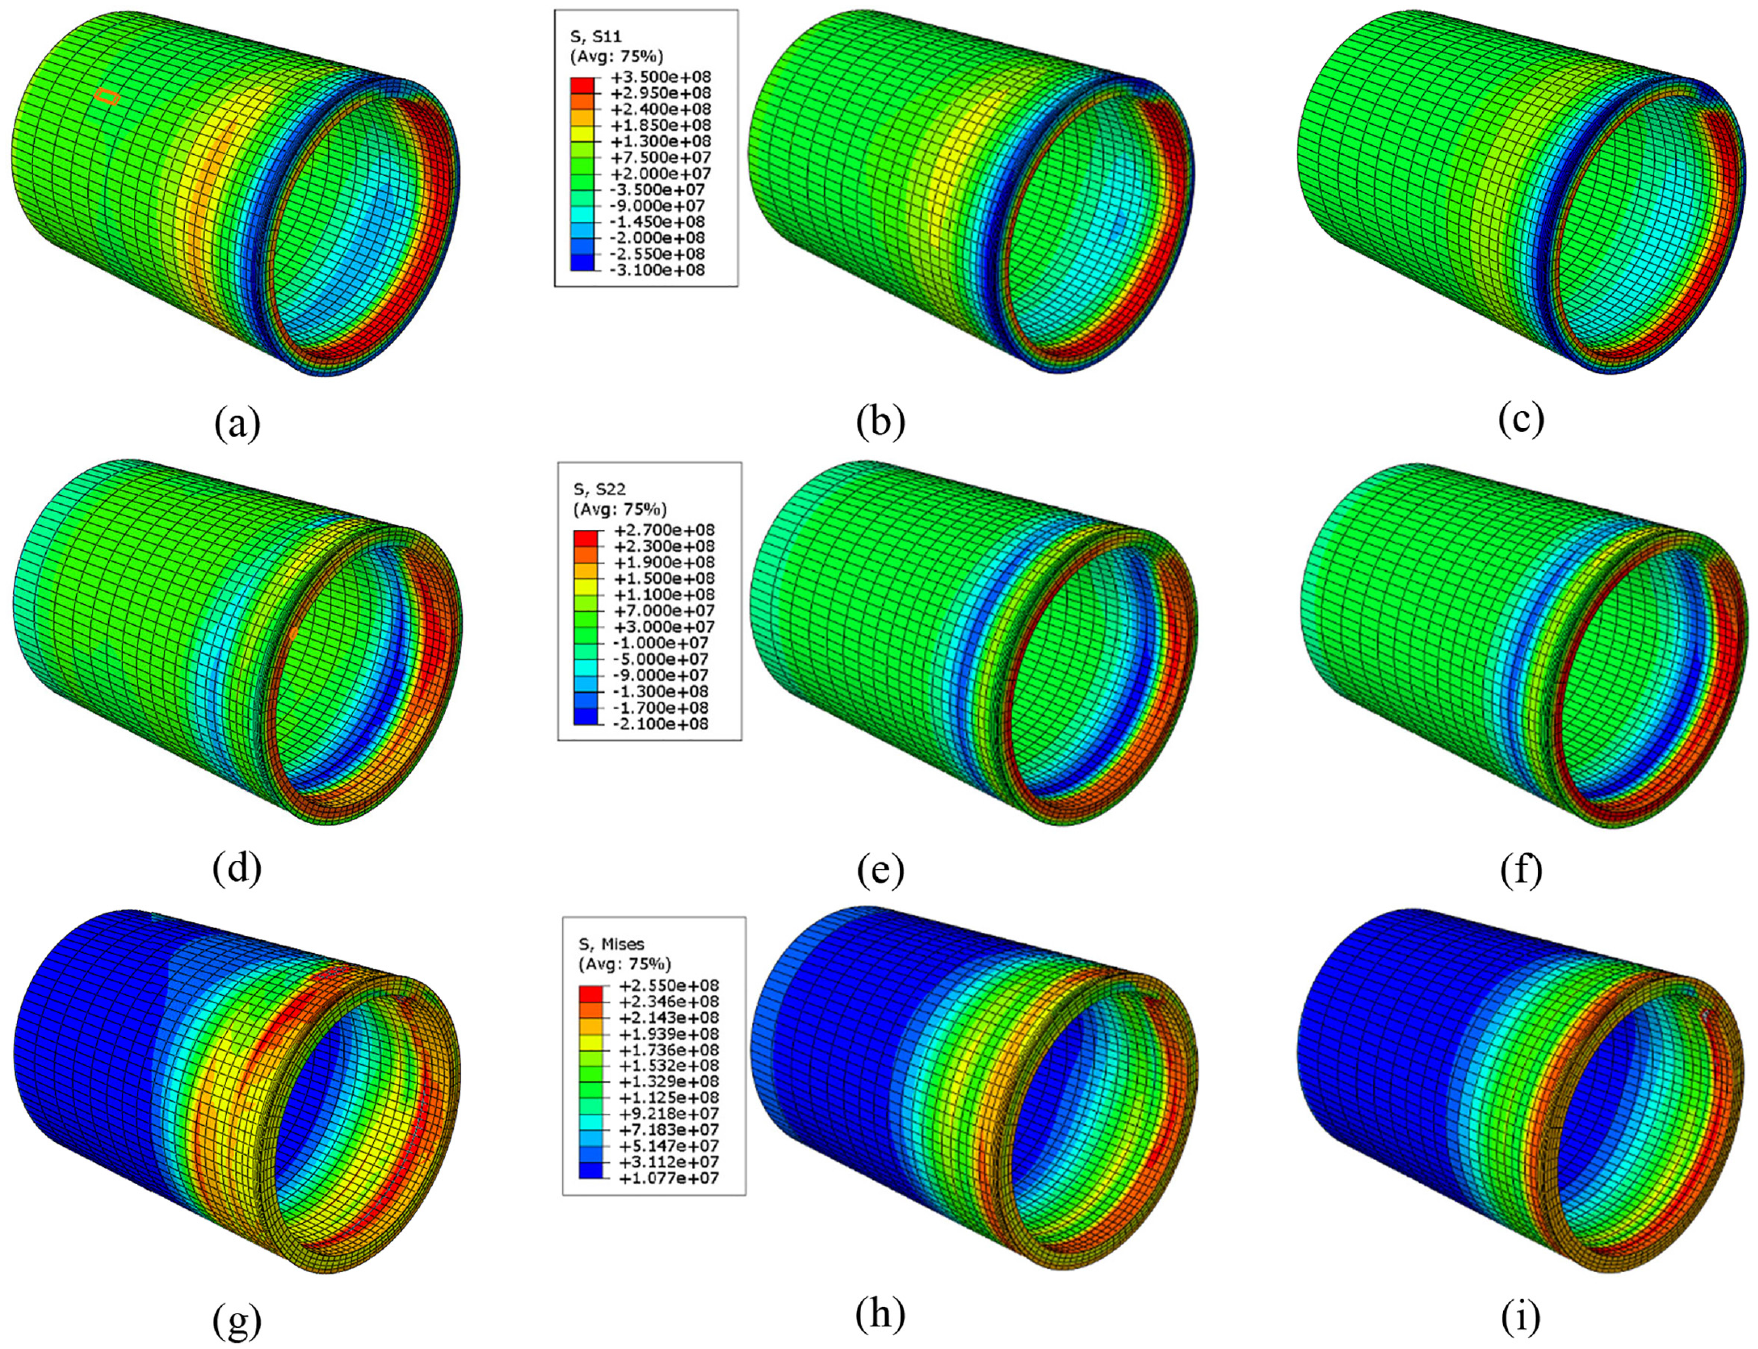
Counter plot of the axial and hoop residual stresses for the two-pass welding at different welding speeds of: (a, d, and g) 80 mm/min, (b, e and h) 120 mm/min, and (c, f, and i) 180 mm/min. (a–c) axial residual stress, (d–f) hoop residual stress, and (g–i) von-Mises residual stress.
Stress versus the welding speed in two-pass welding
The residual stress distribution plots of the axial, hoop, and von-Mises residual stresses for two-pass welding are shown in Figure 9, for three different speeds of 80, 120, and 180 mm/min. The curves of the peak residual stress versus the distance from the weld center is shown in Figure 10. Figure 10(a) to (f) provide the axial, hoop, and von-Mises residual stresses at the outer and inners surfaces of the welded pipes at the angle of 45° from the welding start.
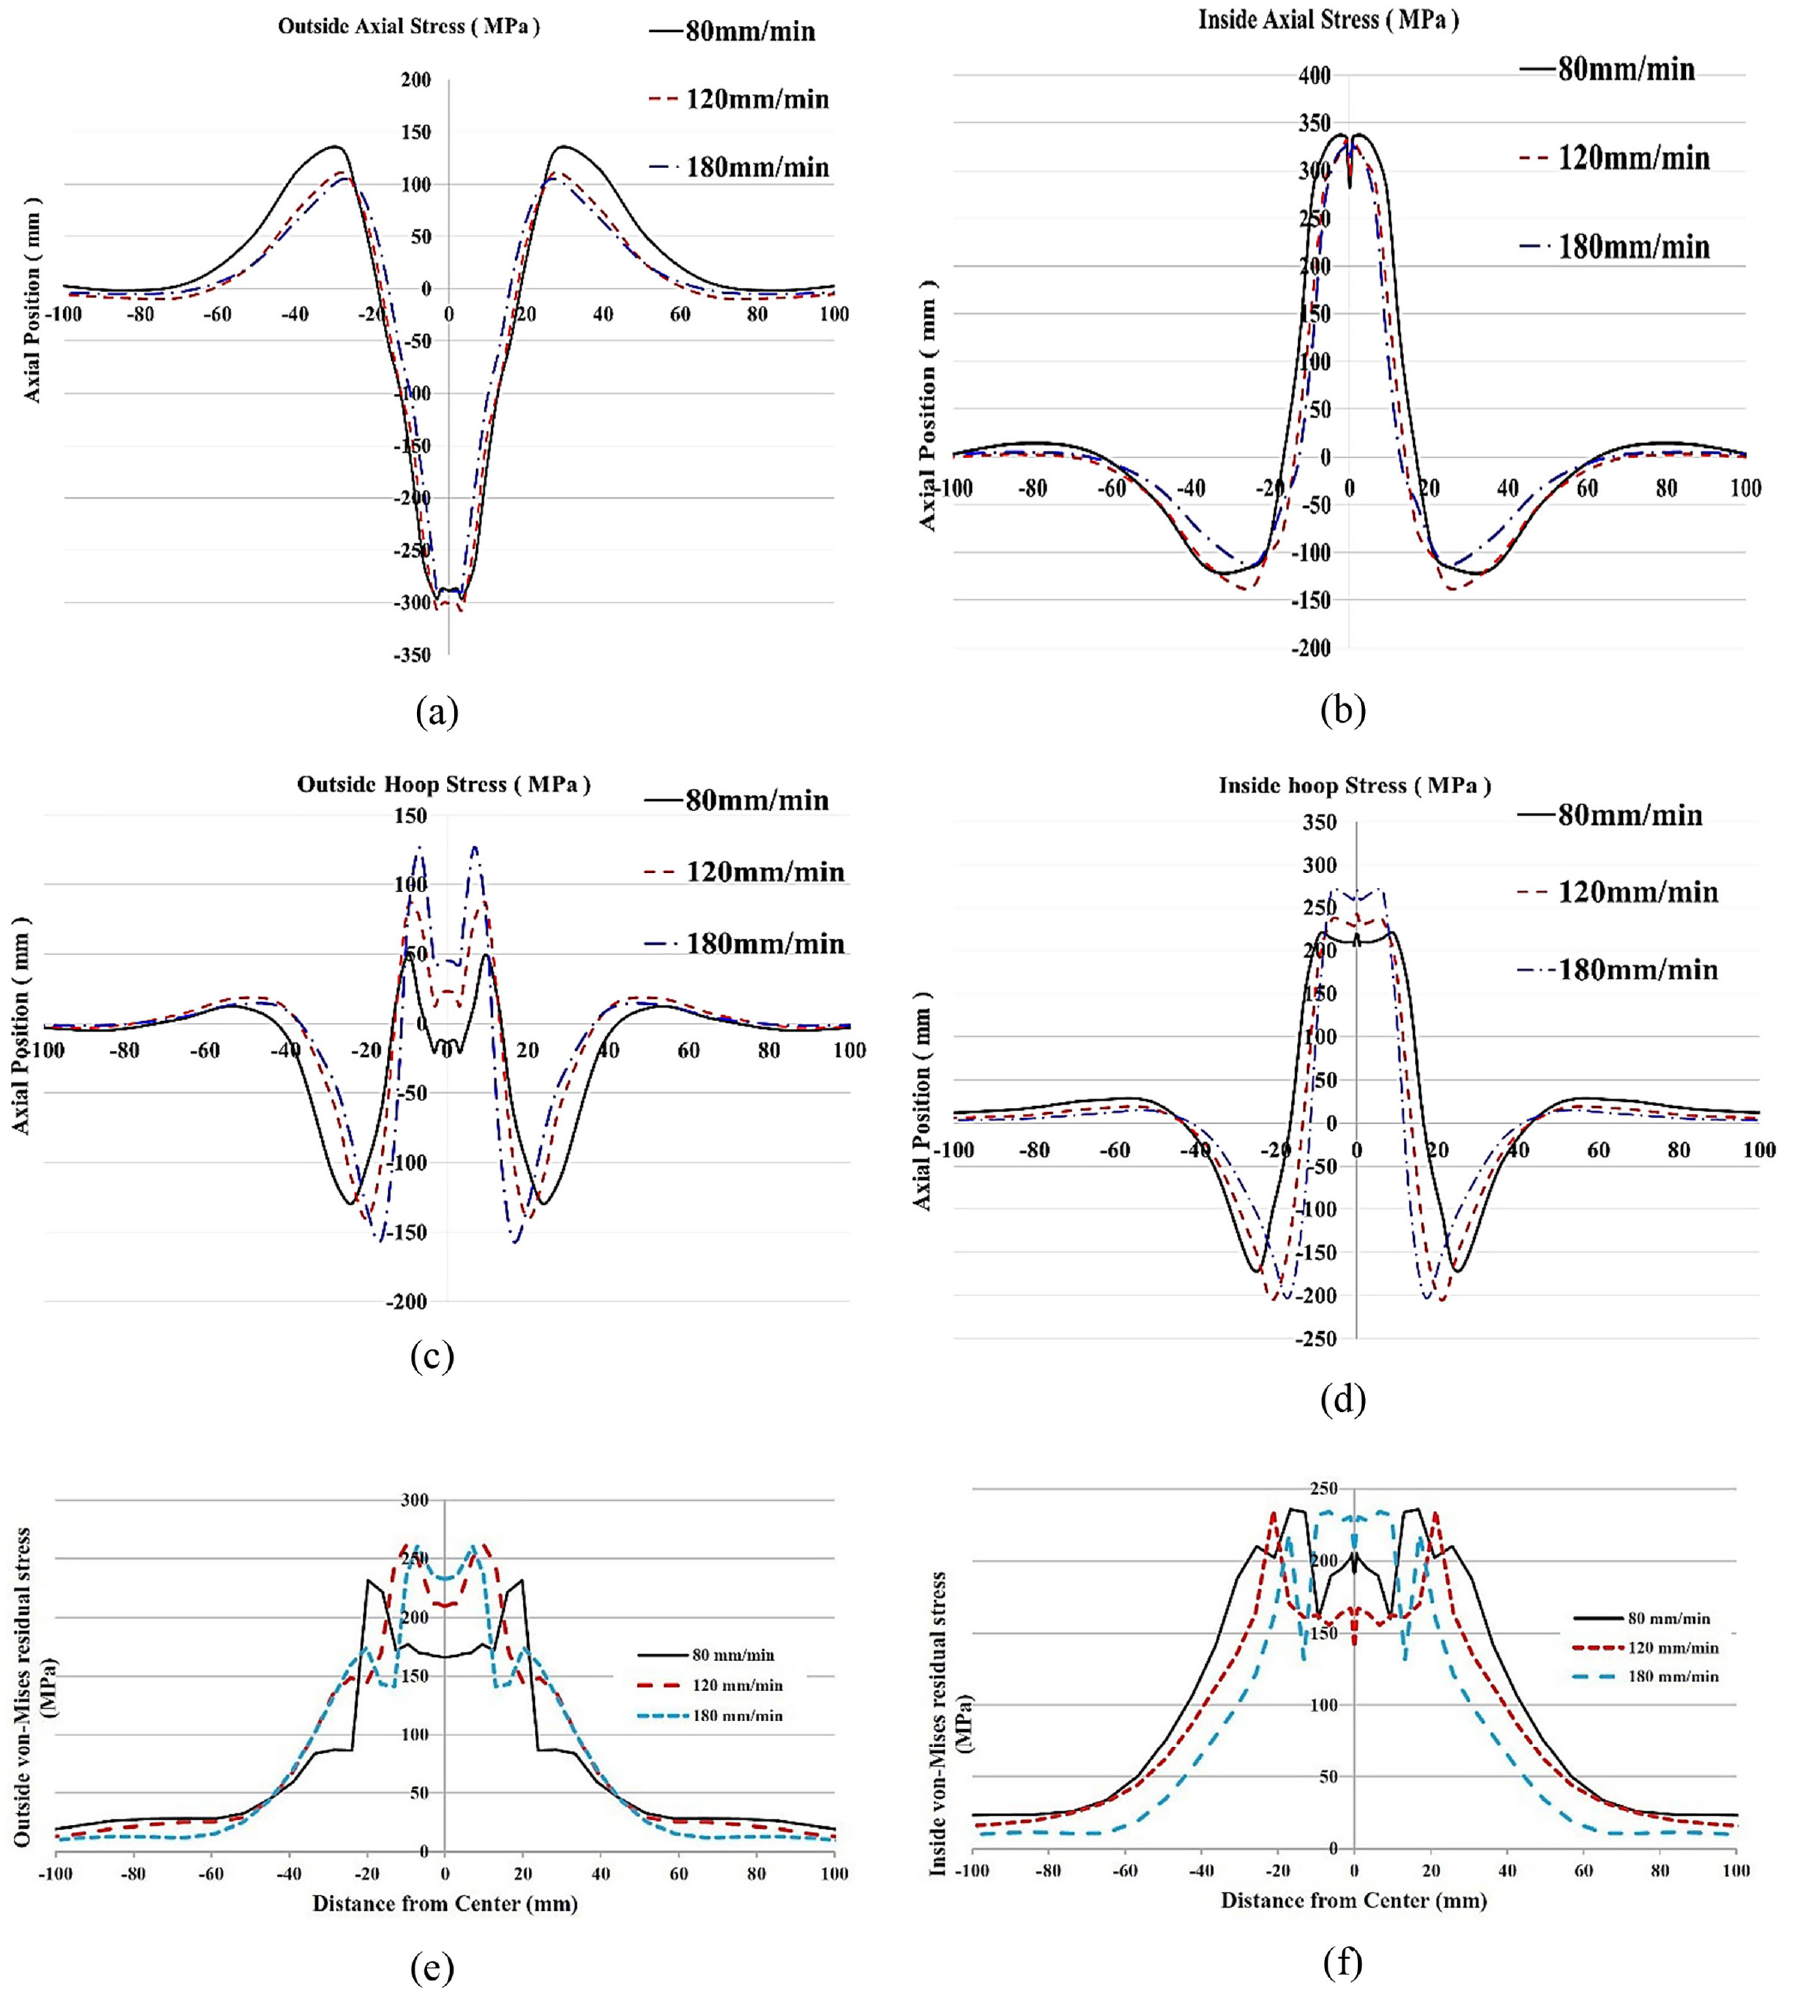
Residual stresses distribution in the welding speeds of 80, 120, and 180 mm/min for the two-pass welding: (a) axial stress on the outer surface, (b) axial stress on the inner surface, (c) hoop stress on the outer surface, (d) hoop stress on the inner surface, (e) von-Mises stress on the outer surface, and (f) von-Mises stress on the inner surface.
Considering the axial stress on the outer surfaces of the pipe (Figure 10(a)), it can be mentioned that the axial stress is compressive in the weld center. However, going far from the weld center its amount decreases and in the points beyond ∼16 mm distance from the weld center, the residual stress transforms to tensile one. Furthermore, it can be concluded from the figure that, as the welding speed raises, the tensile axial stress (in the HAZ) decreases. However, the variation of the compressive stress in the weld center is negligible (Figure 10(a)). With increasing the welding speed from 80 to 180 mm/min, the peak of the tensile axial stress on the outer surface is reduced from135 to 104 MPa, and the peak of the compressive stress is decreased from 297 to 290 MPa. It is worth mentioning that a higher welding speed produces a narrower width of zone experiencing the residual stress. Because, with an increase in the welding speed the amount of the material affected by the heat input and axial residual stresses will be reduced. This narrower width influences on the transverse shrinkage of the weldment and may result in a lower axial residual stress. 34 Furthermore, with an increase in the welding speed, heat input will be reduced and may result in smaller stresses, but considering previous studies, some have mentioned that the heat input just has a little influence on the welding residual stress. 35
Figure 10(b), illustrating the axial residual stress distribution on the inner surface of the pipe, reveals that the axial residual stress is tensile at the center and compressive at the regions beyond ∼16 mm distance from the center. This type of residual stress distribution was expected according to the aforementioned discussions. Additionally, the figure shows that by increasing the welding speed, although the stress variation is negligible, there is a decrease in the peak tensile stress in the weld center. The peak of the tensile axial stress on the inner surface of the pipe is decreased very slightly from 336 to 329 MPa with increasing the welding speed from 80 to 180 mm/min. However, the peak of the axial compressive stress on the inner surface shows no significant change over the welding speed variation.
Considering the hoop stress on the outer surface of the pipe (Figure 10(c)), it can be concluded that as the welding speed raises, the peak residual hoop stress is increased slightly. This occurs for both the tensile stress in the weld center and the compressive stress in the regions beyond 12 mm distance from the weld center. However, it seems that the width of the zone undergone on the residual stress become narrower using the higher welding speeds. The peak of the tensile hoop stress on the outer surface of the pipe is increased with the speed, from 49 to 127 MPa. Indeed, by decreasing the welding speed, although the heat input and the peak temperature increase, the cooling rate after solidification decreases (see Figure 8), which leads to a decrease in the residual stress. However, the width of the zone experiencing the residual stress is expanded.
Observing the hoop stress on the inner surface of the pipe (Figure 10(d)), similar results (comparing to the outer surface) can be concluded. So that, increasing the welding speed results in an increase in the peaks of the compressive and tensile residual stresses; and a little bit decrease in the width of the zone experiencing the residual stress. The peak tensile hoop stress on the inner surface is increased with the speed, from 220 to 269 MPa.
Figure 10(e) and (f) show the von-Mises residual stress on the outer and inner surfaces of the pipe. Similar trends can be attained by the von-Mises residual stress results for the welding speed variations. The maximum von-Mises residual stress is sometimes very close to the yield strength of the SUS304.
Stress versus the welding speed in three-pass welding
Unlike the two-pass process, looking at Figure 11(a) on the outer surface, the peaks of the tensile axial residual stress in three-pass weld show a minor change with the welding speed variations. With increasing the speed from 80 to 180 mm/min, the peak of the tensile axial stress on the outer surface changed from 105 to 102 MPa, and the peak of the compressive stress reduced from 217 to 207 MPa. Indeed, by increasing the weld pass number, the effect of the welding speed on the tensile axial residual stress is declined.
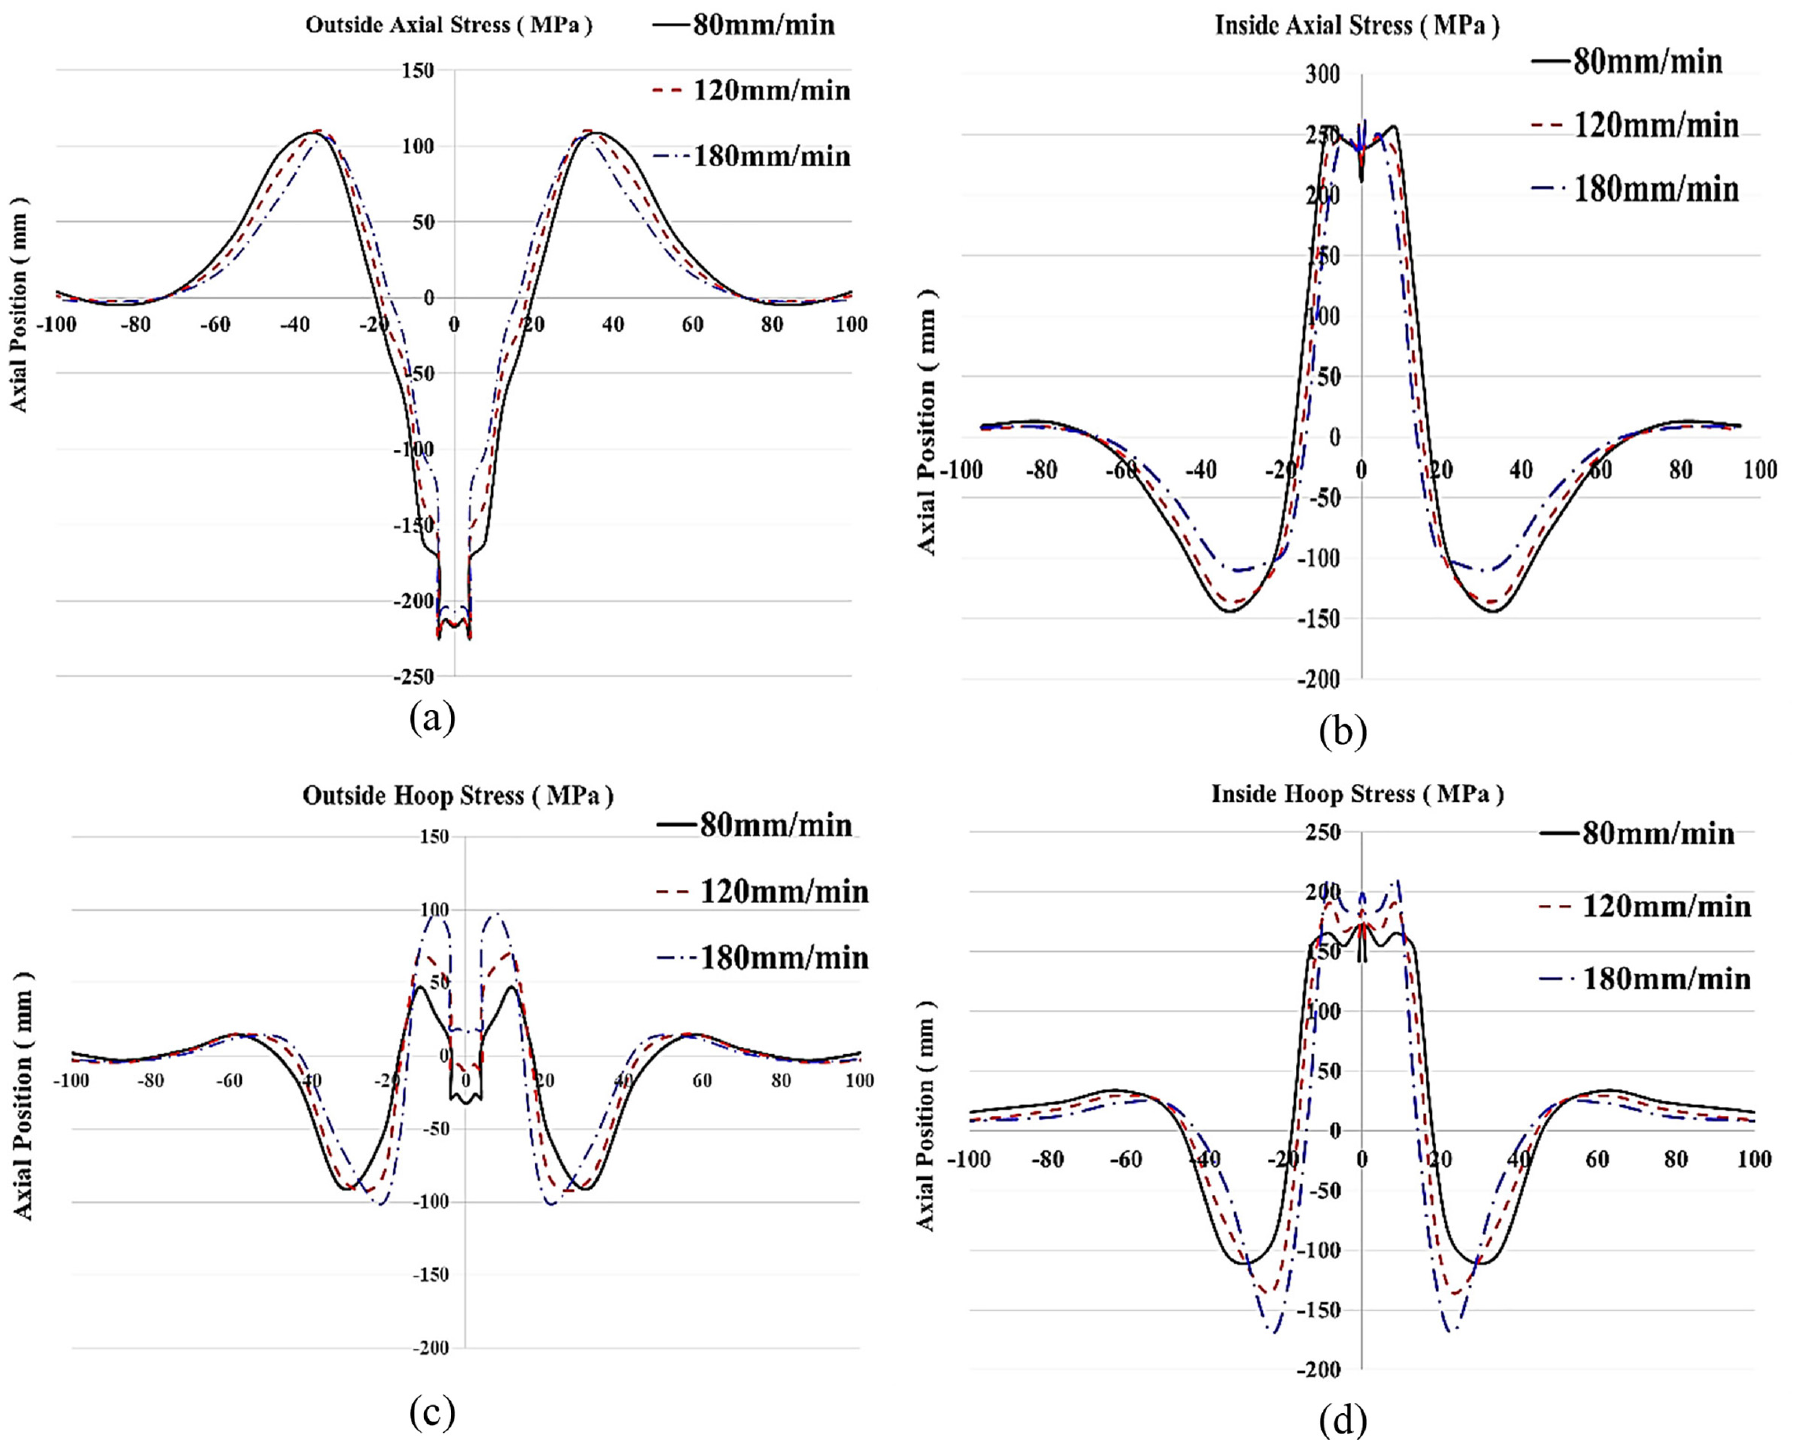
Residual stress distribution in the welding speeds of 80, 120, and 180 mm/min in the three-pass welding: (a) axial stress on the outer surface, (b) axial stress on the inner surface, (c) hoop stress on the outer surface, and (d) hoop stress on the inner surface.
Similarly, the peak of the tensile axial stress on the inner surface of the pipe has no significant changes versus the welding speed (Figure 11(b)). However, the peak of the axial compressive stress on the inner surface declined from 143 to 106 MPa by the speed increase. As shown in Figure 11(c) and (d), the peak of the tensile hoop stress is increased by the speed, from 46 to 96 MPa for the outer surface, and from 171 to 208 MPa for the inner surface.
Generally, by comparing Figures 10 and 11, it can be deduced that the peak residual stresses in the three-pass welding is significantly lower than those in the two-pass TIG welding. For instance, comparing Figures 10(a) and 11(a), in the welding speed of 180 mm/min, the compressive stress at the center is reduced from 290 MPa in the two-pass weld to 205 MPa in the three-pass weld. Looking at Table 5, although the welding condition (voltage and current of welding) is almost the same for two- and three-pass welds, the weld deposition rate in the three-pass weld is lower than that in the two-pass weld. This lower weld metal deposition rate in the three-pass weld cause to lower residual stress in the pipe. Actually in a constant pipe thickness, using rational higher weld passes with a lower deposition rate will result in lower residual stress.
Furthermore, it should be noticed that the peak tensile stress in the inner axial residual stress is 336 and 250 MPa for the two-pass and three-pass welds, respectively. Comparing with the yield stress of the base material (265 MPa), the amount of the tensile residual stress in the case of the two-pass weld is greater than the base material yield strength. The presence of such high tensile residual stresses can cause material failure. Thus, the possibility of defect-free weld production is higher using the three passes of weld in comparison with the two-pass weld.
Stress versus the heat input variations
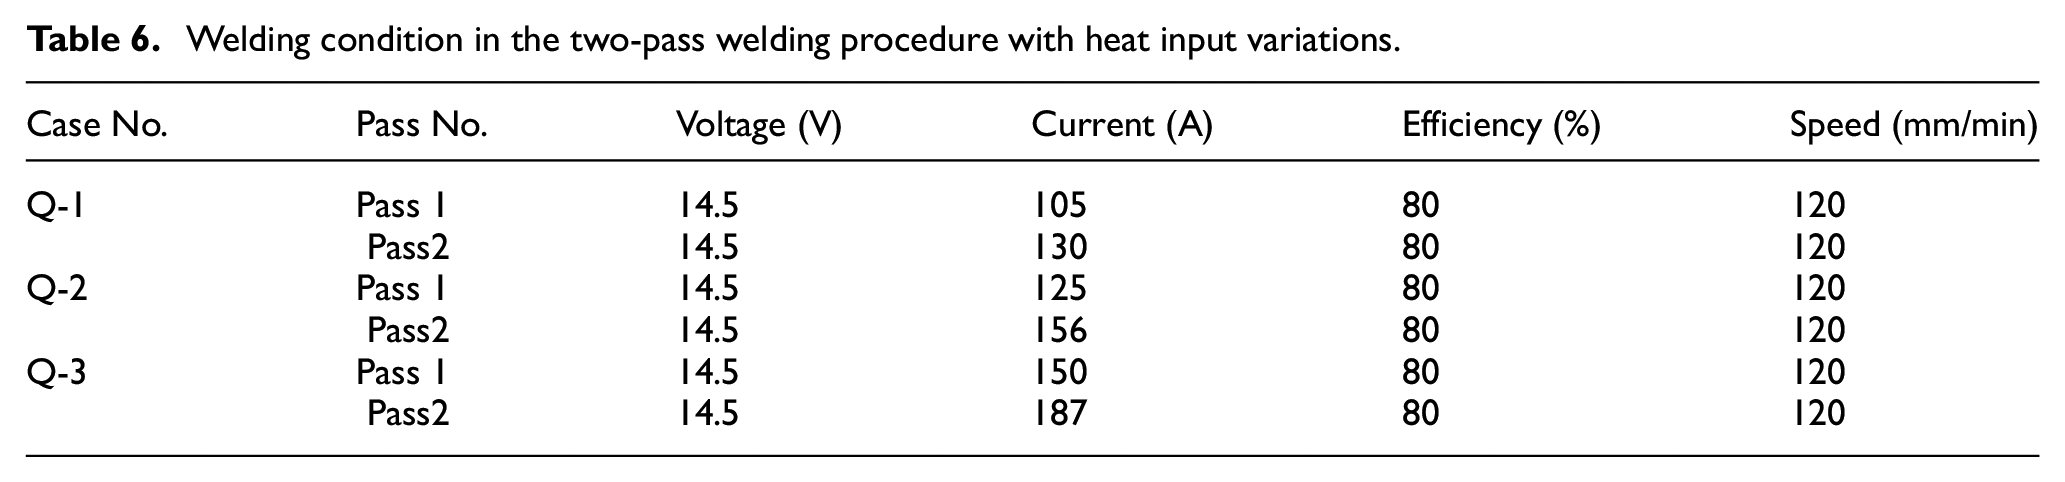
In order to clarify the influence of the heat input on the residual stresses, other tests are designed. The thermal and mechanical analysis, similar to section three, is obtained to investigate the effect of the heat input variations on the internal and external residual stresses. The welding conditions for the first (Q-1), the second (Q-2), and the third (Q-3) cases are summarized in Table 6. As it is clear from the table, the heat input is increased by almost 20% from case 1 to case 2 and similarly from case 2 to case 3. In all cases, the electrode moving speed was fixed with the value of 120 mm/min. The residual stress results around the weld line, are illustrated in Figure 12 for different stress types and locations as well as the heat inputs.
Welding condition in the two-pass welding procedure with heat input variations.
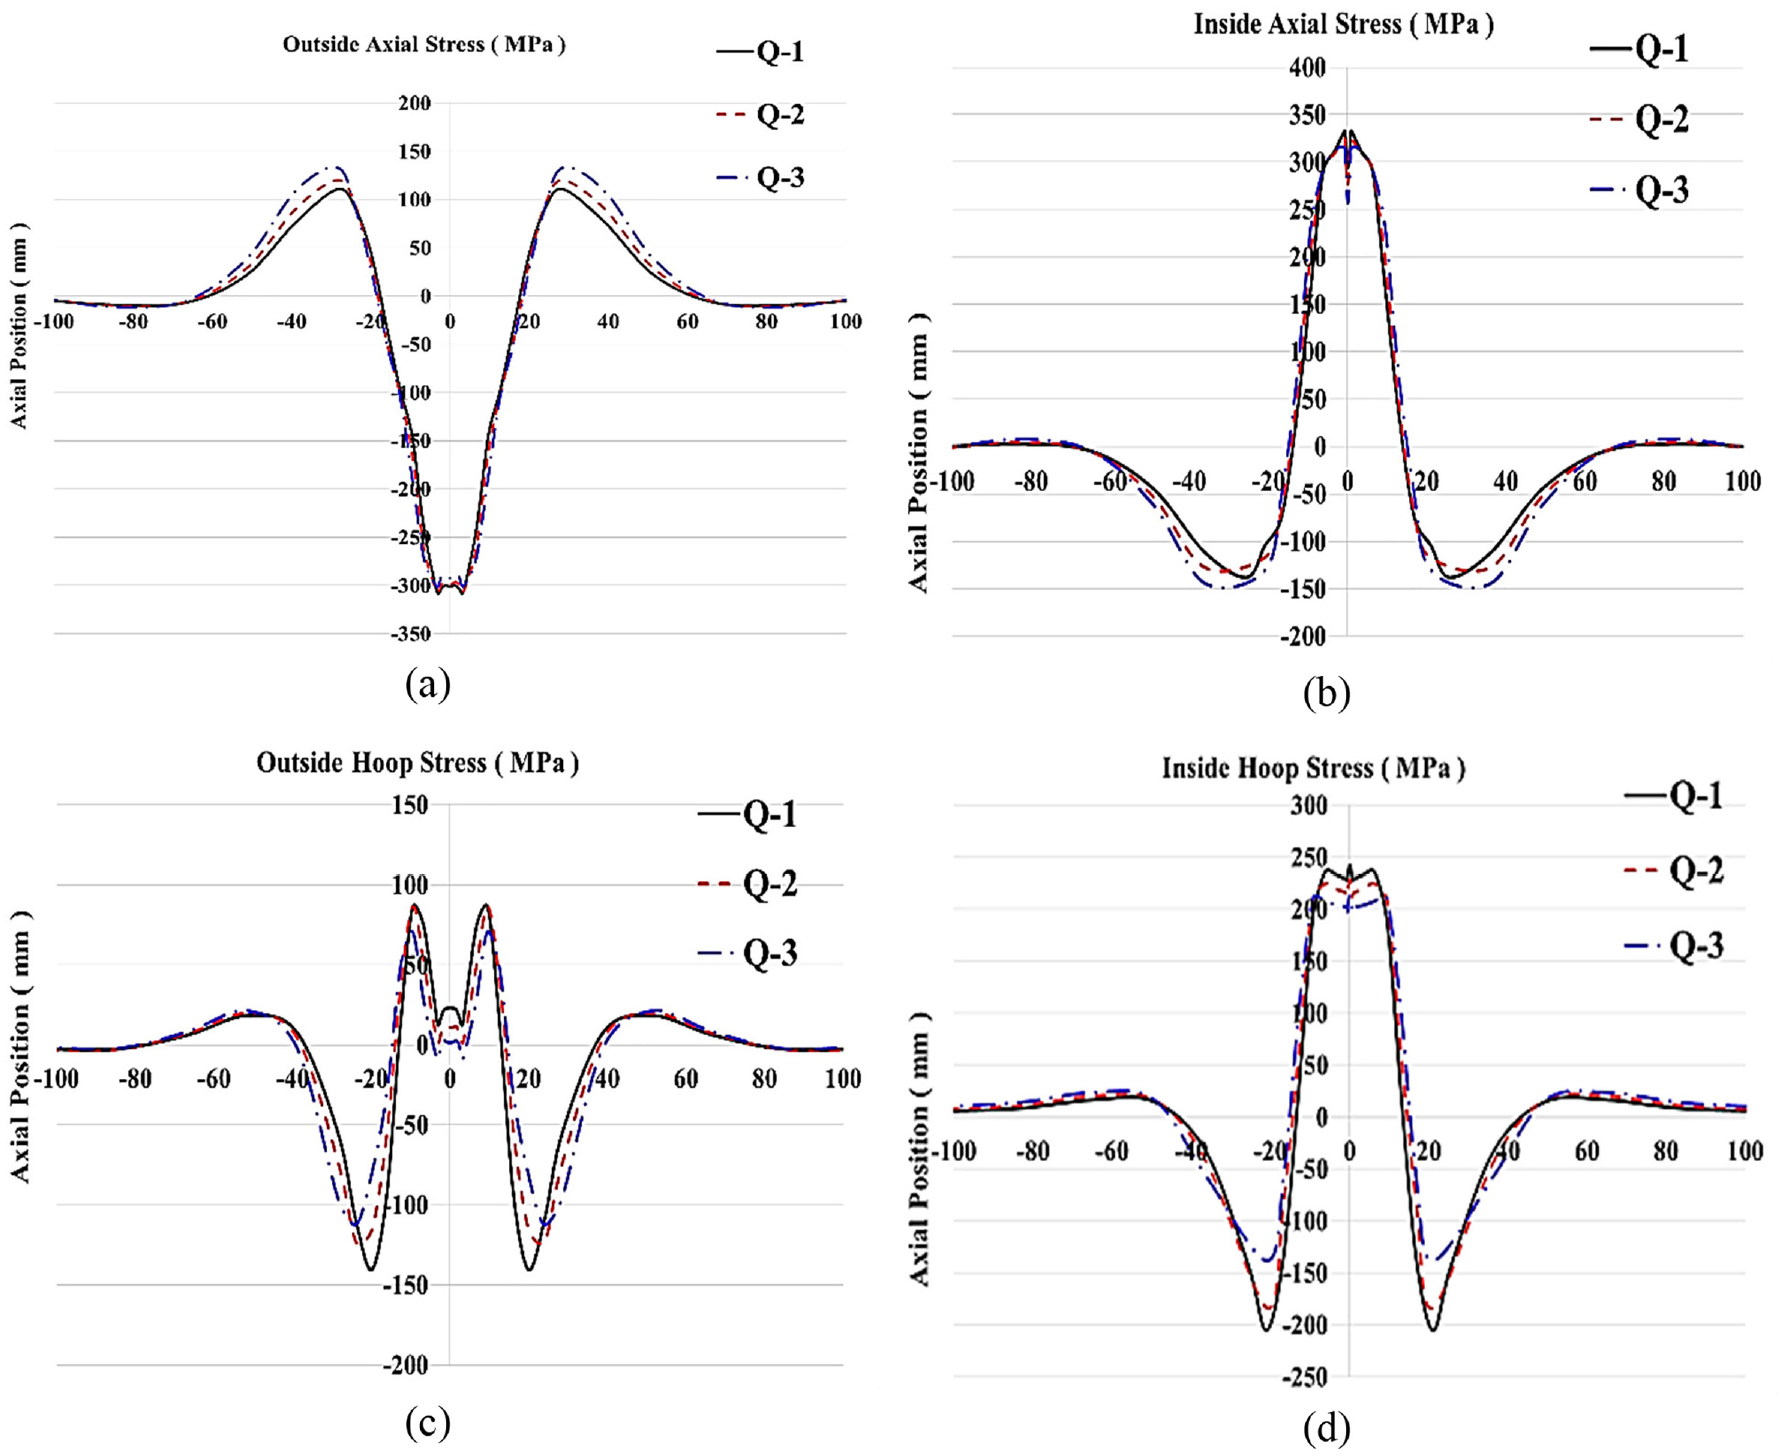
Residual stress distribution curves under different heat inputs: (a) axial stress on the outer surface, (b) axial stress on the inner surface, (c) hoop stress on the outer surface, and (d) hoop stress on the inner surface.
The effect of the heat input on the axial residual stress on the outer surface is illustrated in Figure 12(a). It is obvious that the peak axial tensile stress in the HAZ is increased from 110 to 135 MPa on the outer surface of the pipe by increasing the heat input from Q-1 to Q-3. However, the compressive residual stress at the weld center is not changed significantly. These observations are in good compatibility with previous researches.35,36 In the inner surface of the pipe, the heat input variations has a negligible effect on the tensile axial residual stress (Figure 12(b)).
The effect of the heat input on the hoop residual stress on the outer surface is shown in Figure 12(c). From the figure, it can be found that an increase in the heat input results in a decrease for both of the compressive and tensile residual stresses. The results maybe are attributed to the fact that by higher heat input over the welding process, the cooling rate is reduced and more time is needed for the material to cool down. This extended time allows the material to release a bit more from the stresses or actually produce less stress over the cooling process. 37
The hoop residual stress results in the inner surface of the pipe are shown in Figure 12(d). Similar results are achieved for the inner surface by the heat input raise, in comparison to that of the outer surface. So that the compressive residual stress is declined from 200 to 135 MPa and the tensile residual stress is reduced from 235 to 205 MPa by increasing almost 40% in heat input (from Q-1 to Q-3).
As a result, it is obvious that the peaks of the axial stresses in the weld center do not significantly change by the heat input variations. While the hoop residual stresses are significantly dependent on the heat input value. Additionally, considering Figure 12 in detail, one can be concluded that increase in the heat input leads to the distribution of the residual stresses in a wider zone.
Conclusion
In the present work, a numerical model is provided to analyze the temperature fields and residual stress states in multi-pass TIG welding of SUS304 stainless steel pipes, using the ABAQUS software. After validation of the proposed model, the effects of welding speed, heat input, and weld pass number on the axial and hoop stresses for the inner and outer surfaces of the SUS304 pipe were investigated. The results reveal that:
I-In the weld center, while the axial stress for the inner surface is tensile, it is compressive on the outer surface. Going far from the weld center, first the stress values are decreased and then, the stress type is changed reversely.
II-The hoop stress in the inner and outer surfaces is tensile around the weld center and in the distances far from ∼10 to 15 mm, the stress type changes to compressive one.
III-The maximum axial stress on the pipe decreases with increasing the welding speed. However, in the case of hoop stress, with increasing the welding speed, both of the tensile and the compressive stresses are increased. Furthermore, the width of the zone under the stress becomes narrower in the higher welding speeds. Furthermore, the effect of the welding speed on the hoop stress values is more considerable than that for the axial stresses.
IV-Using the three-pass welding results in much lower stresses in comparison with the two-pass welding process, as in some cases using two-pass welding will not lead to a defect-free weld.
V-The heat input has a little influence on the axial stress, but a tangible effect on the hoop stress. So that, 40% increase in the heat input, causes almost ∼5% changes in the peak axial stress. While it causes ∼20%–40% decrease in the hoop stress depending on the stress type (compressive or tensile) and position (in the inside or outside of the pipe).
Footnotes
Declaration of conflicting interests
The author(s) declared no potential conflicts of interest with respect to the research, authorship, and/or publication of this article.
Funding
The author(s) received no financial support for the research, authorship, and/or publication of this article.