
Abstract
In the present study, the effect of tool tilt angle was investigated to appraise the metallurgical and mechanical behavior of double-sided friction stir welded joints of AA-6061 T6 alloy of 6 mm thick plates, using scrolled shoulder and frustum tool pin geometry. Two friction stir welded joints, with 0° (Joint J1) and 2° (Joint J2) tool tilt angles were fabricated using a fixed travel speed of 50 mm/min and tool rotational speed of 800 rpm. The metallurgical studies carried out by the electron backscattered diffraction showed that the incorporation of tool tilt angle resulted in the refinement of grains within the stir zone to a larger extent. The transverse tensile test results revealed that the joint efficiency of the J2 welded joint improved by 12% as compared to the J1 joint. The layered tensile specimens extracted from the different regions (first pass, second pass, and overlap region) of the stir zone of both the welded joints showed an appreciable variation in mechanical and metallurgical properties. The V-notch Charpy impact toughness test for J2 joint showed 16% higher toughness, with the presence of a 55% shear area fraction in the fractured impact specimens, as compared to the 30% for the J1 joint.
Keywords
Introduction
Joining of low-density materials by obtaining sound and strong welds to improve the structural design, without compromising the safety and reliability, has always been of great interest for engineers. The extensive literature in the joining of lightweight alloys including aluminum and magnesium alloys revealed that these alloys could substitute the steel in aerospace 1 and automobile industry. 2 Providing a high strength-to-weight ratio, comparable stiffness and better mechanical properties could be the reason to use lightweight alloys. Among lightweight alloys, the aluminum 6XXX (Al-Si-Mg) series have shown wide application from many years in aircraft, aerospace, and the automobile because of its high strength to weight ratio, corrosion, and cracking resistance in unfavorable environmental conditions. Moreover, AA-6061 T6 possesses excellent weldability characteristics, owing to which, these alloys find substantial applications in storage tanks and aircraft frames. 3 Generally, the conventional welding processes have been used to join AA6061 aluminum alloys, but more often exhibited the formation of large heat-affected zones, alloying content evaporative loss, solidification cracking, etc. 4 Nevertheless, in many applications, the friction stir welding (FSW) process was found to be highly effective for joining similar as well as dissimilar alloys. The joining includes the lightweight alloys of aluminum and magnesium alloys,5–7 dissimilar joining of Al-Mg,2,6 Ti-Al, 8 Cu-Al,9–10 etc. with low distortion and residual stresses.
Although, the FSW process was highly successful in eliminating the problems associated with the arc welding of AA6061 aluminum alloys, however, the joining of thick plates of these alloys using single side friction stir welding (SS-FSW) suffered due to certain difficulties. Chen et al. 11 observed the inadequate flow of material by the tool pin, which resulted in a root defect in the backside of the welded plates of 4.5 mm thick of AA 6063 metal matrix alloy during the SS-FSW. To address the problem, Chen et al. 12 suggested that the application of double-sided friction stir welding (DS-FSW) can eliminate the root defect caused due to poor penetration of the tool pin. Experimental studies reported in the literature, further revealed, that the joining of thick plates with the SS-FSW process was limited by many other constraints, like, pin length of the rotating tool, loading capacity of the machine, etc. It was observed that the single-pass joining of thick plates required larger pin length, which is subjected to greater forces in the transverse and longitudinal directions and results in the fracture of the pin, or some cases the tool wear owing to large heat generation. 13 A similar observation was also observed by Siddiquee et al. 14 during the joining of thick plates of steel using SS-FSW. In this regard, the joining of thick plates using DS-FSW using reduced tool pin length could help in overcoming the stresses imposed on the pin and consequently could lower the chances of tool failure and tool wear. Hejazi et al. 15 experimentally investigated the consequence of tool pin penetration by varying the pin length in DS-FSW of AA6061-T6 (4 mm thick) material and found a defect-free welded joint with an increase of ultimate tensile strength (UTS) compared to the SS-FSW. Moreover, the detailed study of the thermal variations within the stir zone (SZ) by Xu et al. 16 revealed that the uneven plastic deformation caused due to the large thermal gradient during SS-FSW was reduced by the use of DS-FSW.
Studies conducted on the efficacy of the FSW process to fabricate defect-free joints of aluminum alloys, revealed that a close correlation exists between tool rotational speed, travel speed, tool tilt angle, and tool geometry on the material flow,17–18 and hence on the metallurgical and mechanical properties. Apart from tool rotational speed, the tool tilt angle and tool geometry was found to have a profound influence on the pattern and behavior of material flow within the welded joint. Zhai et al. 19 studied the effect of tilt angle on the material flow and observed that the material flow nearby the tool shoulder was intensified and skewed toward the leading side using a 2.5-degree tilt angle. Aghajani et al. 20 studied the contribution of tool tilt angle on the joint strength and analyzed that tilt angle played an important role in the stirring and filling action during the FSW process. 21 Further, it is extensively reported in the literature, that the forging force applied by the FSW machine on the substrate material, through the tool shoulder, embrace the plastically deformed material, and transfer it from the advancing side (leading edge) to the retracting side (trailing edge) of the welded joint. 22 Embossing the scrolled geometry23,24 on the cross-section of the tool shoulder and conical pin profile 25 was reported to push the plastically deformed substrate material in the inward direction from the outer edge of the shoulder, which consequently improved the metallurgical structure and mechanical properties of the welded joint. Apart from the significant effect of tool shoulder geometry, the tool pin configuration was reported to play a substantial role in influencing the material flow within the SZ of the welded joint. 26 Despite the importance of tool tilt angle and tool geometry on the material flow behavior of plastically deformed material, limited work has been reported so far, where the simultaneous effect of tool tilt angle, scrolled tool geometry, and frustum threaded pin on the mechanical behavior of DS-FSW aluminum alloys have been reported.
Pertaining to the comprehensive literature surveyed, and the significant importance of process parameters and DS-FSW in addressing the problems associated with SS-FSW, the 6 mm thick AA-6061 T6 aluminum alloy plates were friction stir welded in double side configuration. Two different joints with
Material and method
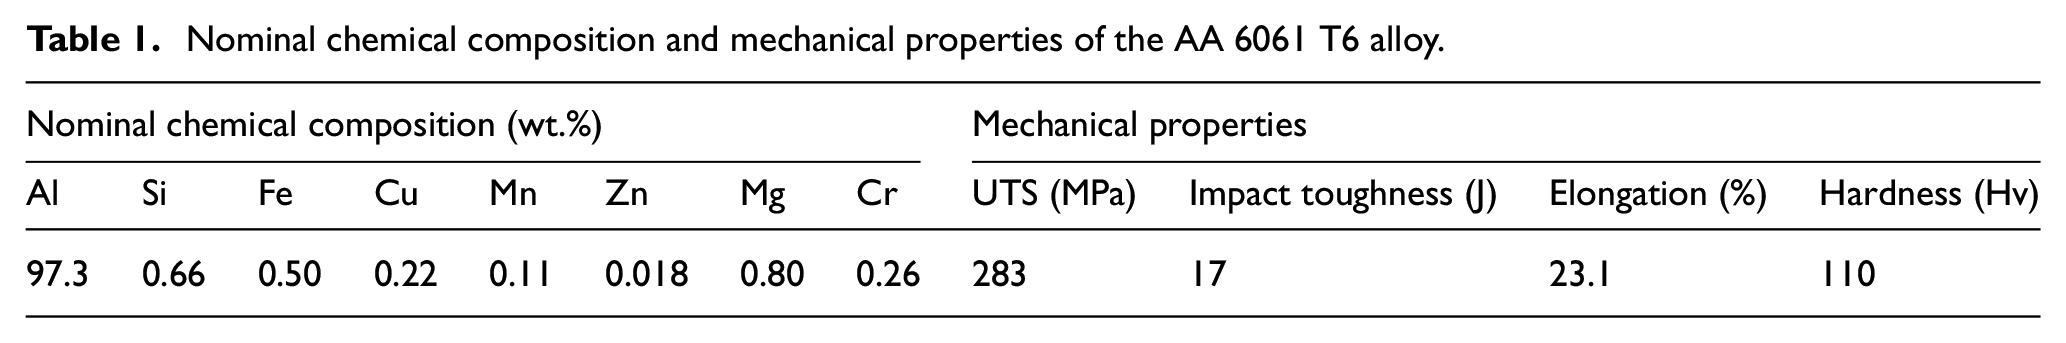
The 6 mm thick aluminum alloy of grade AA-6061 T6 was used as a base material for the DS-FSW joint. The chemical composition and mechanical properties of the base material were measured experimentally and, are given in Table 1.
Nominal chemical composition and mechanical properties of the AA 6061 T6 alloy.
The DS-FSW welding was conducted on a Hurriico-VM10 milling machine of 16 HP motor, and the detailed setup is shown in Figure 1(a). The specially designed tool (AISI H13 tool steel) consists of a conical pin with left-hand threads, and a clockwise spiral on the cross-section of the shoulder. The features provide the additional inward flow to the material from the shoulder edge to the pin. 27 Figure 1(b) shows the schematic illustration of the process, tool shoulder end features, and detailed dimension of the tool geometry. The final welds were made at two different welding conditions (Table 2) to evaluate the effect of tilt angle on mechanical properties of DS-FSWed joints. Condition I (hereafter refer as J1): 800 RPM-50 mm/min, 0-degree tilt angle, and Condition II (hereafter refer as J2): 800 RPM-50 mm/min, 2-degree tilt angle. For each weld, the passes (1st pass and 2nd pass) were laid down at the same welding conditions. Moreover, after the first pass of the weld, the plates were reversed about an axis perpendicular to the plate rolling direction for holding the same position of advancing side (AS) and retracting side (RS) for the second pass. Figure 2 shows the visual quality of each weld pass obtained after the successful DS-FSW joint.
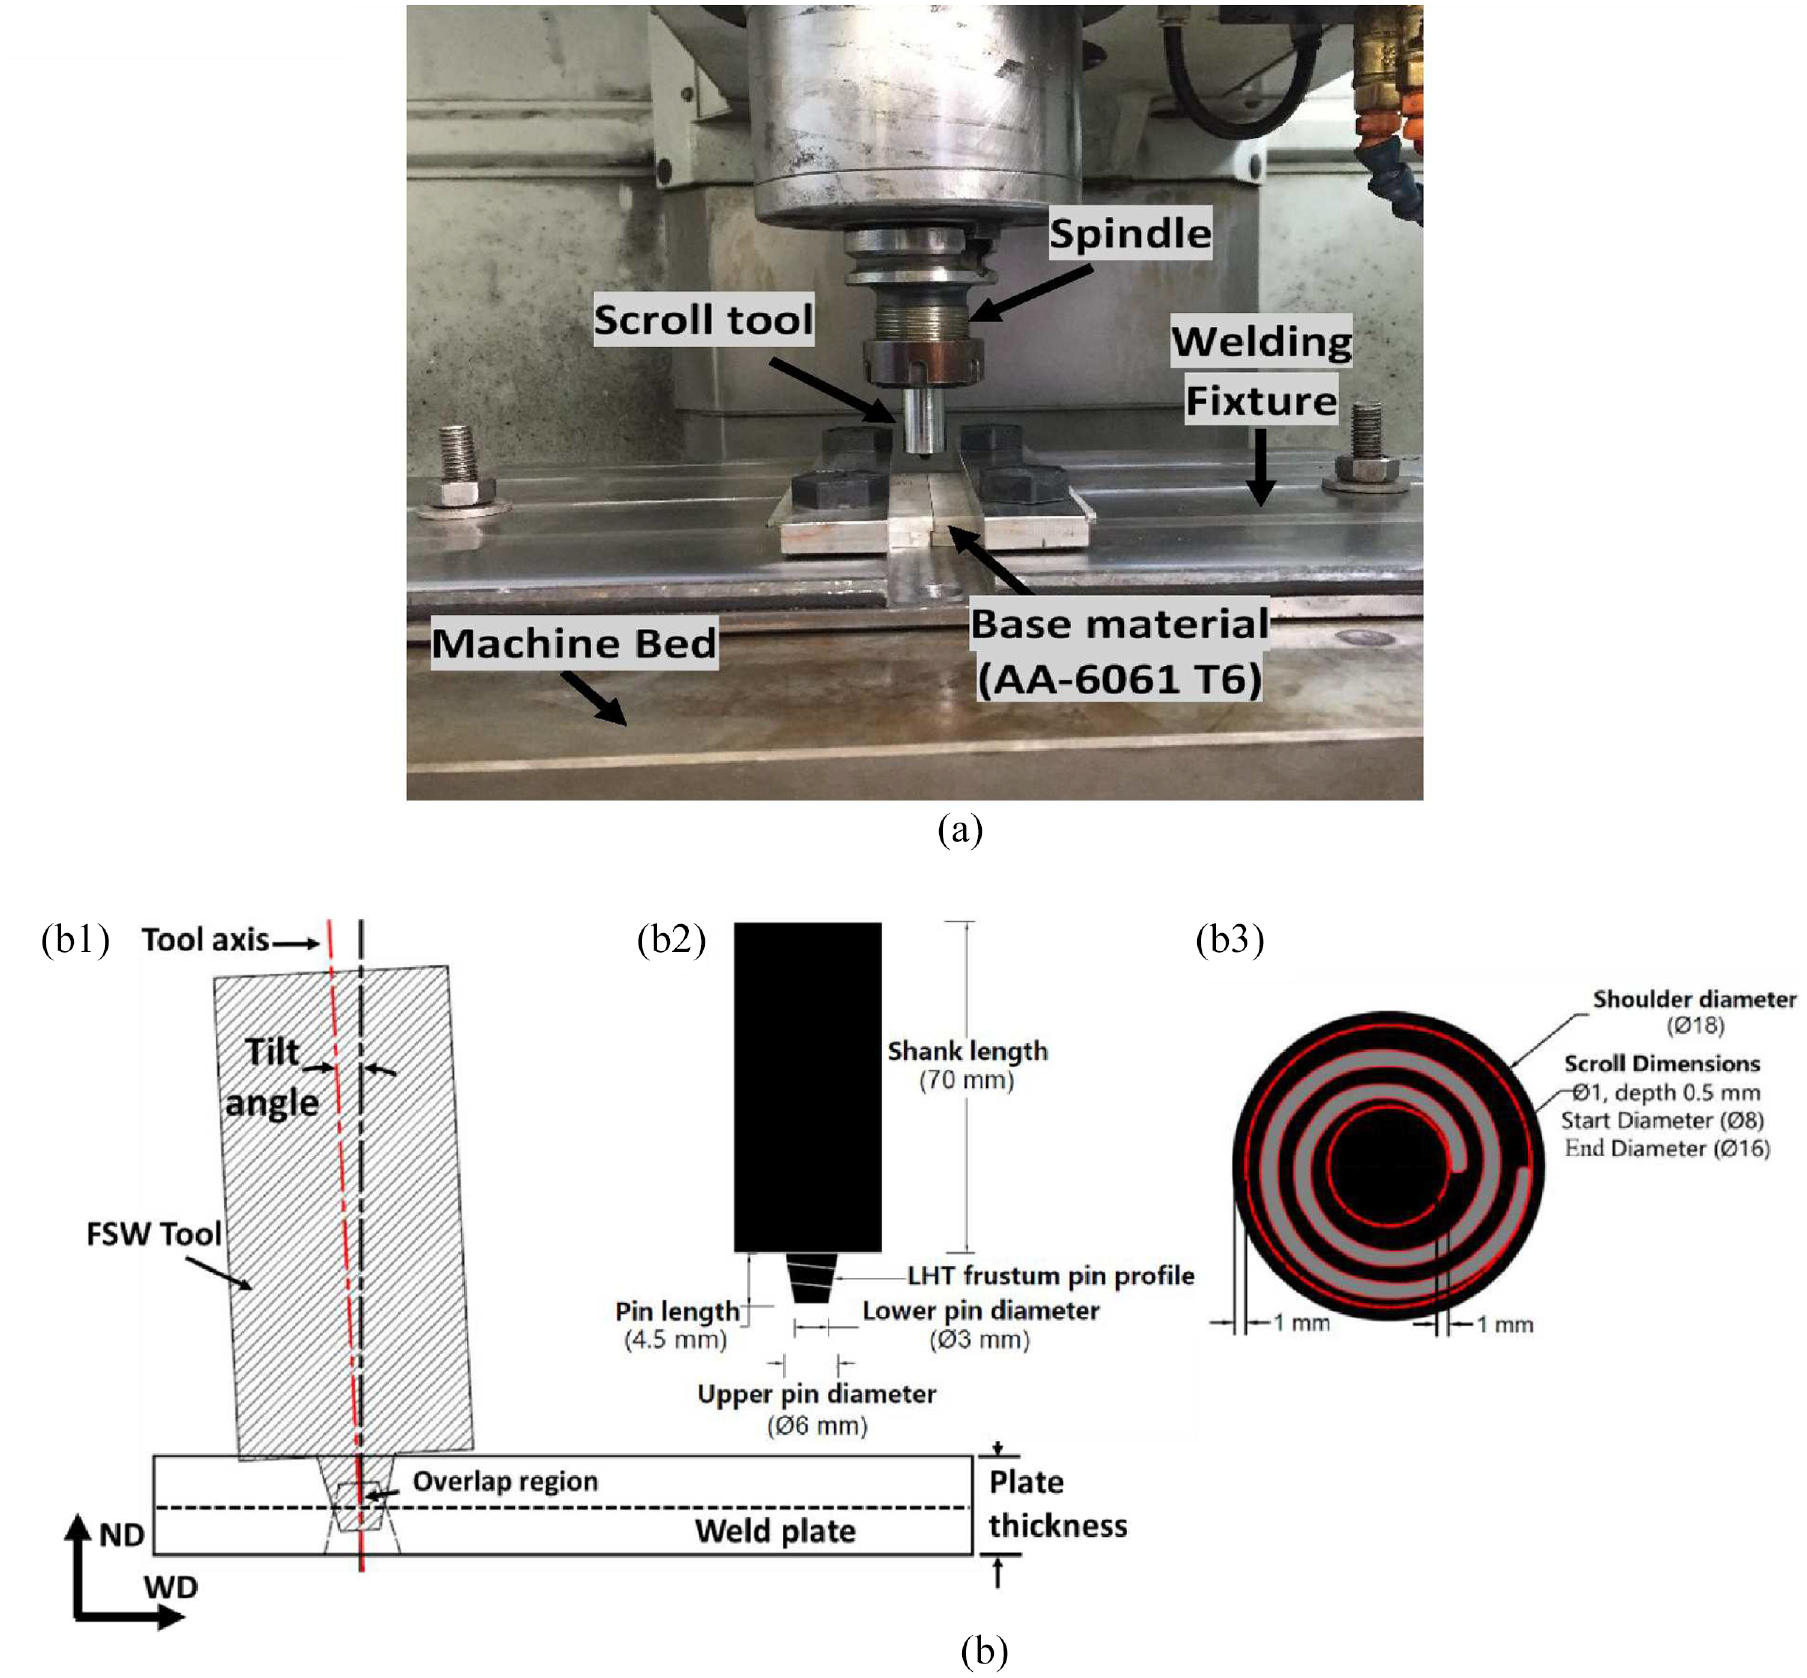
Welding setup; (a) welding fixture, (b) schematic illustration of the possess along with detailed tool geometry(b1) illustration of tilt angle, (b2) tool dimension, and (b3) scroll tool used in the study.
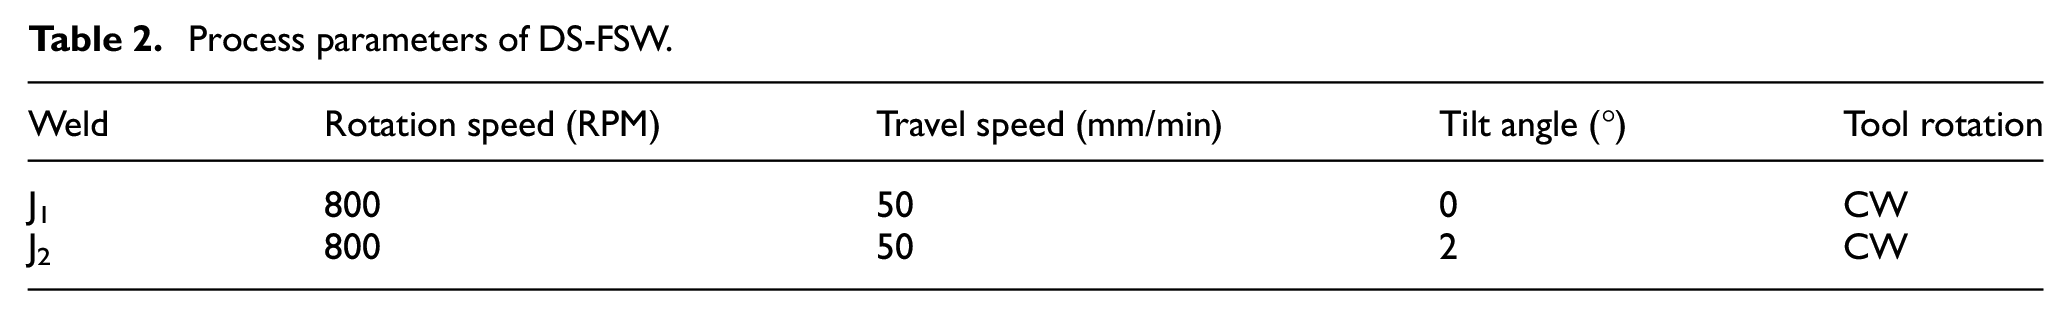
Process parameters of DS-FSW.
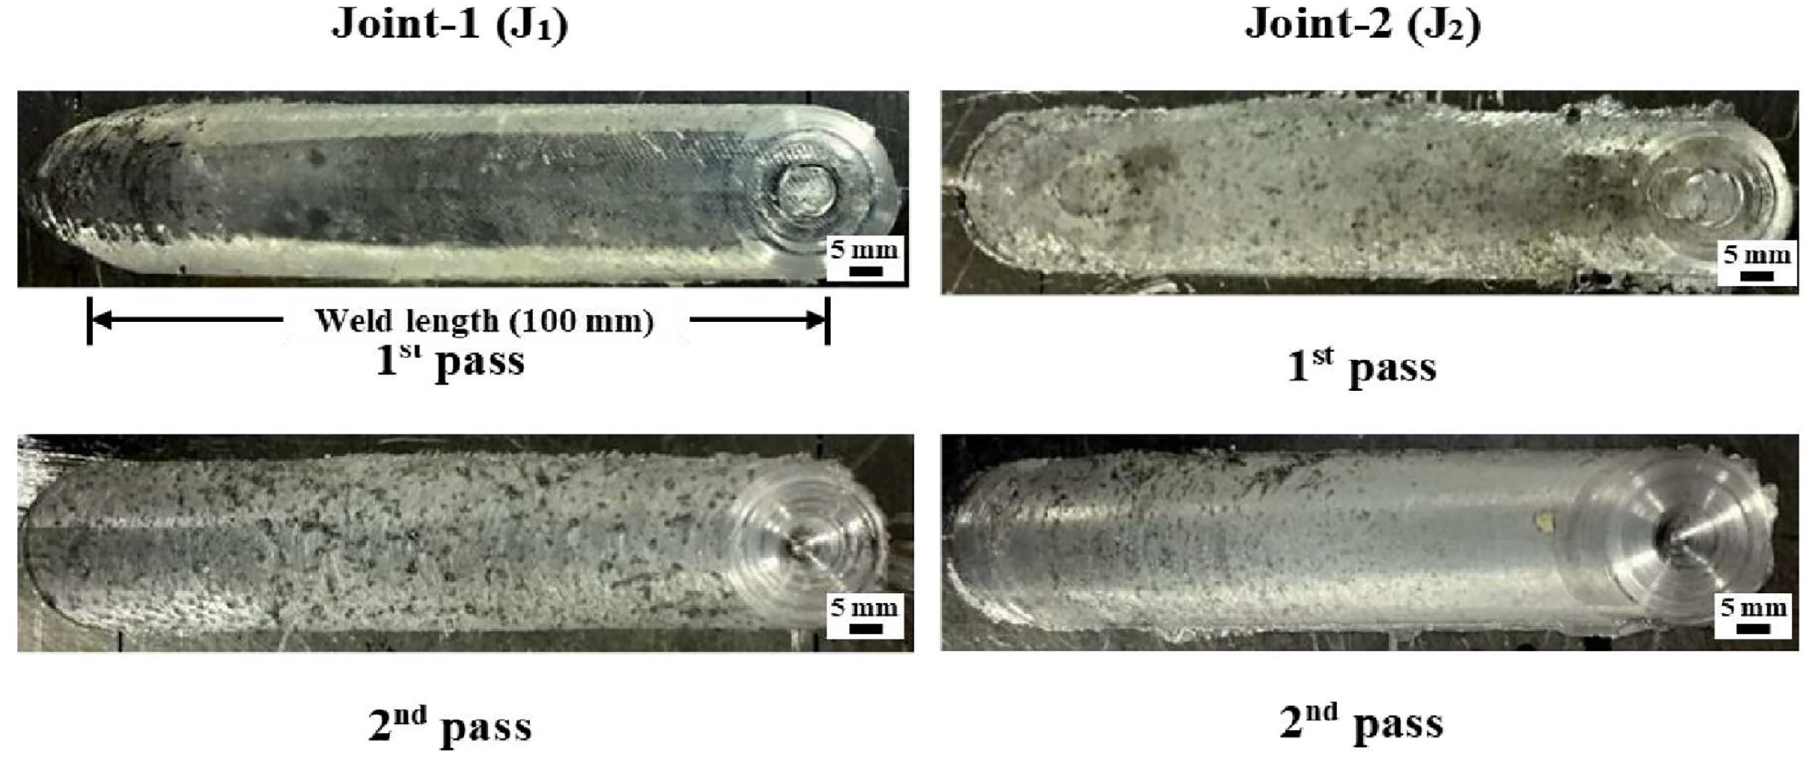
Weld appearance of top surfaces of the different passes after DS-FSW joints.
In order to investigate the metallurgical and mechanical properties of the welded joints, testing specimens were extracted from the welded plates perpendicular to the rolling direction, by using wire electron discharge machining in accordance with the schematic shown in the Figure 3(a).
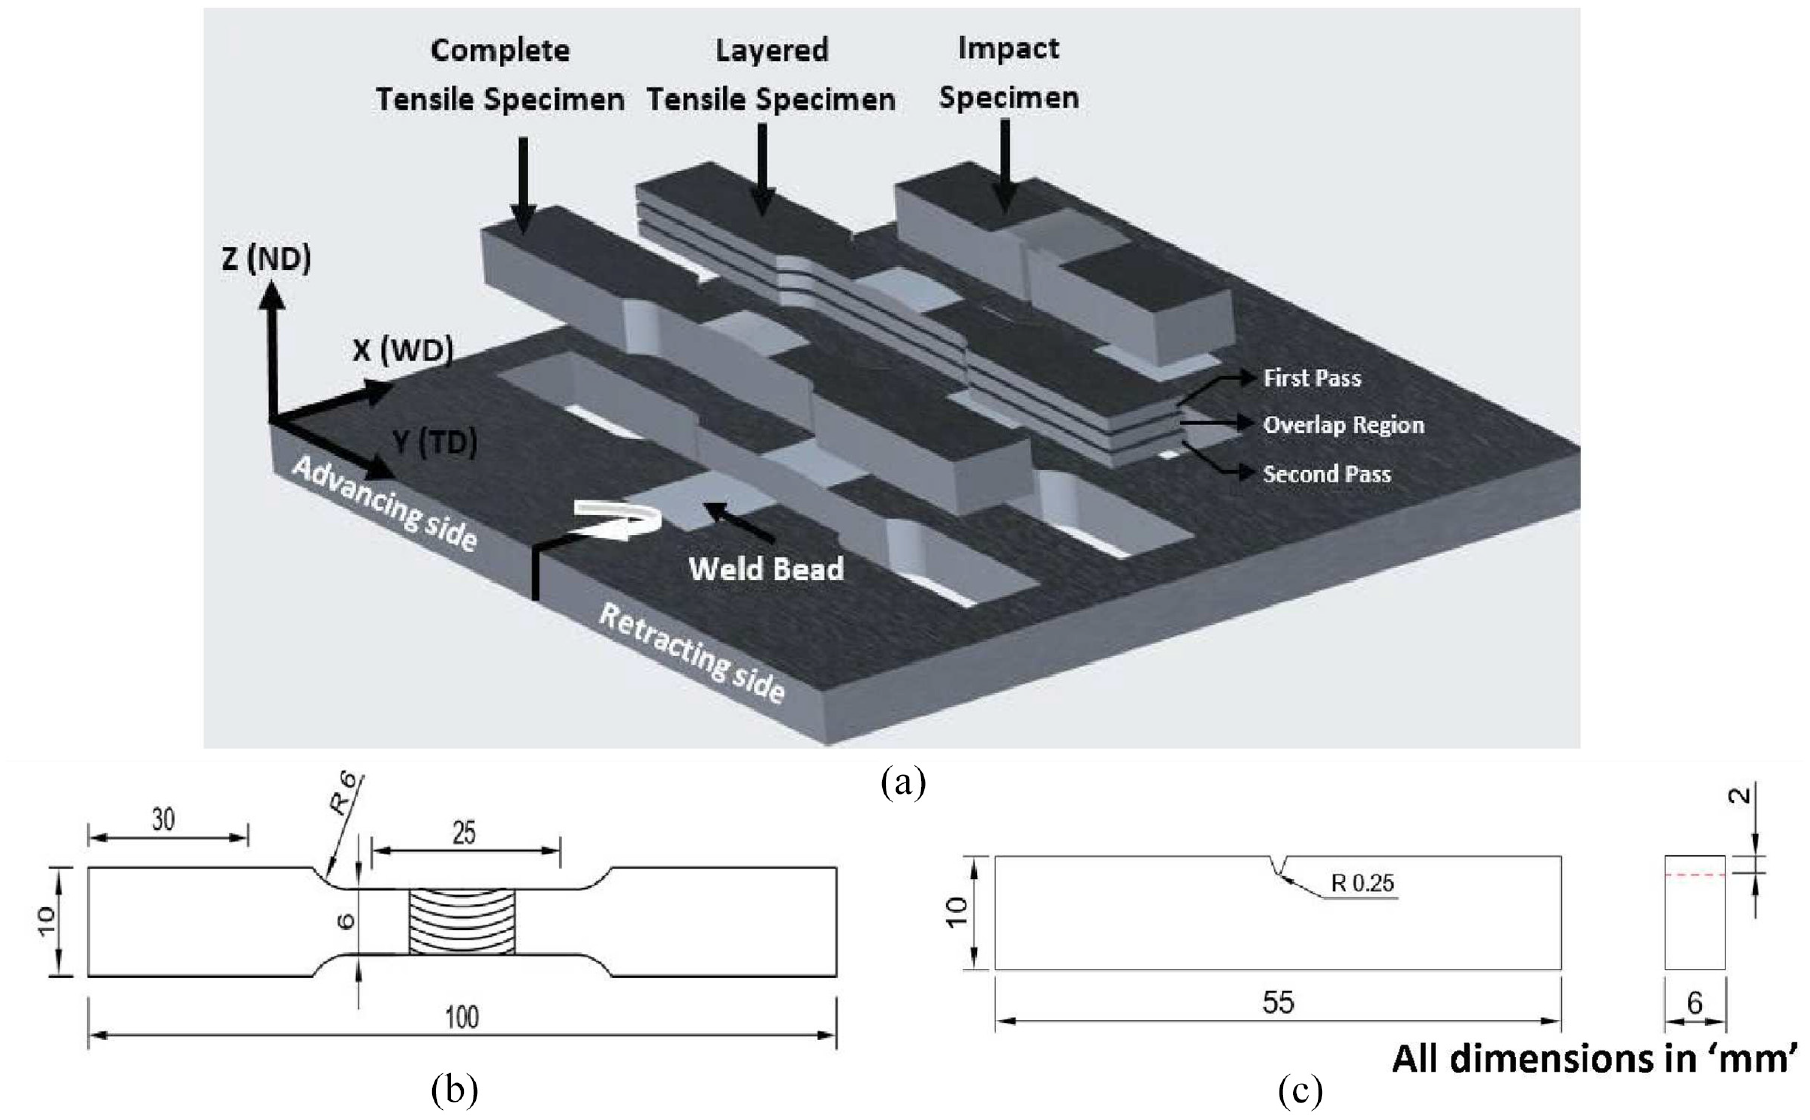
Schematic representation, (a) sectioning plan of different testing specimens from the welded plates, (b) transverse tensile test specimen (ASTM standard: E8/E8M-11), (c) impact test specimen (ASTM standard: E 23).
The metallographic examination of the weld cross-section of DS-FSW joints was carried out using optical microscopy (OM) for the macrostructural observations, and the EBSD system coupled with Scanning Electron Microscopy (SEM, FEI Quanta 3D FEG) for microstructural changes within the SZ. Before metallographic observations, the OM specimens were mechanically polished and then etched using Poulton’s reagent (prepared with 20 mL HCL, 35 mL HNO3, 1.25 mL HF, 1.25 mL distilled water, and 20 mL chromic acid solution). Moreover, the EBSD specimens were electro-polished with 4:1 ethanol-perchloric acid at 10 V for 11 s before microstructural observations.
Microhardness testing was carried out in accordance to ASTM standard E384-01 28 using Vicker’s hardness testing machine (Radical RMHT-201). Each value of the hardness test was carried for 20 s under a load of 500 gm. Moreover, the test spacing between each successive indentation was maintained at 0.5 mm.
The tensile specimens of J1 and J2 welded joints with two different configurations (complete weld & layered specimens) were extracted and prepared according to the ASTM standard E8/E8M-13a. 29 The detailed schematic is shown in Figure 3(b). All the specimens were subjected to a uniaxial tension test performed on a universal testing machine at the strain rate of 1 mm/min. Further, the fractured tensile were examined using SEM.
Toughness evaluation of the welded specimens was carried out via conducting Charpy V-notch impact test at room temperature using a pendulum-type impact testing machine. Samples were prepared according to the ASTM standard E23 30 as shown in Figure 3(c).
Results and discussion
Metallurgical observation
The macrostructural investigation of the joints was carried along the weld cross-section using optical microscopy, while the profound examination of the SZ of the welded joints (J1 and J2) was carried out using EBSD.
Macrostructure of the DS-FSW joints
The optical macrographs of the welded joints J1 and J2 after the DS-FSW are shown in Figure 4, where the SZ experiences strong plastic deformation, material flow, and thermal exposure owing to the generated frictional heat by tool stirring action. It is observed from the optical macrographs that the defect-free welded joints (J1 and J2) have been formed. However, welded joint J1 shows that the volume of material deformed and displaced toward the retracting side is less as compared to the J2 welded joint, and is evident from the material extrusion marks (as shown in Figure 4(a)). However, such extrusion marks are comparatively less prominent in the case of J2 welded joint. This could be attributed to the absence of tool tilt angle in the J1 welded joint, which resulted in a relatively lower downward force on the plastically deformed material and led to improper material mixing as compared to J2 welded joint (2° tool tilt angle). 31
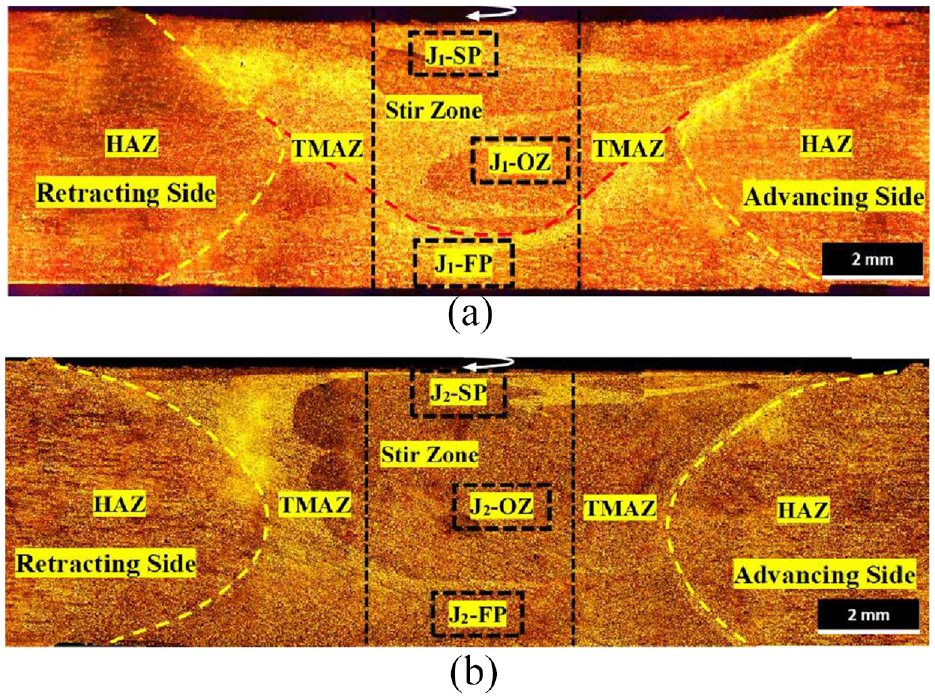
Optical macrostructure showing different regions viz. FP (first pass), OR (overlap region), and SP (second pass) of the welded joint (a) J1, (b) J2.
Microstructure
Base material
The microstructural examination of the base material was carried out using EBSD and optical microscopy (OM). The results obtained were expressed as pole figures and inverse pole figures accompanied by the statistical analysis of the grain structure. As observed from Figure 5(a), the inverse pole figure (IPF) (along the welding direction (WD)) revealed that the microstructural features are dominated by the coarse-grained structure of αAl, with the elongation of grains in the rolling direction. A similar observation was also observed from the optical microstructure as shown in Figure 5(b).
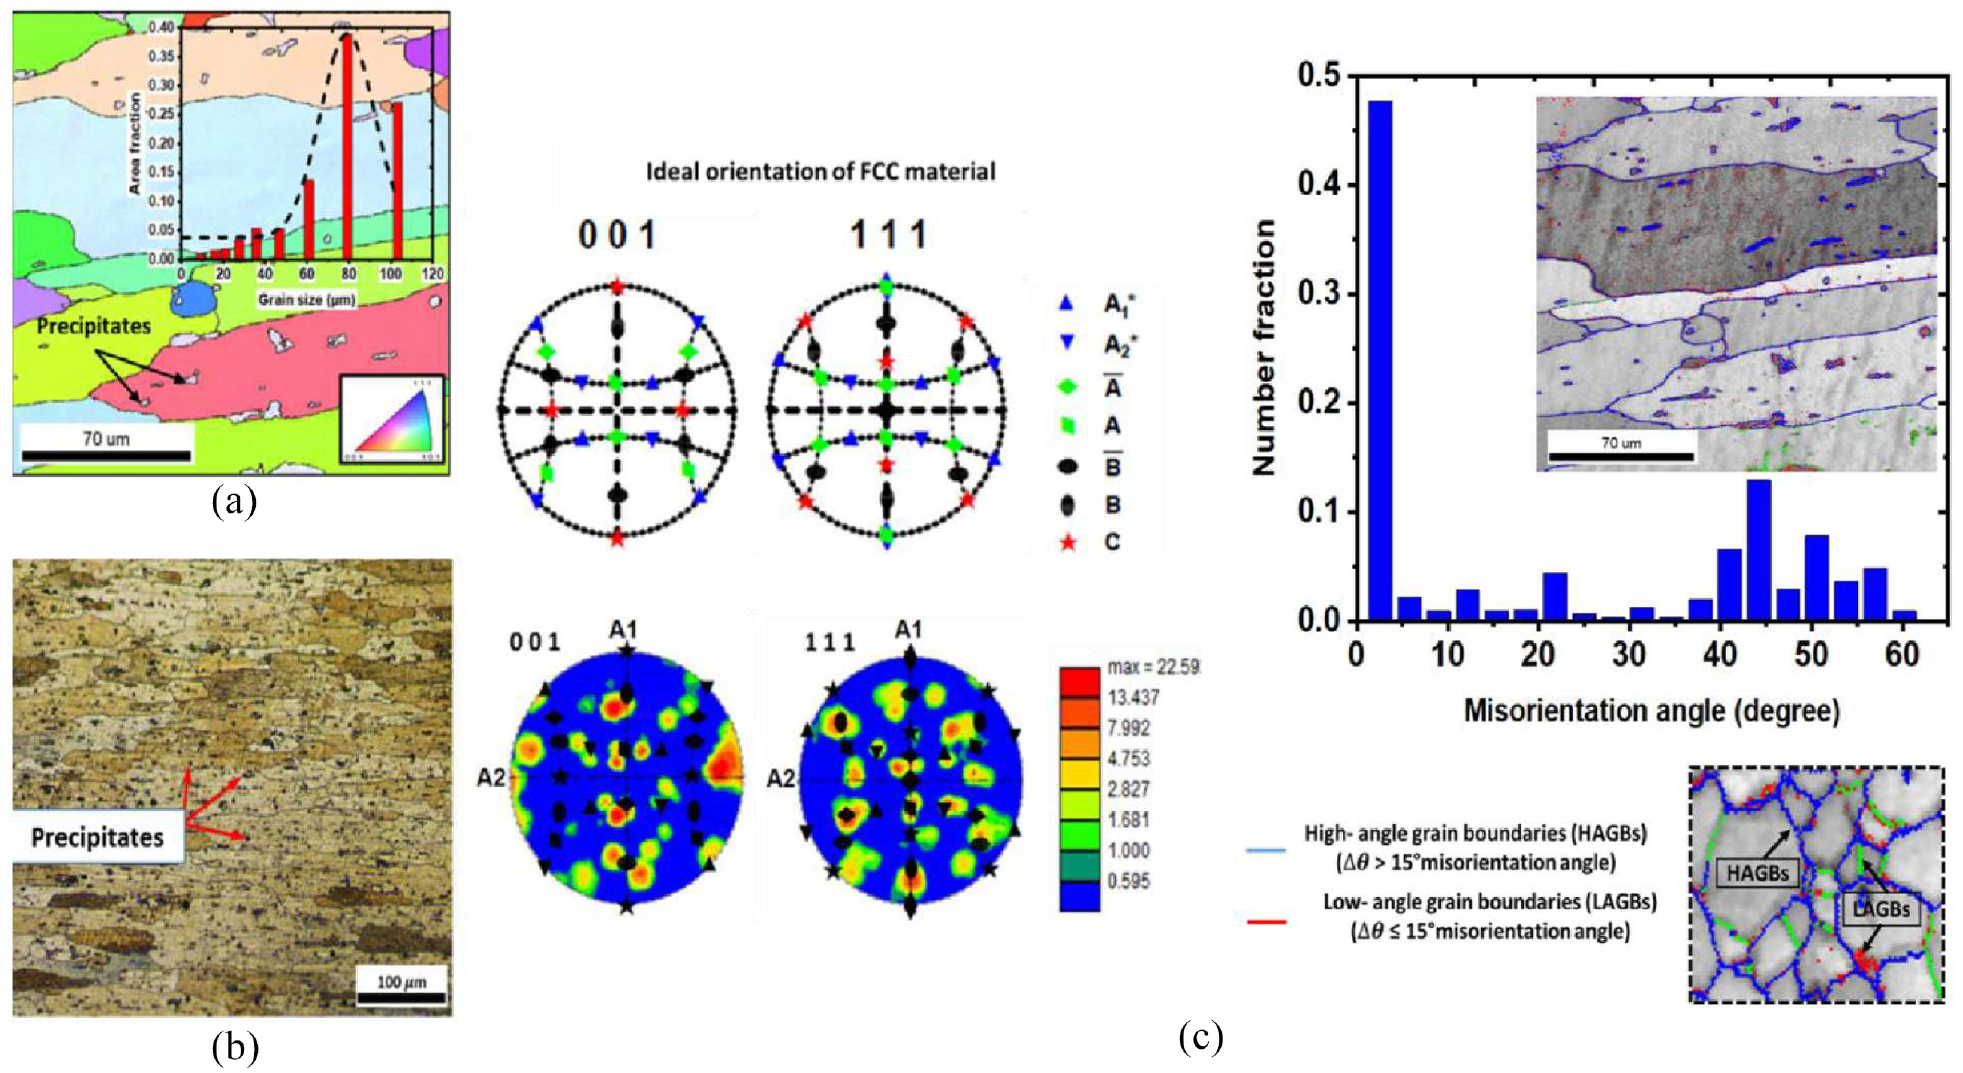
Microstructural observation of base material (AA-6061 T6); (a) Inverse pole figure (IPF), (b) optical microstructure of base material (c) reconstruction of pole figures (001), and (111) crystal plane, based on the ideal orientation associated with the simple shear deformation of FCC material (d) grain boundary distribution of base material.
The presence of precipitates of different textures and sizes within the matrix of αAl grains are observed from the IPF and optical microstructure as shown in Figure 5(a) and (b). The grain size measurements (µm) expressed against area fraction (%), and plotted as a bar chart in Figure 5(a), showed the average grain size of 80 µm for the αAl grains. Further, Figure 5(c) shows the pole figures, which were reconstructed based on the ideal orientation associated with the simple shear deformation of FCC material, as purposed by Fonda et al. 32 It could be concluded from the pole figures that the base material shows a strong (001) orientation. Grain boundary distribution maps of the base material are shown in Figure 5(d). The grain boundaries in terms of misorientation angle > 15° are assumed as high angle grain boundaries (HAGBs), whereas the grain boundaries having misorientation angle in between 0° and 15° are assumed as low angle grain boundaries (LAGBs). 33
Double-sided friction stir welds
In DS-FSW, the stirring action of the tool pin results in the formation of three different regions, namely, first pass region, second pass, and overlap region (represented as OR) within the SZ of the welded joints. These regions are depicted asJ1-FP, J1-SP, J1-OR, and J2-FP, J2-SP, J2-OR for the J1 and J2 welded joints, respectively, in the macrostructures shown in Figure 4. Among these regions, the overlapped region is re-stirred by the tool pin while laying down the second pass, and covers approximately 50% of the total plate thickness. The microstructural observations of the different SZ regions of the J1 and J2 welded joint was carried out using EBSD, and the results were obtained as inverse pole figures, grain boundary (GBs) distribution, and pole figures (PF).
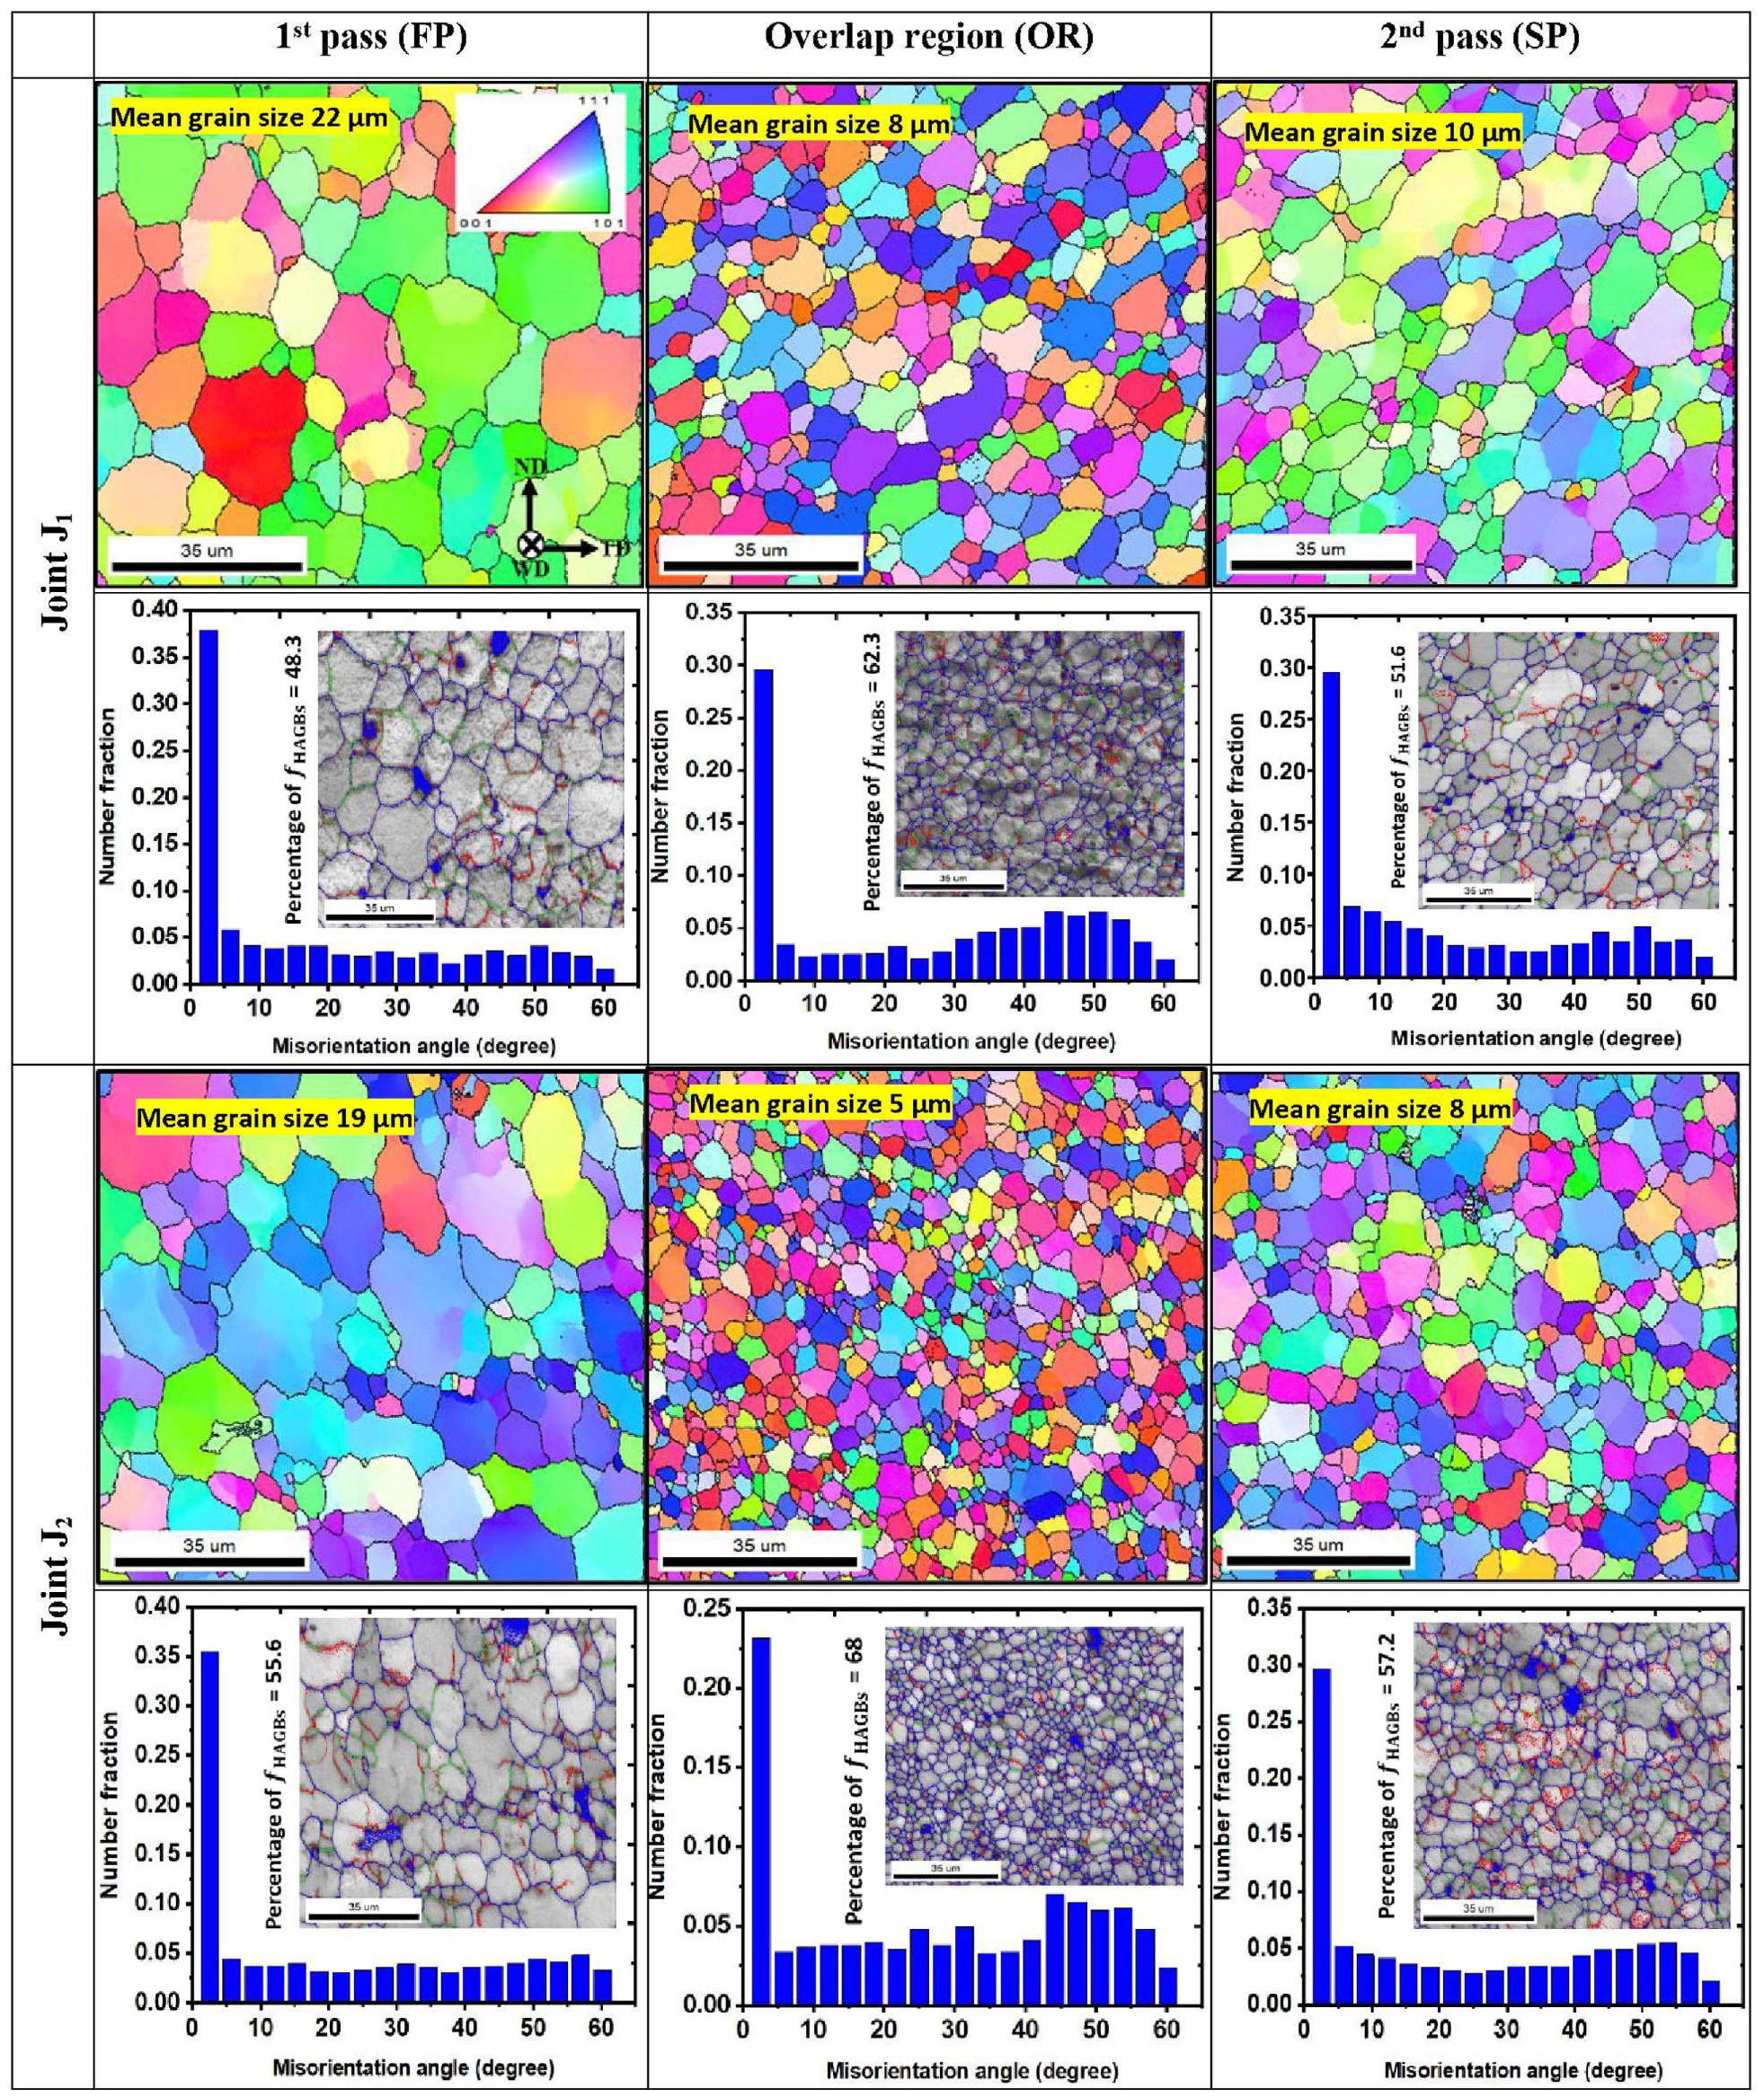
Micrographs of both the welded joints (refer to Figure 6) show the significant grain refinement as well as crystallographic misorientation of grain boundaries in the different regions of the SZ and compared to the base metal. Such refinement in the grain structure of the SZ and increase in the fraction of HAGBs is associated with the significant amount of dynamic recrystallization of the plastically deformed grain structure, which results due to the strong stirring action of the threaded tool pin.34,35
EBSD
It is further observed from the micrographs that, although, both the first and second passes were laid using the same parameters, however, the grain refinement was more pronounced for the second pass as compared to the first pass. This variation could be attributed to the fact that the laying of the second pass led to the reheating of the first pass, which resulted in the coarsening of grains and a reduction in the percentage of HAGBs of the first pass. Similar behavior has been reported for the DS-FSW of 7085-T7452 aluminum alloy. 36
Furthermore, the re-stirring of the first pass by the second pass led to the formation of OR which underwent the maximum refinement in the grain structure of both the welds. Similar observations for AA6061 T6-AA7075-T651 dissimilar DS-FSW welds have also been reported in literature. 37 The misorientation plots of the OR of both the joints further show the increase in the percentage of HAGBs as compared to the first and second pass.
Moreover, it becomes clearly evident from the IPFs and grain size measurements that the incorporation of tool tilt angle for J2 weld resulted in significant grain refinement in the different SZ regions as compared to the weld (J1) developed without any tilt angle. Percentage reduction of 14%, 38%, and 20% has been noted in grain size for J2 joint in J2-FP, J2-SP, J2-OR region respectively compared to the J1 welded joint. Similarly, the fraction of HAGBs increased by 14%, 10%, and 9% in the J2-FP, J2-SP, J2-OR, respectively of the J2 joint as compared to the J1 joint. This increase in the grain refinement and fraction of HAGBs could be attributed to the fact that the change in the forging behavior due to the change in the physical condition at tilt angle results in the large material deformation (dynamic volume of the SZ) and increased material strain rate. Also, the decrease in interaction between the tool shoulder and the leading edge of the tool results in the loss of frictional heat (at a 2-degree tilt angle), which was observed by the author’s previous study by Thakur et al. 24
The corresponding pole figures from the first pass, overlap region, and second pass of J1 and J2 welded joints were obtained along [001] and [111] orientations, and are shown in Figure 7(a–c) respectively. The textures acquired for SZ regions of J1 and J2 welded joints in the form of pole figures, indicate the presence of simple shear, and is well reported in the literature that the friction stir welding of metallic materials results in simple shear textures within the weldment.
38
For comparison, the ideal simple shear texture components associated with the face cubic crystallographic structure constructed by Fonda et al.
32
have been considered. The PFs revealed that the highest intensity of the orientation peaks in the J1 and J2 welded joint lies with
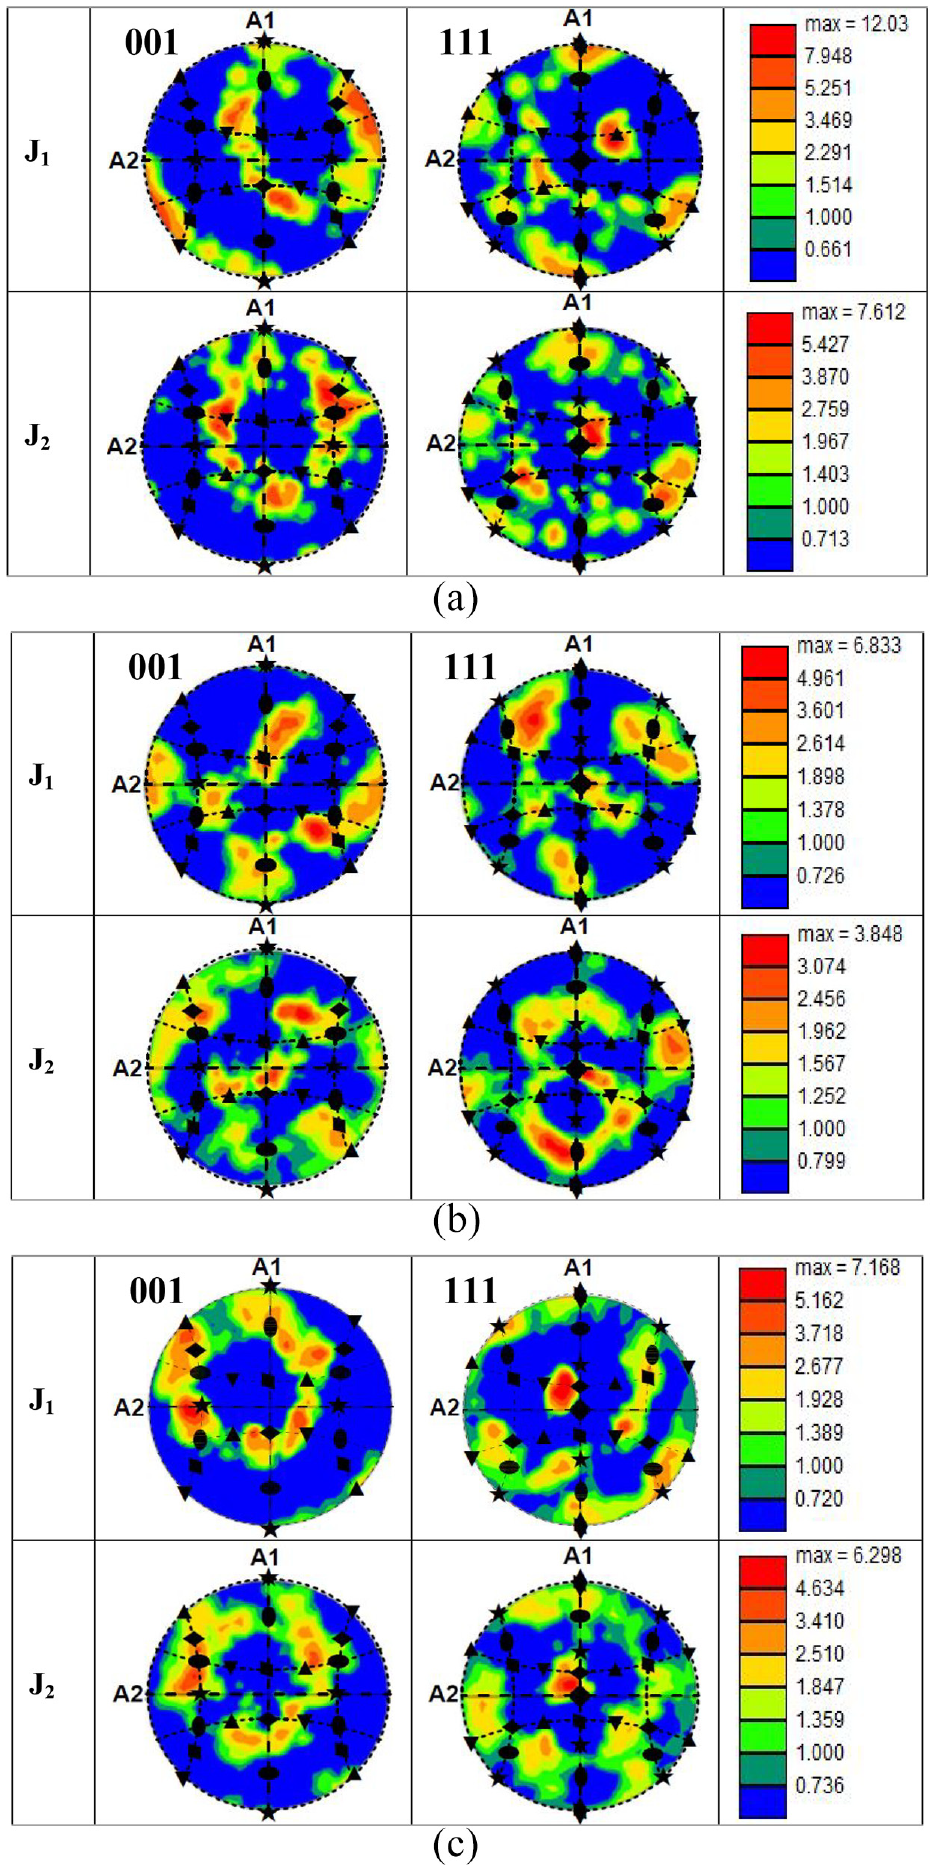
Pole figures (PFs) of different SZ regions of welded joint J1 and J2 reconstructed based on the ideal orientation of the fcc material associated with simple shear texture, (a) first pass, (b) overlap region, (c) second pass.
Microhardness
Microhardness measurements were taken in the different weld zones across the weld center line for J1 and J2 welded joints, and the results thus obtained are illustrated graphically along with a 2D hardness map in Figure 8. The average values of microhardness of different zones of welded joints are further given in Table 3. Three microhardness traverses across the weld centreline were made for each welded joint, that is, through the first pass (FP), overlapping pass (OP), and the second pass (SP). In each transverse, the microhardness measurements were spaced at 0.5 mm and passed through the stir zone (SZ), thermo-mechanically affected zone (TMAZ), heat-affected zone (HAZ), and base metal (BM). Significant fluctuations in the hardness values have been observed for both the welded joints. Such continuous fluctuation of hardness throughout the weldment of precipitation-hardened alloy, like AA 6061-T6 has also been reported in the literature, which largely depends upon the formation and distribution of second phases precipitates. 43
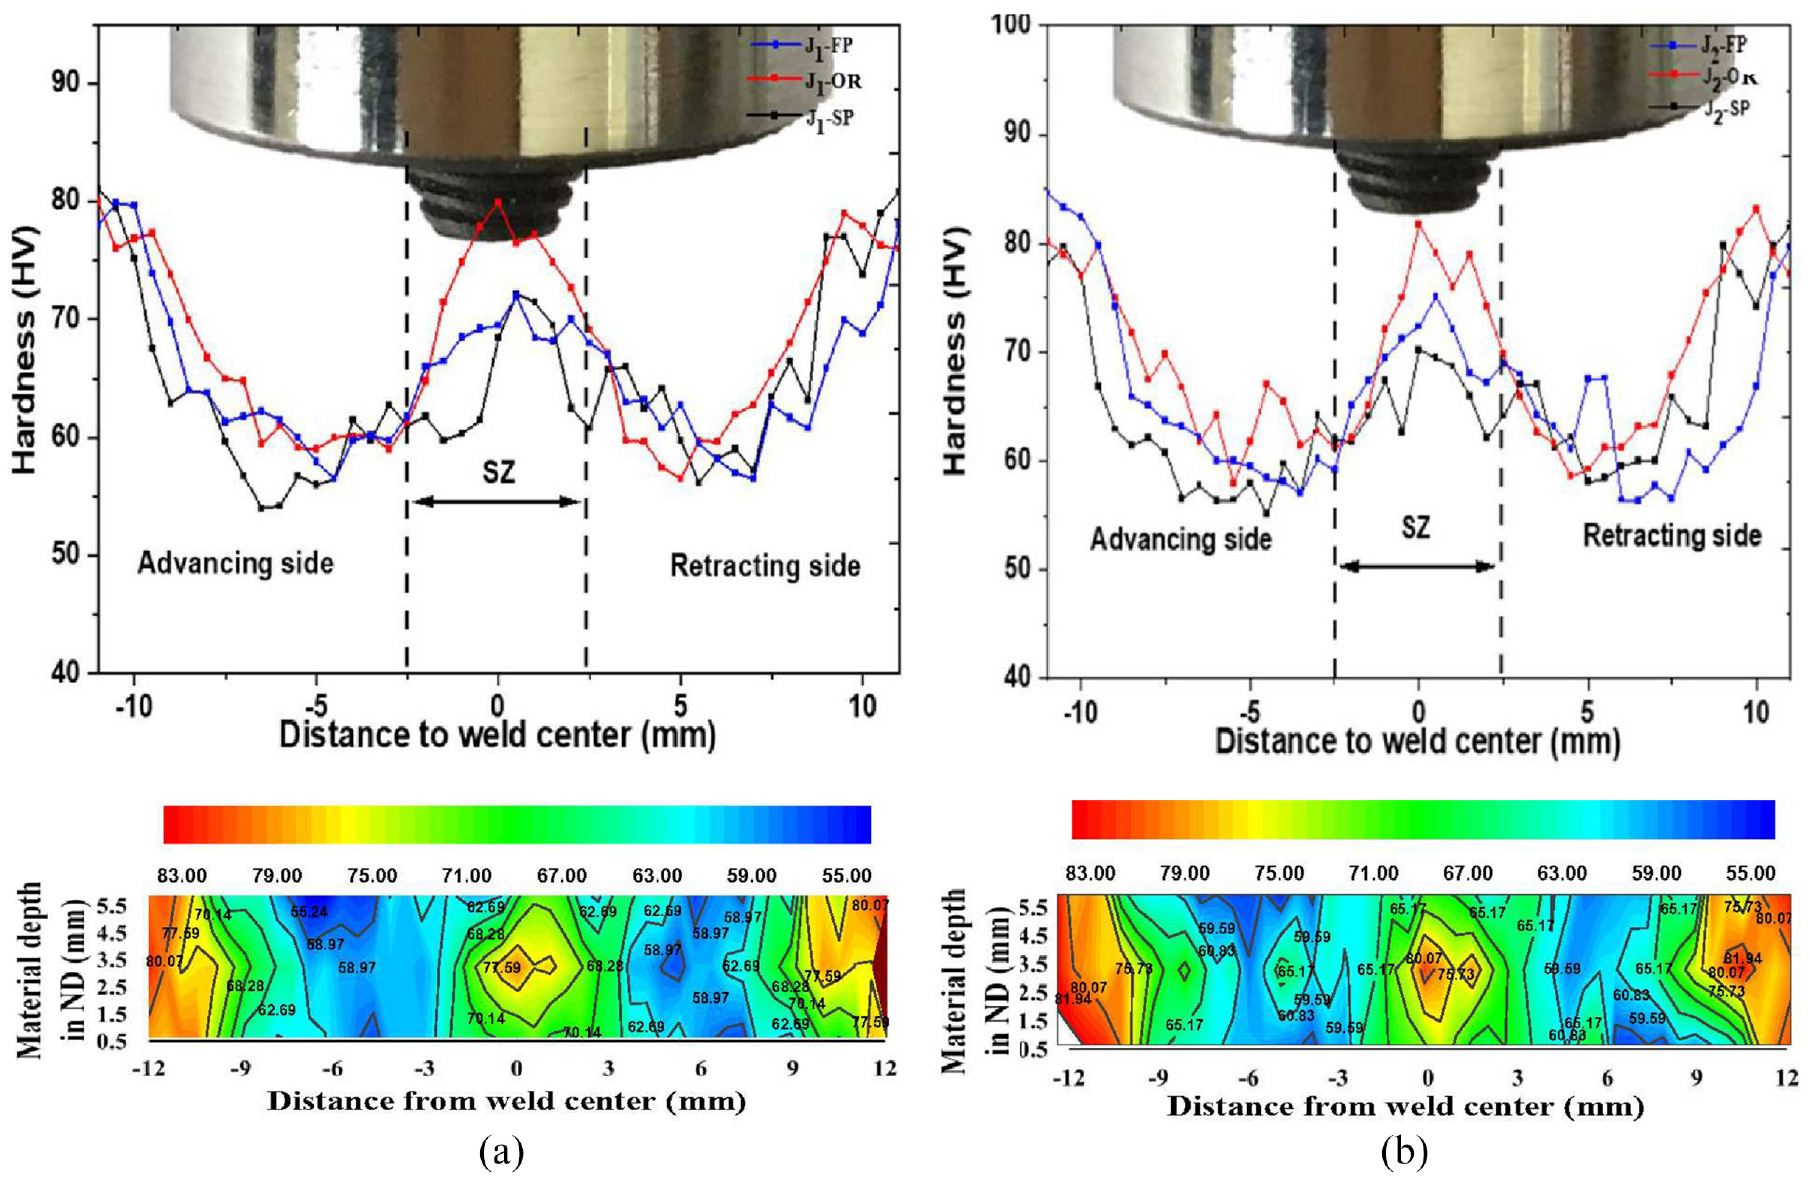
Graphical representation of microhardness of different welded regions (a) J1, (b) J2.
Average microhardness of different zones of J1 and J2 joint.
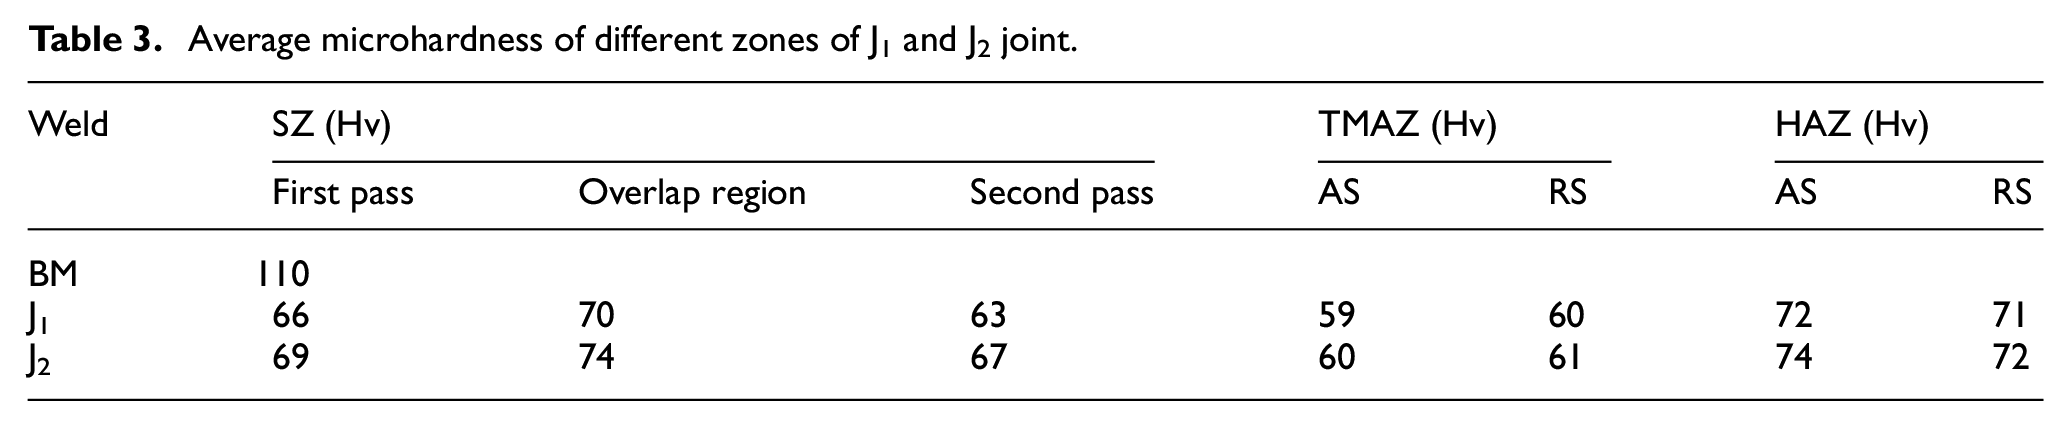
It is further observed, that for J2 joint, the average microhardness of SZ (70 Hv) is higher than the J1 welded joint (66 Hv). Such behavior could be attributed to the fact that the heat input attained by J1 joint was higher compared to J2 joint, which led to the dissolution of second phase particles and resulted in the softening of SZ. Moreover, the microhardness near the SZ borders (TMAZ) on both the advancing and retracting side showed severe softening behavior. The average microhardness of TMAZ for J1 and J2 joints was found to be 60 Hv. Advancing further from TMAZ, a continuous increase in the microhardness was observed in the HAZ till the hardness of the base metal is achieved. The average hardness in the J1 joint, as depicted in Table 3, was found to be slightly lower compared to the J2 welded joint. In both the welds, the overlapped region showed slightly higher hardness owing to the mean grain size of 5 µm for J1 and 8 µm for J2, which is lower among other respective zones.
Tensile properties and fracture analysis
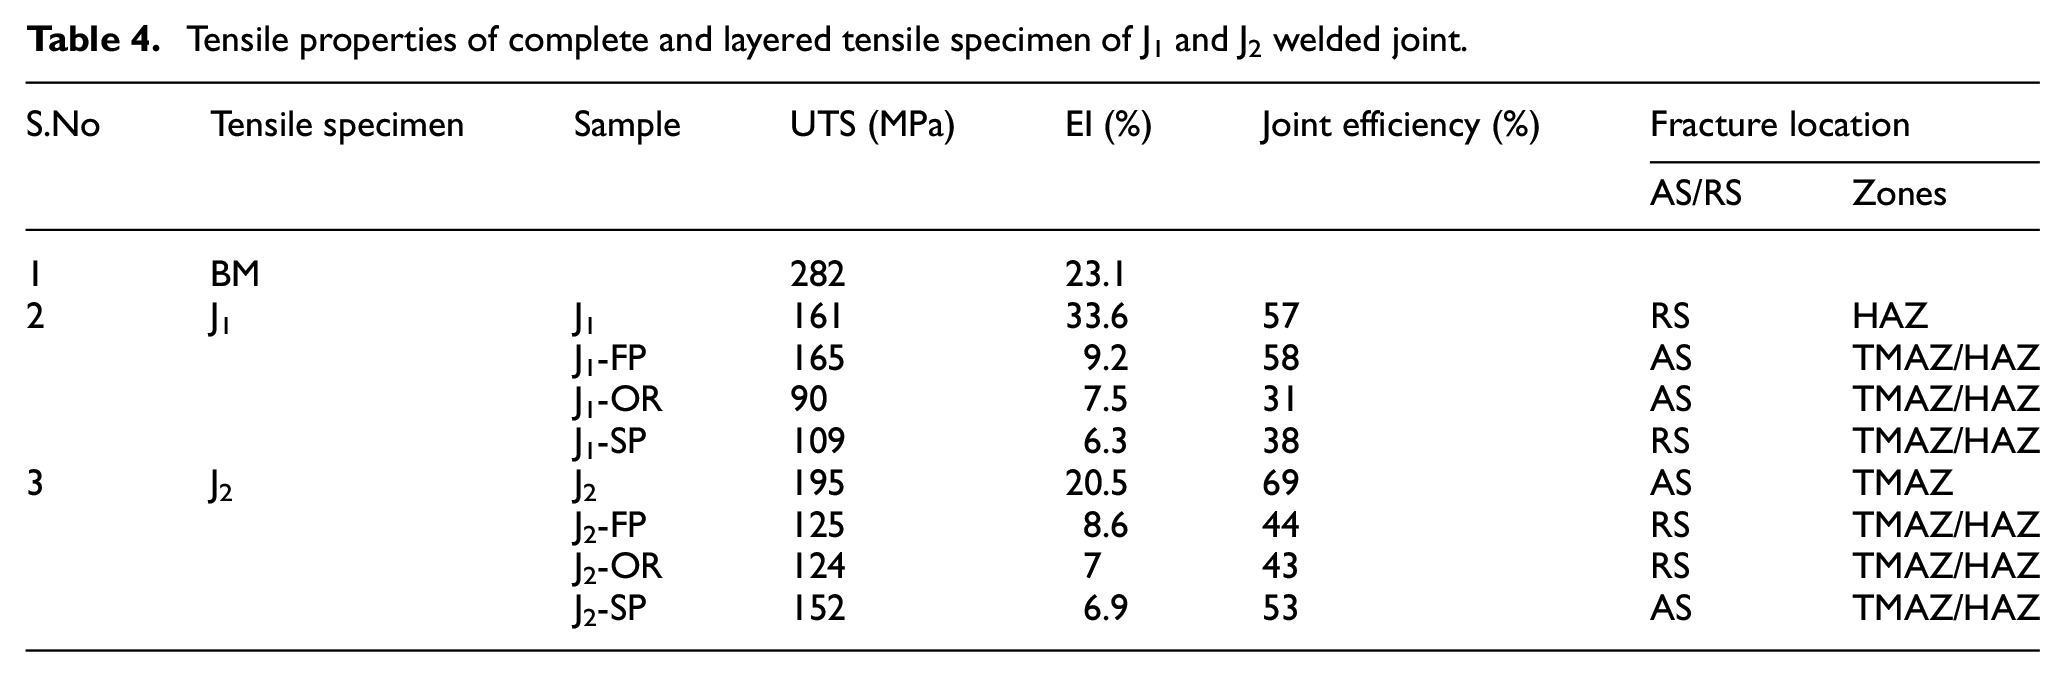
DS-FSW welded joints performance was evaluated by tensile tests that show ultimate tensile strength (UTS) and percentage elongation (EI). Transverse tensile specimens of two different configurations, that is, complete weld specimens named as J1 and J2 of thickness 6 mm each, and three-layered specimens of thickness 1.5 mm from each weld were extracted. The layered specimens were designated as; J1-FP (First pass), J1-SP (Second pass), J1-OR (Overlap region) for the welded joint J1, and J2-FP (First pass), J2-SP (Second pass), and J2-OR (Overlap region) for joint J2. The tensile results obtained for both configurations are listed in Table 4.
Tensile properties of complete and layered tensile specimen of J1 and J2 welded joint.
Complete weld
To evaluate the mechanical performance of BM and welded joints, the uniaxial tensile test was performed. The tensile results show that the UTS of BM, J1, and J2 welded joints were 282 MPa, 161 MPa, and 195 MPa respectively. This difference in the UTS, resulted in higher joint efficiency of J2 (69%) as compared to the J1 (57%). Also, the ductility in terms of percentage elongation for joint J1 (33.6%) was found to be higher compared to joint J2 (20.5 %). This is owing to the fractured location of the J1 welded joint from the HAZ region which shows only grain coarsening of the grains and is observed as a soft region of the welded joint. Further, Figure 9(a) shows the stress-strain diagram of the BM and complete weld specimens. Also, the stress-strain curve of J1 and J2 joints shows significant diffusion necking followed by the localized necking before getting fractured and also observed in the fractured tensile specimen shown in Figure 9(b). The fractured region of J1 joint shows that the stress concentration increases in the weakest point (lower hardness) and the corresponding fracture point near the HAZ region (7.04 mm away from the weld center) in the retracting side as shown in Figure 9(b). Whereas, the J2 joint, fractured occurred in the TMAZ region (6.89 mm away from the AZ region) in the advancing side as shown in Figure 9(b). This shift in the failure location and mode of fracture depicts the influence of tilt angle on welded joints. Wherein, the dissolution of strengthening precipitates and coarsening of grain in the TMAZ and HAZ, respectively and significantly effect on the weld strength. A similar observation has been reported for the dissimilar SS-FSW joints of A441 AISI and AA1100 aluminum alloy for the varied tilt angles. 44
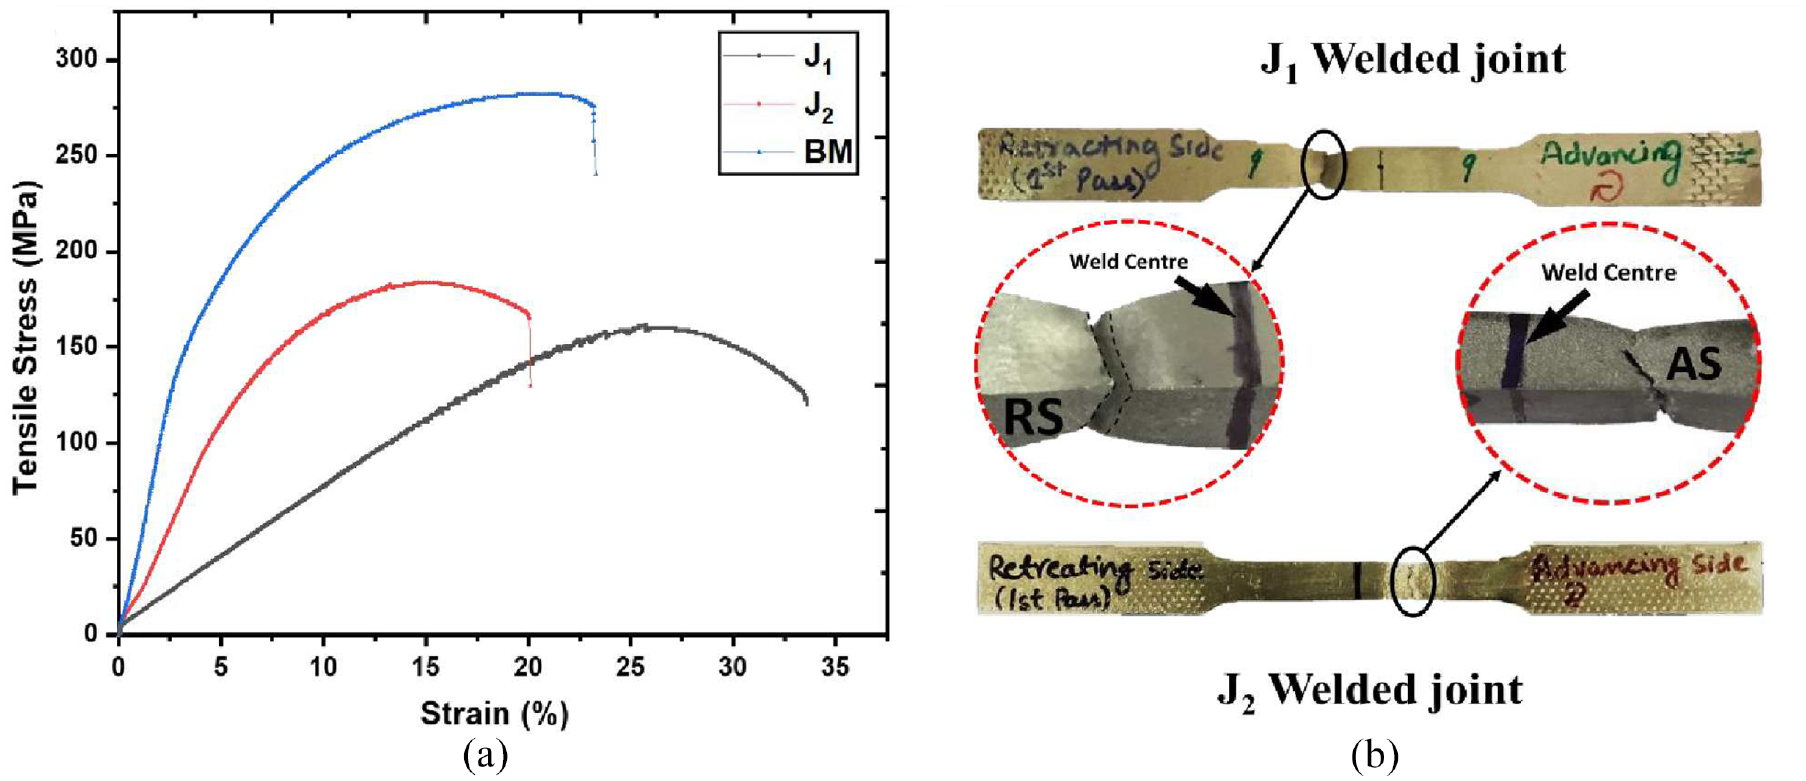
Tensile properties; (a) Stress-strain curves for BM and complete weld specimen of J1 and J2 joint, (b) macro morphology of J1, (c) macro morphology of J2.
It is further substantiated by the fractography taken at higher magnification. The fractography shows the presence of shallow dimples along with the presence of flat facets, which indicates the mixed mode of fracture for J2 joint. On the contrary, the J1 joint shows (Figure 10(a)) the formation of uniformly distributed deep dimples on the fractured end, which indicates the ductile nature of the fracture. This variation in the modes of failure among the joints could be attributed to the lack of heat input in J2 joint compared to J1 joint, which could have resulted in insufficient plastic deformation during welding and thus reduction in ductility. Moreover, the presence of a higher area fraction of tearing ridges throughout the fractured surface indicates the ability of J2 joint to offer higher resistance to external loads, that is, the higher strength of J2 joint compared to J1 joint. It is also observed from the fractographs that equiaxed and fine dimples dominated the overlapped region of both the welded joints.
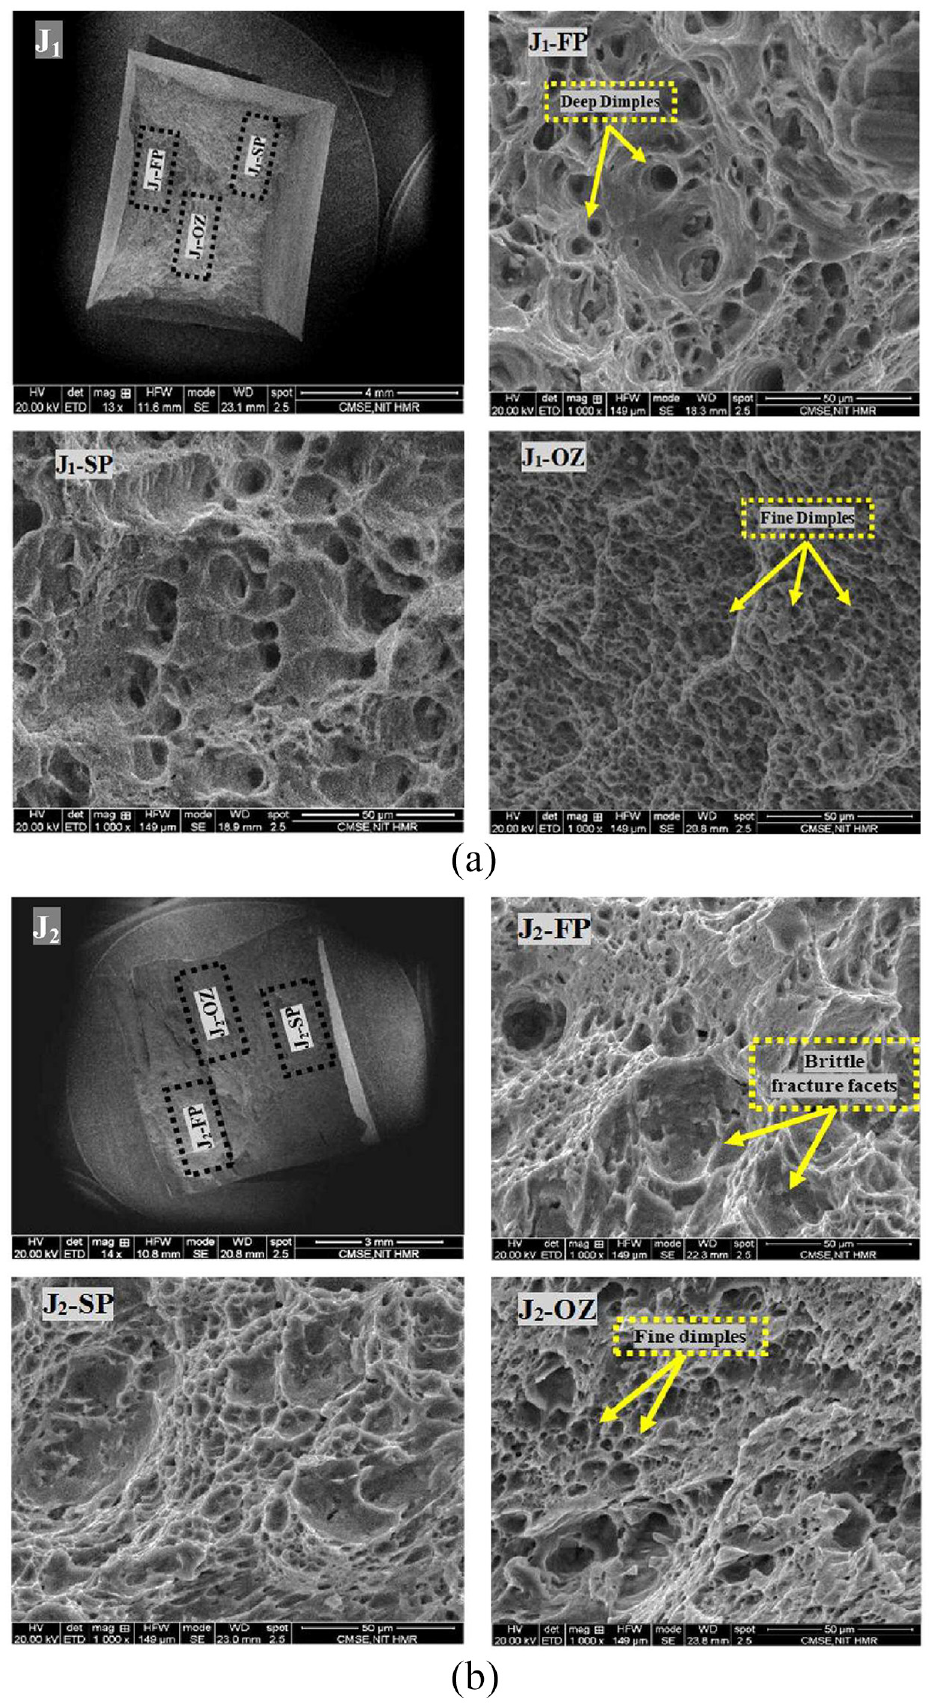
Fractography of different regions of welded joints (a) J1 joint (b) J2.
Layered specimen
Layered tensile specimens results of J1 and J2 joint are shown in Table 4. An appreciable difference in UTS and percentage elongation of the layered specimens of J1 and J2 welded joints is further observed from the stress-strain diagrams shown in Figure 11(a1) and (b1), respectively. The joint efficiency of J2-OR (40%) and J2-SP (49%) layered specimens of J2 welded joint was found to be higher compared to J1-OR (29%) and J1-SP (35%) layered specimens ofJ1 welded joint. In addition, the joint efficiency ofJ2-FP (40%) was noted lower compared to J1-FP (51%). Moreover, no significant difference in ductility in terms of percentage elongation was found between a layered specimen of J1 and J2 welded joints.
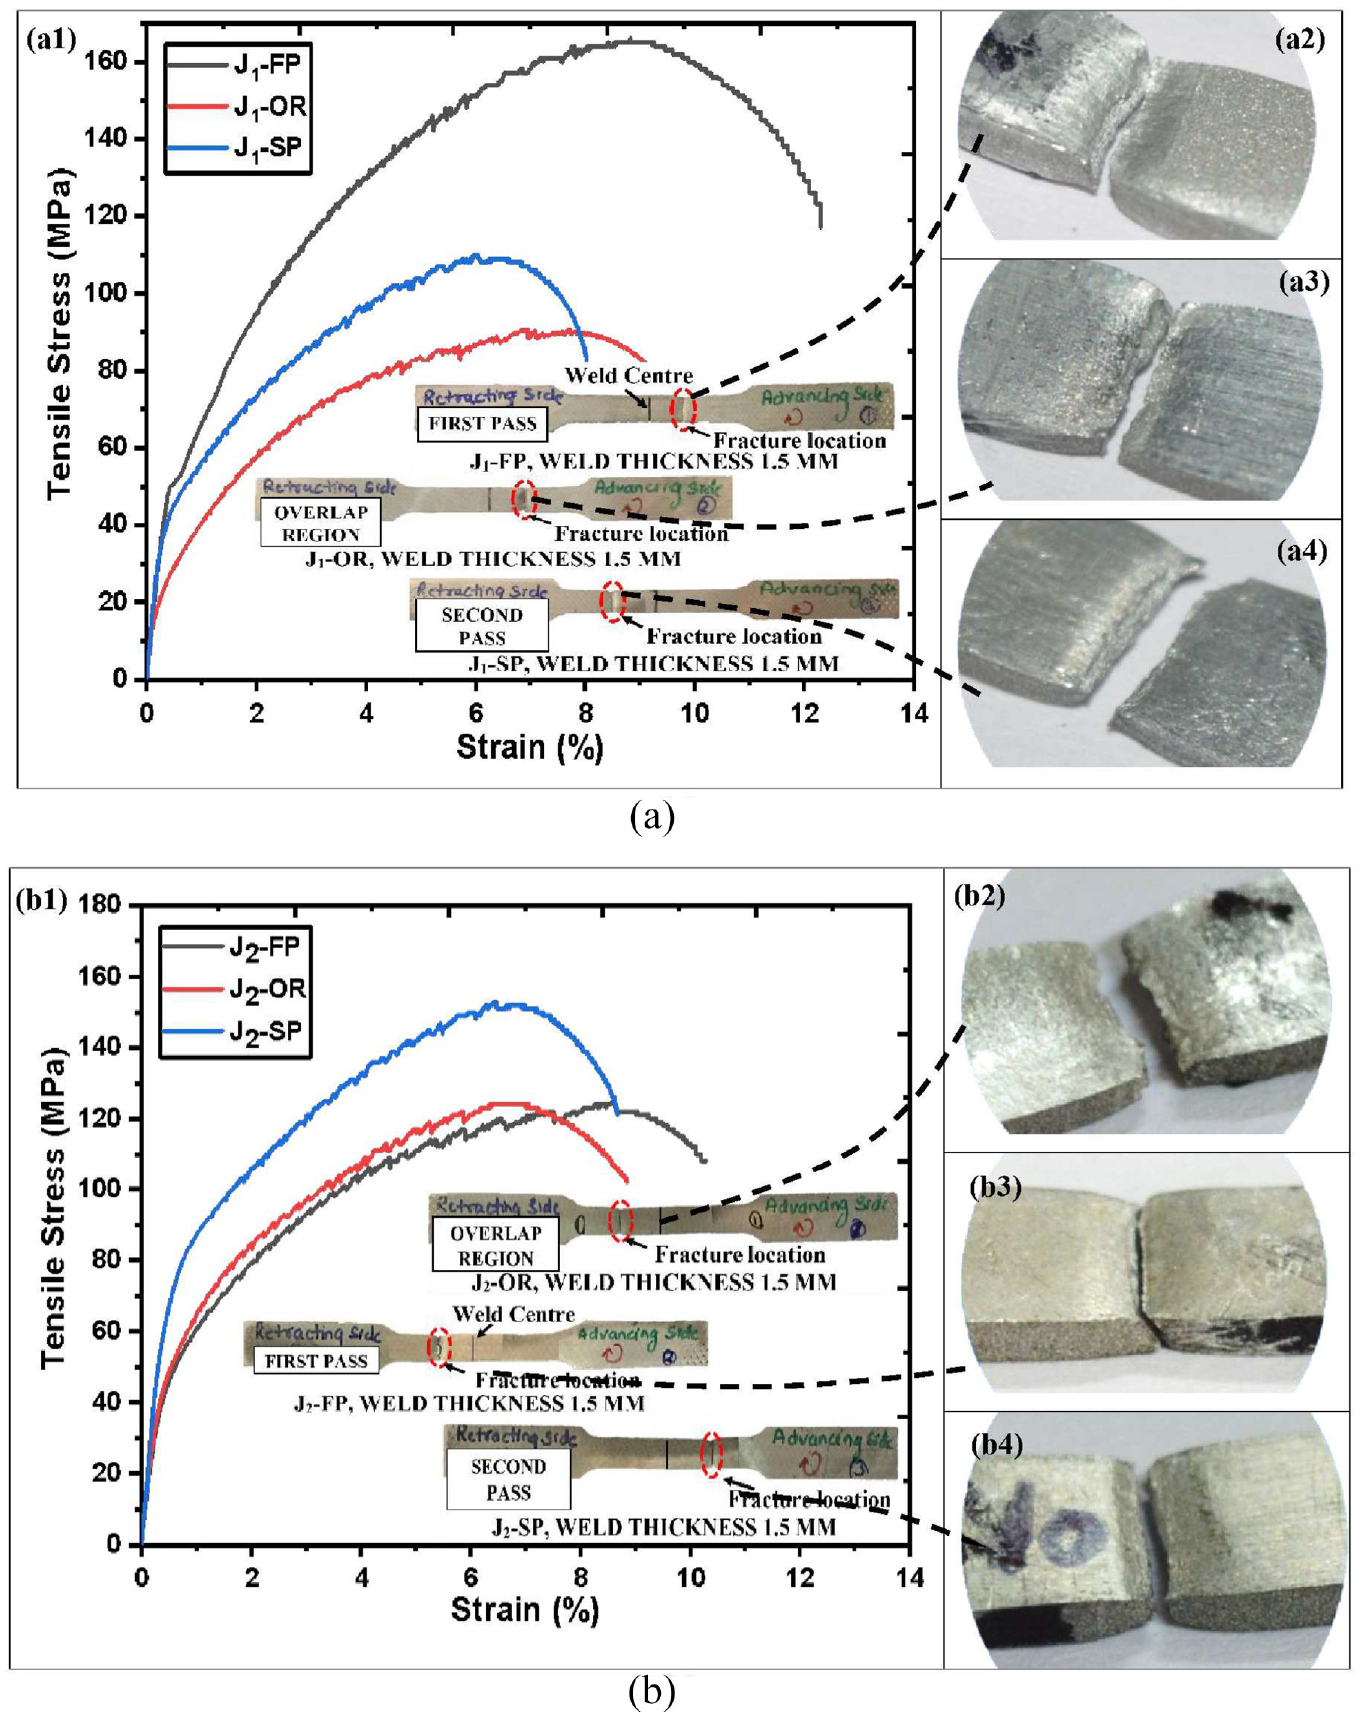
Tensile properties of layered specimens (a) J1 (b) J2.
Figure 11(a2-a4) and (b2-b4) show the fractured tensile specimens and the enlarged view of the fractured ends of layered specimens of J1 and J2 welded joints, respectively. It is observed for the J1 welded joint, that except J1-SP specimen, other layered specimens (J1-FP & J1-OR) fractured in the HAZ region of the advancing side. While, for J2 joint, J2-FP (Figure 11(b2)) andJ2-OR (Figure 11(b3)) specimens fractured in the region of HAZ in the RS, and J2-SP (Figure 11(b3)) specimen in the AS.
Impact properties of the DS-FSW joints
Charpy V notch impact tests on DS-FSW joints viz. J1 and J2 were performed at room temperature, wherein, the V notch engraved across the weld cross-section enclosed the first pass, second pass, and the overlapped region for both the welded joints. The testing results (Table 5) were obtained directly as CVN value in Joules, and indirectly as lateral expansion and percentage shear area from the fractured ends of impact tested specimens.
Impact properties of J1 and J2 joint.
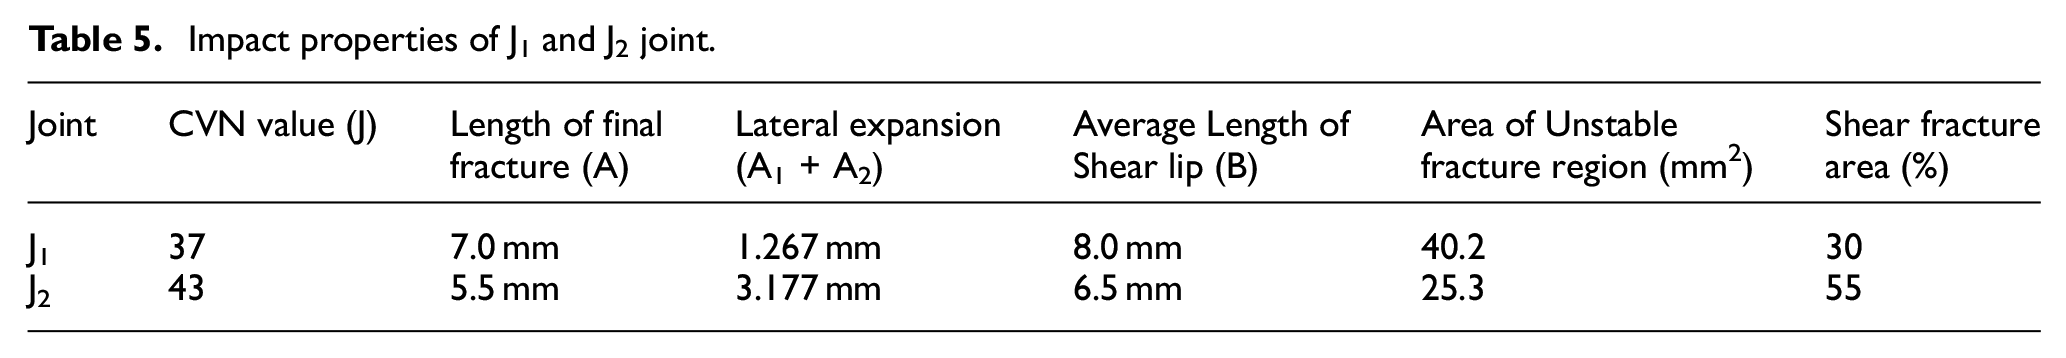
It could be ascertained from the results, that both the welded joints possessed better impact toughness as compared to the base metal. However, the joint J2 exhibit higher impact toughness with the CVN value of 43 J as compared to joint J1 (37 J). The higher toughness of J2 joint compared to J1 joint was further substantiated from the measurements of lateral expansion and percentage shear area of the fractured impact specimens shown in Figure 12 as per the ASTM: E 23-12c standard. 30
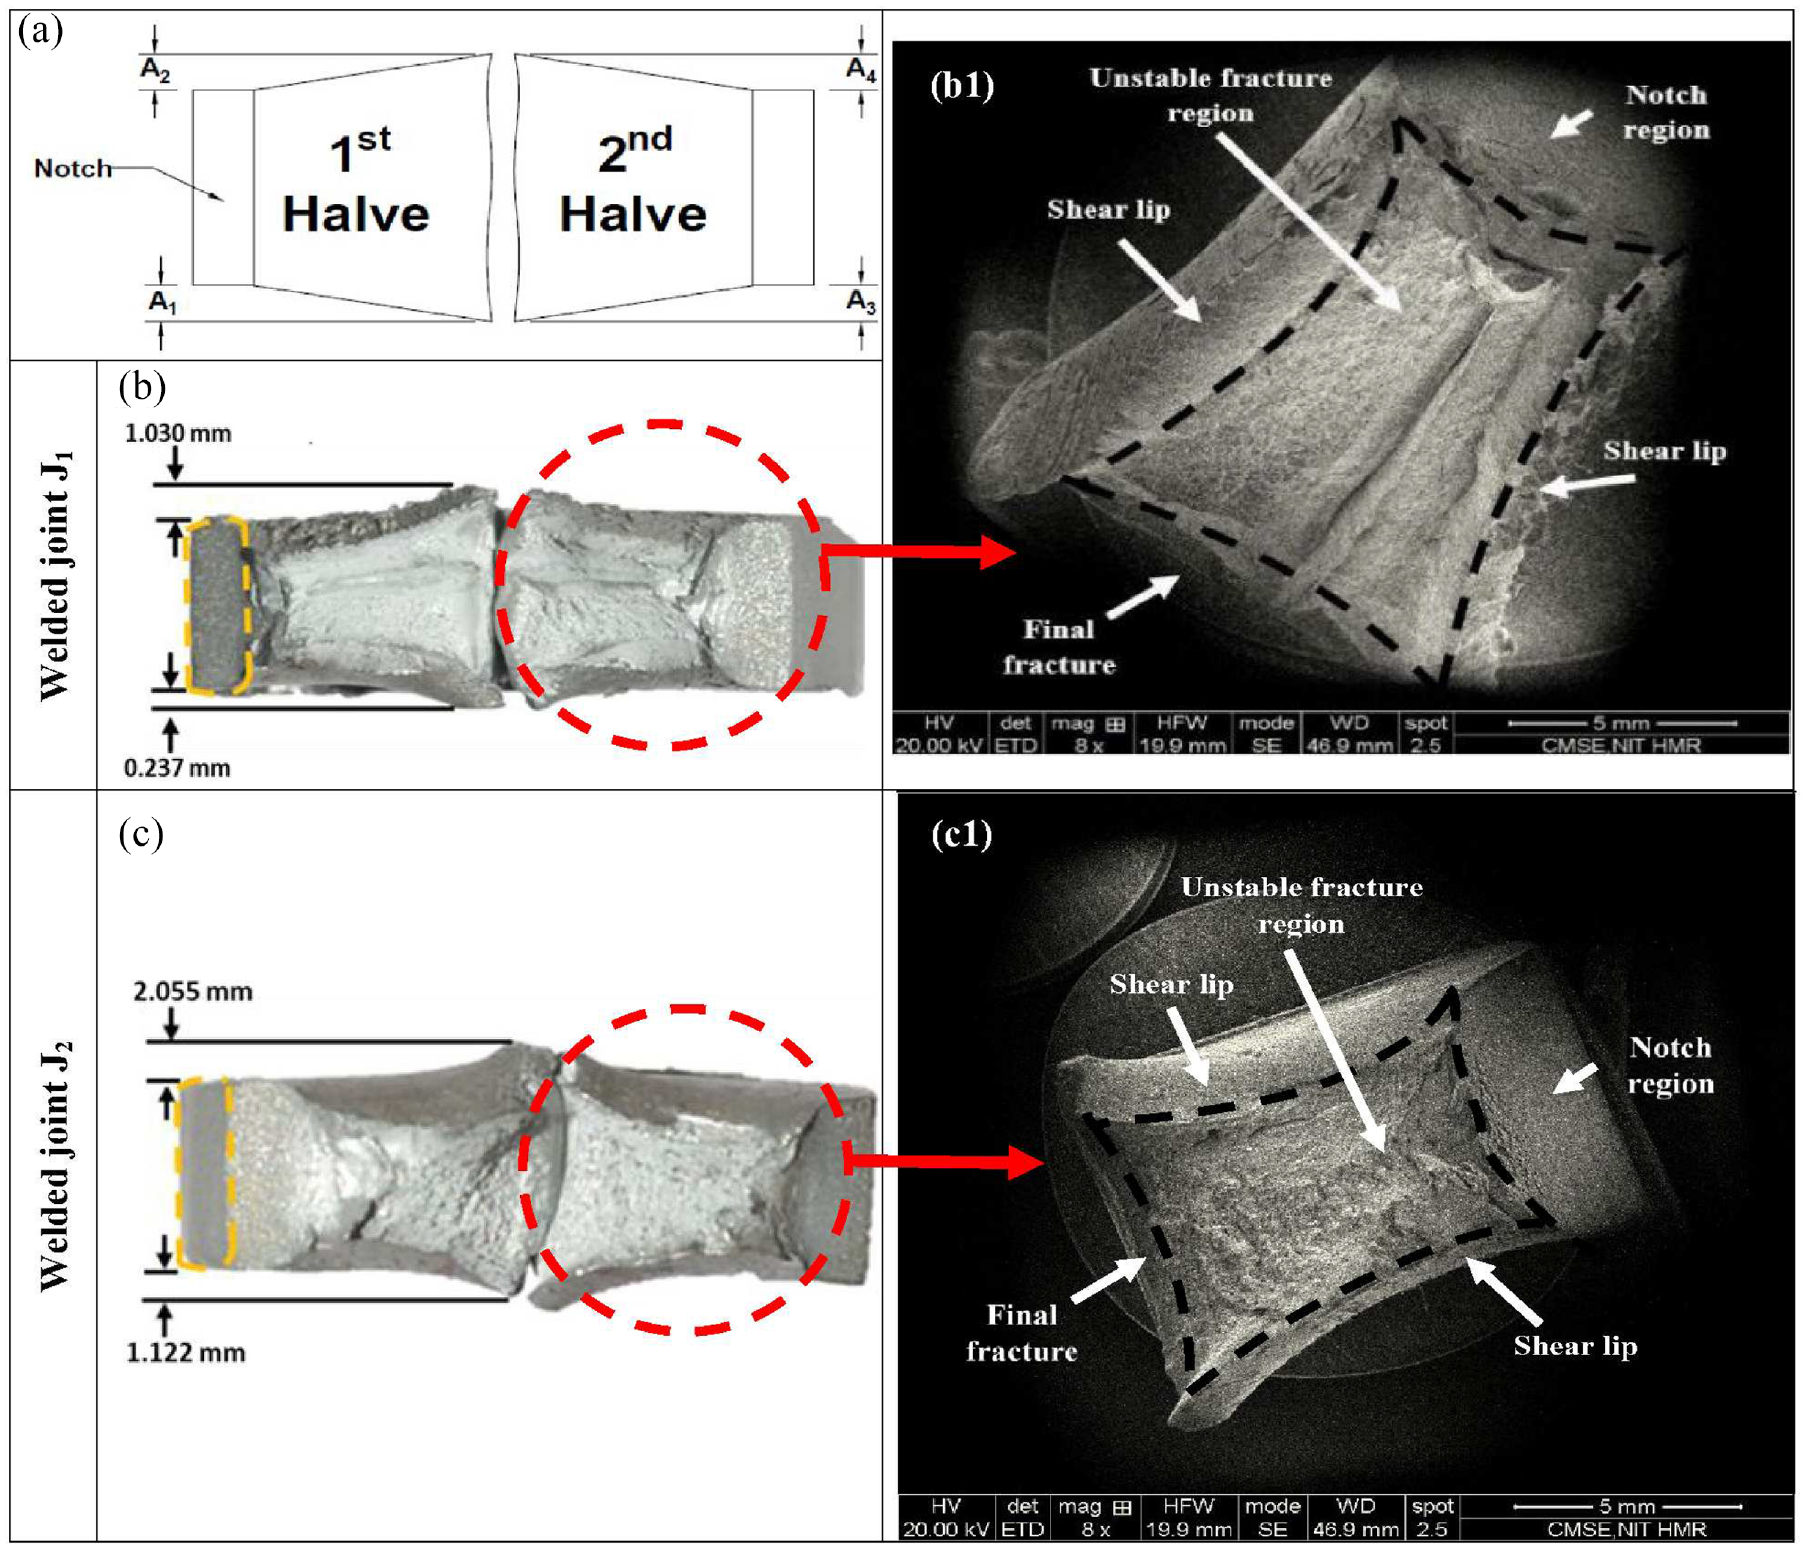
(a) Schematic representation of fractured impact specimen according to the ASTM: E 23-12c standard, (b) actual fractured impact specimen of J1 welded joint, (b1) SEM macrograph of fractured impact specimen of J1 welded joint, (c) actual fractured impact specimen of J2 welded joint, (c1) SEM macrograph of fractured impact specimen of J2.
The lateral expansion of the fractured ends of impact tested joints was measured by using the tool maker’s microscope (Make: Mitutoyo, Japan) of least count 0.005. Maximum expansion on each side of the one-half of broken specimens (J1 and J2) was measured relative to the plane defined by an undeformed portion of the respective side as shown in Figure 12. Correspondingly, the SEM macrograph of the one-half of the fractured impact specimen of J1 and J2 welded joint is shown in Figure 11. The results showed that the J2 joint displayed a higher lateral expansion of 3.177 mm as compared to 1.267 mm for J1 joint, which indicates that the J2 joint undergo higher plastic deformation compared to J1 joint before getting fractured. Moreover, the measurement of percentage shear area of the fractured impact specimens is used as an indicator of toughness and ductility of the material, that is, an increase in percentage shear area results in an increase in the CVN value of the tested material, and is well reported in ASTM standard. The results (Table 5) revealed that the percentage shear area of J2 welded joint was observed to be 55% compared to 30% for the J1 joint, which indicates higher toughness and ductility of the J2 joint. The observations also agree with the results reported for the welded joints in literature. 45
Conclusion
Aluminum alloy of grade AA6061-T6 was friction stir welded using double side square butt weld configuration using scrolled shoulder and frustum pin profile with left-hand threads. Two joints with zero-degree (J1) and two-degree (J2) tool tilt angles were formed using similar fabrication conditions and subjected to mechanical and metallurgical properties evaluation, which resulted in the following conclusions.
The welding tool with frustum-shaped left-hand threaded pin, and the scroll features, resulted in good material flow from the shoulder edge toward the pin and formed defect-free welded joints.
The extent of dynamic recrystallization within the SZ increased due to the incorporation of tool tilt angle, which led to a substantial drop in the mean grain size and an increase in microhardness of all the different regions of the J2 welded joint as compared to the J1 joint. In addition, the overlap region (OR) present within the SZ, shows the minimum average grain size of 5 µm for J2 joint and 8 µm for the J1 joint.
PFs analysis along [001] and [111] orientations revealed that the occurrence of
The incorporation of 2° tilt angle for J2 joint resulted in the joint efficiency of 69% as compared to the 57% for the J1 joint fabricated without tilt angle, which was measured for the macro/complete weld transverse tensile specimens. Moreover, the shifting of fracture from the RS (HAZ) to the AS (TMAZ) was observed, when the tilt angle changed from 0° to 2° for J1 and J2 joints respectively.
The welded joints J1 and J2 showed higher impact toughness as compared to the base material. However, the J2 joint showed higher impact toughness of 43 J as compared to the J1 welded joint (37 J). Moreover, the shear area fraction of 55% was observed for J2 joint, which shows higher ductility as compared to the J1 joint (30% of shear fracture area).
Footnotes
Declaration of conflicting interests
The author(s) declared no potential conflicts of interest with respect to the research, authorship, and/or publication of this article.
Funding
The author(s) disclosed receipt of the following financial support for the research, authorship, and/or publication of this article: The authors would like to express their gratitude for the support received from OIM and texture lab, IIT Bombay for help in EBSD testing