
Abstract
Presence of defects in the gas turbine blades’ affects the blade performance and reduces the blade life. One of the common defects in the internal cooling passages of a gas turbine blade, is residual ceramic created in the blade production stage. This types of defects, can be beneficially detected by using active thermography. In this paper, nondestructive testing of internal cooling passages of a gas turbine blade is conducted by active thermography method using different types of excitations. Carbon dioxide (CO2), hot air, and water-vapor were selected as excitation sources. Inspection with water-vapor stimulations were performed at three different pressures flow rates. Results indicated that the IR thermography tests with water-vapor excitation, provide higher detectability compared to the other methods. However, internal passages were revealed by all of the pre-mentioned excitation methods. Residual ceramic in internal passages of the blade were clearly revealed by application of hot air and water-vapor. Results also indicated that application of the maximum pressure and flow rate, offer a better detectability and visibility. Some surface defects on the gas turbine blades were also been detected by application of water-vapor excitation.
Keywords
Introduction
Gas turbines, stand as one of the most important parts in many industrial fields such as power-generation, oil and gas industry, aerospace and maritime industry. 1 The most crucial parts of a gas turbine, are turbine blades.2–4 Efficiency of a gas turbine engine is directly related to the inlet gas temperature and pressure.3,5 In order to enhance the efficiency of a turbine, the inlet gas temperature and pressure shall be elevated. Inlet gas temperature could be raised to 1700°C. 6 Therefore, nickel-based super-alloys are generally selected as blade material.5–7 Moreover, turbine blades are working under extremely corrosive and erosive conditions which is imposed by oxidizing gas and mechanical fatigue. 8 In order to withstand under high temperature and highly corrosive condition different cooling systems such as internal cooling are considered inside of the blade and different types of Thermal barrier coating (TBC) are employed.6,7,9,10 Efficiency of gas turbine blades are affected by various kinds of anomalies related to manufacturing stage or operational stage. Therefore, blades are the most rejected parts of gas turbine engines. Damaged caused by excessive temperature and ingested materials are common in the blades. 11 Consequently, blade cooling and blade coatings have vital role in blade endurance. Turbine blades are generally produced by investment casting with modifying different casting techniques.12,13 Cooling runners are made by applying ceramic cores in the mold at casting stages. Ceramic core is withdrawn by applying chemical-etching method after casting completion.14,15 Due to the complex geometry and in some cases low dimensional accuracy occasionally, the ceramic core is not removed completely.13,16 Remain ceramic decreases the flow rate of cooling fluid or even block the cooling passage and prevent from sufficient blade cooling. Consequently, in order to validate the proper performance of cooling passage, it is necessary to perform a Non-Destructive Evaluation (NDE) after ceramic core removal. 16 Recently, many efforts have been conducted to investigate effectiveness of different non-destructive testing (NDT) methods. Optical methods, Microwave testing, Ultrasonic test (UT), Eddy current Test (ET), Acoustic Emission (AE), Visual testing (VT), Fluorescent Penetration Inspection (FIP), and Radiography testing (RT) are the proposed NDTmethods for blade inspection.17,18 Besides application of optical, Magneto-resistive, and capacitor sensors are also developing mostly for shape and dimensionalcontrol.18,19 Optical methods could be affected by smoke particles and high temperatures. 20 Capacitor and microwave sensors are sensitive to gas permittivity variations and temperature variations respectively.18,20 Application of electric voltage in a hot gas stream to inspect an aircraft turbine blade has been investigated by Grinkrug et al. The electric current can be varied by ionization of the gas influenced by active substances. The authors proposed KNO3 as a proper active substance which can be used to detection of micro cracks in the blade. 21 Besides, X-ray computed tomography (XCT) has been employed to detection of structural defects in the gas turbine blade. 22 Acoustic methods also propped for testing of the gas turbine blades. 23 Among the conventional NDT methods, visual testing, radiography, Eddy current, and ultrasonic methods are more popular.24,25 However every conventional method has its own limitations. For example, Ultrasonic Testing needs direct access to the surface and is not perfect in many cases. Additionally, results of ultrasonic testing are influenced by the crystal orientation of blade material.18,26,27 So, this method is usually used for dimensional control. X-ray radiography is a time consuming unsafe method. Moreover, interpretation of the results for the blades with complex shapes, is very difficult. 25 The Eddy Current Test can be used only for inspection of near surface defects. Acoustic methods could be used only for dynamic defects. Application of IR thermography could solve more of above-mentioned problems. Recently, application of thermography has been increased in non-destructive evaluation of different materials such as polymeric composites, metal laminates, and coatings due to its advantages including rapid and non-contact inspection, cost-effective, and efficiency.28–30 In this method infrared radiations emitted from surface of the object is recorded by means of an infrared camera. Presence of anomalies and discontinuities causes abnormal thermal energy distribution and meanwhile leads to abnormal temperature variations on the surface which could be detected by the thermal camera. IR thermography can be performed whether in passive or active form. In passive thermography the temperature contrast is mostly generated by unusual working conditions such as excessive loads, misalignment, thermal fluctuations. Unlike; in active thermography in order to defect detection, an external energy source is employed. 30 Cracks, delamination, humidity, and impact damages are exemplary defects could be detected by active thermography method. 28 Intense researches have been carried out in order to study the influence and effectiveness of various types of external energy sources such as flash lamps, ultrasonic waves, microwave and electrical current, and laser. Moreover, the external excitation can be applied in pulse, step-pulse, modulated, or lock-in form.28,31
Nowadays, application of active thermography in non-destructive evaluation of gas turbine blade has been investigated in numerated studies. Wu et al. 29 presented the application of active thermography in inspection of gas turbine blades. They used hot air for evaluation of blade’s internal cooling runners. Lock-in excitation with frequency of 0.47 Hz was selected. Results of lock-in and optical pulsed stimulation were compared. The authors indicated that lock-in thermography using hot air excitation outcomes better outputs. Yang et al. 32 used halogen lamps to detect cracks on the surface of gas turbine blade and employed a heating system based on the electrical resistance mechanism to investigate coating layer of the blade. Goldammer and Heinrich 27 used thermography aided hot air excitation to inspection of wall thickness in gas turbine blades. Marinetti et al. 33 evaluated coatings of gas turbines by thermography using optical stimulation. They proposed a method based on time-domain heat emission coefficient analysis in order to discriminate signals related to variations of coating thickness which are not considered as a defect, and adhesion defects. Gao et al. 34 used vibro-thermogrphy technique to detect cracks in an aircraft engine turbine blade. Meola et al. 16 utilized lock-in thermography of gas turbine blades to detect ceramic-residual defect in its cooling runner. Bogdan et al. 35 used xenon flash pulsed thermography to inspect the gas turbine rotor blades. Ozeki et al. 36 investigated thermography using Laser stimulation to examine thermal barrier coating of gas turbine blade. Shi et al. incorporated IR thermography and an algorithm based on the gray gradient space histogram entropy (GGSHE) to assess the thermal barrier coating of a turbine blade and detect the crack at inner volume of the coating. The authors indicate the significant capability of this method in the crack position and density detection. 37 Investigation of past researches indicates that few efforts have been conducted to residual ceramic defect inspection by active thermography method. Hence a need of qualitative research in the application of active thermography in the inspection of the cooling runners of a gas turbine blade is sensible.
In this paper, application of the active thermography in gas turbine blade coating and internal cooling system is investigated using four different excitation methods. Hot air, Carbon dioxide (CO2), Flash lamp followed by Carbon dioxide (CO2), and water-vapor were selected as excitation sources. In water-vapor excitation results are obtained in different pressure and flow rates. Results of different methods were analyzed and compared.
Experimental
Experimental test set-up
Figure 1 shows the experimental set-up used in investigation of a gas turbine blade. The blade has eighteen horizontals and two vertical internal passages. Infrared camera with resolution of 320 × 240 and temperature sensitivity of 0.05°C is employed. An electrical heater at power of 2500 W was used to generate water-vapor and prepare hot air. A relief valve with maximum pressure of 10 bar was connected to the pressure gage. In the case of optical excitation, a tungsten lamp powered at 2 kW was employed. A Teflon (PTFE) Fixture was employed to fasten the blade and guide CO2 gas, water-vapor, and hot air into the cooling passages. In order to eliminate the influence of IR radiations, the whole set-up was placed in a black textile- madden tent.
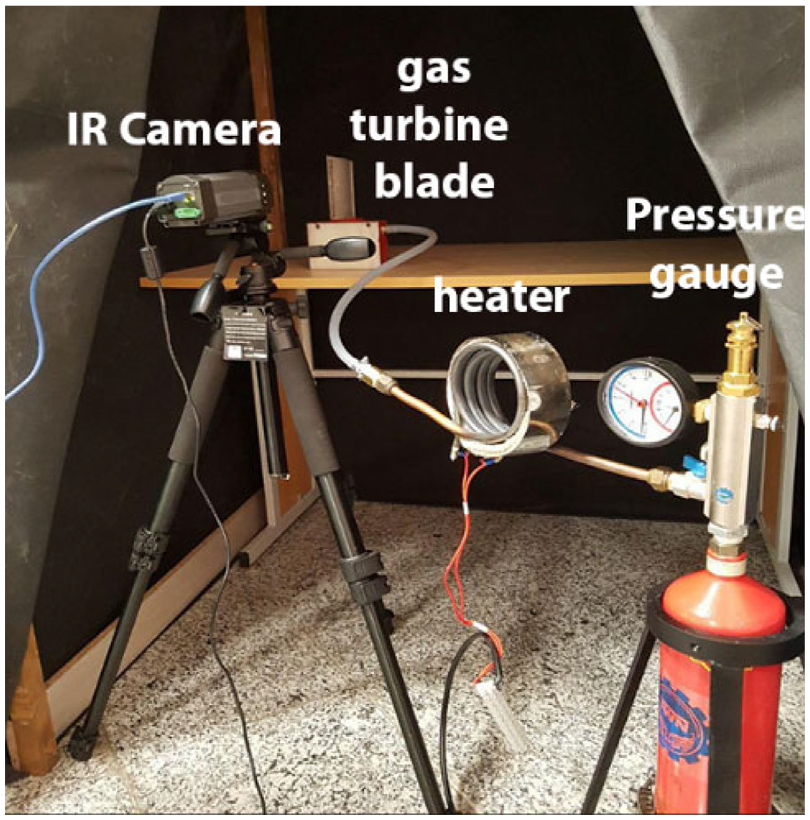
Experimental set-up used in this work.
Testing procedure
In the first experiment, IR thermography test was conducted using carbon dioxide stimulation. CO2 gas was injected almost 2 s at the constant pressure of 20 bar in to the cooling passes. Meanwhile data acquisition was carried out. In another attempt, thermography inspection was performed using 3 s optical excitation followed with 2 s carbon dioxide injection. The carbon dioxide cooling was performed at the same condition of previous test. In the second test, hot-air excitation was performed for 0.8 s. Short injection time was selected owing to exclusion of pressure reduction effect on the test results. Water-vapor was selected as an excitation source for third thermography inspection. Water-vapor was injected into the blade cooling passes at three different inlet pressures of 0.4, 1, and 2 bars. Blade initial temperature was set at the ambient temperature (24°C). In the last effort, the blade was inspected by means of thermography testing using ice-water cooling followed by water-vapor heating. Water-vapor excitation performed at three different flow rates including maximum flow rate in which the injection valve was fully opened, 10% of maximum flow rate and 50% of the maximum flow rate.
Results and discussion
Results of thermography inspection using CO2 cooling
Thermal images related to the inspection of the gas turbine blade by means of IR thermography with carbon dioxide stimulation are shown in Figure 2. Figure 2(a) demonstrates the thermal image of the blade before injection of the CO2. Clearly all the zones are at the same temperature. After 0.06 s, passages’ departures are become visible regarding to the temperature reduction created by CO2 gas. The visibility and clarification of passages enhanced with time pass until t = 1.6 s. Clarity has been reduced in thermal image related to t = 2 s. In all of the thermal images, horizontal passages are visible; however, proper thermal contrast that could illustrate vertical passages was not achieved. Moreover, no anomaly was clearly detectible inside the runners. As a consequence, application of CO2 under above-mentioned conditions, couldn’t illustrate the details.
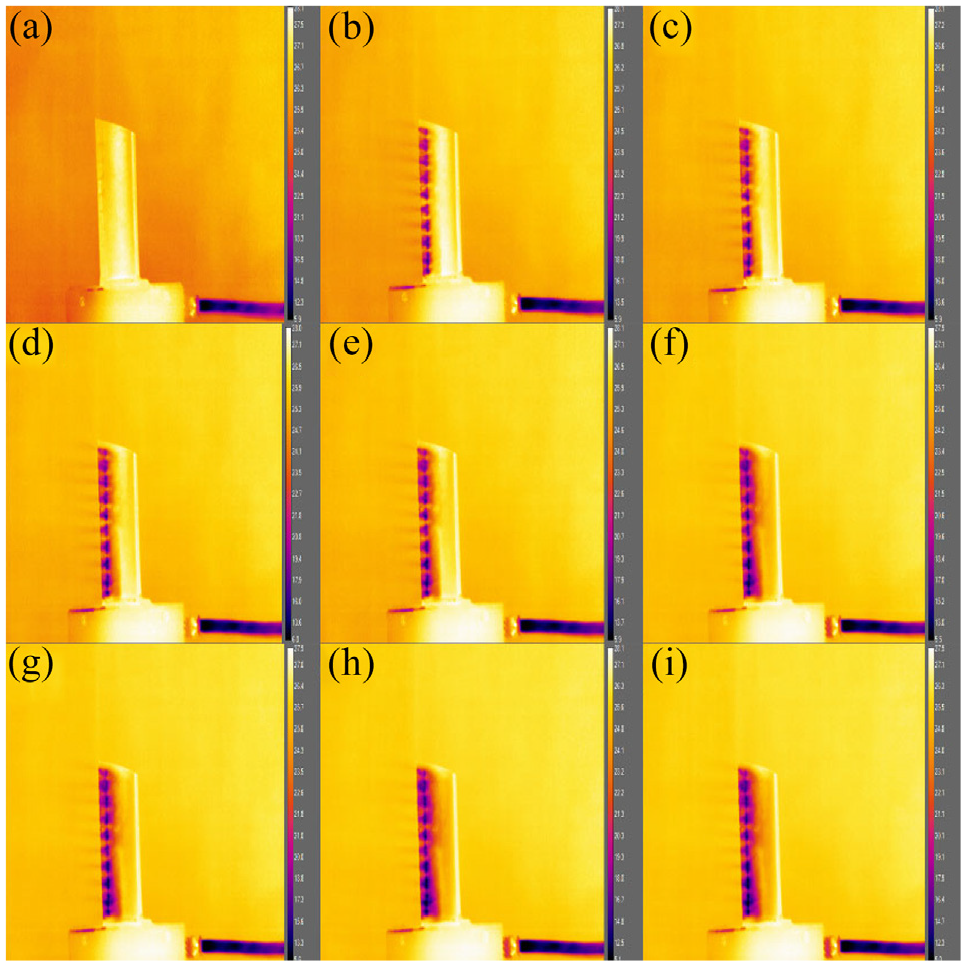
(a) Thermogram before application of CO2, (b) 0.6 s, (c) 0.8 s, (d) 1 s, (e) 1.2 s, (f) 1.4 s, (g) 1.6 s, (h) 1.8 s, and (i) 2 s.
Figure 3, depicts the results of thermography inspection using flash lamp stimulation followed by CO2 excitation. The thermal image obtained by the thermography with just the flash lamp excitation, is shown in Figure 3(a). In this image, the runners are not visible clearly. Figure 3(b) to (d) illustrate the results of the thermography using CO2 cooling which is performed immediately after the optical heating. Blade temperature has been totally reduced by application of carbon dioxide. Passages are barely distinguishable and this indicates that incorporation of optical excitation at the mentioned power has negative effect on the performance of the thermography using CO2 stimulation. Complex shape of the blade surface, leads to an ununiformed heating. Furthermore, conduction heat transfer in metallic-based blade is extremely high and this complicates the defect detection. Consequently, optical stimulation using flash lamp cannot be appropriate for this case.
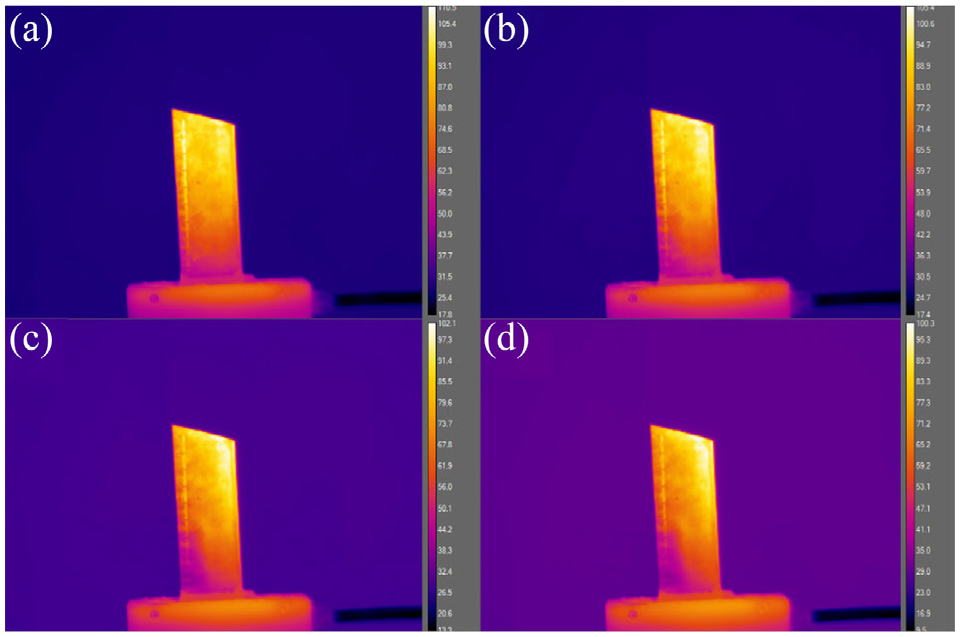
Thermograms taken (a) immediately after the flash lamp excitation, (b) 0.6 s, (c) 0.8 s, and (d) 1.2 s.
Results of thermography testing using hot-air stimulation
Figure 4 illustrates the results of thermography aided hot-air excitation. Clearly, this technique generates better results in comparison with previous methods. The cooling passages become visible with a proper clarity. Moreover, a ceramic residual defect was detected in Figure 4(c). It can be realized that for inspection of cooling passages, hot-air stimulation has a better performance compared to the flash lump and CO2 stimulations.
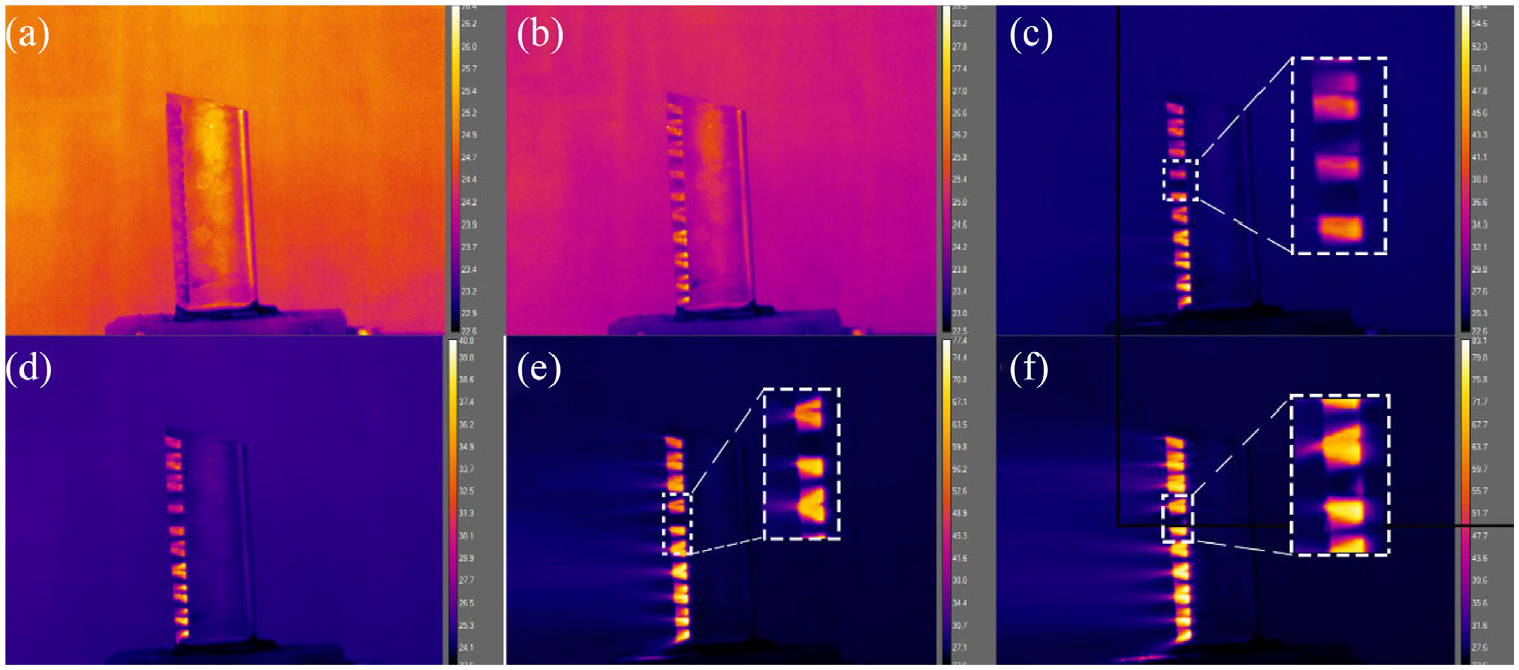
Thermograms related to hot-air stimulations: (a) before excitation, (b) 0.3 s, (c) 0.5 s, (d) 0.6 s, (e) 0.7 s, and (f) 0.8 s.
In order to evaluate the performance of the hot-air excitation, temperature variations along the horizontal and vertical cooling passages have been plotted. As shown in Figure 5(a), horizontal lines 1 and 2 specify the variation of temperature from left to right for lower and upper horizontal cooling channels at 0.7 s respectively. Temperature contrast in upper line which is related to the third upper passage is much more than the lower one which is regarded to the third passage from the bottom. This indicates that the lower passage may be partially obstructed. At the vertical direction (Figure 5(b)) peaks indicate the higher temperature at horizontal runners due to the existence of the hot fluid. The peaks with higher values indicate the proper fluid flow and specifies that the runner is fully open. Residual ceramics, cause runner obstruction and prevent fluid passages. Consequently, the peaks with a lower value, can be regarded as the horizontal passages containing residual ceramic. As previously mentioned, 18 horizontal runners exist in this blade. However; 17 peaks can be identified in the figure. This indicates that one of the horizontal runners, is completely obstructed which is confirmed in the thermal image of 4(e).
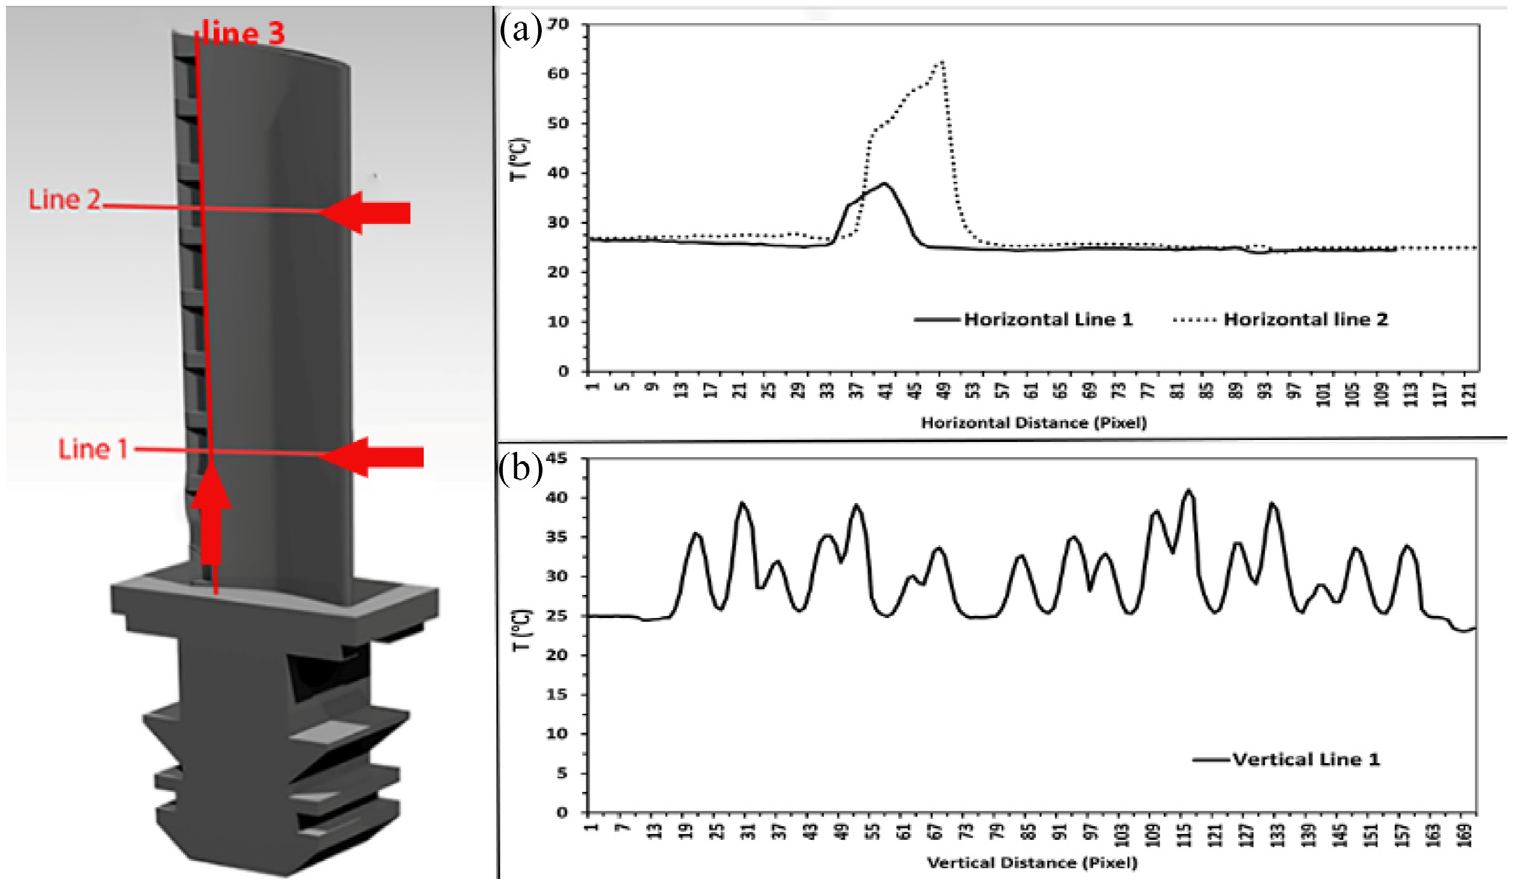
Temperature variations (a) along line 1 and 2 and (b) along line 3.
Results of IR thermography using water-vapor stimulation
Thermal images related to the experiments with water-vapor stimulation are displayed in Figure 6. As previously mentioned, thermography using water-vapor were carried out at three different vapor pressures of 0.4, 1, and 2 bars. Figure 6(a) shows the thermal image obtained at the injection pressure of 0.4 bar. Figure 6(b) and (c) display thermal images regarded to vapor pressure of 1 and 2 bar respectively. Residual ceramic defect has been revealed in all the thermal images. A mixture of liquid and water-vapor has been taken out at all the three pressure cases. This can be regarded to the vapor condensation through the vertical and horizontal passages by significant temperature reduction which is caused by the heat transfer between water-vapor and the cooling passage walls. Furthermore, the images specify that the outlet pressure in upper horizontal passages are less than the lower ones, which is related to the dynamic head reduction of the fluid as the fluid elevation. Considering this images, it can be realized that the injection pressure of 0.4 bar revealed better outcomes compared to the higher injection pressures. Temperature equalization at the surface of turbine blade occurs faster at the high injection pressures and this reduces the detectability of defects.
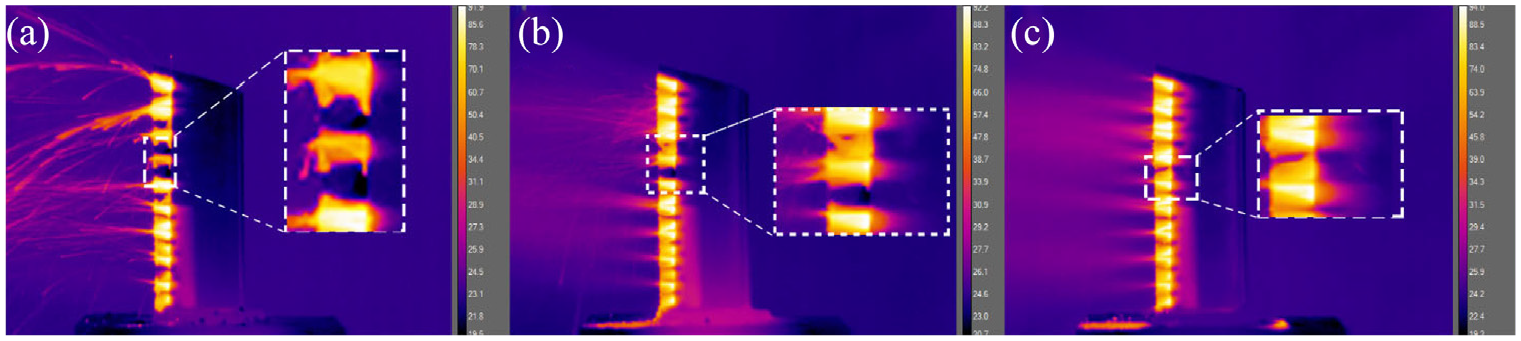
Thermograms related to water-vapor stimulations at 0.33 s and the pressure of (a) 0.4 bar, (b) 1 bar, and (c) 2 bar.
Intending to assess the effect of the injection pressure on the thermography inspection with water-vapor stimulation, temperature differences at longitudinal (vertical) direction are displayed after 0.33 s (Figure 7). Obviously, temperature contrast has been improved at pressure of 2 bar compared to lower vapor pressures. By comparing the results related to 0.4 and 2 bar, it can be concluded that the temperature contrast has been improved almost 21°C. At pressure of 0.4 bar, the number of detected runners is far less than the higher pressures. It can be realized that at the initiation of inspection, low injection pressure does not have enough capability in identification of all the runners. Consequently, proper defect detection is inaccessible.
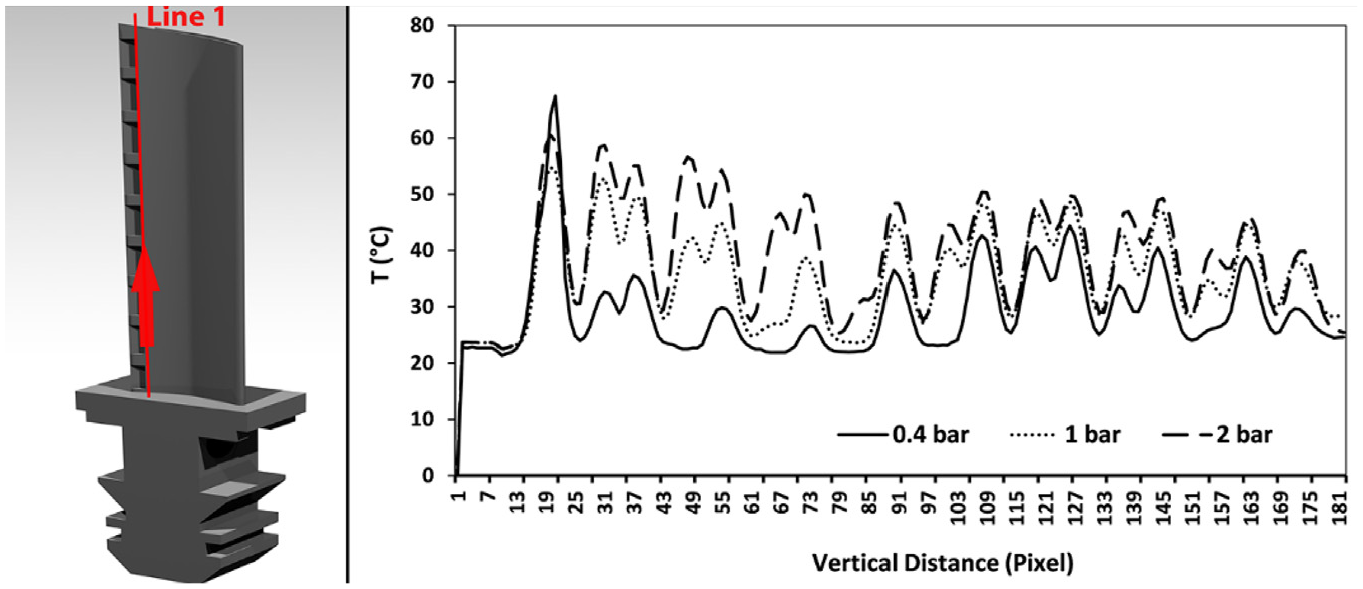
Temperature variation in longitudinal direction of blade at 0.33 s.
Temperature variations in vertical direction (upward) at 0.66 s after the start, are depicted in Figure 8. Deceptively, thermal contrast related to the test with vapor pressures of 0.4 bar has been improved. Results in lower regions and middle regions are different with Figure 7 and the thermal contrast in pressure 0.4 bar is higher than two others. Difference of temperature contrast related to the vapor pressures of 0.4and 2 bar has been decreased almost 10°C compared to initial times. In the other words, thermal contrast is reduced over time in the inspections with higher vapor pressures. This can be regarded to the fact that as pressure increases temperature equalizes earlier.
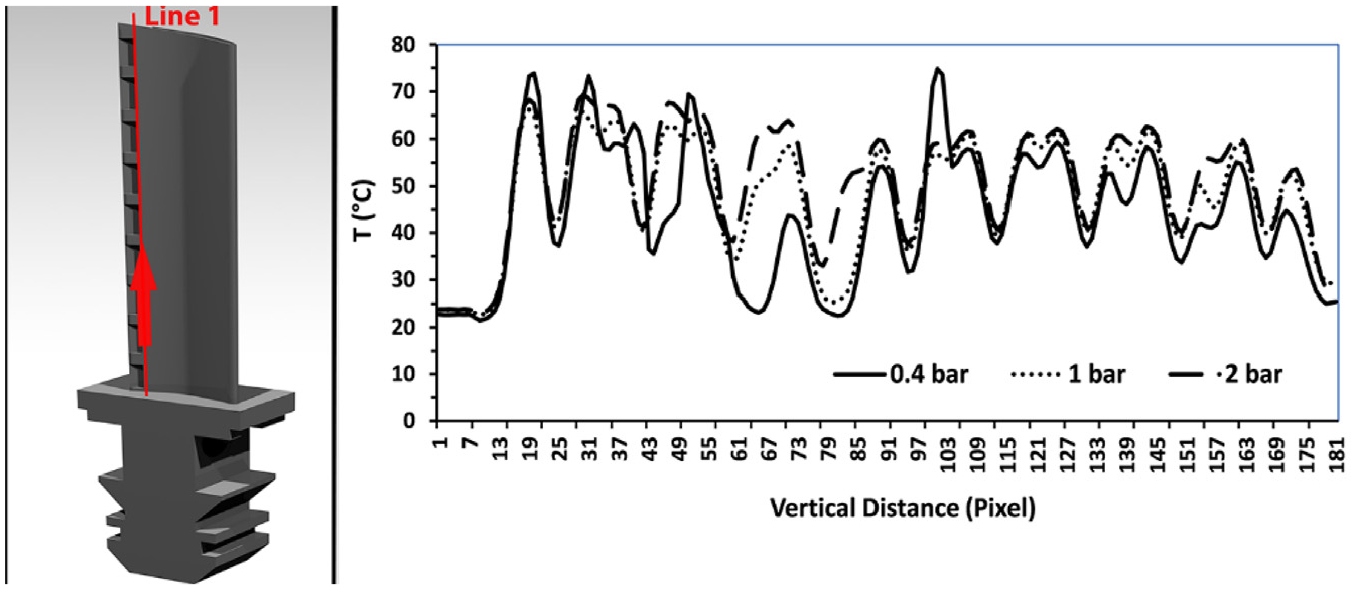
Temperature variation in longitudinal direction of blade at 0.66 s.
Application of cooling with ice-water mixture followed by water-vapor stimulation
Figure 9, shows the results of thermography of the blade, cooled with ice-water then heated by water-vapor injection. Water-vapor applied at three different flow rates including 10%, 50%, and maximum flow rate. Clearly, water-vapor with a flow rate of 10%, generated no output (Figure 9(a)). This means the flow rate is insufficient to lead to an effective inspection. Figure 9(b) illustrates the thermal image related to the vapor flow rate of 50% and injection pressure of 2 bar. Obviously, detectability has been improved and cooling runners become visible. Figure 9(c) illustrates the result of thermography with application of whole flow of the vapor. Temperature contrast has been further enhanced and runners could be identified clearly. Obstruction in horizontal passages could be detected obviously.
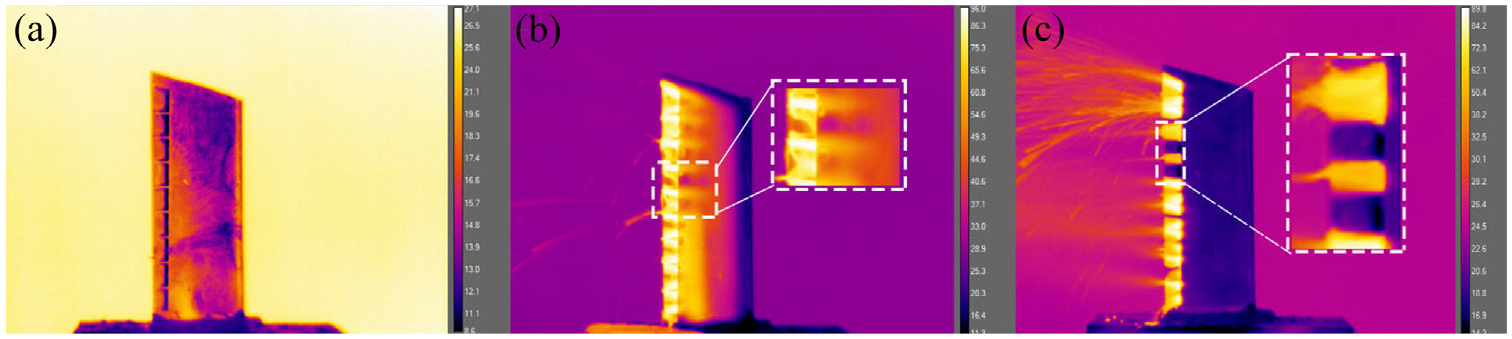
Thermal images related to: (a) 10% of total flow rate at 1 s injection at 1 bar, (b) 50% of total flow rate at 2.66 s vapor injection at 2 bar, and (c) total flow rate at start of 1 bar vapor injection.
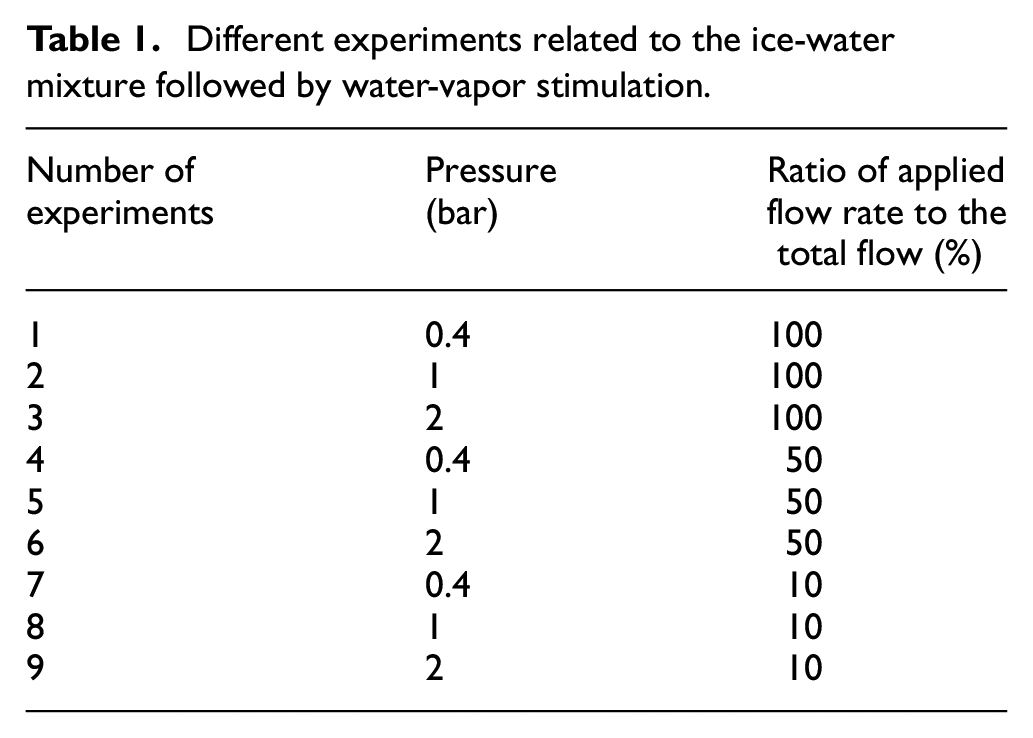
To compare the effects of the water-vapor flow rate and pressure on the residual ceramic detection of the blade, nine experiments are considered. These experiments are classified in the Table 1. The results of these cases are plotted along the four linear paths including lines 1–4 which are illustrated in Figure 10.
Different experiments related to the ice-water mixture followed by water-vapor stimulation.
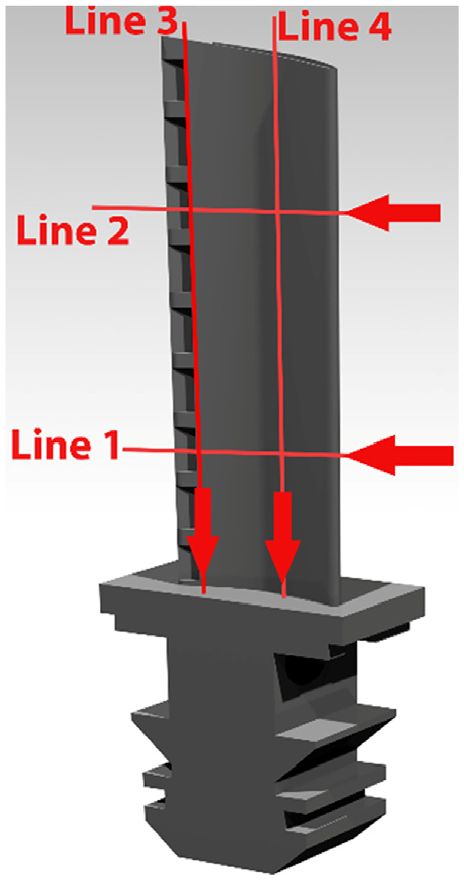
Directions considered aiming to compare blade temperature at different regions.
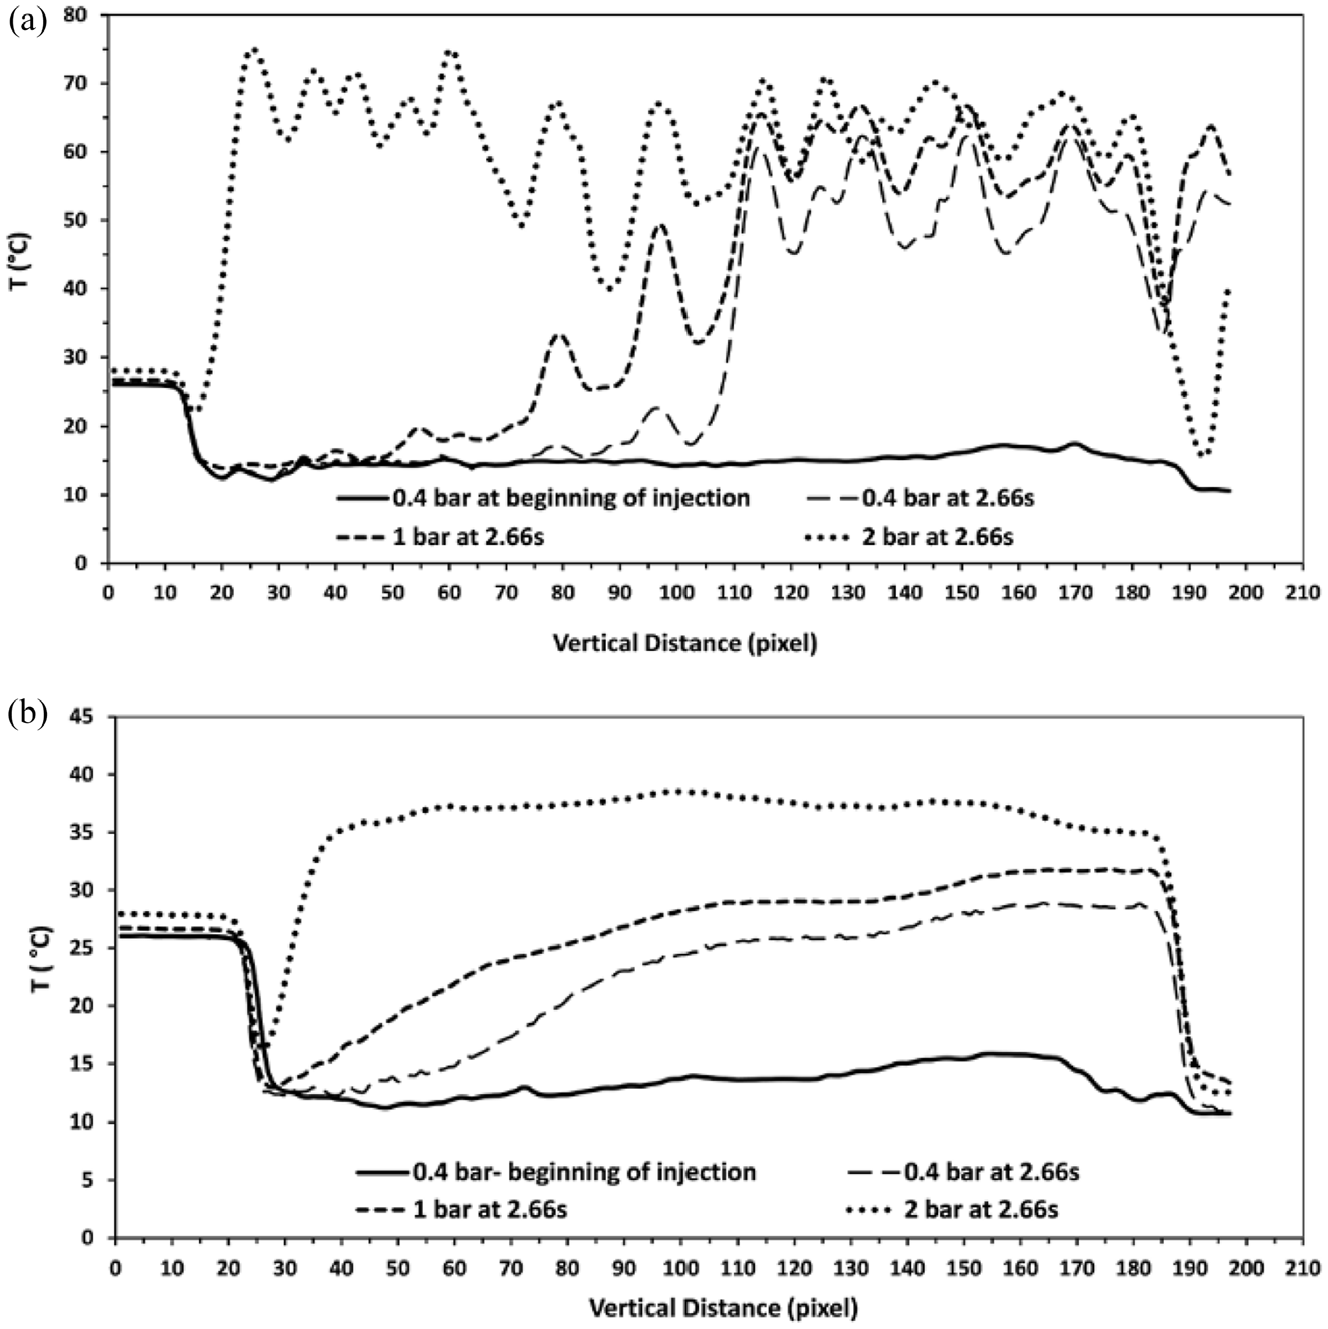
The temperature variations along the lines 1 (sixth lower horizontal passage) and line 2 (sixth upper horizontal passage) at a constant flow rate of 50% are illustrated in Figure 11(a) and (b) respectively. In each figure, temperature variation related to the thermography test at four different conditions are plotted. The first condition is related to the beginning of the vapor injection and vapor pressure of 0.4 bar and the other three are attributed to the experiments at 2.66 s vapor injection at the three different vapor pressures of 0.4, 1, and 2 bar. The almost constant low temperature dominates in both the lower and upper horizontal passages at pressure of 0.4 bar after ice-water cooling and can be seen at the beginning of the vapor excitation. At this time slight temperature variations could be observed in both lower and upper runners. After 2.66 s water-vapor stimulation, thermal contrast has been elevated significantly at all three selected pressures for lower runner (Figure 11(a)). In Figure 11(a) the elevation of temperature between 60 and 65 could be attributed to the vertical (longitudinal) wall which is continued to middle of the blade. The peaks at the right-hand side (horizontal distance of 80 and 90) can be regarded to the outlet of the horizontal runners. Unlike line 1, along line 2 which is related to the upper horizontal runner, thermal contrast increased only in the inspection excited at pressure of 2 bar. This leads to the idea that at this flow rate, vapor stimulation of 0.4 and 1 bar does not suffice the enough amounts of fluid to provide a proper thermal contrast on the surface of the blade.
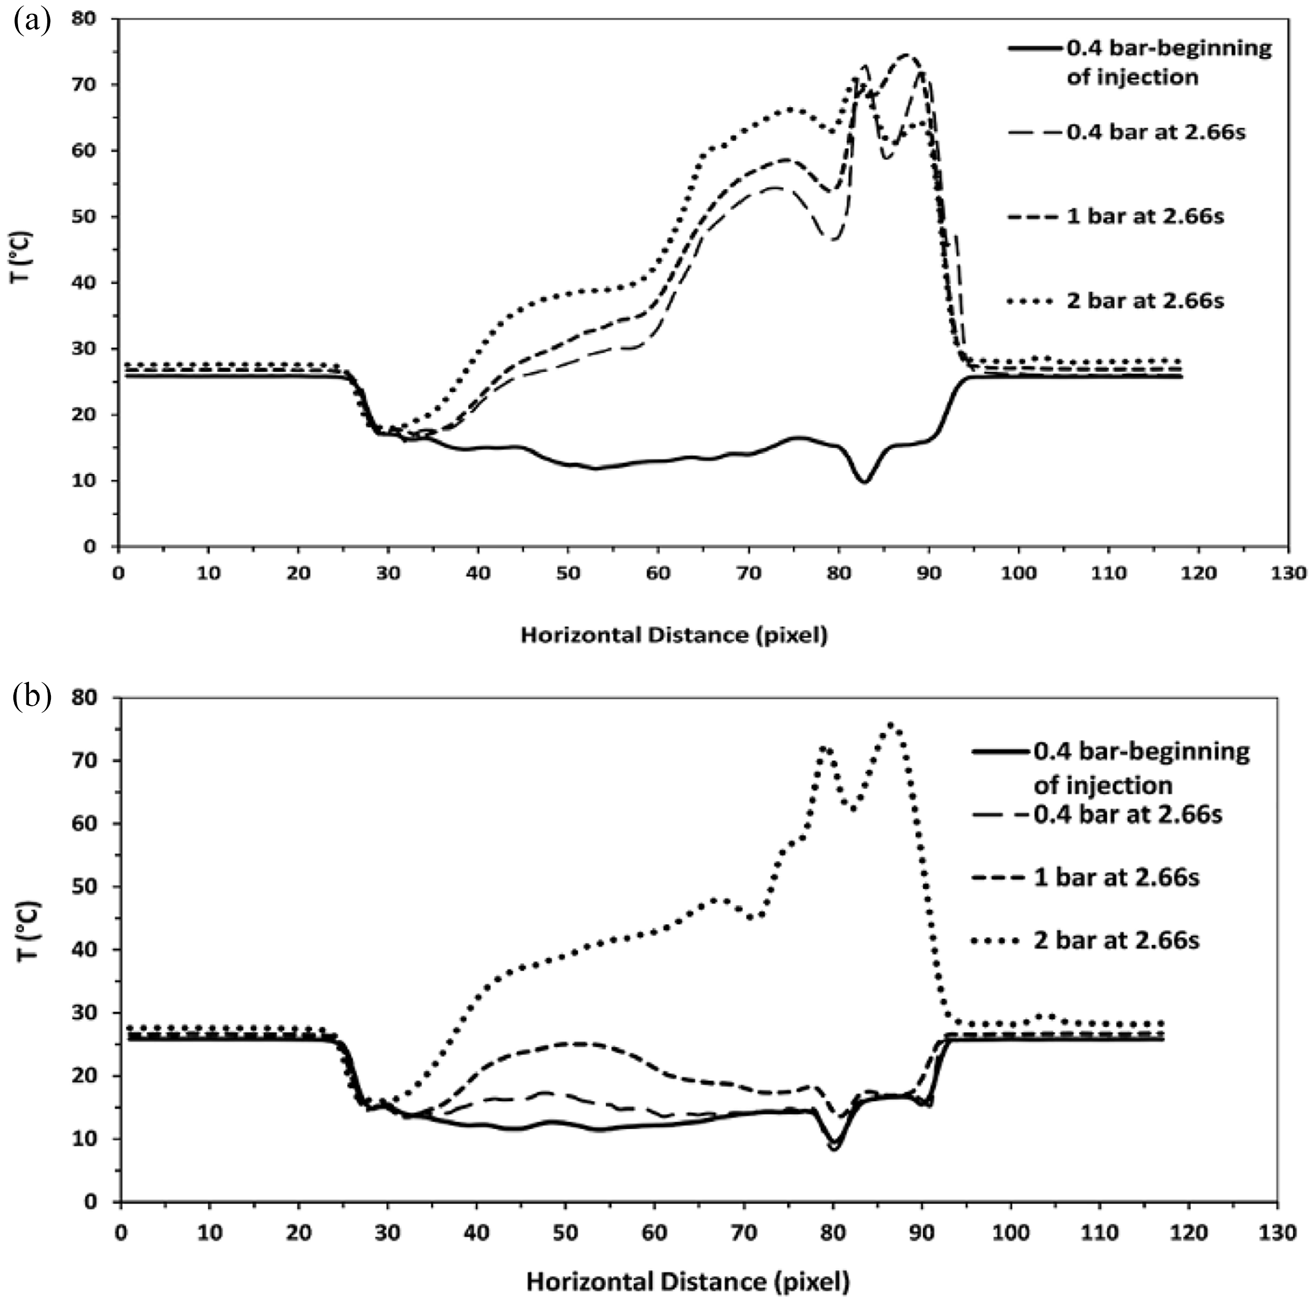
Temperature variations along the horizontal runners at 50% of the flow at different pressures: (a) line 1 and (b) line 2.
Figure 12 shows the variations of the temperature along the lines 3 and 4 which are regarded to the vertical cooling runners. Same as Figure 11, the diagrams are plotted after ice-water cooling followed by 2.66 s water-vapor injection at three different pressures and at the 50% of the maximum flow rate. Line 3 is drawn along left-hand side vertical channels and meanwhile intercepts the horizontal channels but Line 4 continues along right-hand side vertical channel. It is clear that in the left-hand side runner (Figure 12(a)), vapor injection at pressure of 2 bar generated a proper thermal contrast. At low pressures (0.4 and 1 bars), upper regions of the vertical runner, revealed low contrast which can be attributed to the reduction of fluid head and lack of sufficient fluid contents. Correspondingly, Figure 12(b) indicates that proper amounts of fluid at pressure of 2 bar leads temperature elevation in the whole of vertical runner, which specifies that no defect exists in right-hand side vertical runner.
Temperature variations at flow of 50% and different pressures, along path (a): 3 and (b) 4.
Figure 13 illustrates the temperature variations along the lines 1 and 2 at the flow rate of 100%, 2 s after injection of water-vapor. Thermal contrast at the pressure of 1 bar has been elevated compared to the previous inspection at the flow rate of 50%. Moreover, temperature increases along the line 2. Unlike previous flow rate, thermal contrast reduces with increasing the injection pressure. It could be attributed that a fast temperature equalization is happened at the high flow rates and pressures.
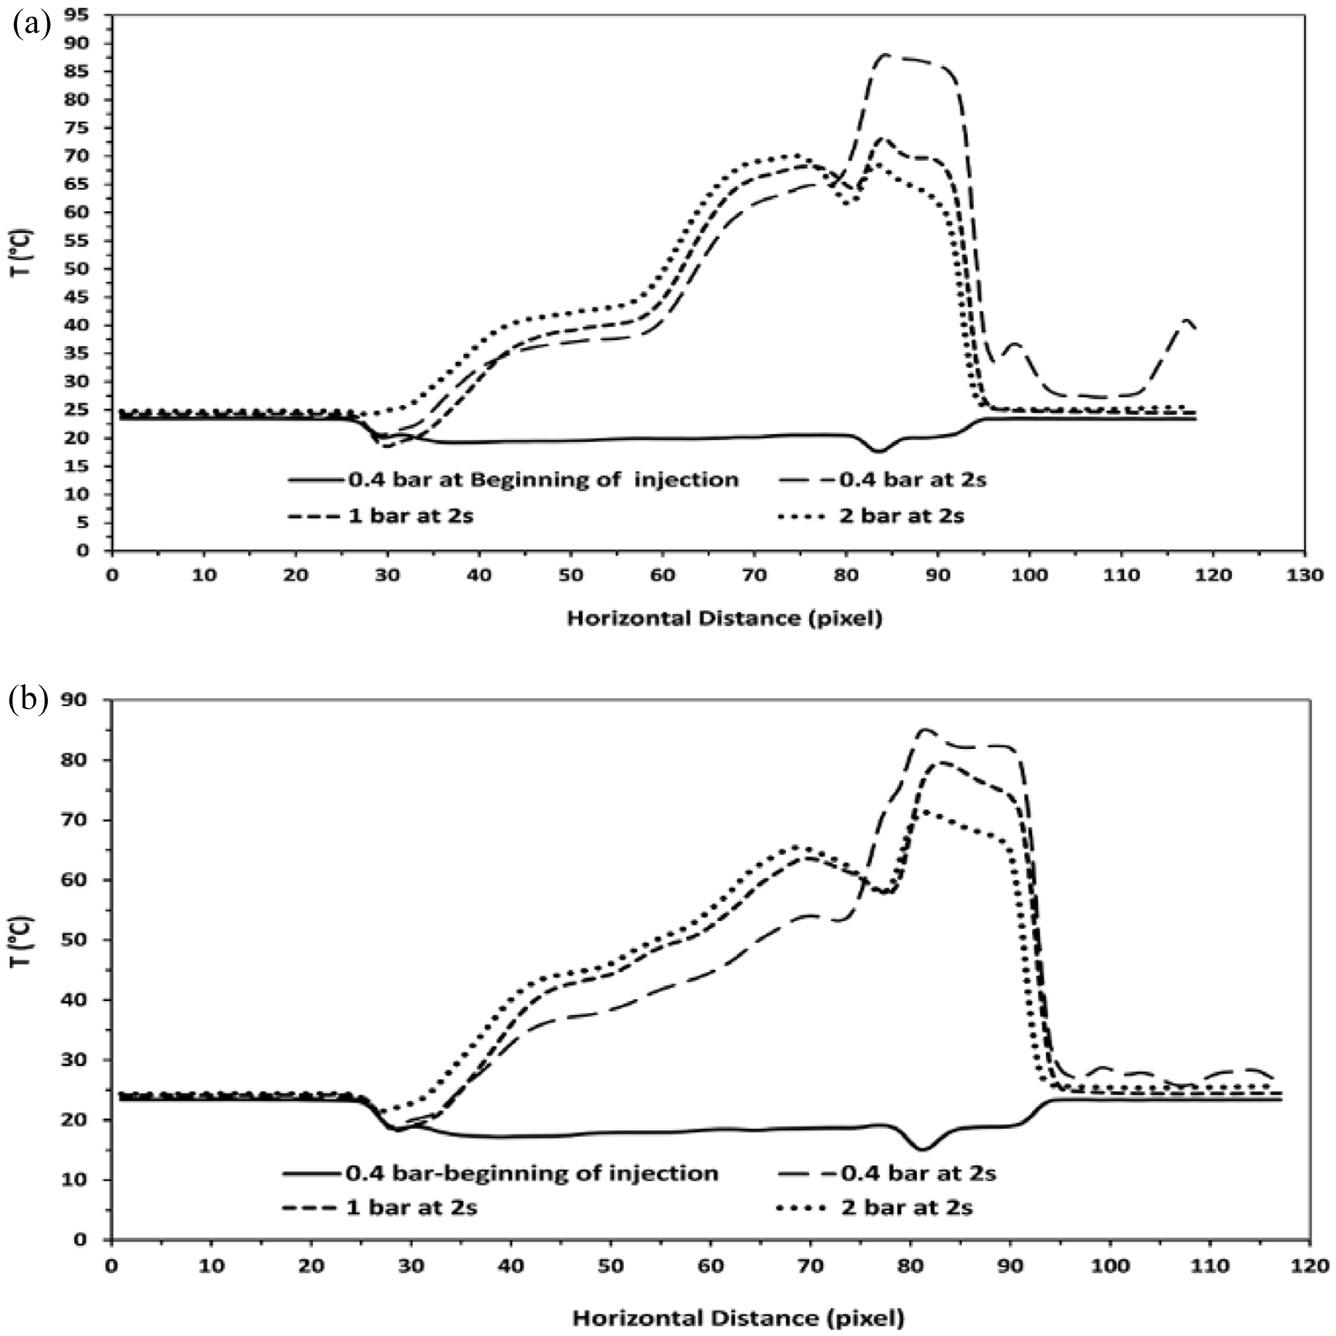
Temperature variations at total flow and different pressures, along path (a): 1 and (b) 2.
Temperature variations along line 3 and 4 regarded to the inspection at the maximum flow rate are shown in Figure 14(a) and (b) respectively. Thermal contrast and defect identification has been improved at this flow rate in comparison with 50%.
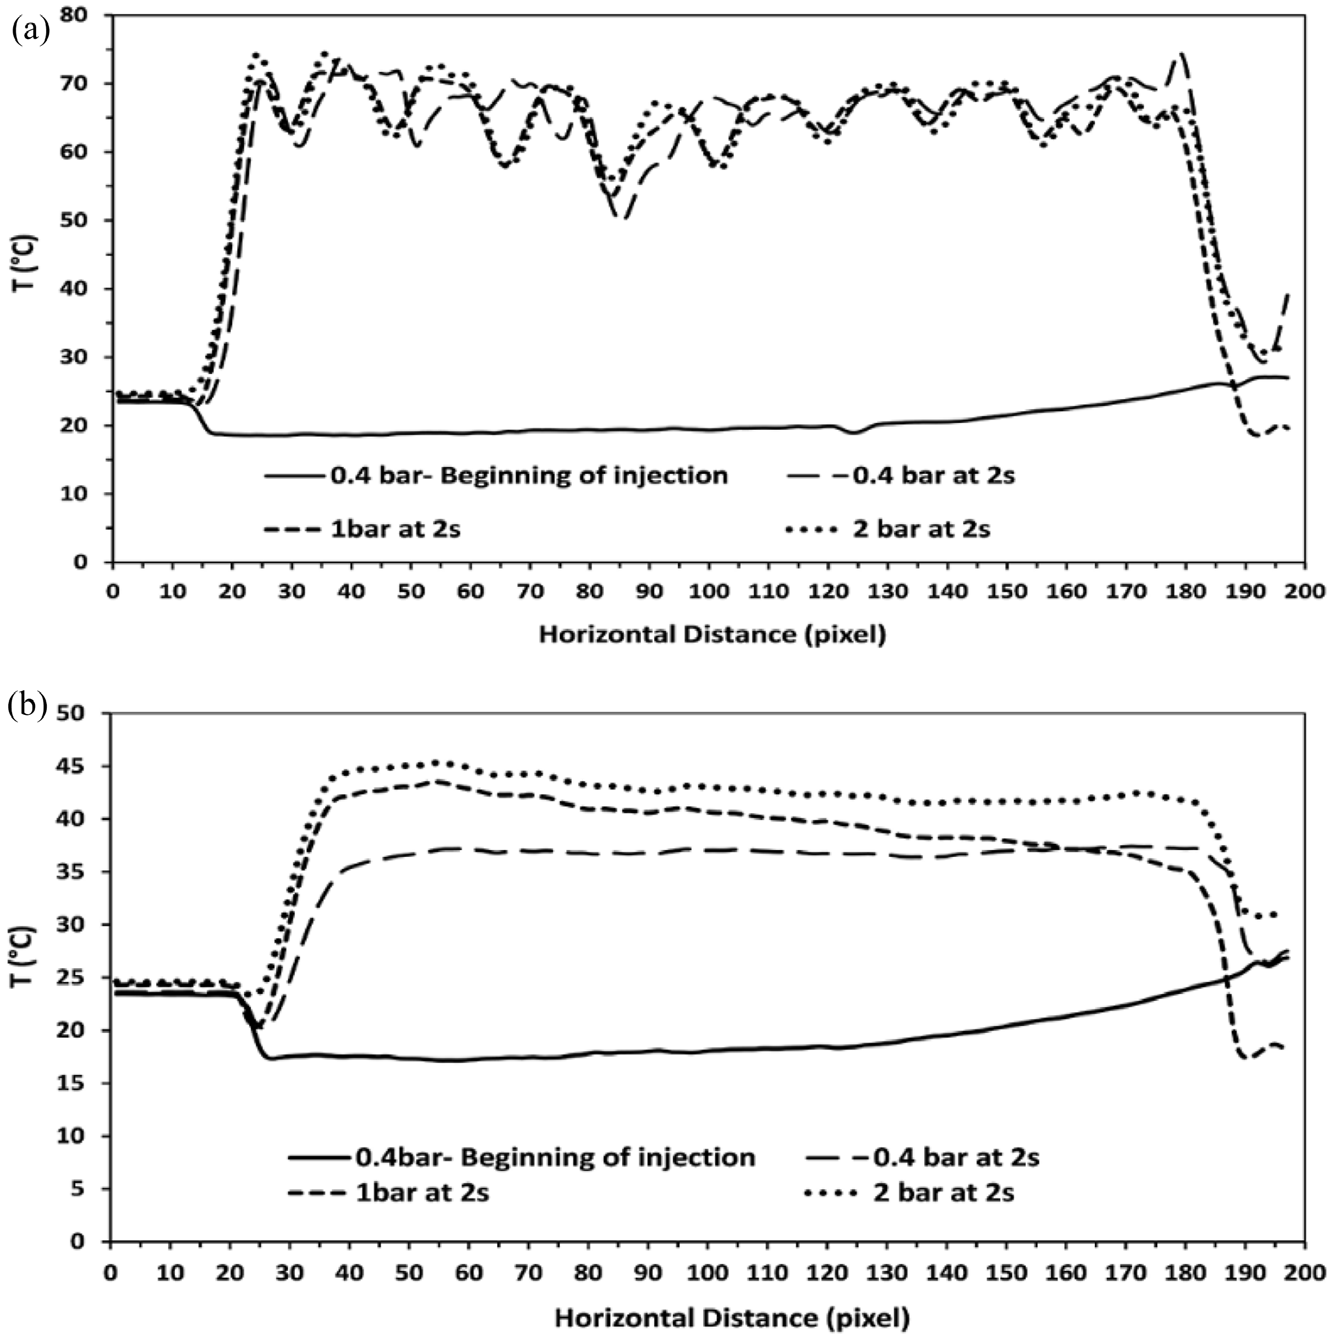
Temperature variations at total flow and different pressures, along path (a): 3 and (b) 4.
Figure 15 illustrates the temperature variations along line 1 (Vertical) and Line 2 (horizontal) directions on the surface of blade. At Figure 15(a) a temperature reduction could be observed. Similarly, a region with lower temperature has been detected at Figure 15(b). This specifies that existence of thermal contrast is related to the surface defects.
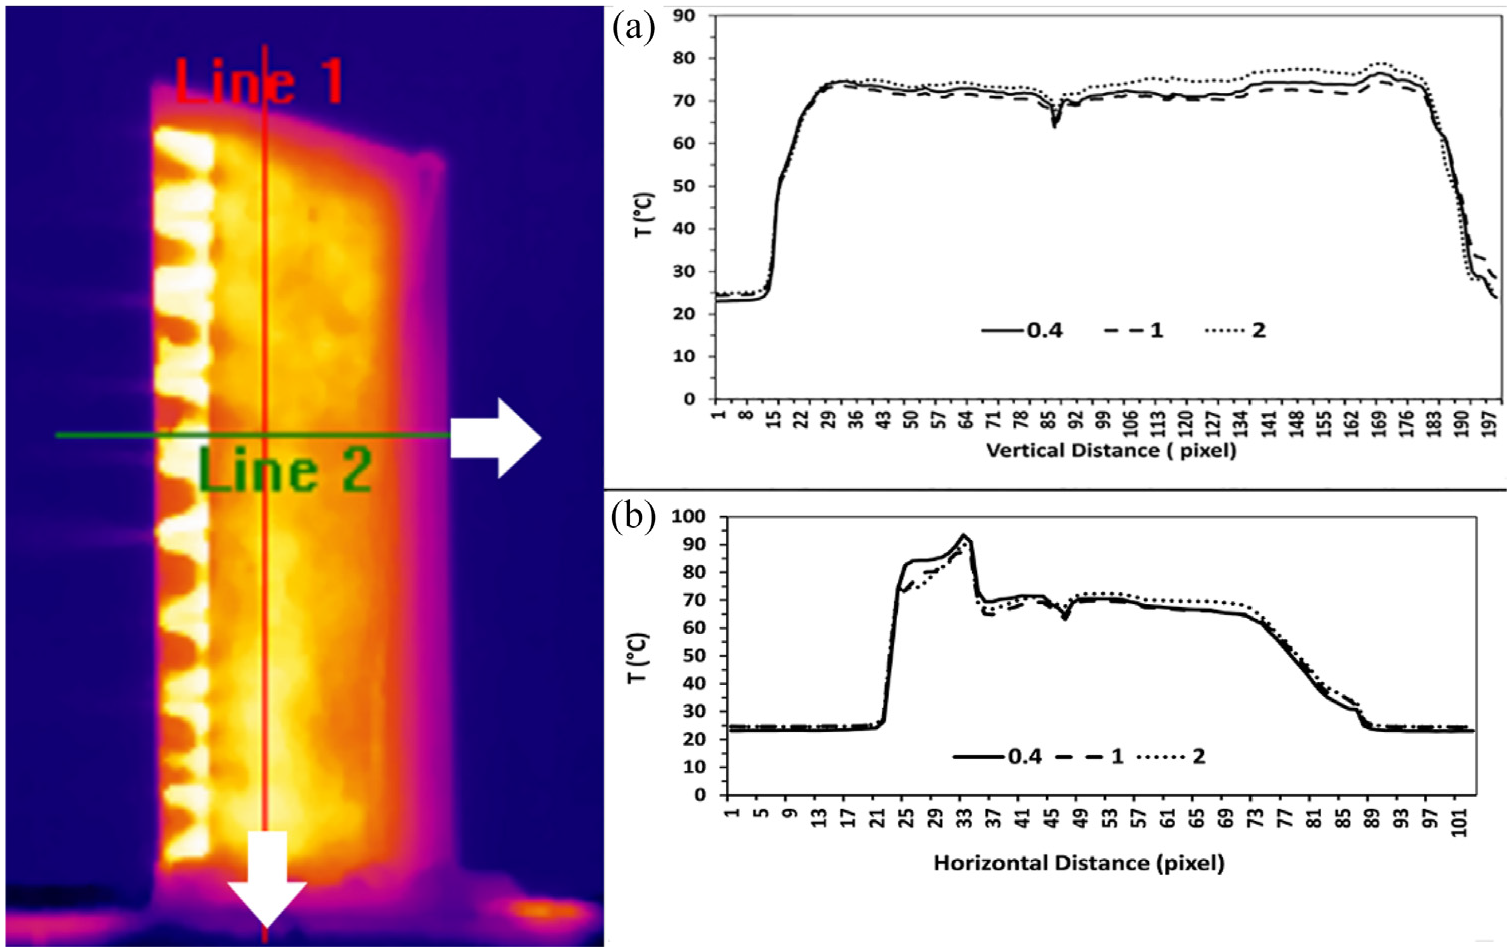
Temperature variations along: (a) vertical and (b) horizontal directions at total flow and different pressures.
Conclusion
In this paper, applicability of active thermography on the nondestructive testing of cooling passages of a gas turbine blade, is experimentally investigated. Three types of excitation source including CO2, hot-air, and water-vapor were applied in order to detect the internal cooling passages obstructed with residual ceramics. Results indicated that CO2 excitation can reveal the cooling passages in thermogram images of the blade, but the location of the defects cannot be determined. Application of hot-air stimulation improved the detectability of the obstruction to a great extent. Employing of water-vapor provides best results and residual ceramics were clearly visible. Application of water-vapor at 1 bar revealed better outcomes. The temperature contrast improved to 21°C compared to the pressure of 0.4 bar. Cooling of the blade body with ice-water mixture followed by water-vapor heating at 100% flow rate, properly revealed the horizontal runners. It also provided the possibility of surface defect detection. Compared to the common NDT methods such as UT, RT, and optical methods, application of fluids especially water-vapor introduces an excellent illustration of cooling runners and also a good detectability of residual ceramic which is considered a fatal defect. This type of excitation can be used as an automated NDT method in the Quality Control step of a gas turbine blade production.
Footnotes
Declaration of conflicting interests
The author(s) declared no potential conflicts of interest with respect to the research, authorship, and/or publication of this article.
Funding
The author(s) received no financial support for the research, authorship, and/or publication of this article.