
Abstract
Increasingly manufacturing companies are looking to use sensors to collect data from production lines to help analyse their performance. More rigorous approaches are needed to process and analyse the resulting data, particularly when considering missingness. In this paper, we present the results from a major study into missingness in Seagate’s disc head manufacturing process in Londonderry UK. Working in collaboration with company staff, a detailed approach for analysing missingness has been developed. The work shows how missing data analytics can be employed to analyse the quality of the data, identify relationships and diagnose the presence of any patterns.
Introduction
Manufacturing companies increasingly use sensors to record data from their production processes lines and then perform advanced analytics on them.1,2 Companies typically use Key Process Input Variables (KPIVs), namely inputs that provide a significant impact on the output variation of the process; they are often highly complex. Missingness can occur for a number of critical reasons such as machine faults, but also for some less important aspects, for example, addition of new sensors with no prior readings, noise, etc. The presence of, and uncertainty for, missingness can cause complications when building statistical models by introducing bias which results in less efficient statistical models. 3 More importantly, this incomplete data can causes issues as subsequent data analytics tools either assume complete cases or handle missing data through insufficient/inappropriate procedures. 4 Prior to this work, Seagate would have performed basic checks on their KPIV data, ensuring it was present but not analysing any gaps in sensor data or across tool fleets.
Many missing patterns have been explored and statistical procedures developed.5,6 Manufacturing approaches tend to use one-off methods 7 or impute missing data,8,9 but understanding the reasons for missingness can be insightful. Any approach tends to be focussed around gaining better understanding of the data, identifying why parts are missing and if a suitable approach exists for processing it without losing any information. Indeed, as we see from this analysis, exploring statistical relationships between fleets of machines is interesting as it is often assumed (incorrectly) that they operate independently. To allow for suitable models to be created, preprocessing is required as a means to standardise the data and account for missingness which can lead to biassed results. Such approaches must not introduce bias and the underlying variance of the sensors must be retained.
This paper has resulted from a 2 year investigation of the data being produced from a commercial environment, namely Seagate’s thin-film magnetic read-write head manufacturing process in Londonderry UK. A detailed analysis was undertaken on data produced over 8 months and a previously published approach by the authors then applied and modified to analyse missingness. 10 The work identified the best method to account for the missing data and developed visualisation tools for representing the analysis in a form suitable for manufacturing staff.
The paper outlines a procedure for profiling missing data involving clustering and correlation techniques and imputation analysis. It explores a range of imputation techniques which allow the determination of the most statistically proper for handling different missing patterns. In addition, visual analysis allows diagnosis, identification of patterns and relationships within the missing data, thus providing pointers for manufacturing staff to relate the gained knowledge back to specific sensors in their production line.
Challenges of processing manufacturing data
The application of sensors in manufacturing results in a large volume of data in varying formats being generated from different sources. There is considerable interest in utilising machine learning techniques to exploit this such as detecting and categorising faults in a milling machine tool. 11 In manufacturing, preprocessing of this data can constitute around 80% of project analysis time. 12 Research has been undertaken into the impact of missing data on analysis tasks, but most manufacturing work has tended to concentrate on mechanisms to detect abnormalities.7,13
The work by Ge et al. 9 emphasises the need for multidisciplinarity in data mining and data analytics for the process industry. A number of authors7,9,14 have identified key data characteristics in the collected data and these include multiple sources, extraction issues, varying data types and size, missing data/non-collection/sensor failure, extreme class imbalance in response variable and varying distributions of different production processes.
Lee et al. 14 proposed a cyber-physical system approach for monitoring machine behaviour and recommended a need to improve generalisability. Susto et al. 15 considered a multiple classifier model for predictive maintenance of a benchmark dataset and highlighted the necessity for preprocessing using k-NN and SVM models. Munirathinam and Ramadoss 13 used five different decision models to detect equipment faults using a publicly available dataset and highlighted a major issue with incomplete/missing data.
Flath and Stein 7 created a toolbox involving numerous machine learning algorithms for assisting manufacturing decision-makers using one dataset and is the closest to that proposed here. They did not, however, consider the need for investigating data quality, appropriate preprocessing and other statistical based algorithms to provide further insights.
Typically researchers have tended to use one-off methods specific to their datasets, 7 including statistical 8 and imputation methods.9,16 However, this work does not investigate the underlying structure of the missingness and this can have major implications as to the effectiveness of well-known imputation methods.
To demonstrate this, Figure 1 depicts the impact of applying impact imputation methods to raw data produced by a sensor in Seagate’s four manufacturing fleets. In this plot, the original deviation is compared with three imputation methods, bag, mean and LOCF, for the untreated sensor data. From this distribution, it can be seen that different imputation procedures have resulted in distributions that deviate from the original. In this example, the mean imputation results in the data having increased peaks and also introduces a shift in the distribution. The other imputation methods follow the original data more appropriately. This forms some of the motivation into investigating suitable analysis methods and imputation methods for missing data.
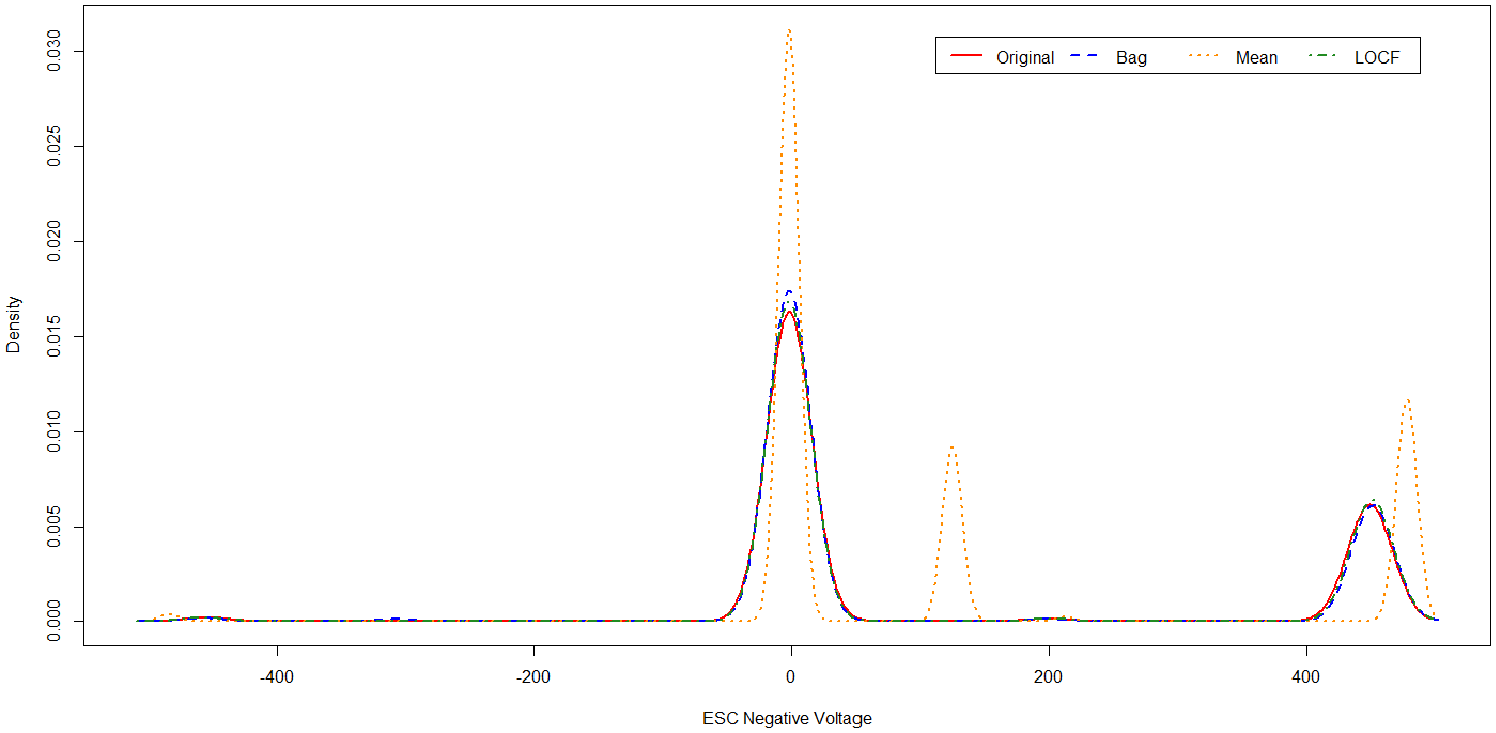
Example from Seagate data comparing four missing data techniques.
Whilst previous studies have shown the potential of data analytics approaches and initial tool-kits, there is a need for a flow that investigates the key stages of preprocessing, handling missing data, time series impact and creation of interpretable models.
There are number of key challenges.
Is the data extracted from the sensors of good quality? Can we assess its suitability and if failing, preprocess it to account for any inconsistencies in its raw format?
Why do variations occur in sensor recordings? Could extraction of key features provide insights into the production’s performance? Is it possible to identify combinations or interactions amongst sensors?
Can we gain a better understanding of the most suitable predictive models for the specific dataset?
Seagate manufacturing process
A dataset was created from Seagate’s production line of read/write heads for hard disc drives from their Springtown factory in the UK. The manufacturing process takes up to 8 weeks and throughout, a selection of electrical tests are performed at critical stages of the build to identify any issues at an earlier stage of the production process. Any work that can help identify faults occurring much earlier in the manufacturing process can have considerable potential in avoiding loss of production.
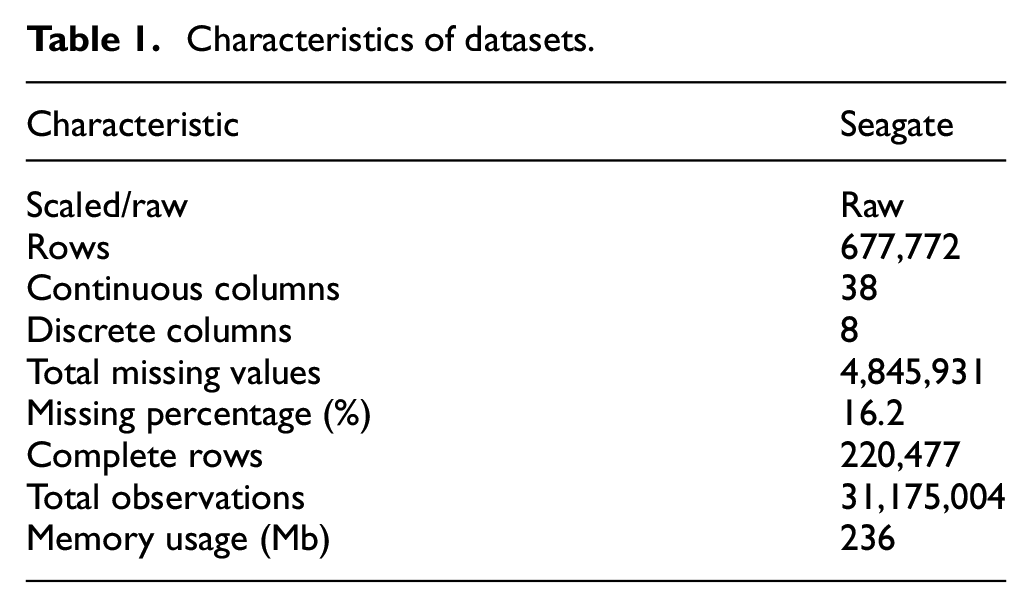
The factory has four processing lines involving decomposition tools, labelled as Tools 1–4, here. Their engineers are particularly interested in the multi-stage, tunnel junction process involving layering of materials, etching, deposition and cleaning used in the disc manufacture process. Sensors installed in the tools for etching procedures at varying angles and deposition of alumina, provide a continuous stream of data. Details of data size, features and target type of the resulting data is illustrated in Table 1.
Characteristics of datasets.
Prior to this work, the processes in Seagate for preparing datasets was rudimentary and involved checking for the presence of the wafer and KPIV sensor data for each. Missingness in individual sensor data and gaps in sensors across tool fleet was not explored as not all sensors were available for each tool within a fleet due to time between equipment purchases and upgrades to models.
Intelligent data analytics framework for analysing manufacturing data
In 2019, we undertook some initial work in establishing a framework to investigate data analytics 10 and applied it to Seagate’s dataset. From this initial work, we developed the missing data analysis flow in Figure 2 which covers the data extraction and collation, cleaning, missingness analysis and imputation analysis of the dataset. The stages are explained below:
Data– the individual machine datasets from the four Tools are extracted from multiple databases and collated into a unified dataset based on a predefined aspect.
Cleaning involves removal of outliers, duplicated rows and features with zero variance as they provide no benefit in analysis and only act to increase the computational times and limit biassed values. Features with over 40% missing values are discarded – the value determined as imputation over 50% is seen to bias the analysis in favour of the imputed values.4,6
Missingness Analysis involves visualisation of key features, cluster analysis, regression analysis (to identify influential features on proportion of missing data), classification and regression tree (CART) analysis (to highlight missing completely at random (MCAR) and to help identify relationships). Collectively, the analyst can undertake complete-case analysis if deemed MCAR and or apply imputation analysis if missing completely at random (MAR) or missing not at random (MNAR).
Imputation Analysis allows exploration of a range of procedures and identification of the best candidates, by running a rebalancing SMOTE algorithm for cases of extreme class imbalance. Performance metrics including balanced accuracy, is used to determine the best imputation procedure to produce data for building any new prediction model.
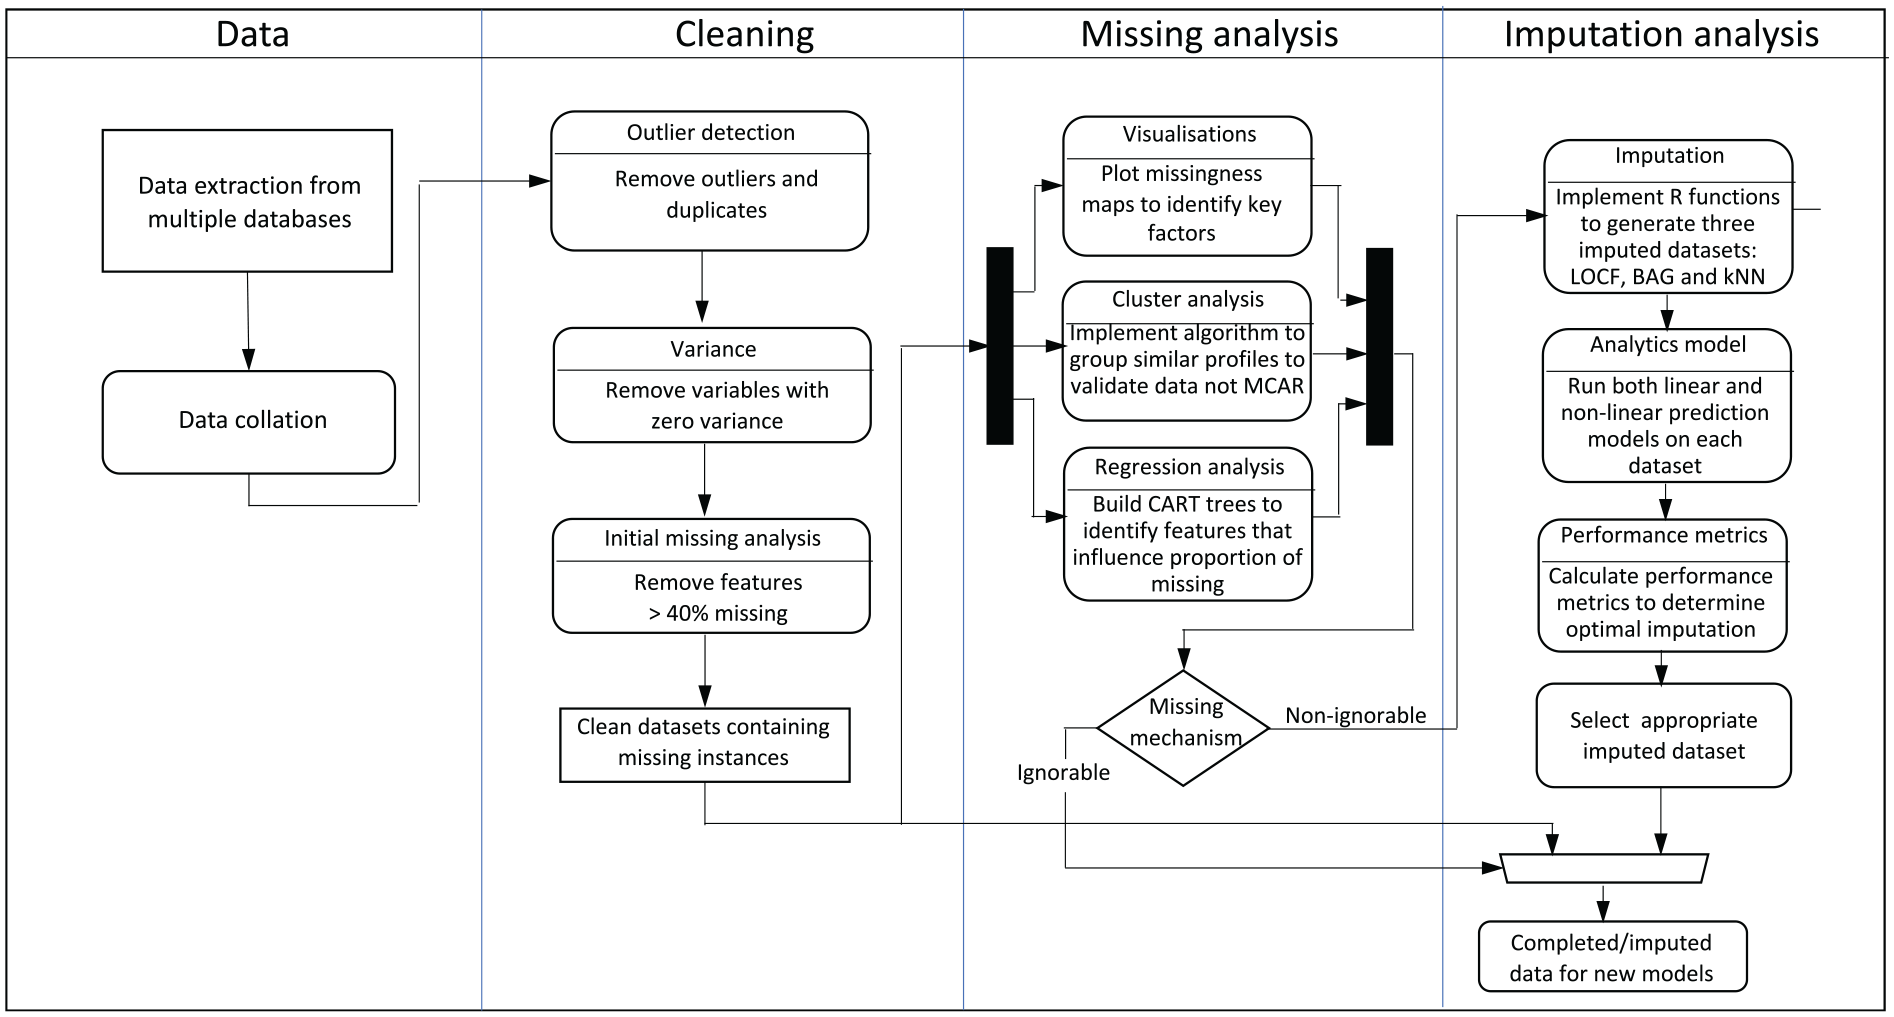
Missing data analysis strategy for generating new insights and identifying most appropriate complete dataset for future statistical models.
Data analysis and cleaning
Data cleaning and pre-processing procedures ensure that the raw data is converted into a suitable format for meaningful statistical analysis, but incomplete data is unavoidable. Procedures such as complete-case analysis, mean substitution, k-NN imputation, can only be applied validly in order to limit any bias to the subsequent model. 8
For the Seagate data, prior knowledge on sensor types, for example, electrical, flow, pressure, etc. and metadata/indicator variables, for example, tool name, etc., allows us to group the data. A correlation matrix can help to identify major relationships between pairs of variables/sensors. Figure 3 shows the relationships for the 31 KPIVs in the Tool 2 machine. The colour coding has been used to highlight the groupings. This analysis was useful in allowing Seagate engineering staff to identify any dominant relationships and to indicate which sensors have the highest correlation with the outcome measurement. In most cases, the data confirmed the process understanding by the engineers.
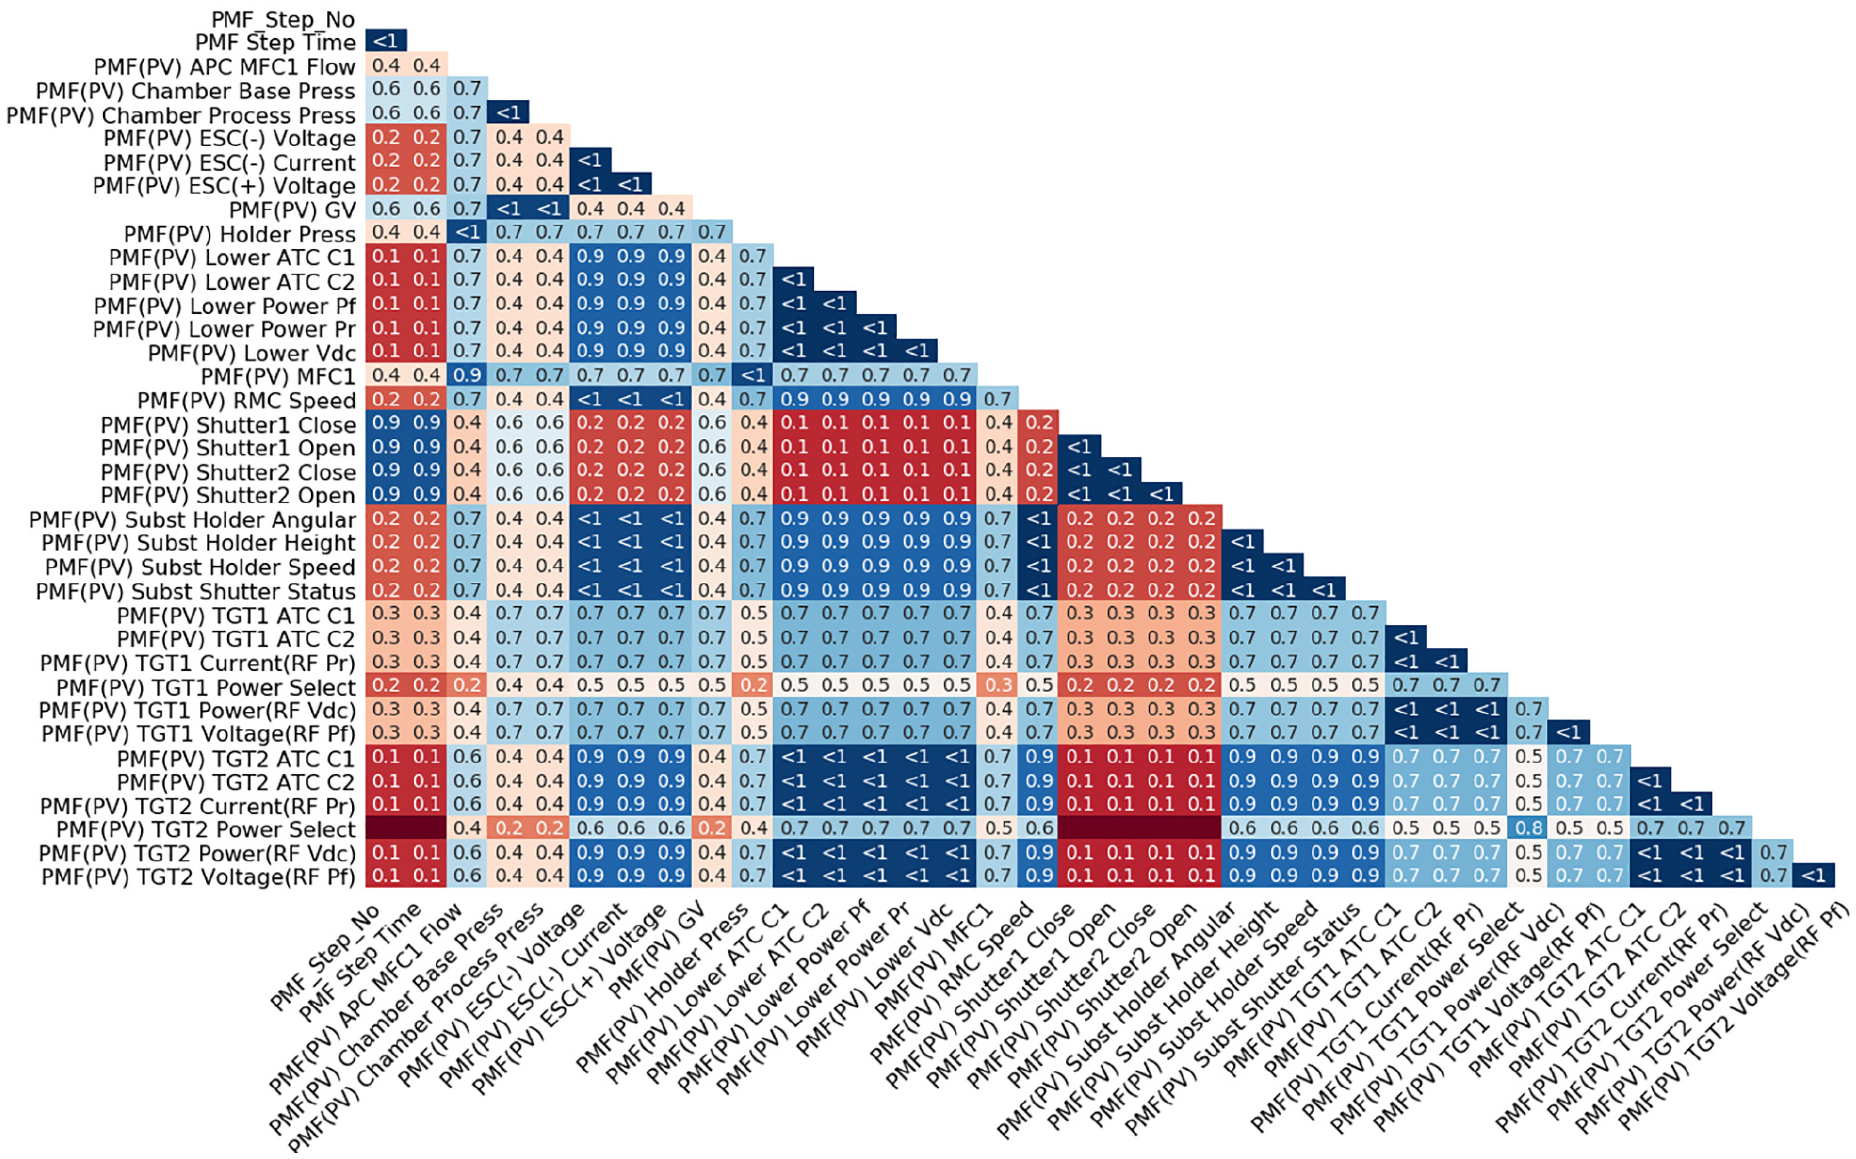
Correlation matrix showing relations between sensors in Seagate Tool 2 dataset.
Missing data patterns and structure
In the context of missingness in industrial systems, research has focussed on visual analysis tools or standard imputations.4,6 Visual analysis provides initial indication of any unusual missingness behaviour quickly indicating any concerns with basic information capture. Any pattern of missing data needs to be considered and catered for, prior to any analysis.5,17
Missing instances
Missingness refers to missing instances for observations in a dataset where is no record at that point and can occur due a machine or sensor fault, noise during production, etc. Current research8,12 has not explored its impact in detail and typically has only considered specific imputation examples.
Missingness pattern analysis
Data distribution visualisations allow the analyst to quickly establish whether the data is MAR, MCAR, or in the most complex scenario, MNAR. This can influence the amount of transferable information between features, and can provide new insights.
An adapted function created using the naniar package in R allows for a clearer depiction of the missing data
18
where datasets are transformed into binary, with 0 indicating an observed instance and 1, a missing observation. This allows the percentage of missingness to be depicted on a missingness map. Figure 4 depicts the missingness map for Seagate’s Tool 1 machine from September 2017 to May 2018 where the
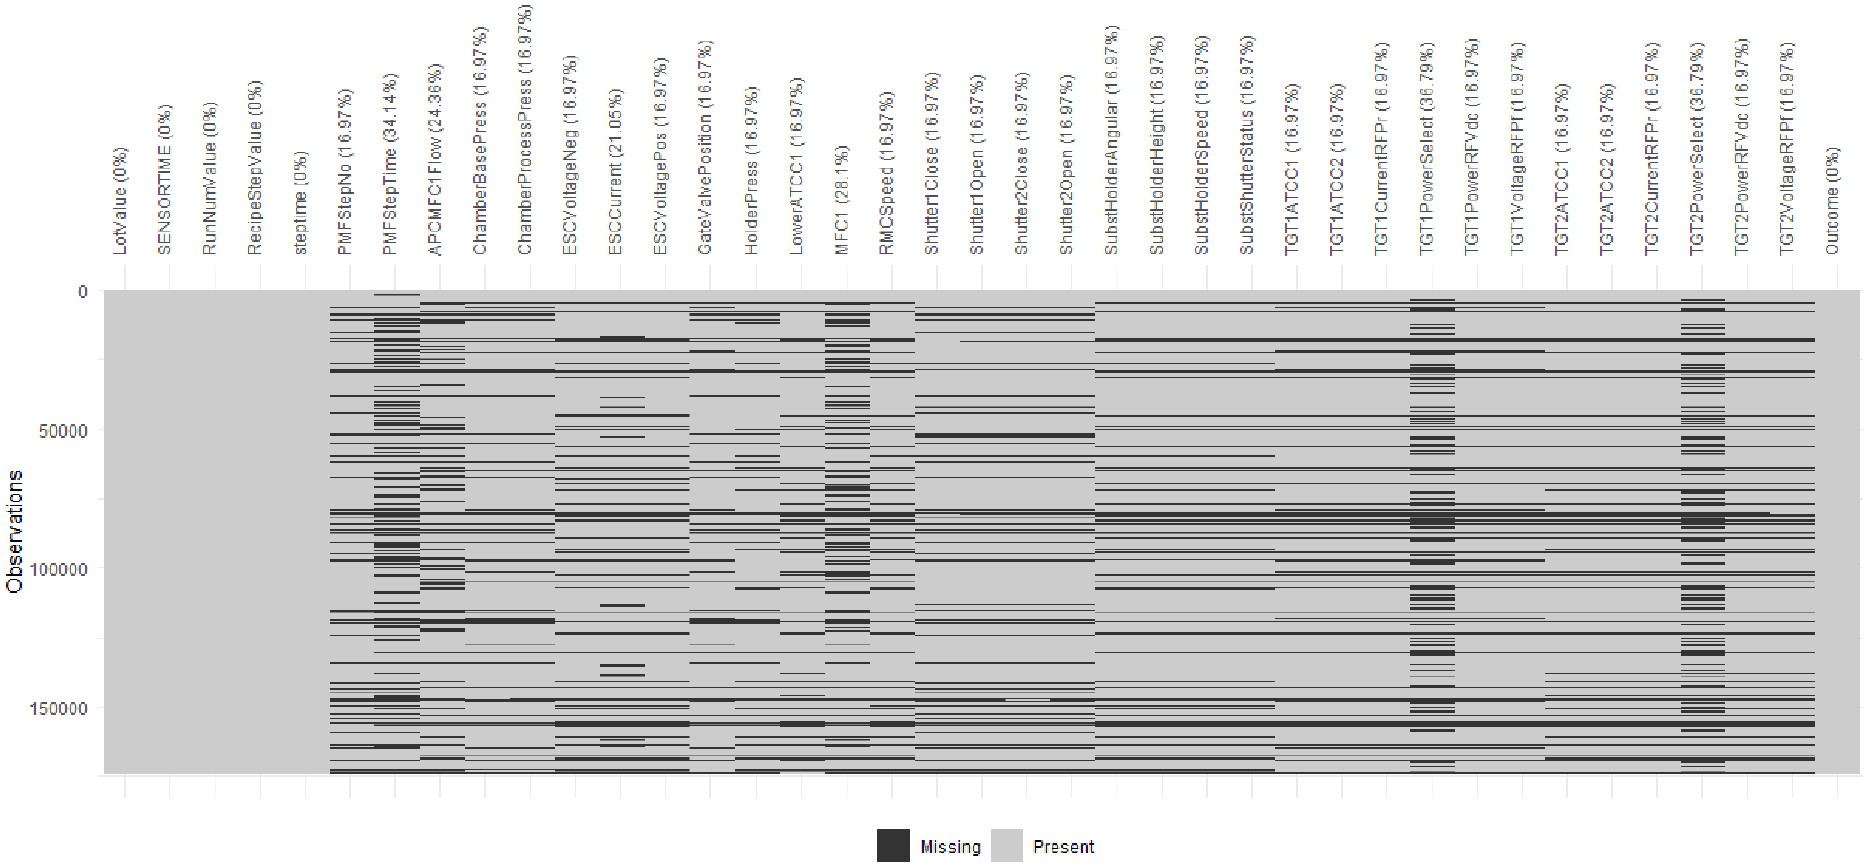
Missingness map for Tool 1 machine in Seagate data.
Exploration of missing data structure
Often, industrial analysts choose fast and simplistic missing data imputation, such as mean imputation, or else the more extreme case of listwise deletion which can reduce the dimensionality of data drastically. Removal of data points means that potential critical information can be lost, which could result in redundant models.
The Seagate dataset provides us with an unique opportunity to demonstrate methods that can highlight relationships or structure in the missing data. Figure 5 provides a visual relationship between the levels of missingness in a machine fleet over a 8 month period. It shows an unanticipated commonality between machines; the process engineers indicated that the data extracted for the machines should be independent of one another as each is not reliant on the processing of the other. A specific R function was developed to produce this chart and allows for the user to interactively zoom in and see the actual percentage of missingness for each dataset.
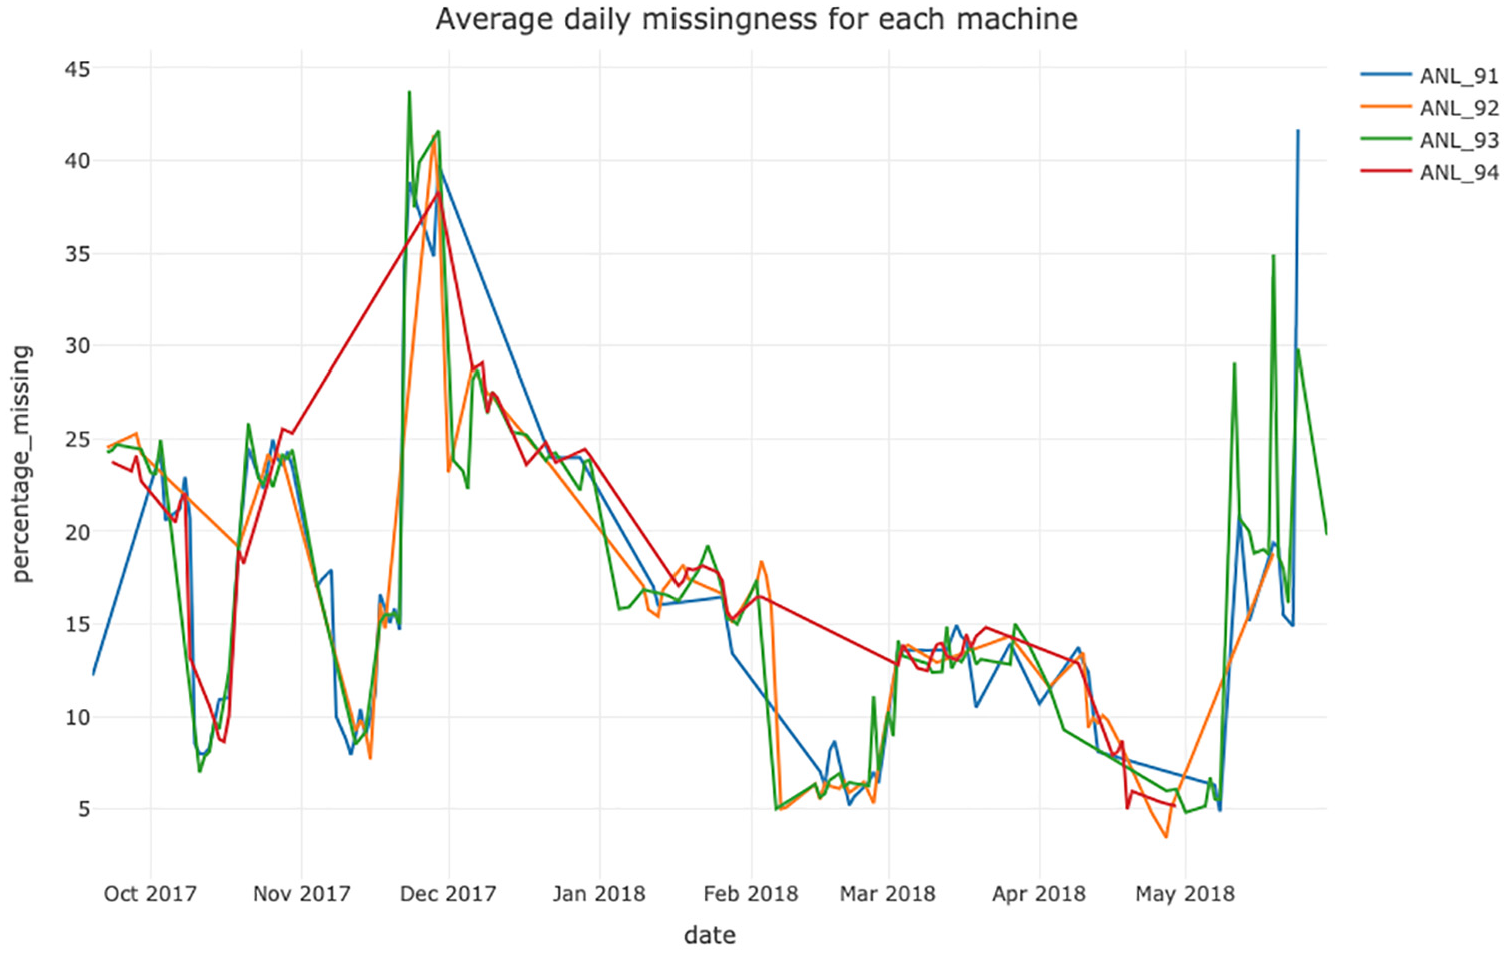
Daily percentage of missing observations for each Tool between September 2017 and May 2018 for Seagate Data.
Another aspect was to consider the overall average monthly missingness as in Figure 6, in order to explore if there is a general underlying trend. It suggests a strong correlation between levels in each machine with the exception of Tool 4 which had an explained missingness due to reduced production between November 2017 and February 2018. Figure 7 gives a monthly heatmap generated by filtering data and calculating missingness proportions for each sensor in the Tool 2 machine. It indicates major issues with the ESCCurrent sensor which other tools identify as a common feature across machines.
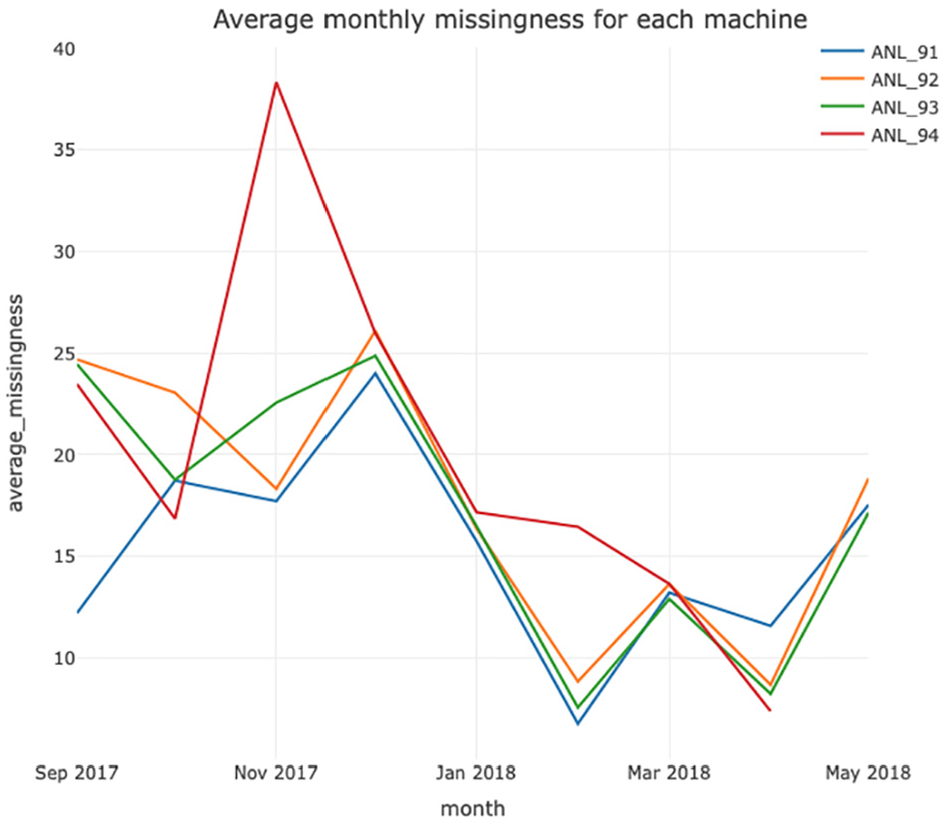
Average monthly percentage missing for the time period September 2017 to May 2018 for the Seagate tools.
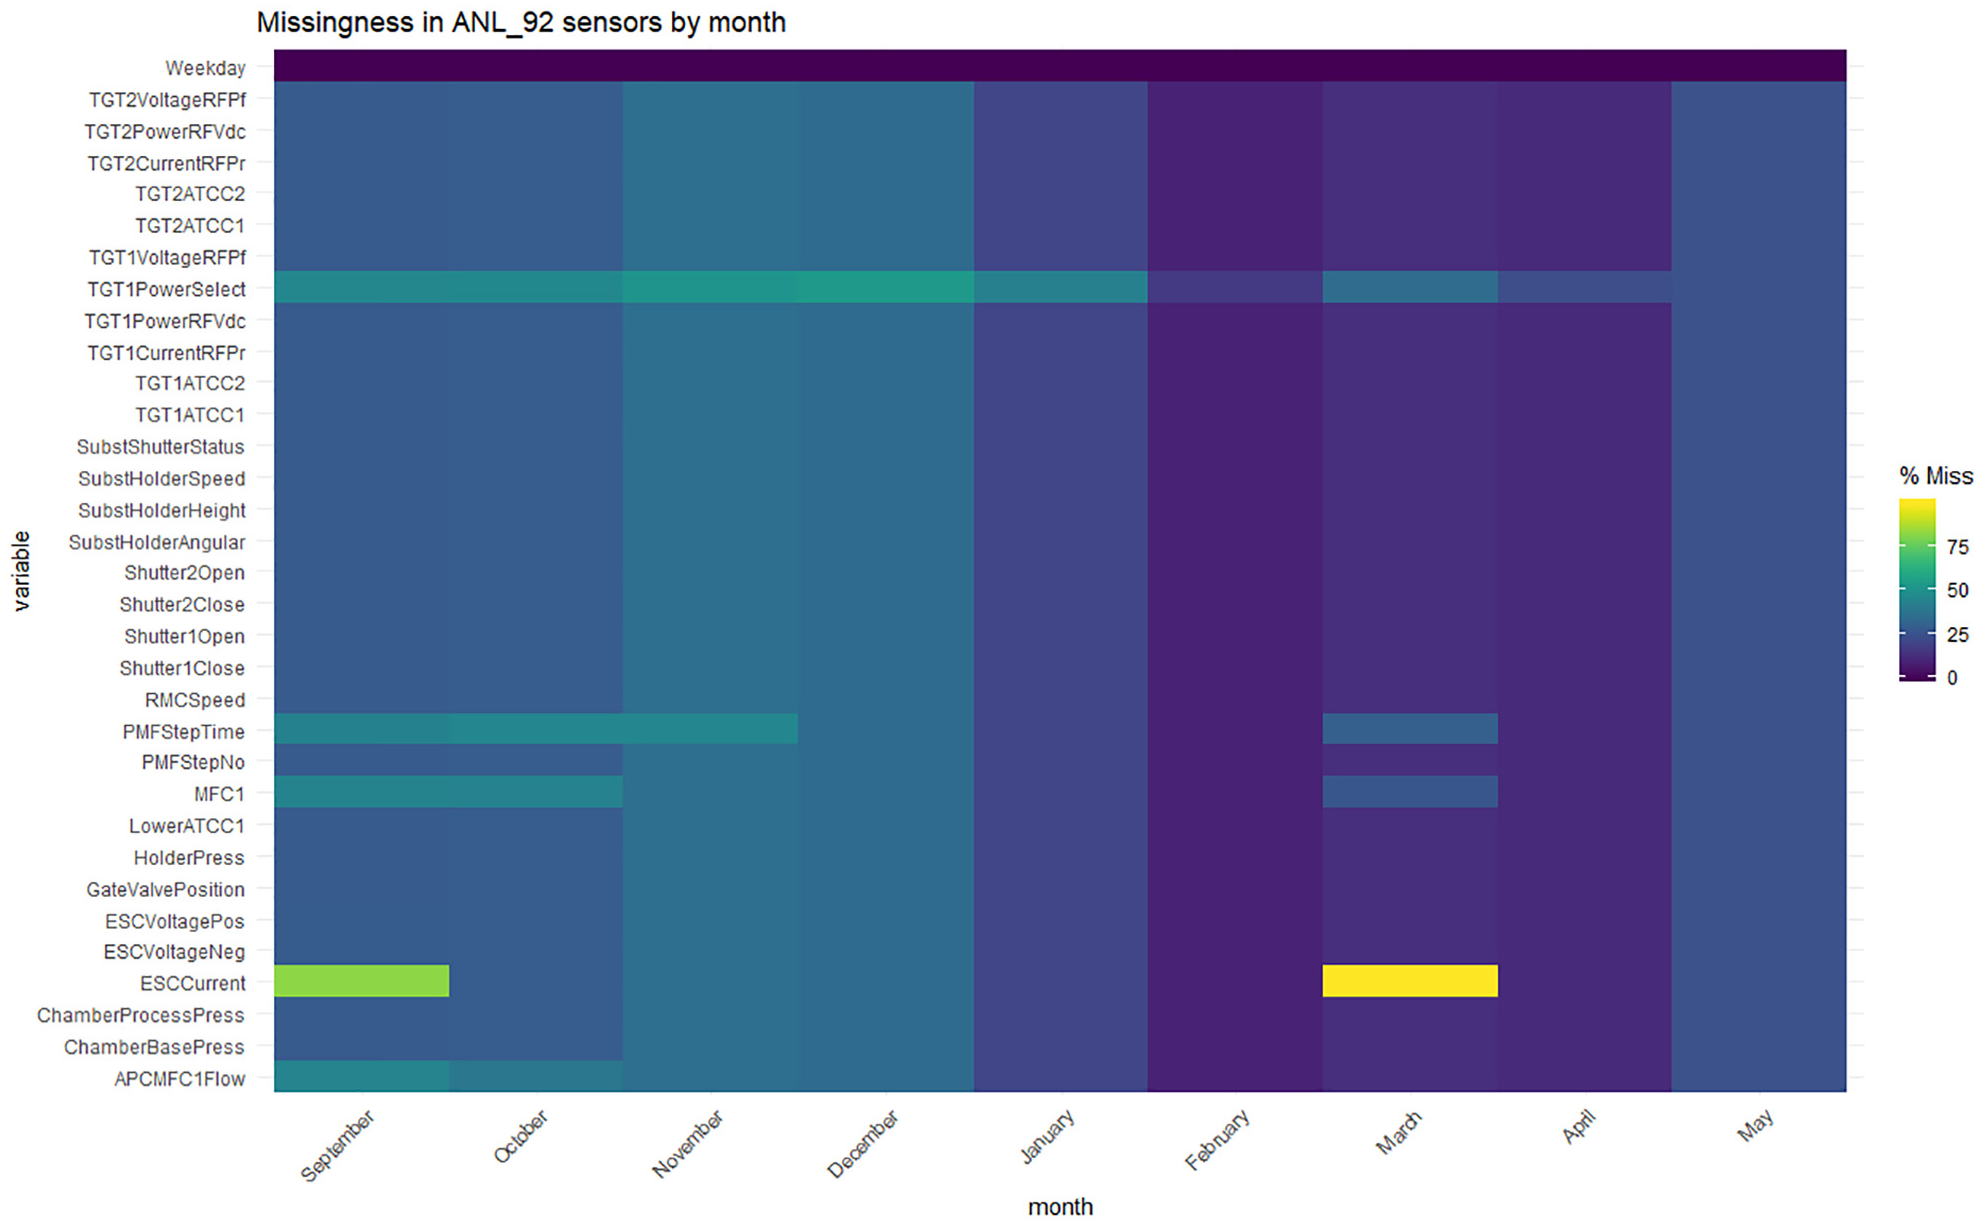
Heatmap visualising missing observation percentage for the Seagate tools split by month.
Correlation and clustering of missingness
Using Pearson’s correlation coefficient, we can confirm strong positive correlations between Tool 1 and 2, and Tool 2 and 3 (see Table 2), originally shown in Figures 5 and 6. The p-values used in the tests of a significant relationship with hypotheses are defined as follows;
Correlation coefficients comparing monthly missingness in tool dataset (p-values in brackets).
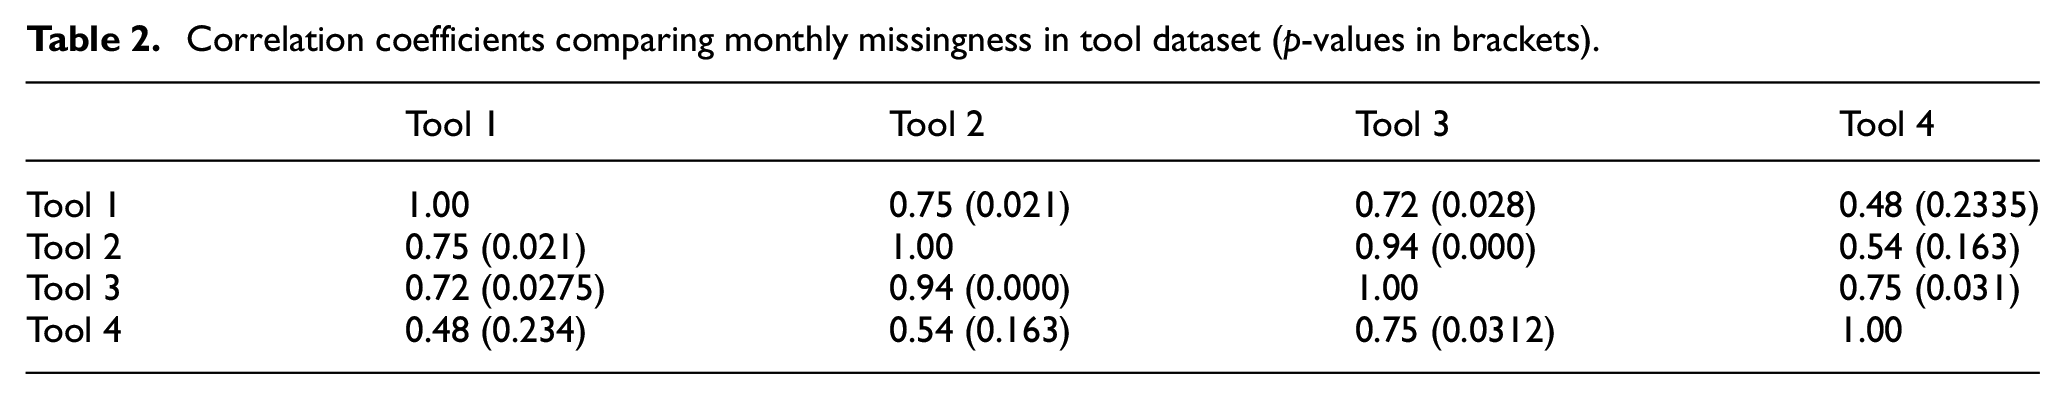
The p-values in Table 2 are statistically significant at a 95% confidence interval for most pairs; with the exception of Tool 4’s relationship with Tool 1 and 2 as the p-values are greater than 0.05. Unexpectedly, these results infer the Seagate’s tools are statistically related. A failing sensor increases the average missing data count and impacts the performance of the machine. From the correlation analysis, it is evident that an increase has an impact on the performance of wafers. This approach helps to confirm that missingness is not MCAR and that a relationship and structure is apparent and that deletion of the missing data could bias results.
Procedure to identify structure in missing data
Figure 8 depicts the stages in a new hierarchical clustering function which groups missing data binary patterns (generated previously) into
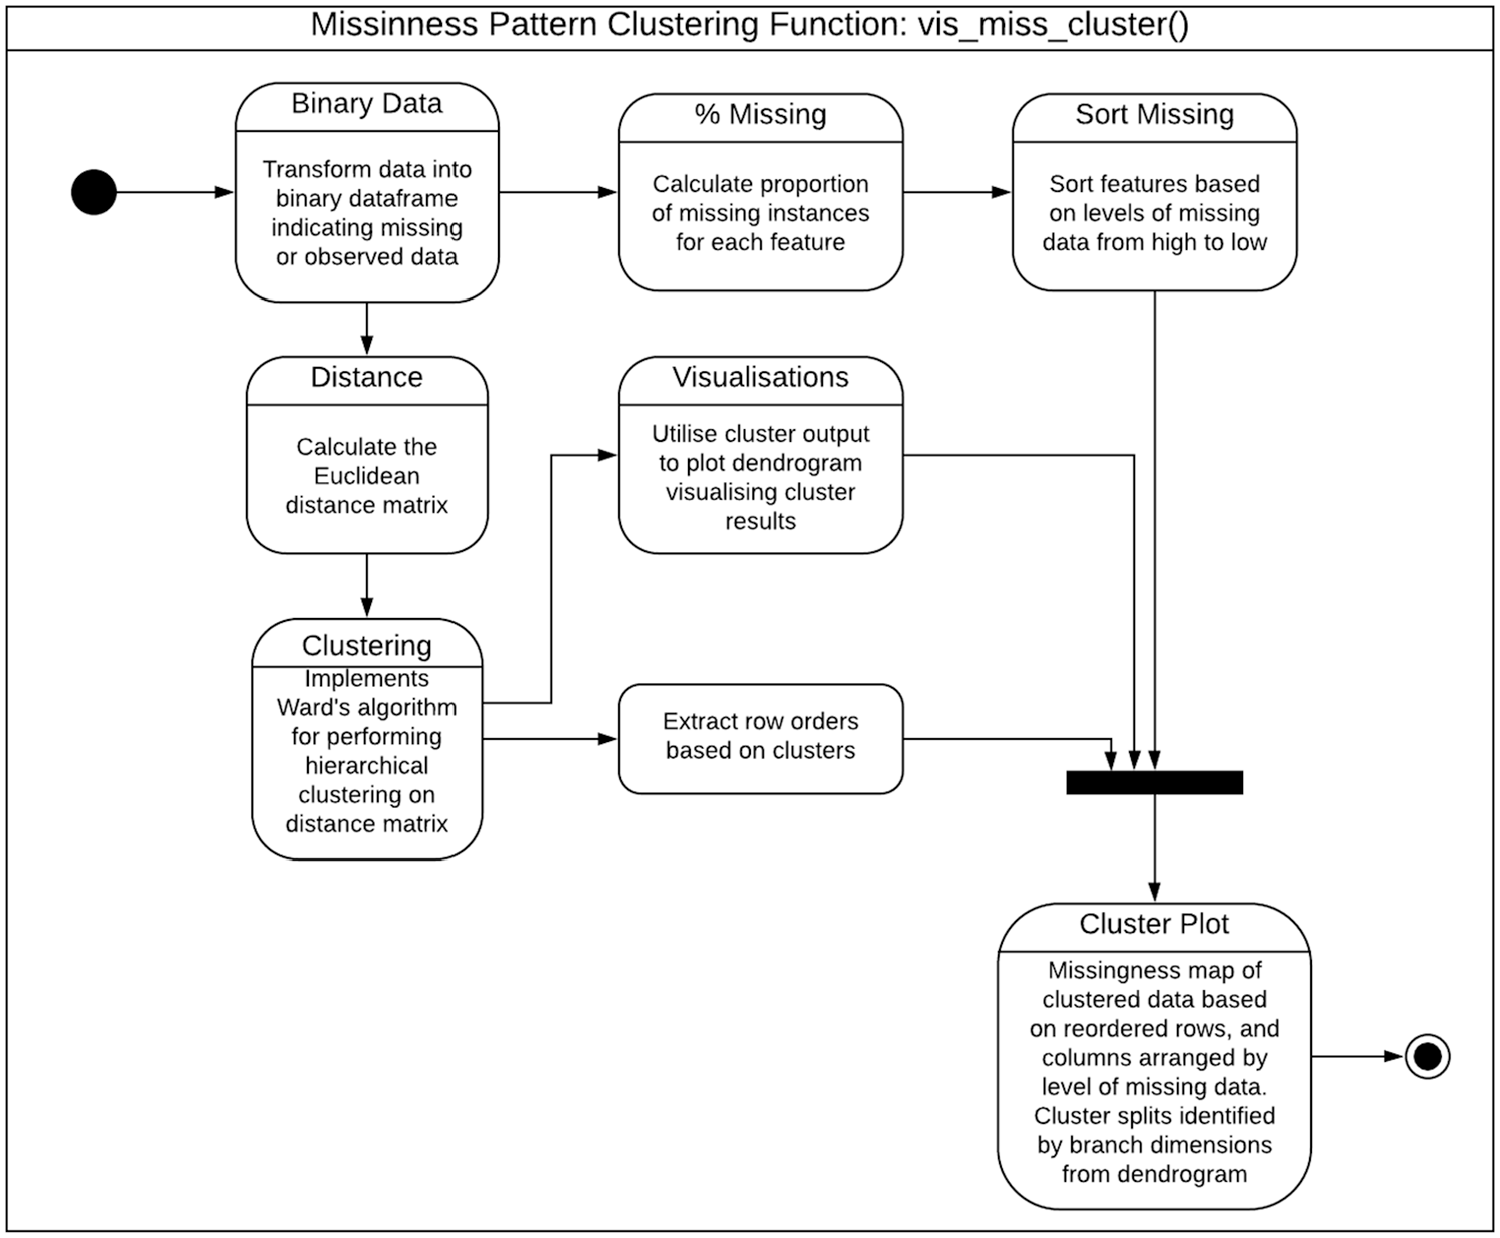
Flow for the new
The Ward minimum variance clustering algorithm was chosen as it performs well in clustering large binary datasets. 20 Figure 9 shows the missing pattern clusters for the Tool 4 dataset where the features and observations have been reordered into similar groupings. This allows extraction of observation points which can be provided to manufacturing staff, highlighting key dates and times of occurrence. Data from other Tool machines (not shown due to length restrictions) reinforces the conclusion that the data does not follow MCAR assumptions. The comparison of clusters across the machines allows different patterns to be identified. Initially, Tools 1 and 4 were deemed to follow similar trends, but after cluster analysis, it was detected that some clusters showed irregularities.
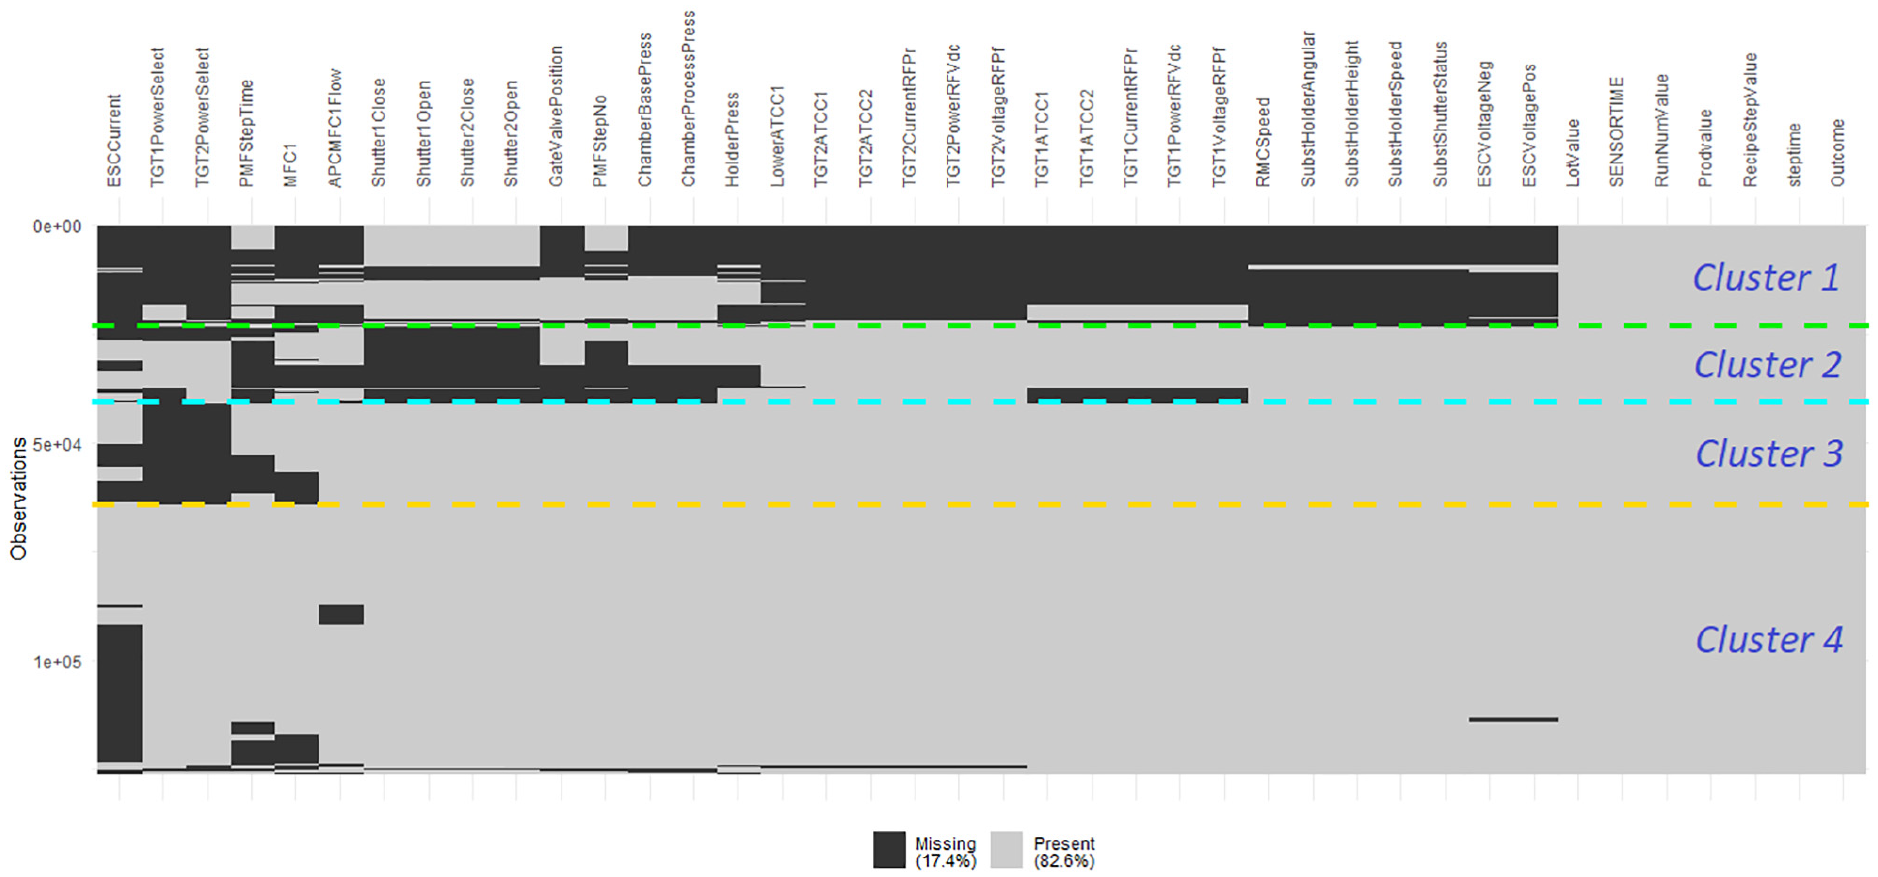
Tool 4 missing data after cluster analysis indicating four clusters of similar missingness patterns.
The CART tool 17 is used here, for the first time in an industrial data domain, to produce new insights into the underlying structure and cause of missing data. The capability of producing a Decision Tree (DT) model shows that there is a direct relationship with levels of features and the presence of missing data. This CART analysis allows the user to investigate which levels are leading to increased missing levels that can be further investigated. When implemented, the analysis results in a graphical representation of several leafs where the final leaf nodes contain three categories: the first represents the expected proportion of missing data per observational row, that is, a wafer or product’s production records; the second includes the number of observational rows and; the third is the percentage of instances in that node.
The CART analysis on the missing data for Tool 2 identified seven influential features, which are important predictors of the proportion of missing data in this Seagate sample, thus allowing manufacturing staff to gain new insights into potential underlying issues. For example, discussion with the Seagate staff revealed that wafer lots that underwent PMFStepNo=0, involved the preparation of the tool for particular stages thus providing an understanding of why the data could be missing. Insights into missing data structure have persuaded Seagate’s engineering staff to seek alternative approaches for how they analyse missing data and construct models. Whilst the common procedure had been to use complete-case analysis, for example, the identification of an underlying structure shows that this is not appropriate. They are now using visualisation tools to assess their data following extraction to identify any initial errors.
The cluster analysis in Figure 9 resulted in four clusters where the largest cluster contains mostly complete data, consistent with the machine performing appropriately and recording all necessary information. The clusters at the top show a larger portion of missing observations. Investigation into the LotValue of these observations grouped together indicated that the majority were lots that failed the final electrical test. This provides a mechanism to provide to the user the list of lots grouped into a cluster based on similarities.
Missing data imputation analysis
Next, we investigate how imputations can help to determine and validate classification of missing data mechanism, 18 and identify the best performing imputation that limits bias. Missing data imputation is increasingly being used with industrial data. 21 Some argue for mean imputation for ease of implementation 7 and others use LOCF for cases of continual data collection. 21 We can use different, univariate imputation methods which consider each feature independently, and multivariate approaches that are applied on the entire dataframe and utilise the relationships between features to impute missing values. Typically, missing data is handled through deletion/complete-case analysis by removing any observational row which contains at least one missing instance. The data needs to be MCAR which is challenging to support, so these approaches often produce biassed parameters and estimates – not recommended by statisticians. Currently, Seagate staff use the complete case or mean imputation.
Industrial data imputation analysis
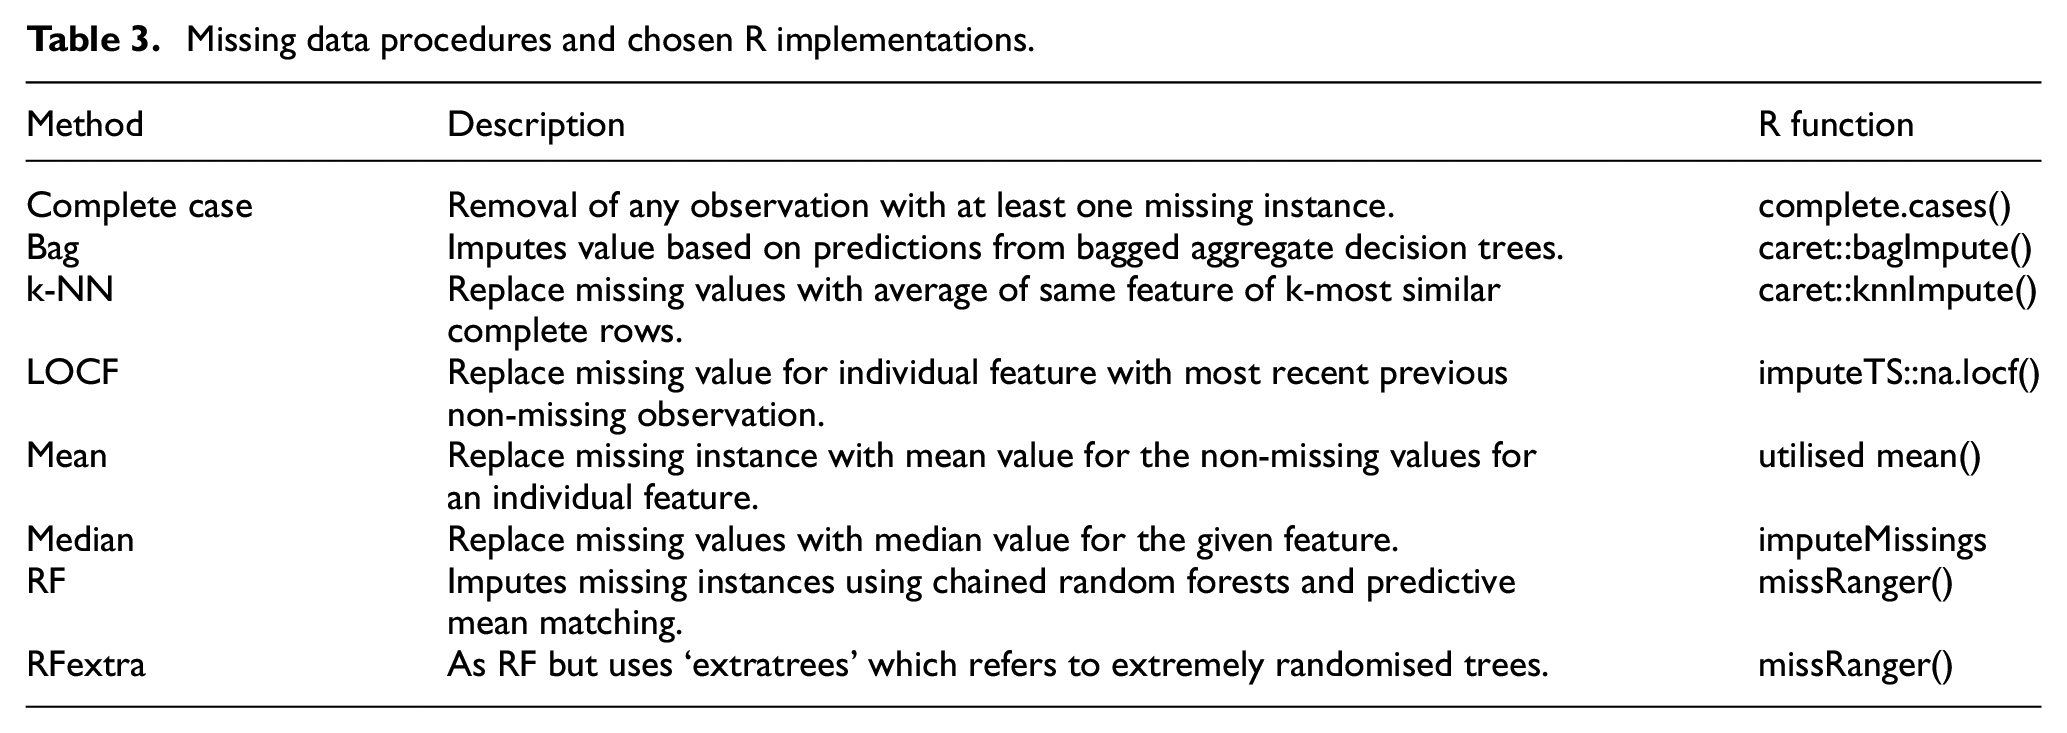
With the four Seagate datasets, initial cleaning was performed to extract the relevant features. A broad range of imputation alongside a complete case analysis (Table 3) was then applied, resulting in 32 datasets for our Seagate samples. Each complete dataset was split into 75% training and 25% testing and for each model, five-fold cross-validation was utilised to reduce any bias or variation by splitting the data into five equal subsets and using four to train the model and one for validation. This process was repeated to ensure that each subset is used as a validation set for testing the model.
Missing data procedures and chosen R implementations.
The extensively used, synthetic minority oversampling technique (SMOTE) re-balancing algorithm was chosen to handle the class imbalance scenario in predicting product fails. 22 The well performing, XGBoost classification and the standard DT models were applied and a specific set of parameters chosen and built into a function, allowing a quick analysis. Four statistical performance metrics were chosen which measure the performance of the resulting model to predict the target class. These include: accuracy, balanced accuracy (average of the proportion of correctly predicted classes), sensitivity and specificity; the latter two show how well the model predicts the correct classes of pass and failed products.
For each performance metric, a higher value is more desirable but caution is needed about the accuracy metric in the presence of imbalanced data. Table 4 shows the clear difference between accuracy and balanced accuracy when SMOTE is implemented for the Tool 1 data. If rebalancing is not used, the model is biassed towards the majority class that is, pass. This is also seen by considering sensitivity which is extremely high in cases of no SMOTE, so SMOTE should be employed.
Tool 1 imputation performance evaluated with XGBoost classifier.
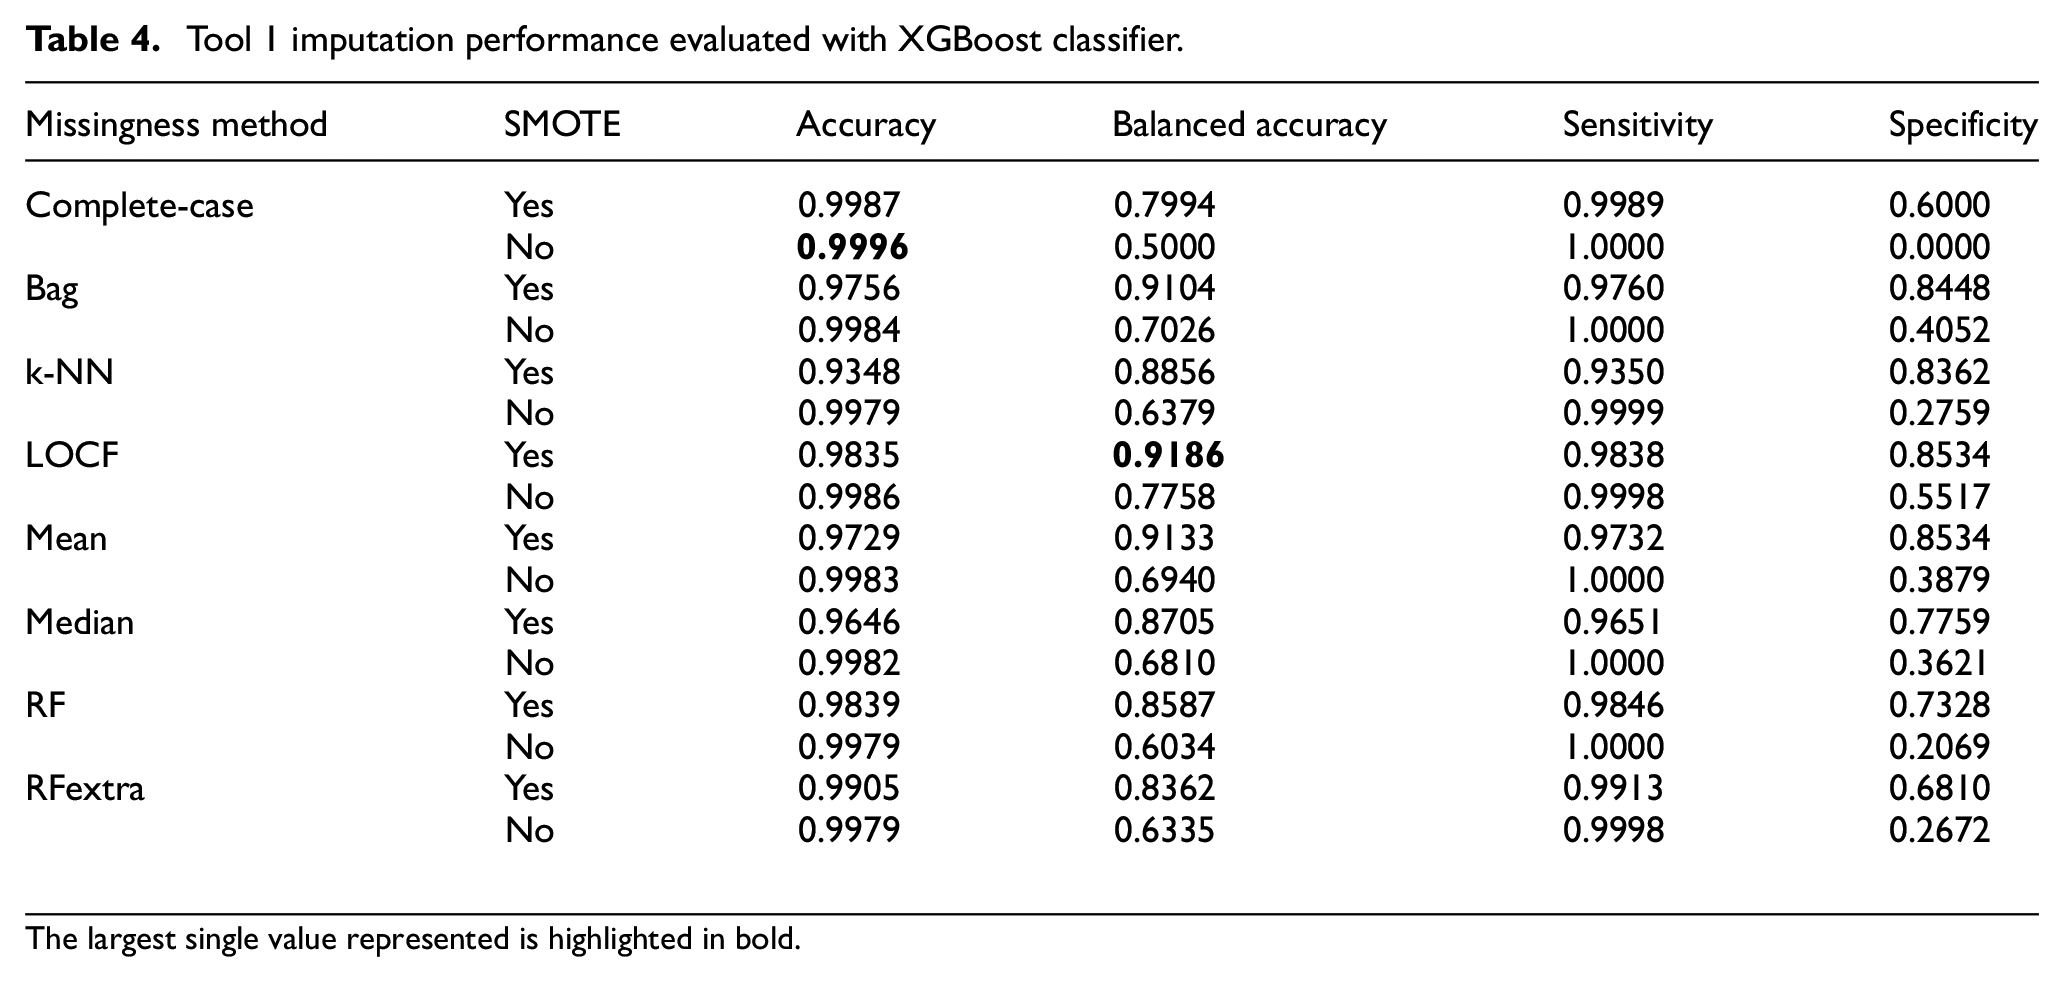
The largest single value represented is highlighted in bold.
Considering Balanced Accuracy with SMOTE, LOCF provides the best performance. This could be because the sensors are continually recording values at 1 Hz samples and little variation would be expected. These performances highlight how complete-case analysis is inadequate for analysing Seagate data and although the mean imputation provides a high level of balanced accuracy (0.9186), further investigation is needed to ensure variation is retained and the imputed values are representative of the original data. Other algorithms can also result in data deviating from the expected distribution, and therefore a combination of analysis must be considered when choosing the imputation method.
As seen in other papers, one model is often not enough to make definitive conclusions. A summary of the results for the other Tool machines is given in Table 5. The best performing imputation algorithms were shown to be the LOCF, k-NN, bag and mean imputations. For Seagate’s data, the LOCF imputation performed the best on a majority of the models, which was closely followed by the Bag imputation. Therefore, a system that can implement different algorithms is necessary, as one algorithm may not work best with different datasets.
Balanced accuracy performance using the DTC for Seagate.
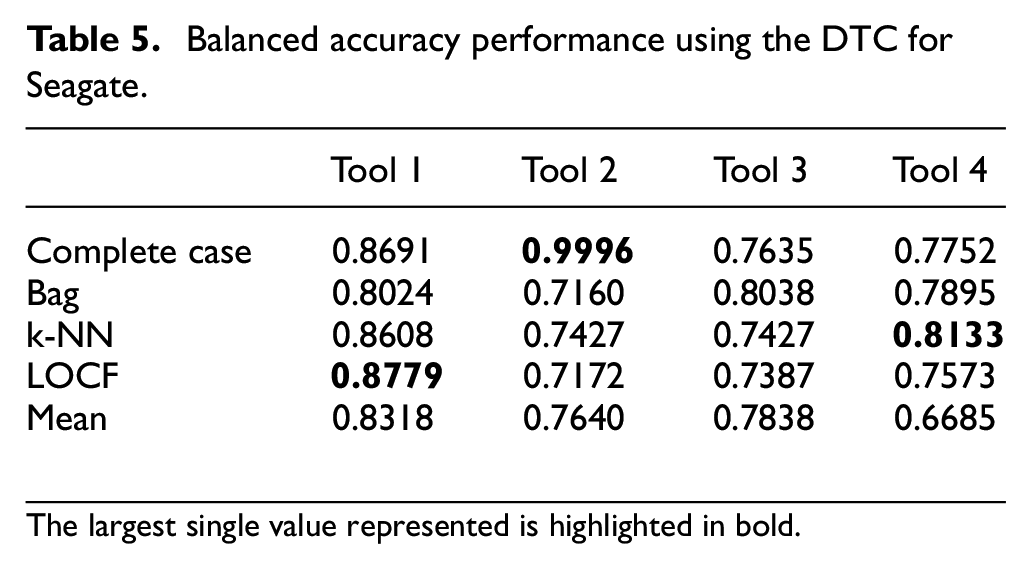
The largest single value represented is highlighted in bold.
Discussion
The immediate impact of this work for Seagate, has been the recognition that missingness is a key issue in their data and the resulting analysis has provided some interesting insights to the operation of the manufacturing process, namely the correlation of missingness across fleets of machines. The resulting investigation has explored the impact of using various imputation approaches directly on the company’s manufacturing data.
In terms of context with previously published research, the work in Escobar et al. 3 backs up our conclusion that the imputation algorithm needs to be chosen on a case-by-case basis. In their paper, they indicate that ‘the data set should be thoroughly assessed, to determine the most appropriate statistical method to handle missing data’. They apply an algorithm based on a greedy-like selection which makes whatever choice seems the best at each iteration. It addresses the trade-off between the number of columns (features) and rows (samples) which they argue is a common situation in manufacturing where sensors may randomly break down or may be systematically turned off. The work explores the different sub-sets that solve the trade-off between number of features and number of samples which is similar to this work. Whilst asserting that the work is applicable to manufacturing, they only apply to a medical application and do not provide any insights into the missingness.
In the work in Flath and Stein, 7 the authors have created a more complex toolbox similar to, but more complex than that we presented in Figure 2 and applied it to the Bosch dataset from Kaggle. They perform duplicate detection but most of the work concentrates on identifying relationships from the data and missingness is not really considered. Mante et al. 23 applied mean substitution and regression imputation for handling missing data in biologics manufacturing databases and show it performs well and introduces no bias. However, the missingness was artificially introduced, so the focus was more about minimising the error to a known dataset rather than understanding the missingness patterns. In Wang et al., 24 the authors propose a machine learning approach based on a novel orthogonal least square based autoencoder approach for the missing data imputation. It shows superior performance for various levels of missingness, but once again, the missingness has been artificially created and then addressed in simulation. Park et al. 25 apply a classification method based on the mixtures of Dirichlet process and naive Bayes model to a real manufacturing dataset from Samsung but again, they artificially create the missingness.
Conclusion
Results from a detailed study of Seagate’s disc head manufacturing process have been presented. It has led to the development of a new missing data analysis procedure which helps the engineering staff to handle differing missing data patterns. A key driver has been the lack of understanding behind missing data causes. New visualisation tools using cluster identified relationships and similarities within missing data patterns, were developed. The CART analysis was used to identify relationships between the proportion of missing data and key features. Combining these, it was identified that the missing data could not be removed or ignored, and therefore must be accounted for appropriately. An investigative study on imputation was undertaken and concluded that the imputation algorithm needs to be chosen on a case-by-case basis.
Footnotes
Acknowledgements
The authors would like to express their appreciation to Seagate for providing both data and feedback on their manufacturing process, to Timothy White for generating some of the simulation output and Professor Adele Marshall for providing advice on the algorithmic aspects.
Declaration of conflicting interests
The author(s) declared no potential conflicts of interest with respect to the research, authorship, and/or publication of this article.
Funding
The author(s) disclosed receipt of the following financial support for the research, authorship, and/or publication of this article: This work is supported by the Engineering and Physical Sciences Research Centre (EPSRC).