
Abstract
Commercially pure titanium (CP-Ti) Grade-2 has many applications due to its good weldability, strength, ductility, formability, and superior corrosion resistance. Although, CP-Ti Grade-2 can be formed at room temperature, however, it has lower ductility at room temperature. Therefore, heat treatment or thermal activation is required to increase its ductility and formability. In this paper, the process capabilities of CP-Ti Grade-2 to form the components through warm incremental sheet forming (ISF) has been investigated. To identify the optimal temperature at which CP-Ti Grade-2 sheets can be incrementally formed, straight groove tests were performed experimentally at various temperatures. Two geometries, namely, varying wall angle truncated cone, and constant wall angle truncated cone were used as test cases to evaluate the formability of CP-Ti Grade-2, in terms of limiting wall angle. The formability was also assessed through forming limit diagram obtained by Finite Element (FE) simulation. With forming limit damage criterion, fracture in the formed component was predicted with FE simulation using Abaqus Explicit software. To assess the process capabilities of CP-Ti Grade-2 sheet formed through warm ISF, thickness distribution, forming forces, geometrical accuracy, and surface roughness were analyzed through both FE simulation and experimental work.
Keywords
Introduction
Incremental sheet forming (ISF) is a flexible forming process. 1 ISF converts metal sheets into desired 3D shapes with a numerically controlled tool, without the need for costly and product or process-specific tools. 2 The process is suitable for prototype and customized sheet metal components. 3 The deformation in ISF is highly localized and resulted due to the mechanism of shear, bending, and stretching.4,5 Steel and aluminium alloys show good formability at room temperature.6–8 Therefore, numerous studies available in literature discussed the effect of process parameters, like step depth, wall angle, spindle speed, feed rate, and tool diameter on formability of these alloys.9,10 However, limited literature is reported so far on the formability of titanium alloy at room temperature thorough ISF, as it is difficult to form due to its hardness, higher cost, and poor formability. The formability of commercially pure titanium (CP-Ti) in ISF was first investigated by Hussain et al. 11 They discussed the effect of the pitch, feed rate, tool diameter, and friction at tool-sheet interface on formability. Yoganjaneyulu et al. 12 studied the fracture behaviour of titanium grade 2 sheets during ISF process considering tool diameter and speed as important parameters. In 2019 Yoganjaneyulu and Sathiya Narayanan 13 compared the titanium grade 2 and grade 4 sheets. They reported that due to the better ductility titanium grade 2 sheets exhibited better forming and fracture limits compare to the grade 4 sheets. Gatea et al. 14 carried out the experimental and FE analysis for ISF process to evaluate the impact of step down, feed rate and tool diameter on formability of titanium grade 1 and grade 2 using GTN damage model. Daleffe et al. 15 have analysed ISF of CP-Ti Grade-2 at room temperature and showed that the limit wall angle for the CP-Ti grade 2 sheet of 0.5 mm thickness is 47°. Literature reports that heating during forming process can improve the process performance as it increases formability, improves dimensional accuracy, and reduces forming forces. The laser and current sources were mostly used for increasing the temperature during incremental forming by supplying heat to the sheet or tool. Mohammadi et al. 16 discussed the laser-assisted single point incremental forming to improve the accuracy of the formed part and reported that through selection of a proper laser positioning on tool-sheet contact zones, the accuracy of the formed parts could be increased. Duflou et al. 17 used the laser-assisted incremental forming process and demonstrated that the reduced forming forces, improved dimensional accuracy, and increased formability for a range of materials were obtained using a laser source. Fan et al. 18 introduced electric hot incremental forming (EHIF) technique to deform the titanium and magnesium alloy. They reported that an increase in the electric current increases the temperature, which results in the improvement of formability. Honarpisheh et al. 19 also used the EHIF process to identify the effect of process parameters on formability, thickness distribution, and forming forces through both experimentally and numerical investigations in the Ti-6Al-4V sheet. Silva and Alvares 20 used halogen lamps as the warm forming set up to increase the temperature of the aluminium sheet during forming and reported favourable results with warm ISF process. Ambrogio et al. 21 reported increase in formability through hot incremental forming while forming AA2024-T3, AZ31 B-O, and Ti-6Al-4V. Ambrogio et al. 22 discussed the incremental forming of magnesium alloy AZ31 in a range of 200°C–300°C. They reported that the maximum formability was achieved at 250°C. Ambrogio et al. 23 defined a mathematical model for temperature prediction of sheet material (AA5754 and Ti6Al4V) during ISF. The authors claimed that the temperature prediction model can be used as a decision support system to reduce the cost for process optimization. Saidi et al. 24 developed reverse engineering associated warm incremental forming process to produce the customized skull prosthesis from Ti-6AL-4V. They claimed that the proposed heating system manufactures the skull prosthesis at various temperatures at low cost with great simplicity. Badr et al. 25 studied the forming behaviour of Ti–6Al–4V alloy at room temperature and reported that the alloy have very limited formability. Göttmann et al. 26 introduced a new concept of laser assisted incremental sheet forming to form the titanium sheet metal at 400°C to perform both single-point and two-point incremental forming experiments. Xiao et al. 27 investigated the forming behaviour of AA7075-T6 sheet at different temperatures during ISF. For the evaluation of the formability, they had used the varying wall angle conical frustums. They observed an increase in formability and a decrease in the forming forces at higher temperatures. Hussain et al. 28 introduced the varying wall angle pyramidal frustum and conical frustum to evaluate the formability during ISF and reported that the different values of critical size in horizontal plane and similar values of critical initial forming angle for the two geometries.
This work investigates the warm incremental sheet forming of CP-Ti Grade-2 sheets due to its multiple applications. Although, CP-Ti Grade-2 can be formed at room temperature, the formability is quite limited. Authors experienced several issues, for example, high forming forces, tool slippage, and extensive springback while forming CP-Ti Grade-2 at room temperature as a part of preliminary experiments. Therefore, it was imperative to perform warm ISF of CP-Ti Grade-2. Unlike most of the works discussed in the literature that deals with hot ISF, authors have proposed here a simple and effective radiation-induced warm ISF as a safe and reliable method to efficiently and effectively form CP-Ti Grade-2 sheets. The optimal temperature was finalized by conducting straight groove tests experimentally at different temperatures. To identify the limiting wall angle, a varying wall angle truncated cone (VWATC) has been used as an initial test geometry. The components formed with warm ISF were investigated for their formability, thickness distribution, forming forces, geometrical accuracy, and surface roughness, through FE simulation and experimental investigation.
Methodology
Firstly, there was a need to determine the optimal temperature to deform the CP-Ti Grade-2, which is difficult to form at room temperature. Therefore, optimal temperature was identified by performing straight groove test experimentally.
Further, to identify the formability of CP-Ti Grade-2 in terms of limiting wall angle truncated cone having wall angle varying from 0-degrees on the top to 90-degrees at the bottom was used as the initial test geometry. Hussain and Gao 29 had proposed that by utilizing the VWATC the number of experiments required to identify the forming limit of a sheet material reduces. The geometrical details of the VWATC are shown in Figure 1.
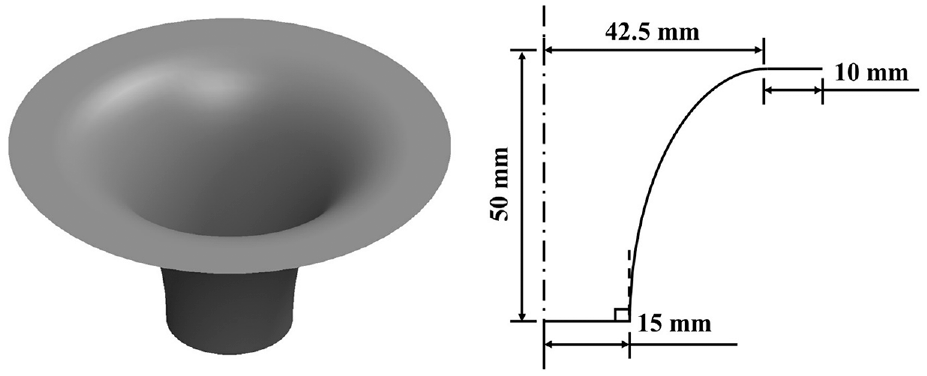
Varying wall angle truncated cone with dimension.
In VWATC, due to the continuous variation in the wall angle, wall thickness of the formed geometry changes continuously. The fracture on the formed part occurs when the minimum thickness is achieved. The depth, where the VWATC fractures provide the limiting wall angle for the sheet material. In this work, firstly, the incremental forming (IF) of VWATC, at the optimal temperature identified through straight groove test, was simulated with the help of the Abaqus software to obtain the limiting wall angle. To confirm this limiting wall angle obtained via VWATC, later, two constant wall angle truncated cones (CWATC) were formed through FE simulation. The limiting wall angle at fracture depth was observed to be 60.66° through VWATC. Therefore, the forming of two CWATC, with 58 and 60-degree wall angles, were numerically simulated. The results were also experimentally verified by actually forming VWATC and CWATC. The dimensions of both the geometries are described in Table 1.
The dimensions of geometries used in the present investigation.
The results obtained through FE simulation and experimental work are discussed in the Section – Results and Discussions.
FE simulation and experimental work
This section consists of five parts. The first part elaborates on the experimental investigation to find the optimal temperature through straight groove tests. The second and third part discusses the heating arrangement and material properties used in the current investigation. The fourth part discusses the FE simulation of IF of CP-Ti Grade-2 sheets to identify the limiting wall angle and other response parameters. The last section presents the experimental work carried out to validate the limiting wall angle and thickness distribution determined earlier through FE simulation.
Heating setup
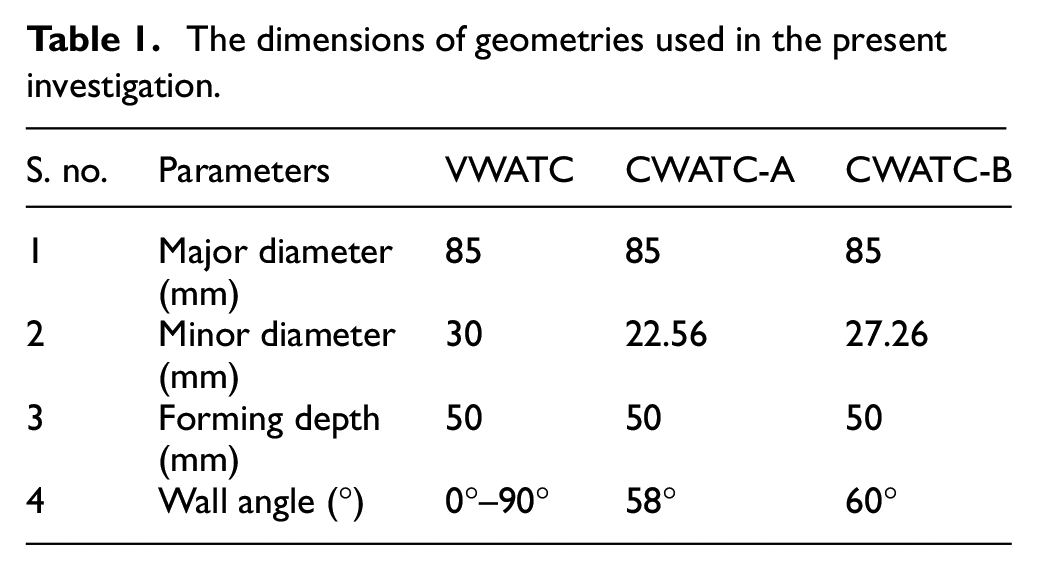
For heating sheets during experiments, radiant type heating arrangement was designed and fabricated. Two halogen lamps (1000 watt each) were placed inside the wooden block of dimension 300mm×150mm×170mm. These halogen lamps, when switched on, raise the temperature of the sheet blank, which in turn increases the ductility of the material. To prevent the heat transfer and to protect the machine components, ceramic blanket insulations were used with the wooden box. A PID (proportional integral derivative) temperature controller with thermocouple was used to control forming temperature during IF. With the PID controller, the measured temperature was compared with the desired temperature. Based on the compared values, the PID controller supplies the electric current to the halogen lamps (switch on/off) to heat the sheet. Once the desired temperature is achieved, the PID controller stops the current supply. The Fluke infrared camera (TiX560) was also used to monitor the temperature during forming process. Figure 2 shows the CAD model and the fabricated heating box for conducting the experiments.
(a) CAD model of heating setup and (b) fabricated heating setup.
Straight groove test
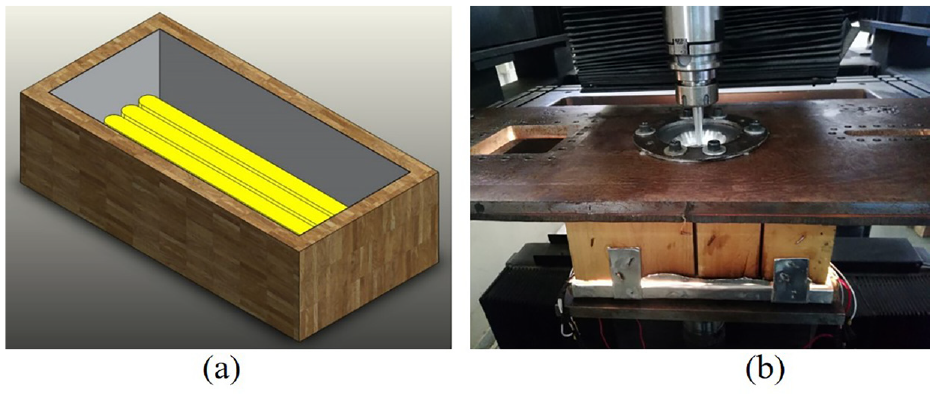
As suggested by Kim and Park 30 that the formability of the ISF process can be assessed by straight groove tests in the present work the straight groove test was performed by allowing the tool to move 85 mm in a linear direction and 0.1 mm in the negative Z direction during each step. Figure 3 shows the toolpath and experimental process of straight groove test.
(a) Toolpath of the straight groove test and (b) straight groove test.
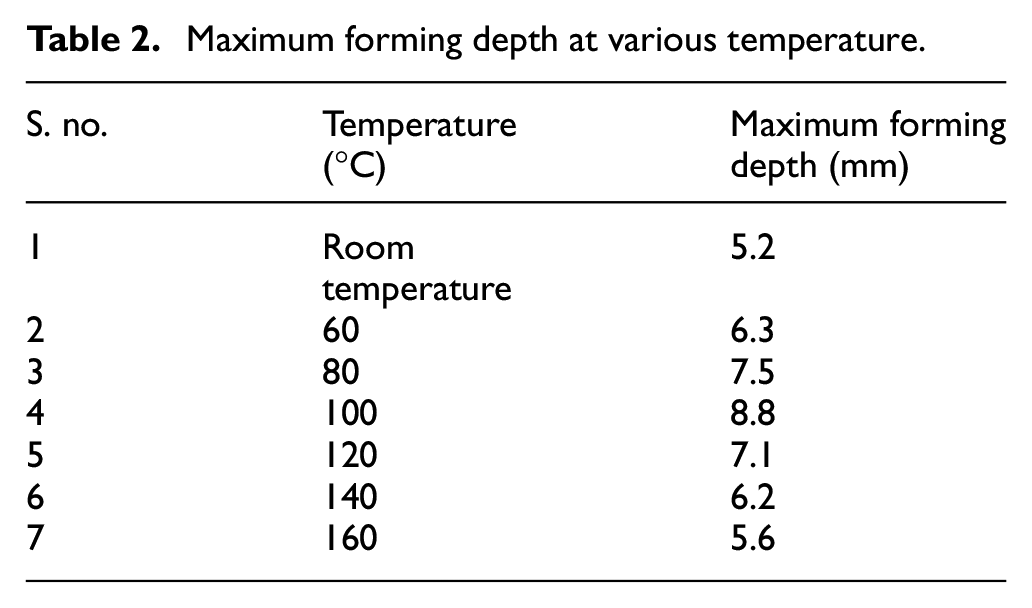
As described earlier the straight groove test was employed to identify the optimal temperature, the tests were experimentally performed with temperatures varying from 60°C to 160°C in intervals of 20°C. The maximum forming depth was achieved with sheet temperature at 100°C. Therefore, the optimal temperature to incrementally deform the CP-Ti Grade-2 sheets was selected as 100°C. The forming depth achieved at different temperatures is depicted in Table 2.
Maximum forming depth at various temperature
Material properties
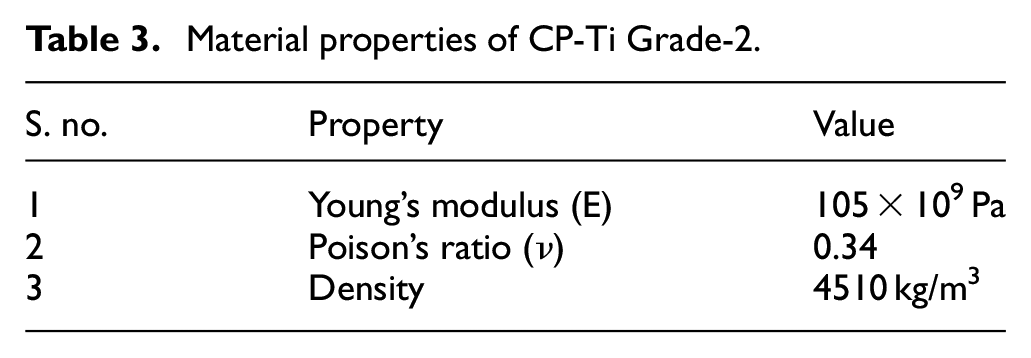
The flow stress-strain relationship for CP-Ti Grade-2 at room temperature and 100°C were taken from the work of Geil and Carwile 31 for the FE simulation. Other material properties, as depicted in Table 3, were considered at room temperature to describe the material behaviour, while the forming limit diagram (FLDCRT) was used as damage criteria for the FE simulation in Abaqus software. 32
Material properties of CP-Ti Grade-2.
FE simulation
The ABAQUS/Explicit software version 2017 was used for simulation of ISF. The finite element model is shown in Figure 4. The sheet blank was meshed using square shape S4R elements with a size of 1 mm. As in the present work the h/L ratio (h is material thickness and L the length of the material blank) was much less than 0.3 therefore shell element (S4R) was taken for the purpose of simulation instead of solid elements. 33 The outer boundary of the sheet was fixed. The tool of 10 mm diameter having hemispherical head was modelled as analytical rigid which moves according to spiral toolpath of 0.5 mm incremental depth. The contact between the tool and the sheet was described by the master (tool) and slave (sheet) algorithm. The coefficient of friction at the tool-sheet interface was taken as 0.05. 16 The initial sheet thickness considered for the investigation was 1 mm, and the size of the sheet blank was 110 mm × 110 mm. The upper and lower clamp was meshed with the discrete rigid elements. The numerical model is then solved in explicit solver and the results obtained are discussed in the results and discussions section. In order to improve the ease of analysis and reduce the computational efforts, mass and time scaling both was used during the simulation. To apply mass scaling, the scaling factor of 100 have been used in the step module and for time scaling, the feed rate was enhanced to 5000 mm/sec.
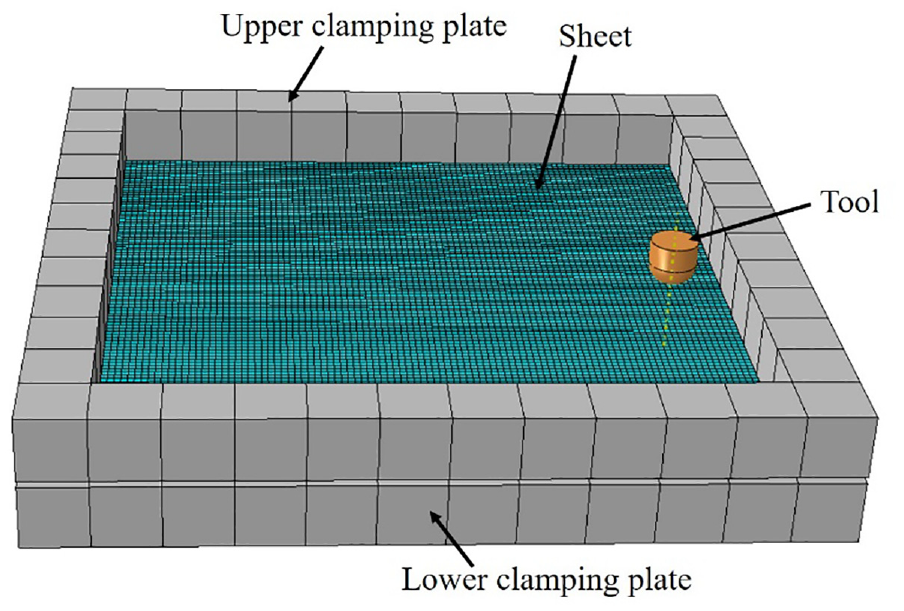
Finite element model in Abaqus 2017.
Experimental verification
Experimental investigations were carried out to verify the limiting wall angle and thickness distribution identified through FE simulation. The experimental setup (Figure 5) consists of mainly six parts: CNC forming rig, sheet blank, forming tool, a fixture plate, clamping plate, and heating setup. The sheet blank was tightly constrained in the fixture plate using a clamping plate. The heating setup was mounted on lower spindle of the CNC rig. For all experiments, a hemispherical shaped tool of 10 mm diameter, made of high-speed steel was utilized. The tool was allowed to move in the X, Y, and Z direction with spiral toolpath and 1000 mm/min feed rate.
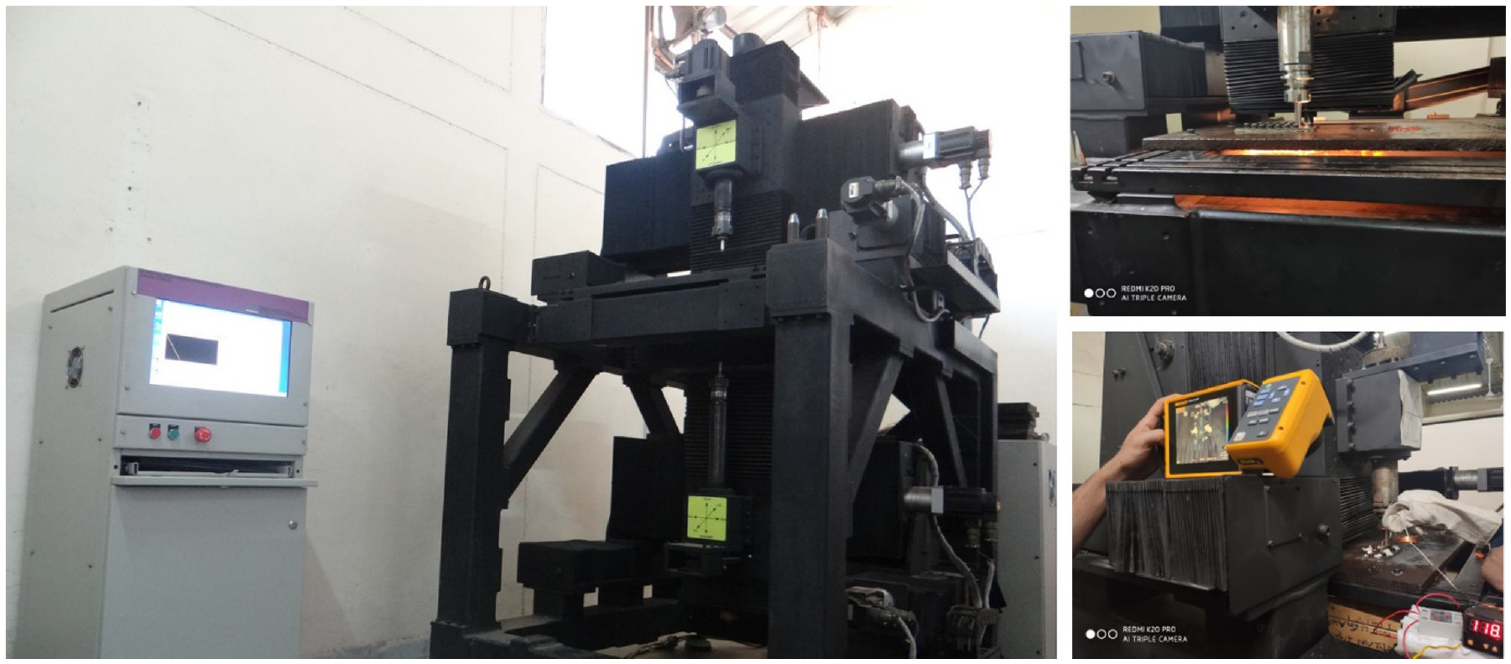
CNC forming rig and experimental setup.
Results and discussions
This section discusses the results obtained through both simulations and experiments to assess the process capability of the CP-Ti Grade-2 for ISF in terms of formability, thickness distribution, forming forces, geometrical accuracy, and surface roughness.
Formability
The formability of CP-Ti Grade-2 was analyzed through limiting wall angle and forming limit diagram (FLD). The effect of temperature on formability in terms of maximum forming depth without fracture is already discussed in Section – Straight Groove Test. With the increase in temperature, significant improvement in formability was observed, and the maximum forming depth was achieved at a temperature of 100°C. To identify the limiting wall angle through VWATC the fracture depth is required. Thus, not only the formation of VWATC was simulated through FEA but also it was physically formed at 100°C. The VWATC was fractured at a depth of 12.94 mm and 13.01 mm during the FE simulation and experimentation respectively. Figure 6(a) and (b) shows the instances of fractured VWATC during FE simulation and experimentation.
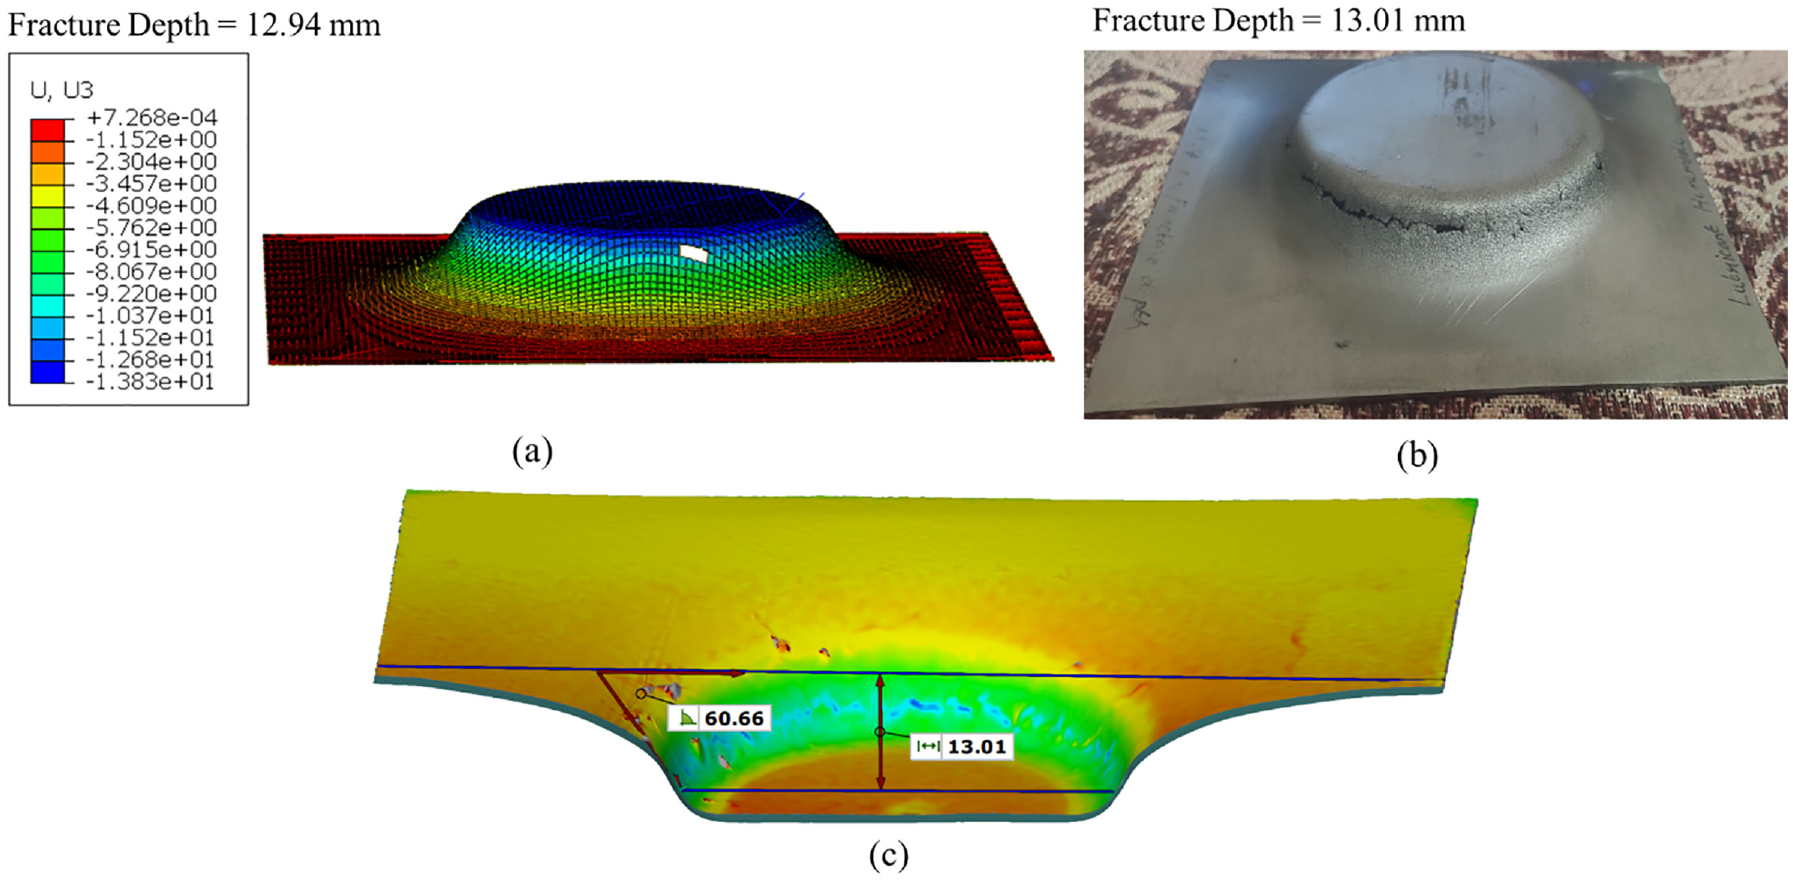
The maximum forming depth achieved with VWATC through: (a) FE simulation, (b) experimentation, and (c) 3D scanning of physically formed VWATC.
Xiao et al.
27
suggested that the wall angle (
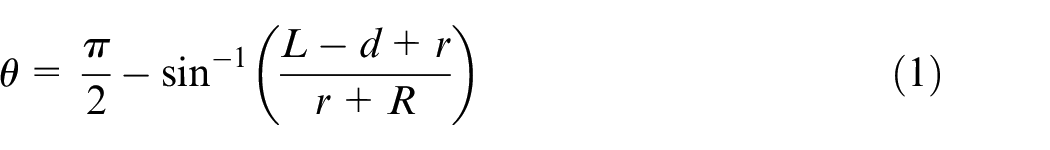
In the above equation, r, d, L, and R are tool radius, forming depth at fracture, overall depth of the part and major radius of the component respectively. The limiting wall angle calculated using equation (1) was 60.66°. The limiting wall angle obtained through equation (1) have also been compared with the 3D scanning of the experimentally formed VWATC at 100°C and shown with the help of Figure 6(c).
Two CWATC of 58 and 60-degrees were fabricated through both numerically and experimentally. The CWATC with 58-degree formed safely without any fracture. However, CWATC with 60-degree wall angle fractured at a depth of 21.3 mm and 23.7 mm during FE simulation and experimentation, respectively. Therefore, the maximum forming angle, which can be achieved for 1 mm thick CP-Ti Grade-2 sheet while formed through warm ISF, is predicted to be 58-degrees, while the sheet fractures when the wall angle is 60-degrees or more.
As described earlier, the forming limit diagram criterion (
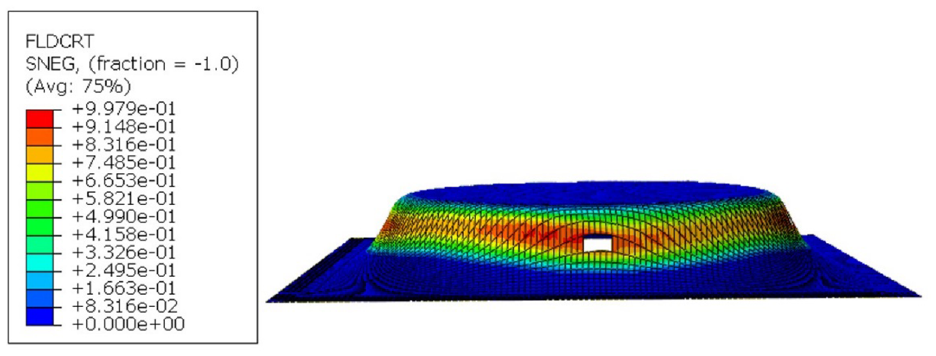
Fracture prediction in 60-degree CWATC formed at 100°C using FLDCRT criterion by FE simulation.
Additionally, the forming limit diagram (FLD) was also plotted for the better prediction of the formability of 60-degree CWATC formed at 100°C. The FLD defines the forming limits in such a way that a material can withstand the onset of localized necking. The line at which the deformation becomes unstable is known as FLC. For safe forming of sheet metal components, the strains evolved during the process should be less than the FLC. In case of ISF the FLC is represented in the form
Hussain et al. 34 defined an equation to obtain the FLD0, and the equation for slope was proposed by Martins et al. 35 These equations are:


Based on the equations (2) and (3) the FLC for the present case is given by
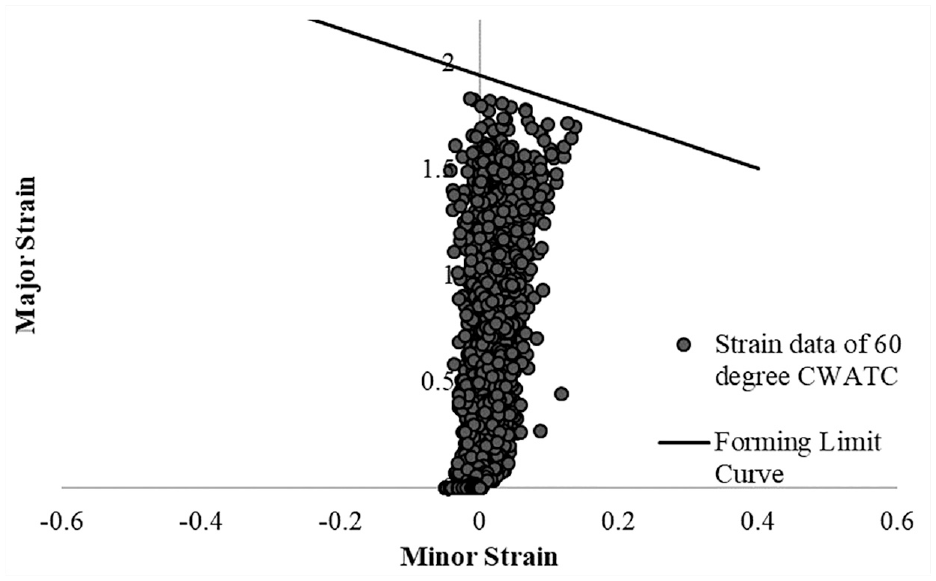
Strain evolution for 60-degree CWATC formed at 100°C.
Thickness distribution
The stiffness of the formed component could be significantly affected by the thickness distribution. Therefore, the thickness distribution of 58-degree CWATC obtained at room temperature and 100°C during FE simulation of ISF were evaluated. Figure 9(a) shows the 3D plots of wall thickness versus forming depth obtained during the FE simulation. As evident from figure the thickness of the deformed component for both the cases decreases along the wall of the component. The whole part is divided into four regions. The region a–b is near the clamping zone; thus, the thinning in this zone is less. As the tool progresses to deform the sheet in the negative Z-direction, the sheet stretches and causes a reduction in the initial thickness of the sheet. Due to the continuous downward movement of the tool, the stretching in region b–c is maximum, which results in minimum thickness in this portion. The thickness distribution in region c–d is uniform while in the region d–e, the thickness increases.
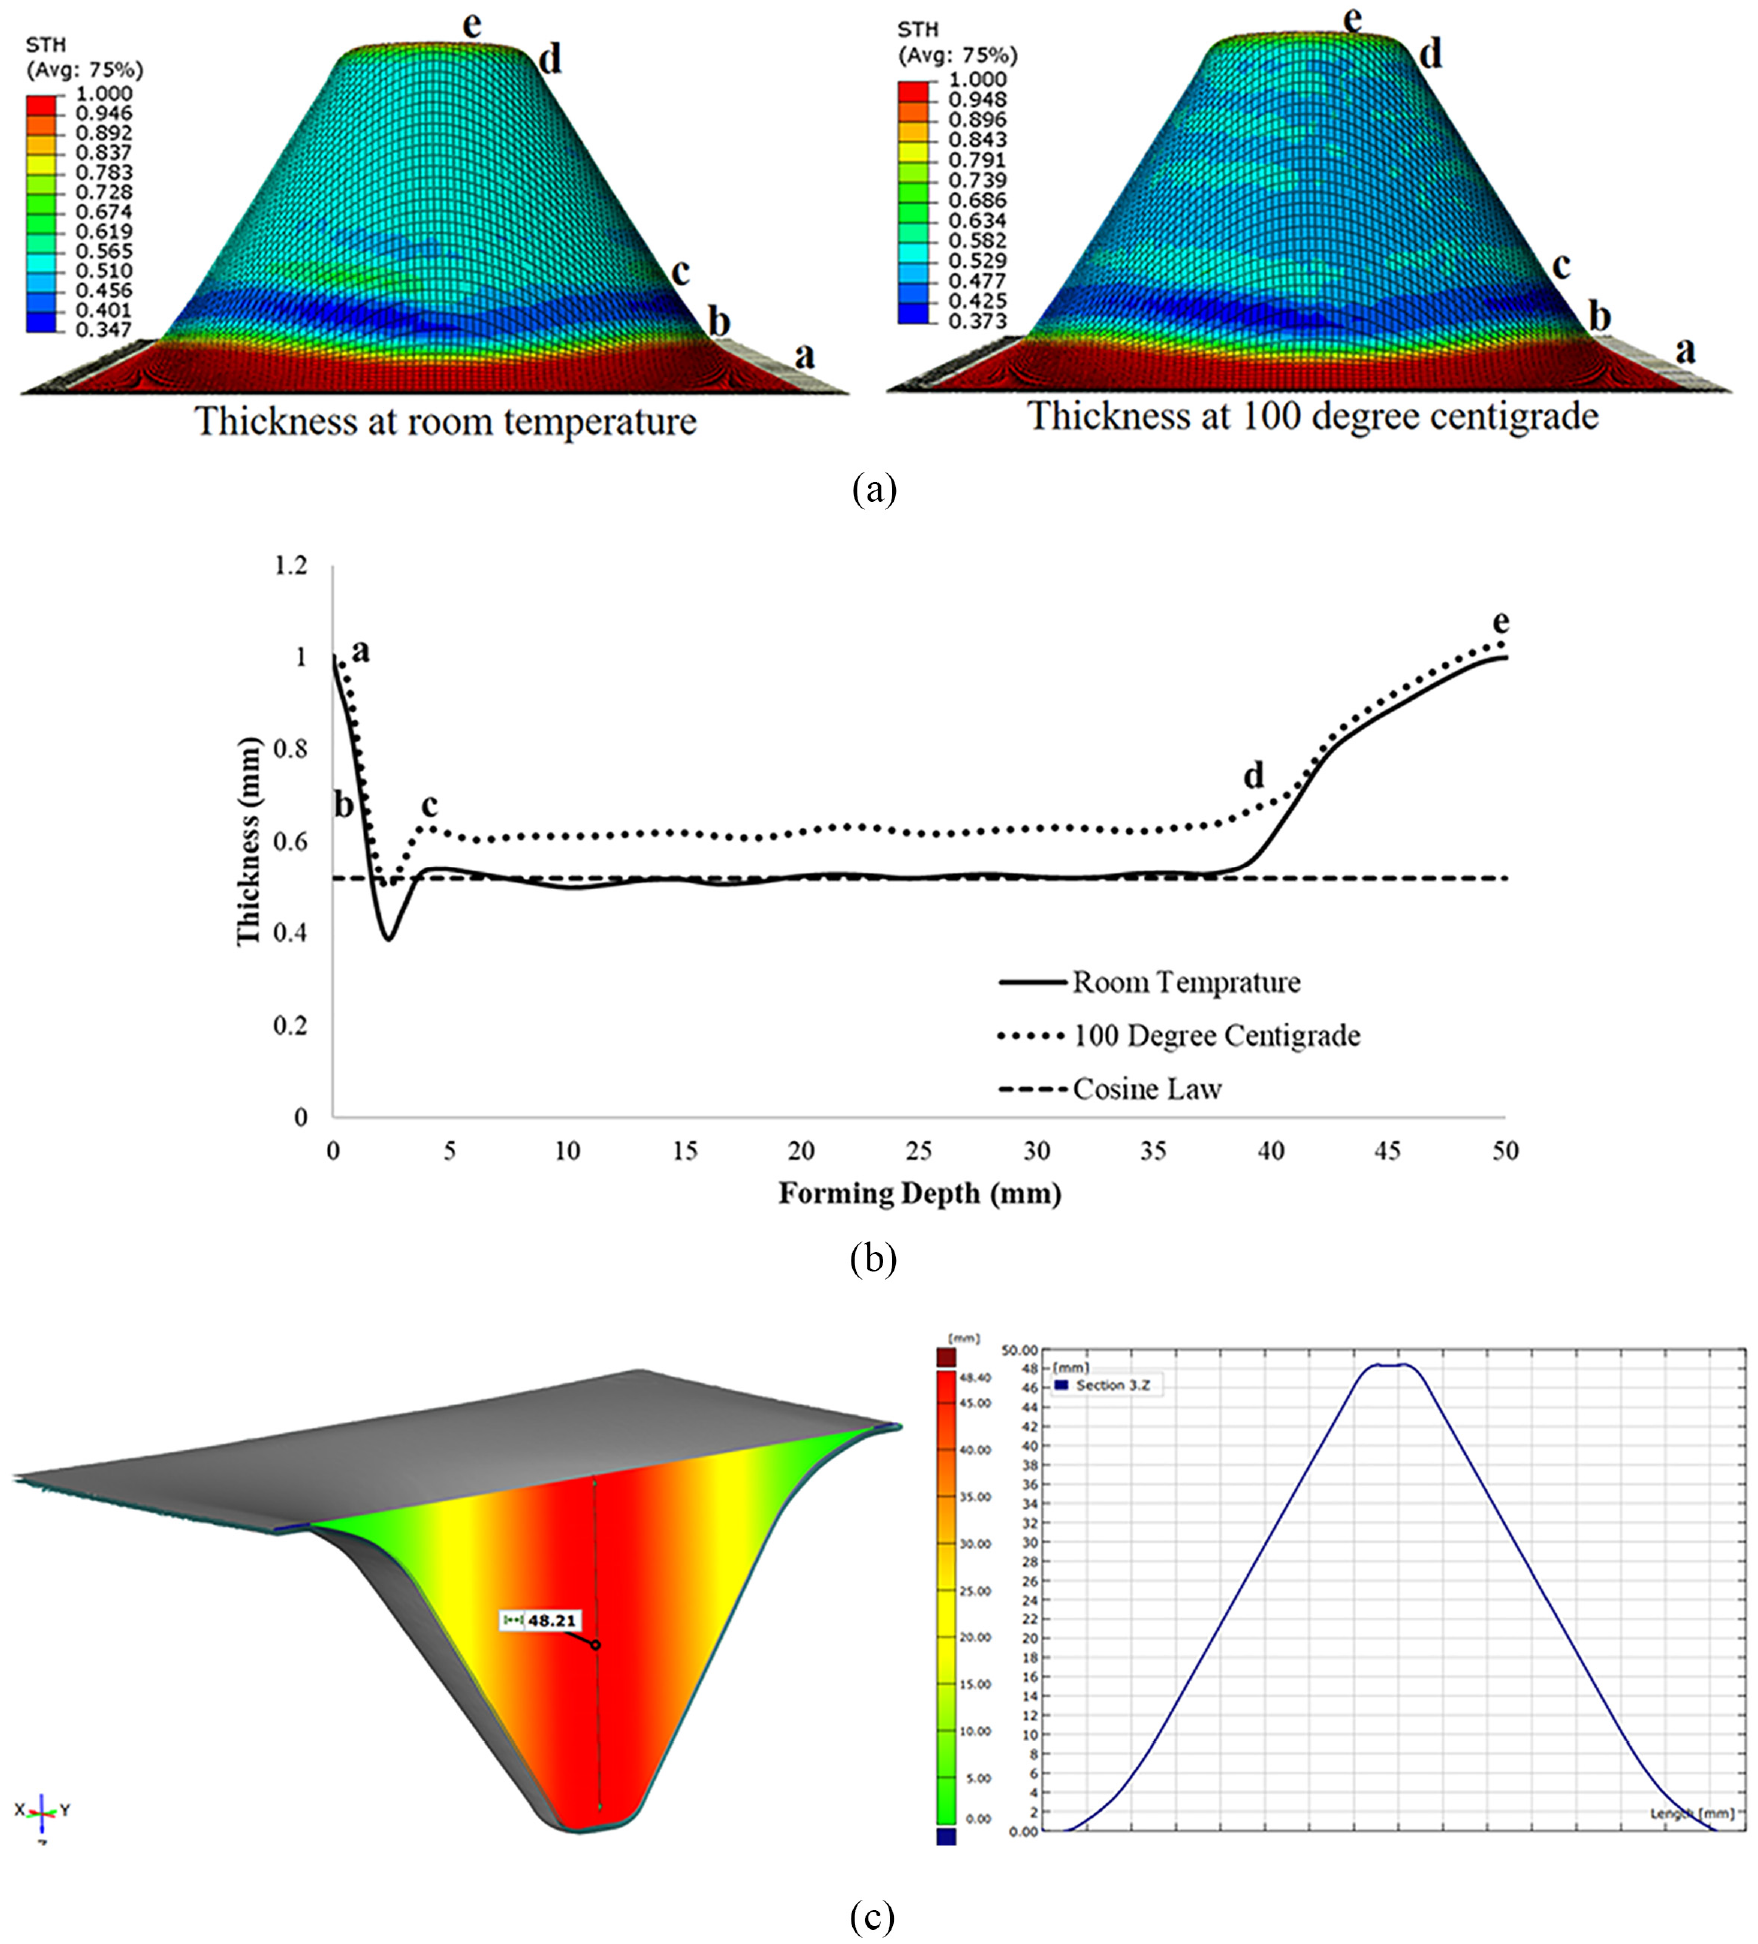
Thickness distribution of 58-degrees CWATC: (a) 3D plots of thickness distribution at room temperature and 100°C, (b) thickness versus forming depth at room temperature and 100°C with cosine law, and (c) forming depth of 58-degrees CWATC formed at 100°C.
The effect of temperature on thickness distribution of the formed component has also been investigated by comparing the thickness distribution obtained during FE simulation at room temperature, and 100°C. It is visible from Figure 9(b) that the thinning in the 58-degree CWATC formed at 100°C temperature has been improved in comparison to the CWATC formed at room temperature. The average wall thickness of the parts formed through ISF at room temperature and 100°C is 0.64 mm and 0.72 mm respectively. In other words, approximately 12.47 % improvement was observed in the thickness distribution of the formed components at 100°C temperature.
Further, the comparison between thickness distributions obtained through FE simulation and cosine law was also made. Figure 9(b) shows the thickness distribution in the formed component satisfies the cosine law (t = t0 × cosθ), as discussed by Hussain and Gao. 29 The experimentally fomed 58-degree CWATC formed at 100°C have been scanned and shown in Figure 9(c) as a reference to confirm the forming depth reached in experimentaion. In this case a forming depth of 48.21 mm achieved. While, the 58-degree CWATC formed at the room temperature was restricted to the depth of 43.20 mm due to the spring back effect.
To confirm the results obtained through FE simulation, experimentally obtained, 58-degree CWATC, formed at 100°C, was 3D scanned. Figure 10 shows the thickness distribution obtained through GOM Inspect software. The minimum thickness obtained through 3D scanning is 0.50 in region b–c. The variation between the minimum thickness obtained through experimental work and simulation was 0.21%, which shows a good agreement. Further, the experimental results also approximately confirm the cosine law, as the final value of thickness obtained through cosine law is 0.52 mm.

Thickness evaluation of 58-degree CWATC formed at 100°C through experimentation: (a) 3D scanning of the formed component and (b) thickness versus forming depth.
Forming forces
In ISF, forming forces are also critical parameters. In this work, the forming forces obtained during simulation of 58-degree CWATC at room temperature and at 100°C were obtained and compared. The effect of the temperature on the forming forces obtained through the simulations along X, Y, and Z directions is shown in Figure 11. It is evident from the figure that the forming forces initially increase for a certain number of tool passes, and then reached a steady-state. This may be attributed to the strain hardening of the sheet material during forming.
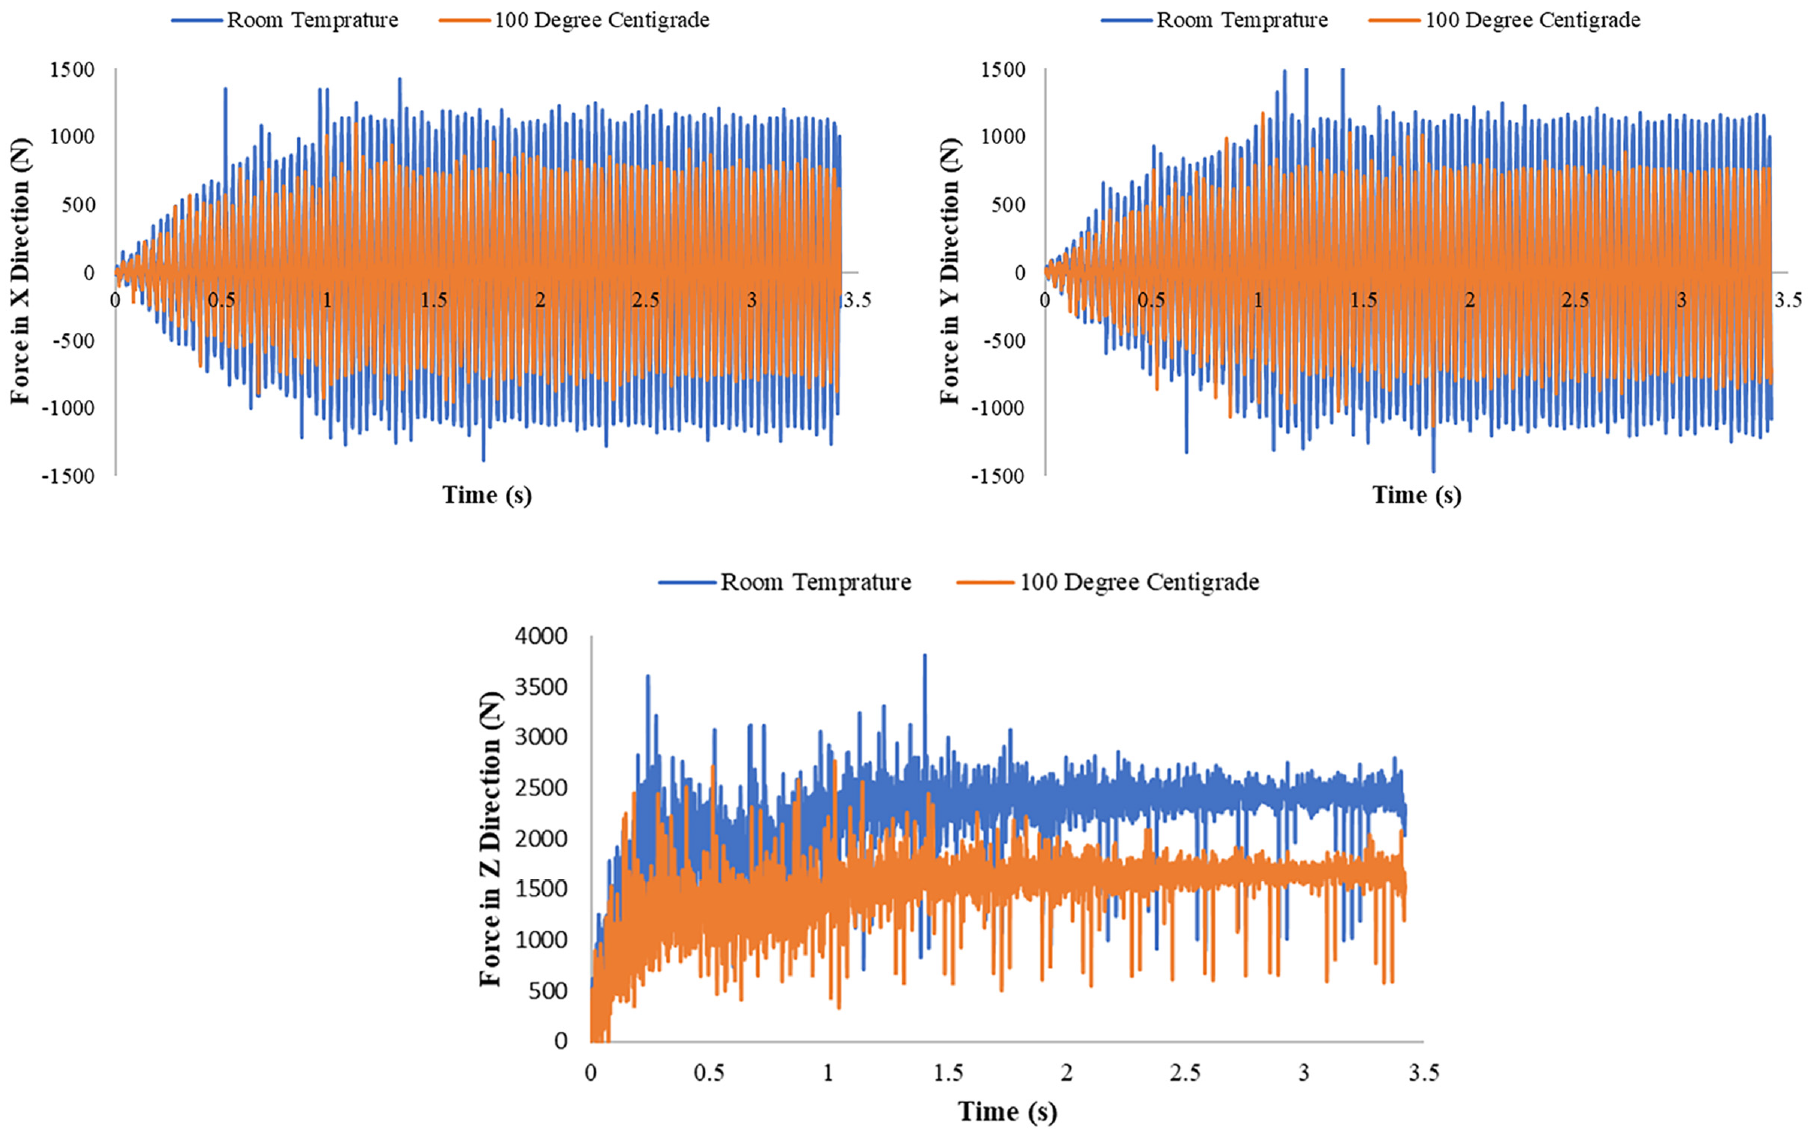
Forming forces to form 58-degree CWATC at room temperature and 100°C.
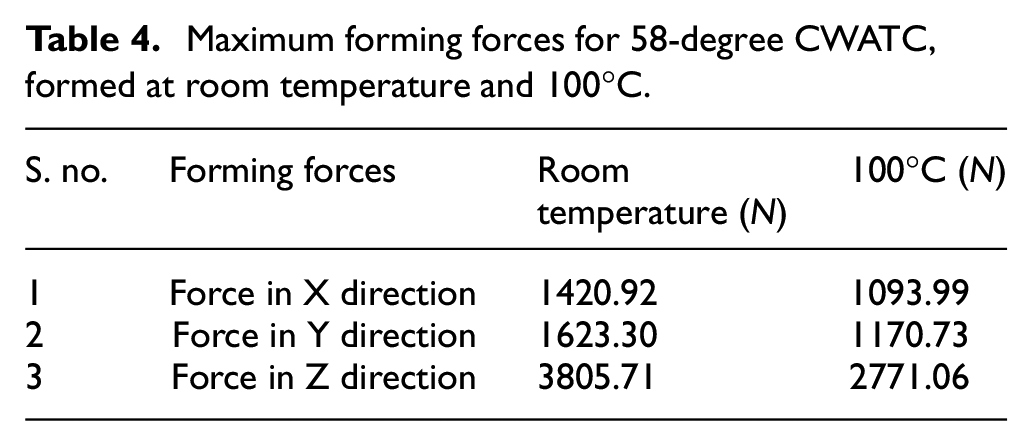
The comparison among the maximum forming forces at room temperature and 100°C temperature is presented in Table 4. As visible from Figure 11 due to the effect of the temperature, the forming forces reduces significantly. The maximum forming forces at 100°C in X, Y, and Z directions are 23%, 27.87%, and 27.18% less than the forming forces required at room temperature. This difference among the required forming forces was due to the difference in the yield strength of the CP-Ti Grade-2 at two temperatures. The yield strength of the CP-Ti Grade-2 at 100°C is reported to be 1.326 times lower than that at room temperature. Therefore, the sheet material at 100°C deforms with lower forming forces in comparison to the room temperature.
Maximum forming forces for 58-degree CWATC, formed at room temperature and 100°C.
Geometric accuracy
To evaluate the geometric accuracy, deviation analysis was performed through GOM Inspect software for 58-degree CWATC formed at 100°C. The cross-section of the experimentally formed part is compared with the original CAD model of the component. It is evident from Figure 12 that the minimum deviation between the formed part and the CAD model is on the bottom zone of the part. The average difference was around 3 mm all over the formed part and the CAD model. This deviation is due to the bending at the initial stages of IF, and the springback after the formed part is released from the clamp.
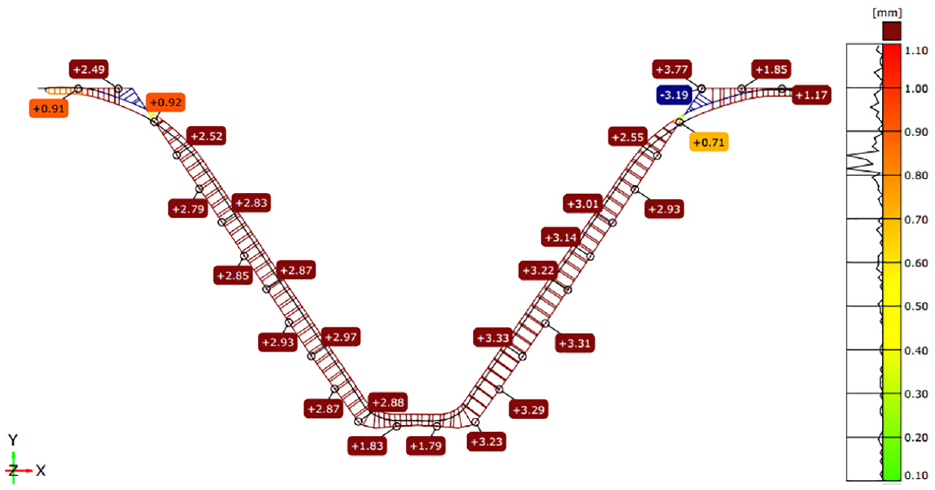
Geometrical accuracy of experimentally formed 58-degree CWATC at 100°C.
Surface roughness
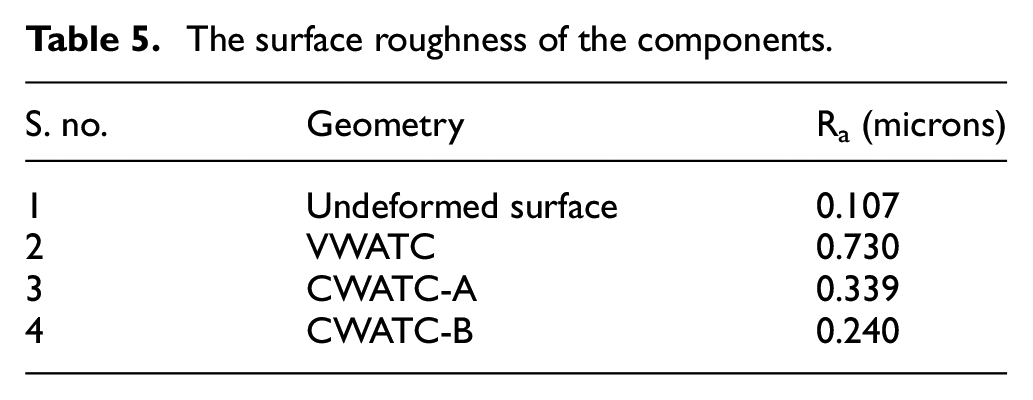
The surface finish of the formed component is an essential attribute to evaluate the part quality for industrial applications. In this work, the surface roughness of the experimentally formed 58-degree CWATC at 100°C was measured. The Ra values obtained at different surfaces are presented in Table 5. The surface roughness on the formed component is due to the tool marks. These tool marks resulted due to the squeezing on the sheet surface, which ultimately results in higher contact pressure and more considerable friction. The roughness values for all four cases are in acceptable range for industrial applications, since the values are below 1 micron. The surface roughness profile for all four cases have been shown with the help of Figure 13.
The surface roughness of the components.
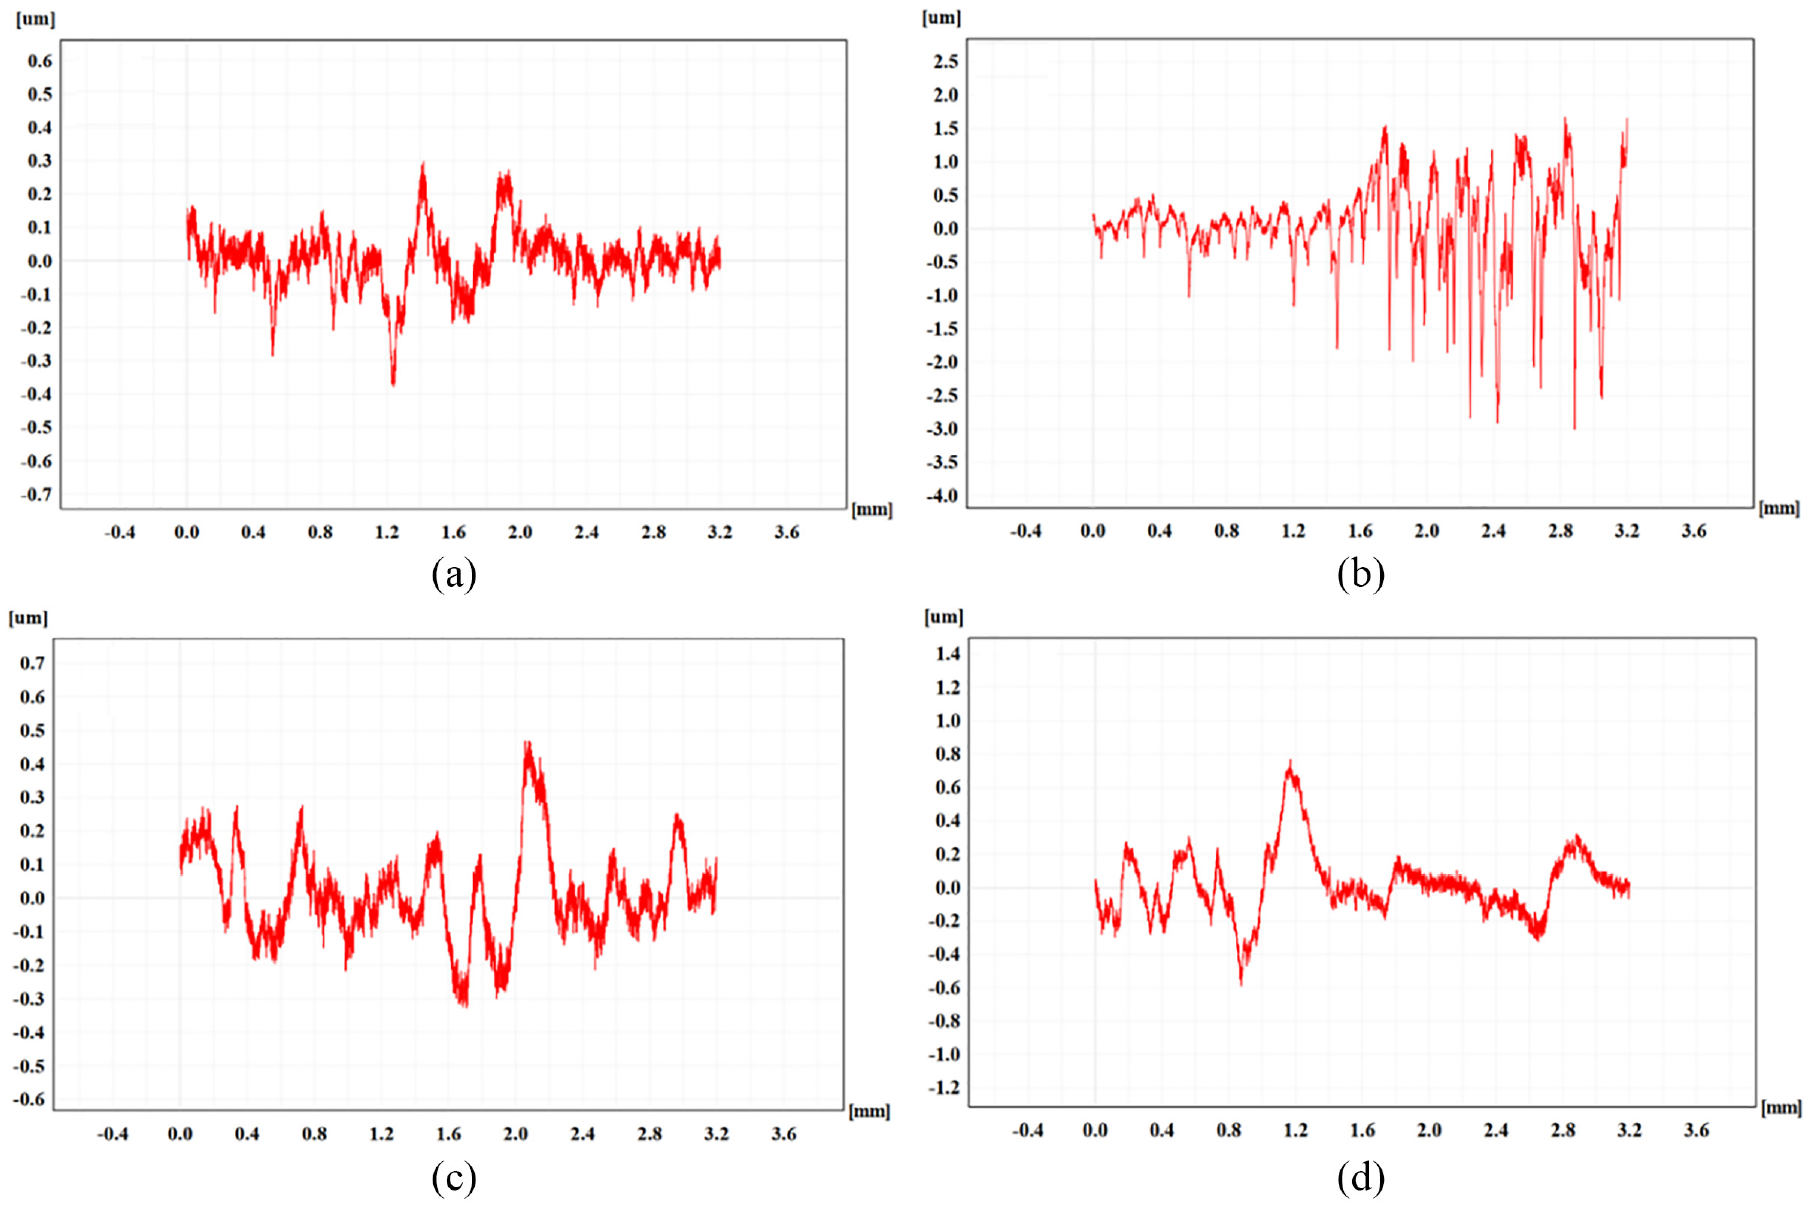
Surface roughness profile: (a) undeformed sample, (b) VWATC, (c) CWATC-A, and (d) CWATC-B.
Conclusion
In the present work, both FE simulation and experimental work were carried out to deform the CP-Ti Grade-2 sheets at different temperatures through ISF process. Through preliminary investigations of straight groove test, a temperature of 100°C was identified as optimal temperature. VWATC and CWATC were used as the test geometry to define the formability in terms of limiting wall angle. Formability, thickness distribution, forming forces, geometrical accuracy, and surface roughness were evaluated to understand the process mechanism of CP-Ti Grade-2 while formed through ISF at room temperature, and at 100°C. Some of the findings can be summarized as below:
At 100°C, the geometry with a maximum forming angle of 58-degree can be formed safely and if the wall angle is increased to 60-degrees or more, the fracture occurs.
The FLDCRT was used as the damage criterion to predict the fracture during FE simulations. The maximum forming depth achieved with FE simulation and experimentation was 12.94 mm and 13.01 mm respectively, for VWATC formed at 100°C.
The temperature had a substantial effect on the maximum forming forces. The forming forces along X, Y, and Z directions were reduced by 23%, 27.87%, and 27.18%, respectively at 100°C, compared to that at the room temperature.
The thickness distribution of the 58-degree CWATC, formed at room temperature, and 100°C was compared. Improved thickness distribution was reported at 100°C.
The minimum thickness of the 58-degree CWATC obtained through FE simulation, and experimental work satisfies the cosine law of thickness.
Through the deviation analysis the average deviation was observed to be 3 mm, which was primarily due to the bending and springback in the geometry. Further investigation is required to minimize this deviation using toolpath strategy or two-point incremental forming.
The surface roughness of the formed components is within the acceptable range, as the maximum value of roughness was below 1 micron.
The difference in the formability, forming forces, and thickness distribution for the parts formed at room temperature and 100°C is due to the effect of temperature. At 100°C, the strength of the material reduces, which ultimately results in increased formability, reduced forming forces, and better thickness distribution.
Footnotes
Declaration of conflicting interests
The author(s) declared no potential conflicts of interest with respect to the research, authorship, and/or publication of this article.
Funding
The author(s) disclosed receipt of the following financial support for the research, authorship, and/or publication of this article: This research was financially supported by Impacting Research Innovation and Technology (IMPRINT) India project of the Government of India (Project Number: 5506, 2017). The authors wish to acknowledge the funding agencies, the Ministry of Human Resource Development (MHRD), and the Department of Heavy Industries (DHI) of Government of India.