
Abstract
Assembly quality of aero-engine casing plays a key role in the whole aero-engine, since it is directly related to the final function and dynamic performance. However, during the design phase, the tolerance analysis is usually conducted independently without any consideration of the effect on the dynamic characteristic. This paper aims to integrate manufacturing precision with dynamic performance instability together. First, the 3-D tolerance model of the aero-engine casing is constructed based on the Jacobian-Torsor theory. The target deviation from the tolerance model is defined as the input variable into the vibratory governing equation. Then, the effect of 3-D assembly deviation on the natural frequency is studied. The corresponding frequency distributions for different vibration modes are illustrated. Finally, the mapping relationship between assembly tolerance and fluctuation ratio of natural frequency is established through the 3-D fitted surface. Under the given constraint of performance stability, the optimized tolerance zone is obtained. This work provides a significant guidance for performance improvement and tolerance design in the aero-engine casing assembly.
Introduction
Aero-engine casing is a key component for transmitting thrust from an engine to a plane. The performance and lifetime of the casing are directly related to the assembly quality. However, due to the limitation of manufacturing process and accidental error of fixture, it is inevitable to generate various deviations during the assembly process. These assembly deviations are propagated and accumulated among the connection features,1,2 influencing the final assembly quality and performance. Therefore, it is an important task to design tolerance and evaluate the effect of tolerance on the dynamic characteristic at the design stage of the aero-engine casing.
In the recent years, many efforts have been paid to study the assembly modeling and tolerance design. Liu et al. 3 presented a method to restrain the initial unbalance in the aero-engine assembly through the connective assembly model and defined the assembly orientation as the nonlinear constraint to obtain optimal assembly strategy. Forslund et al. 4 expressed the geometrical deviation of the turbine rear structure by scanning part in a 3D scanner and found that geometrical deviation can be utilized in the optimization analysis of the structure of the engine. Ding et al. 5 constructed a multistage assembly model to simulate the deviation propagation of the rotor and provided the rotary regulating joint for the deviation control. Wang et al. 6 proposed a stack-build assembly method and considered the location and orientation tolerances of the multistage rotor. The final assembly quality was improved by minimizing the eccentric deviation. Kang and Li 7 investigated the tolerance propagation of the bolted joint in multistage aero-engine casing and presented the effect of flexible assembly deviation caused by bolt preload. The result showed a mean shift on the statistical distribution of the concentricity deviation. Zhang et al. 8 proposed a method to consider the form defects and surface deformations for the tolerance analysis of the cylindrical components, and they showed the effect of surface deformation on the tight fit and loose fit situations. Yi et al. 9 established an assembly tolerance model by integrating skin model and stream-of-variation theory and then calculated the value of assembly functional requirement with consideration of the inevitable manufacturing and assembly process errors. Sun et al. 10 provided a novel method for controlling the amount of unbalance propagation in precise cylindrical components assembly, in which the machining error, the measurement error, and the assembly error were taken into account. However, the previous tolerance design and analysis mainly focused on the assembly modeling and deviation control without any consideration of the dynamic performance. Few researches were conducted to probe into the effect of assembly tolerance on dynamic performance of the aero-engine casing. The mapping relationship between manufacturing precision and performance instability needs to be revealed.
In the field of aero-engine, the casings are usually designed as the thin-walled structure in the actual products, which easily causes a weak bending stiffness and serious vibration problem. Considering that the dynamic characteristic of the thin-walled structure is very sensitive to the initial stress and boundary,11,12 the casing is expected to have a stable initial assembly condition. However, as various geometrical and positional deviations are propagated at the assembly stage, the target deviations of some important geometrical features are accumulated, causing undesirable elastic deformation.13–15 It is inevitable for the assembly deviation to affect the dynamic performance of the structure. Beaudoin and Behdinan 16 presented a lump model with the consideration of the nonlinear response of partial clearance on bolted flanges. Through the model, the effect of different geometrical parameter was studied. Guo et al. 17 modeled a geared rotor system with manufacturing bending deviation and analyzed the effect of the magnitude and position of bending deviation on the dynamic responses. Wang et al. 18 proposed a theoretical aero-engine model with blade-casing rubbing. The shear deformation and inertias of the rotor model were involved. The fluctuation of acceleration responses caused by different blade-casing clearances were illustrated. Wang et al. 19 employed 3D finite element model to discretize rotor with cracked surface. The unbalance of rotor was studied to reveal the effect on the nonlinear dynamics of cracked rotors. The result showed that the unbalance could significantly affect the breathing mechanism of the crack. Fargère and Velex 20 studied the effect of the clearance among the bearing-shaft-gear system and found that bearing clearances can strongly modify the actual alignments of the shafts and load distributions. However, the aforementioned researches about effect of deviation on dynamic performance only focused on a certain kind of one-dimensional assembly deviation. It is still not clear about the evolution process from manufacturing precision to the fluctuation of dynamic performance. Few research results were reported about the 3-D assembly tolerance design with constraint of the dynamic performance, especially for the aero-engine casing.
In this paper, the manufacturing precision is integrated with the dynamic performance together. The mapping relationship between 3-D assembly tolerance and the fluctuation of natural frequency is constructed. Tolerance reallocation is conducted with the constraint of specified stability demand. First, the 3-D tolerance model is established by Jacobian matrix and torsor theory. The vibratory governing equation of aero-engine casing is expressed with the target deviation. Then, the effect of various deviations on the natural frequency of the casing is studied. By generating random samples of assembly deviation, the statistical features of frequency are presented. Finally, through the 3-D fitted surface, acceptable tolerance region is obtained to meet the specified stability requirement of natural frequency. The corresponding flowchart of this paper is illustrated in Figure 1. Through the presented method, dynamic performance can be improved by reallocating tolerance.
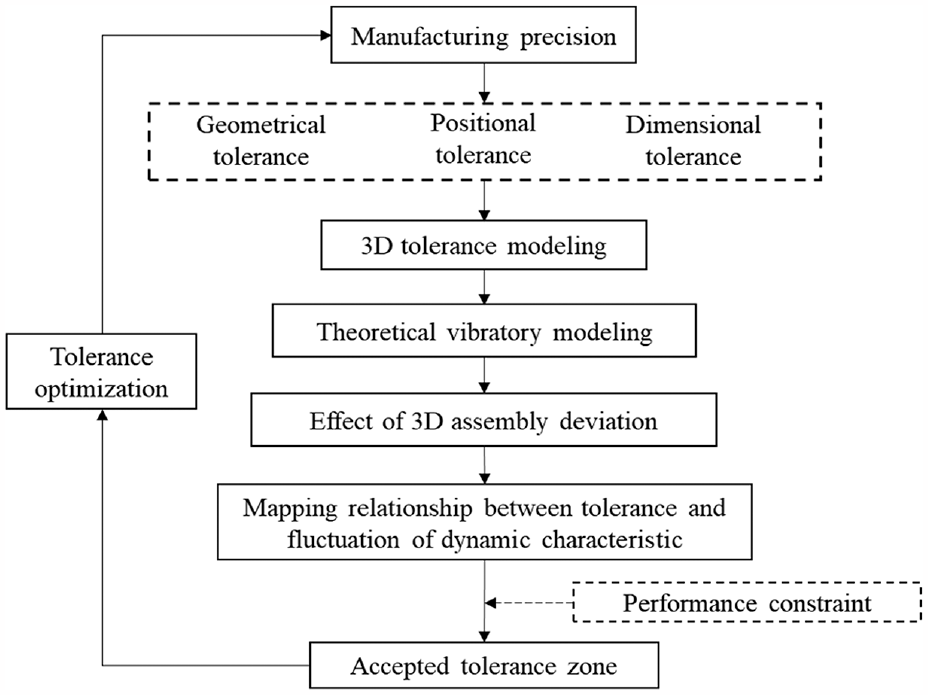
Flowchart of the analysis process.
Theoretical modeling
3-D assembly tolerance model
The spatial position and shape of mechanical parts are usually designed with specified tolerance to meet actual manufacturing level. It is inevitable to generate the initial assembly deviations since the dimensional and geometrical deviations of different subparts are propagated and accumulated. In terms of cost saving, it is better to analyze tolerance allocation and predict assembly quality in the design phase to shorten the development cycle of product. In this section, the 3-D Jacobian-Torsor tolerance model is established to characterize spatial deviation. Based on the tolerance model, the target deviation and its tolerance zone can be predicted.
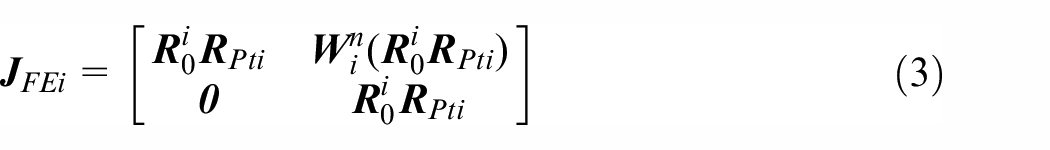
Jacobian-Torsor model (J-T model) is the combination of Jacobian matrix and Torsor mode,21,22 and it can express various deviations, such as dimensional deviation, positional deviation, profile deviation, and coaxiality deviation. The Jacobian matrix is to describe the spatial positional relationship among the deviations in the functional geometric features, and it is formulated as a linear arithmetic to express the deviation propagation. The Torsor model, known as small displacement torsor (SDT), 23 is the mathematical expression of the deviations. The Jacobian-Torsor model can be written as:


where FE is the functional element and can be defined as the internal functional element (IFE) or the contact functional element (CFE) according to its function in the assembly.
24
The subscript FEi indicates the ith functional element.
where

where C
1l
, C
2l
, and C
3l
are the 3 × 1 matrix, indicating the unit vectors along the x, y, and z axes of ith FE with respect to the “0”FE respectively.
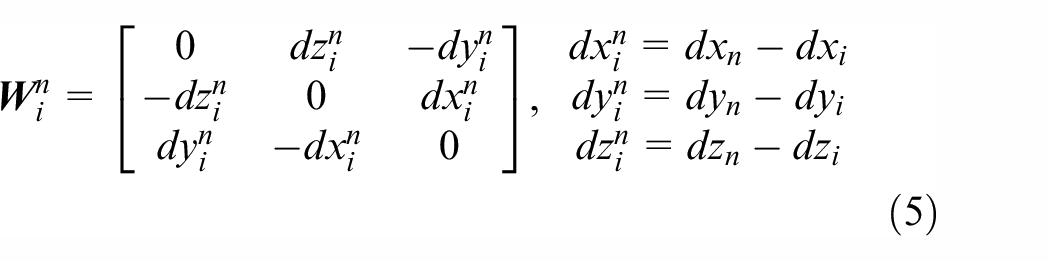
The subscript i and n indicate the ith and nth functional elements, respectively. The dx, dy, and dz are the coordinates of the corresponding functional elements in x-, y-, and z- directions, respectively. The leverage effect of the deviation propagation can be described through the matrix
The torsor model

Torsor model with six small displacement vectors.
With the good adaptability and brief formulation, Torsor model can be applied to express various geometrical features, such as axes, edge, and plane. Noting that the vector of tolerance with its unlimited orientation is assigned with zero value. 23
Generally, the aero-engine casing is assembled stage by stage, as shown in Figure 3(a). Considering the similar boundary constrains and the tolerance requirements, in this paper the high-pressure compressor casing (HP casing) is analyzed as the typical component. The corresponding matching components are intermediate casing (IM casing) and intermediate pressure turbine (IP casing). L1 and L2 are the lengths of the IM and HP casings, respectively. D is the diameter of the flange surface. To construct the tolerance model of the casing, the local coordinate systems (LCS) are established at the functional geometrical features, and the corresponding assembly chain is illustrated in Figure 3(b). LCS “0” is the global coordinate system, which denotes the center of the IP casing. LCS “1,” LCS “2,” and LCS “3” denote the center of IM casing, the center of bottom surface and top surface of the HP casing respectively. IFE, CFE, and FR are the internal functional element, contact functional element, and functional requirement respectively. Ts indicates the profile tolerance zone of the flange surface. Tc is the coaxiality tolerance of the axial line with respect to the corresponding datum. Td is the limit of the axial dimension. In terms of assembly process, IM casing is first fastened fully by fixture. Second, the bottom surface of the HP casing is regarded as the datum surface with no deviation, and it is connected with the flange surface of IM casing. After the HP casing is assembled, the assembly deviation between the top surface of HP casing and IP casing is defined as
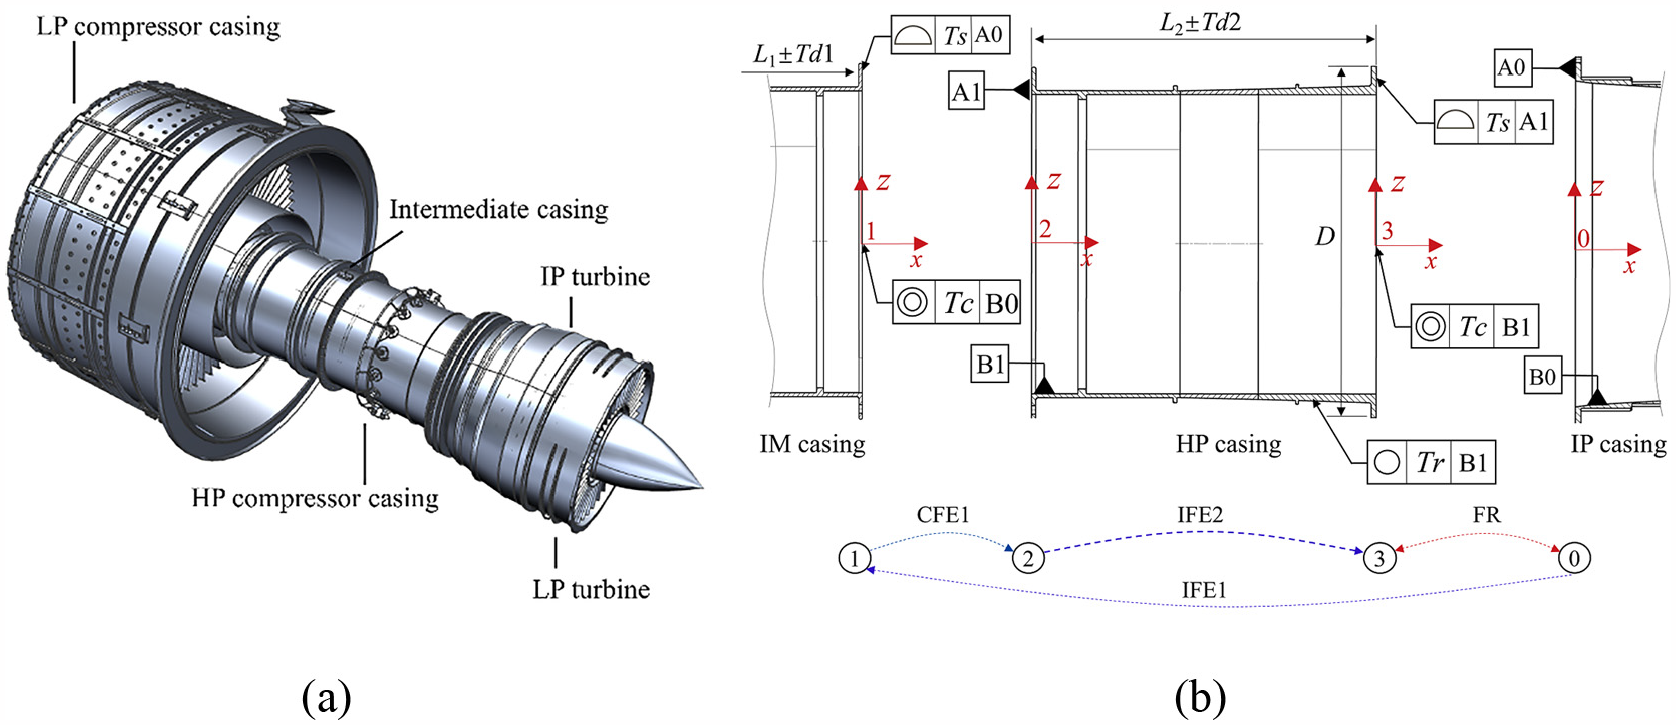
Aero-engine casing with assembly specification: (a) multistage aero-engine casing and (b) tolerance requirement and assembly chain.
To obtain the target deviation
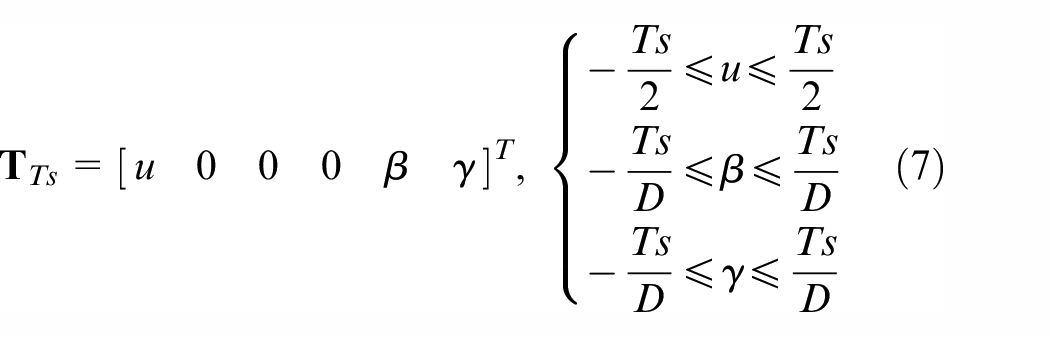

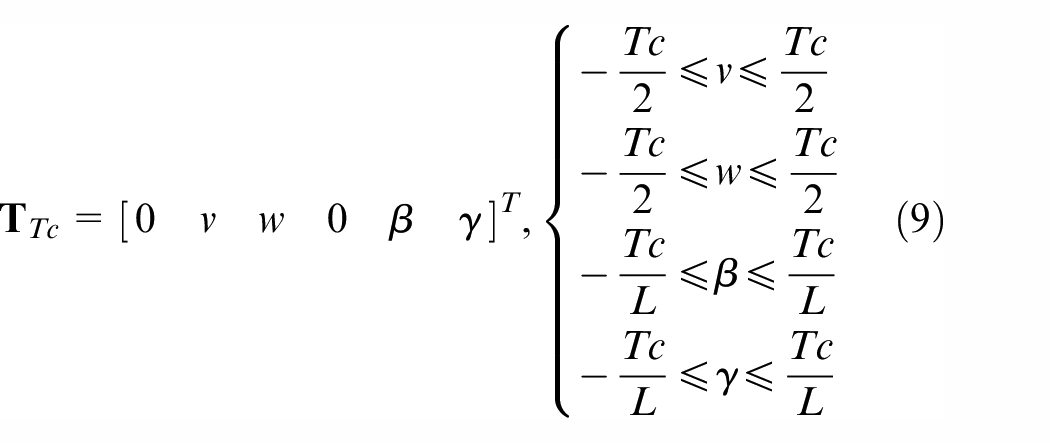
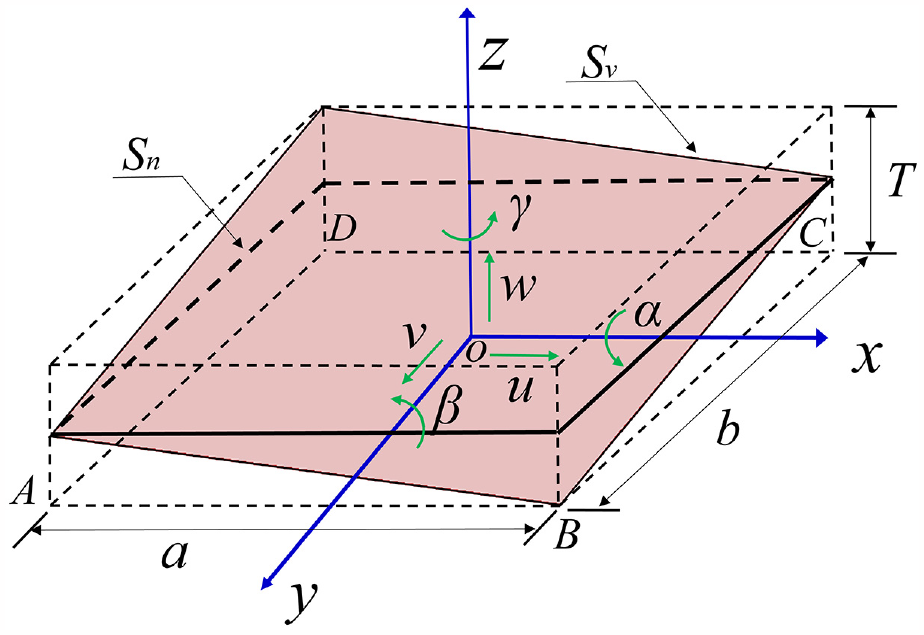
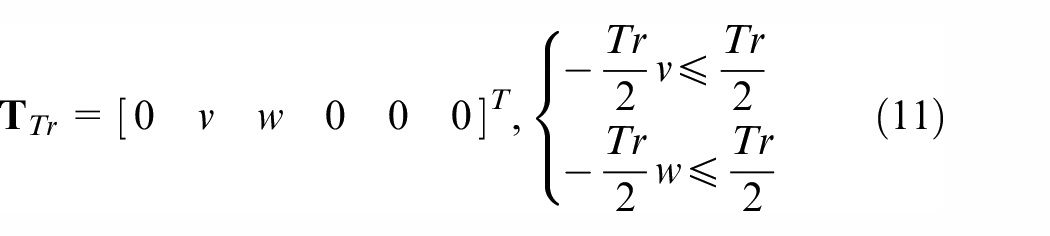
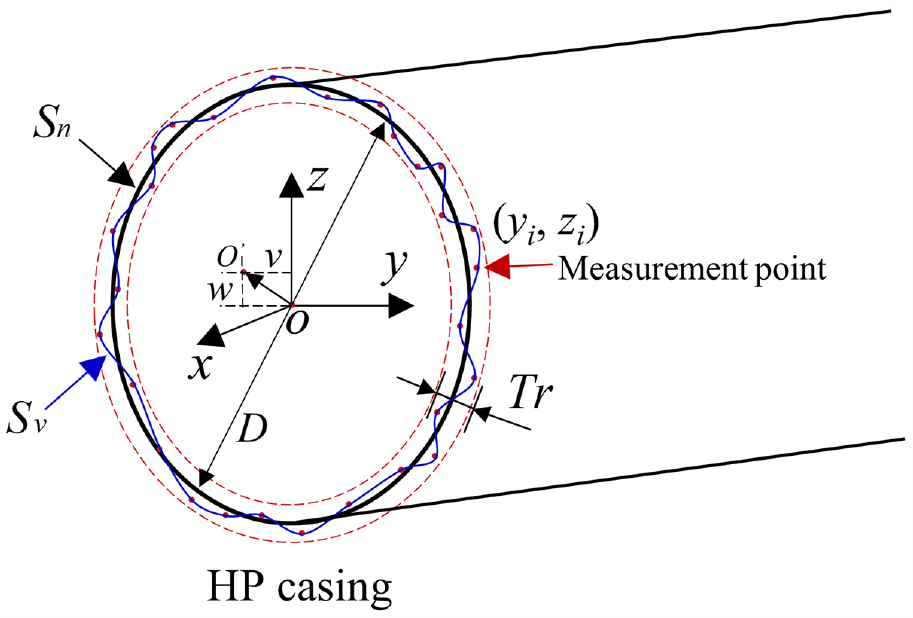
Noting that the top end of HP casing may be not circular and the profile varies with respect to the nominal position along the circumferential direction. As shown in Figure 4, the actual engineering surface is wavelike after machining process, which causes the positional deviation of the nominal center point O. In order to obtain a good geometrical precision, the profile deviation of the top end of HP casing is usually restricted with roundness tolerance specification Tr. The positional deviation of the center point is defined as the v and w torsors along y and z direction respectively. The corresponding v and w can be derived through statistical method as:
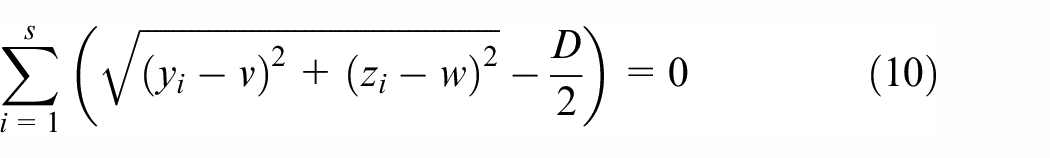
where i denotes the ith measurement point, s is the total number of sample points, yi and zi are the coordinates of the measurement point. Considering the extremum condition of v and w, the corresponding Torsor model of Tr is expressed as
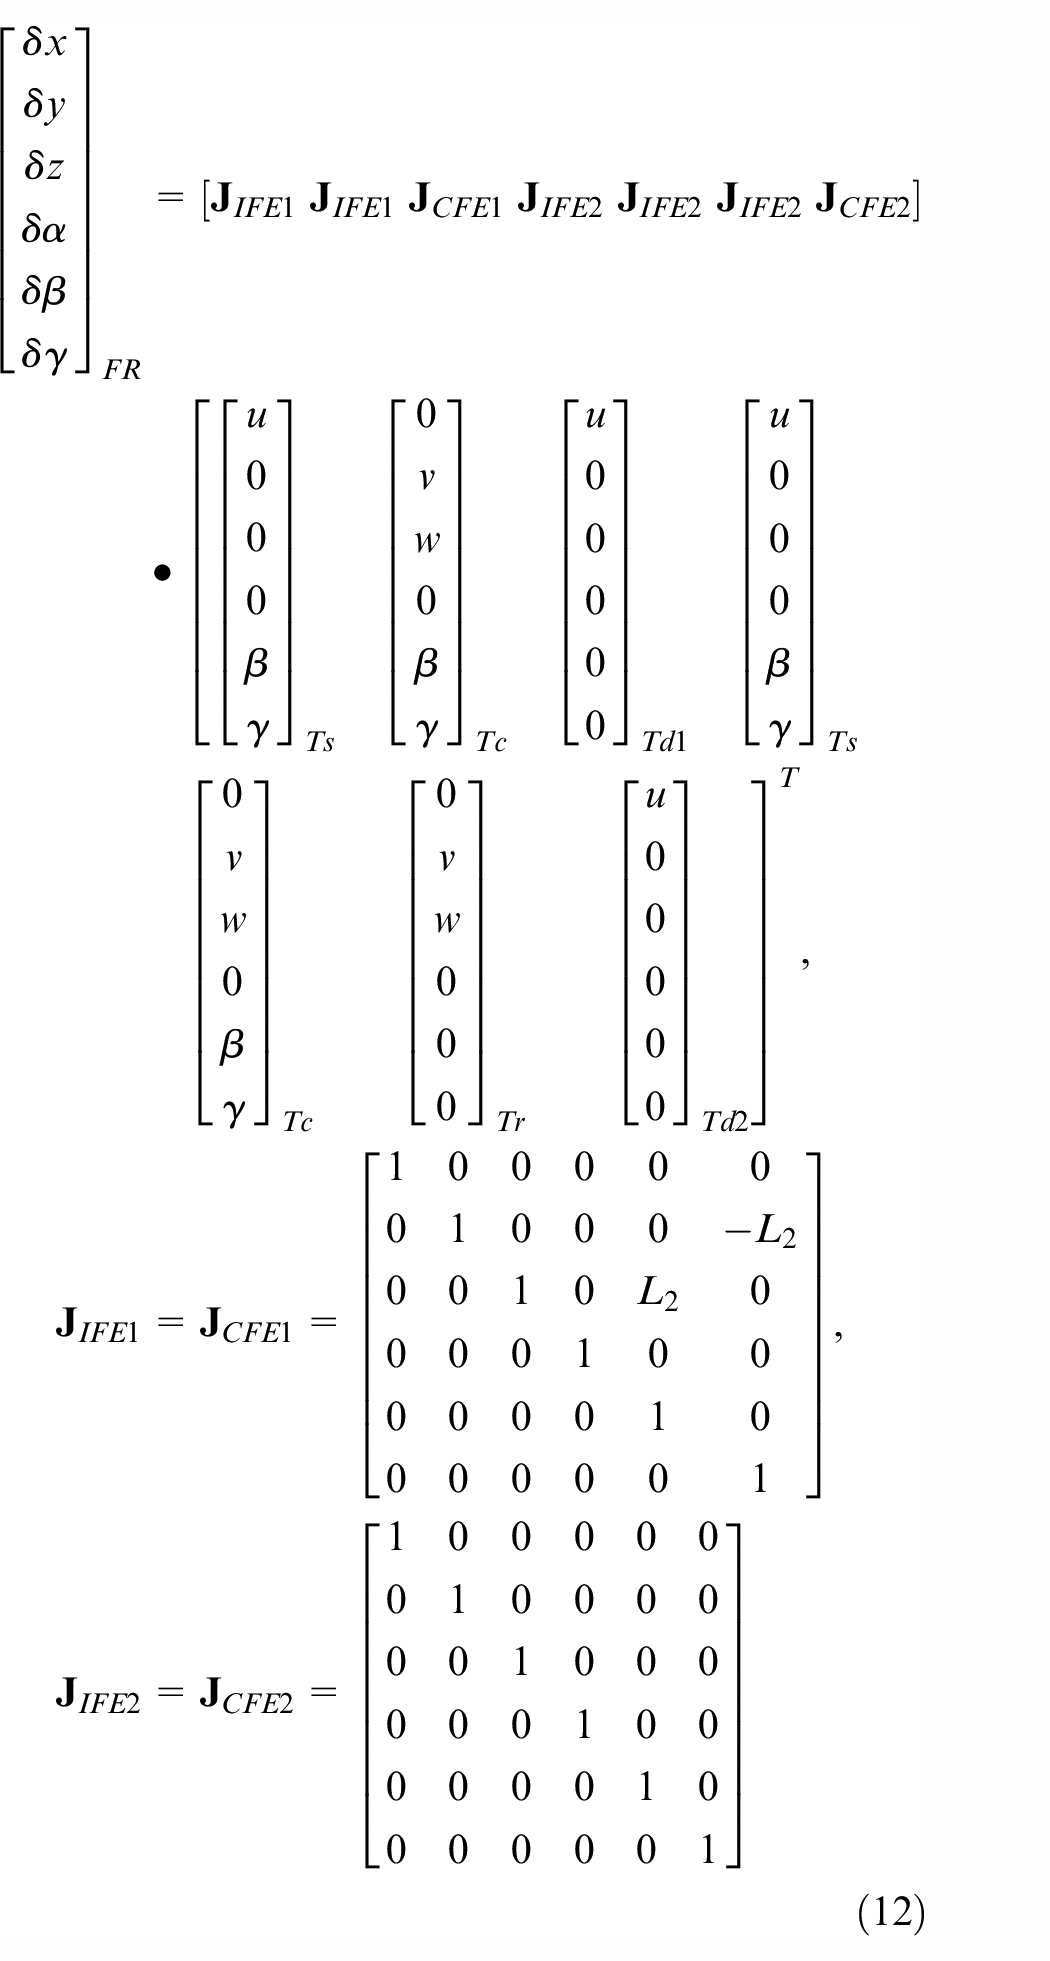
Then, by substituting equations (7–9) and (11) into equation (1), the Jacobian-Torsor model can be formulated as follows:
Profile deviation of the HP casing with roundness tolerance Tr.
Based on the Jacobian-Torsor model, the 3-D assembly deviation
To validate the presented 3-D assembly tolerance model, the theoretical statistical distribution of the target deviation
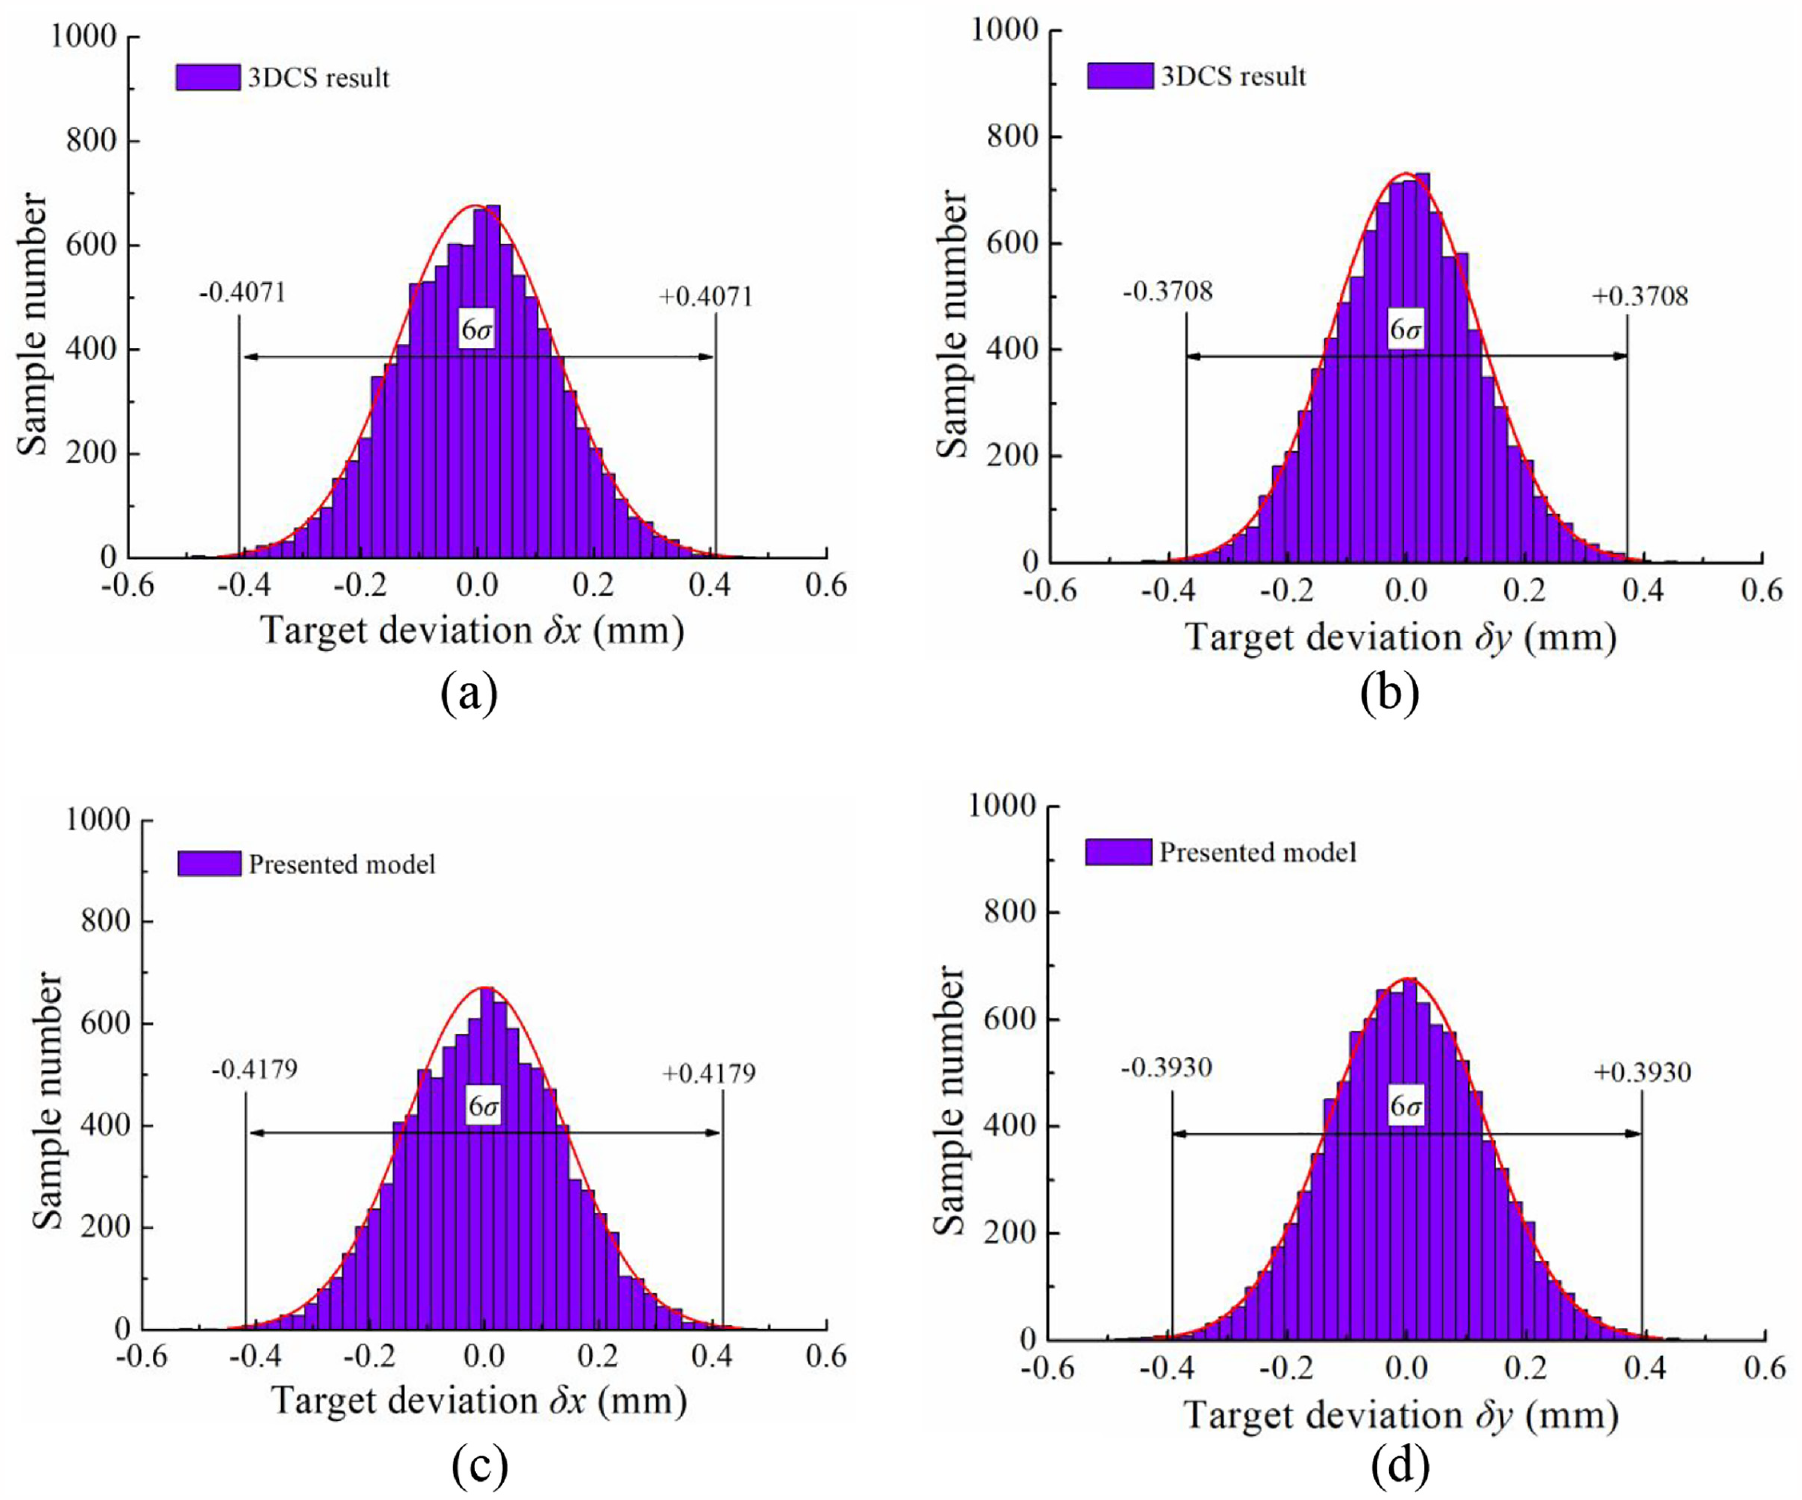
Statistical distribution of target deviation: (a) δx from 3DCS model, (b) δy from 3DCS model, (c) δx from presented model, and (d) δy from presented model.
Mapping relationship between tolerance and free vibration
The initial flexible assembly deviation
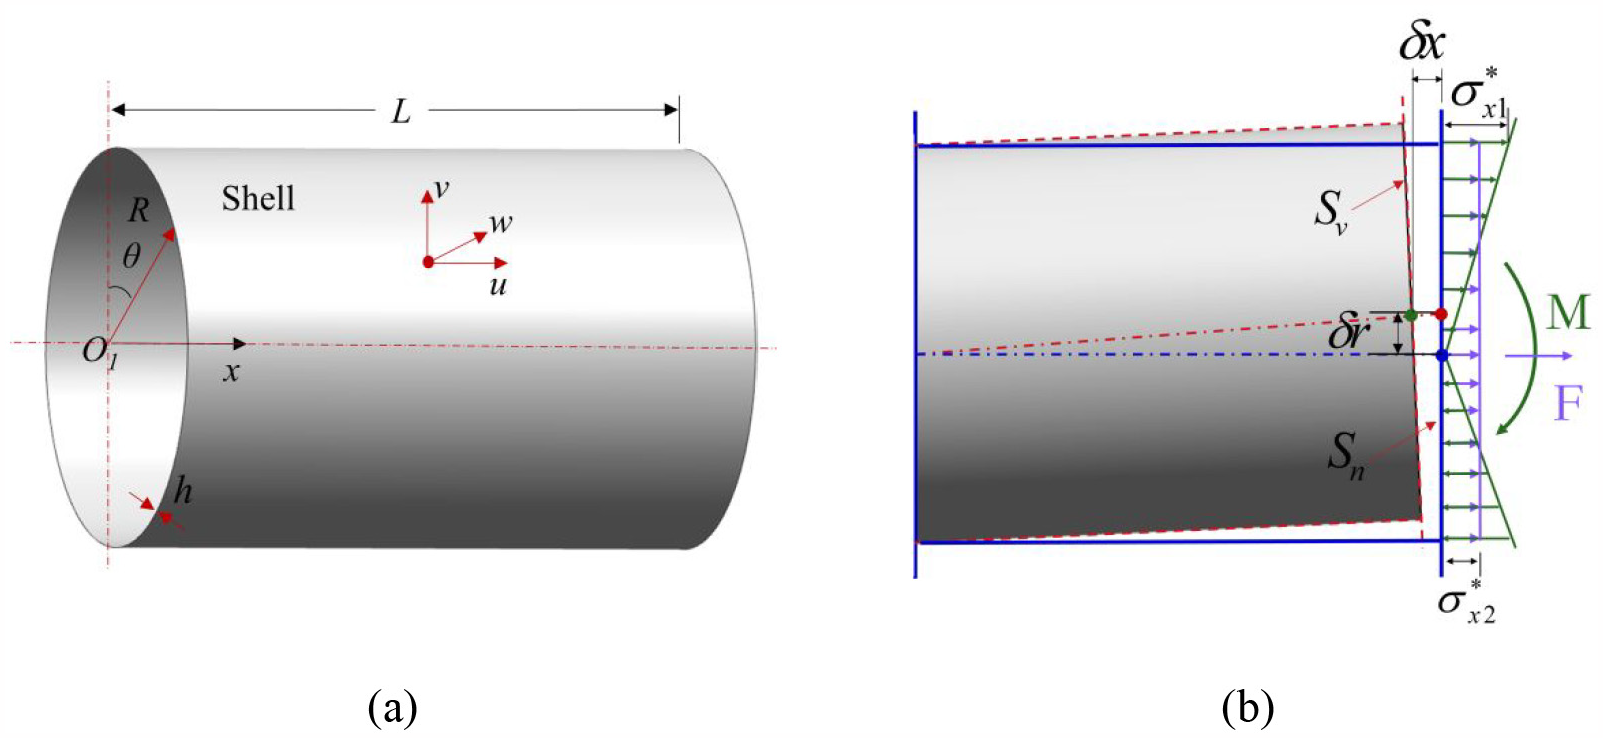
Schematic diagram of casing with different initial flexible assembly: (a) circular cylindrical shell and (b) initial stress distribution for 3D flexible deviation.
Considering that the initial flexible assembly deviation
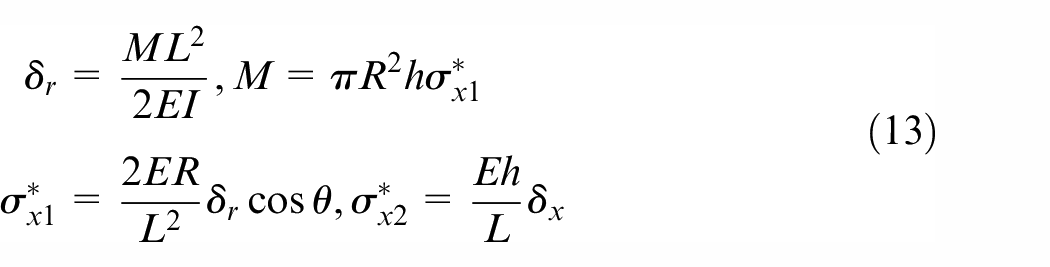
where E is the Young’s modulus, I is the section moment of inertia, L is the length of HP casing, h is the thickness, and R is the radius.
In this paper, the classical shell theory25–28 is applied to establish strain-displacement relation. The strain energy of the casing can be expressed as follows:
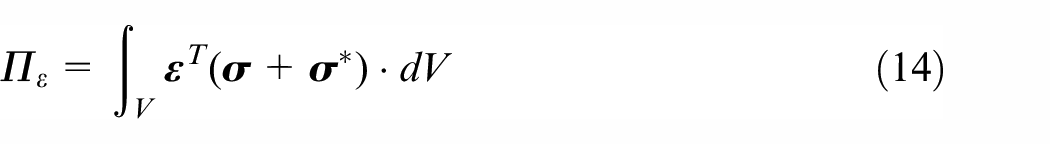
where ε and
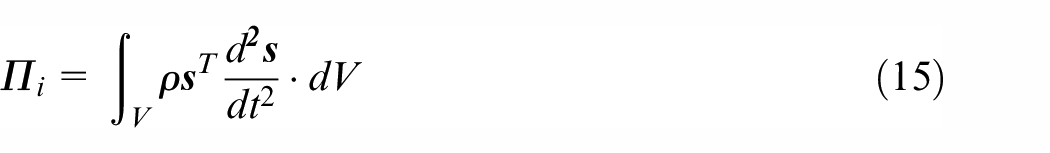
where ρ denotes the density,
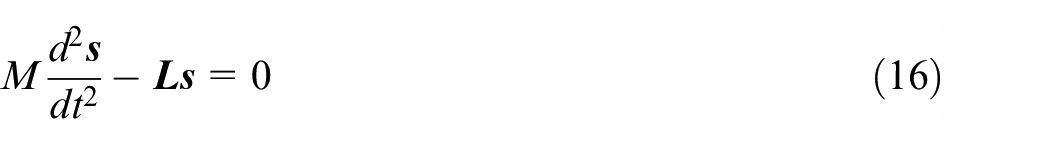
Where M = ρh is the mass factor,
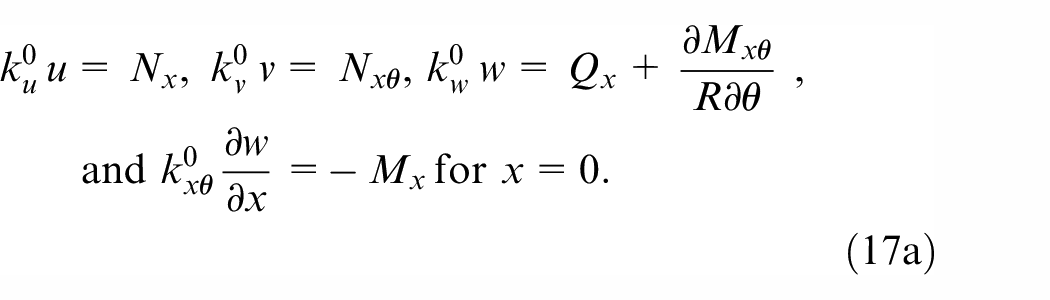
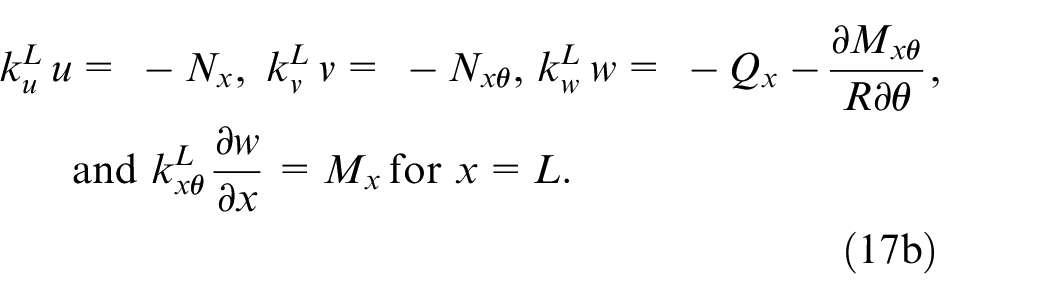
where ku, kv, kw, and kxθ are the connection stiffness, Nx, Nθ, and Nxθ denote the stress resultants, and Mx, Mθ, and Mxθ denote the moment resultants, which are expressed in Appendix A.
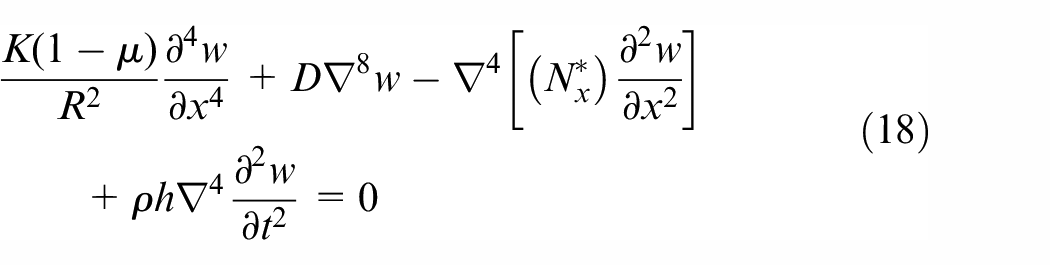
The vibration response of thin-walled cylindrical shell is mainly about the radial displacement w, and axial displacement u and circumferential displacement v have little effect on w.32–34 Thus, all inertia terms in u and v are ignored and the governing equation is simplified as:
To satisfy any vibratory mode and boundary constraint, the displacement component w can be expressed by a series of harmonic functions as 35 :
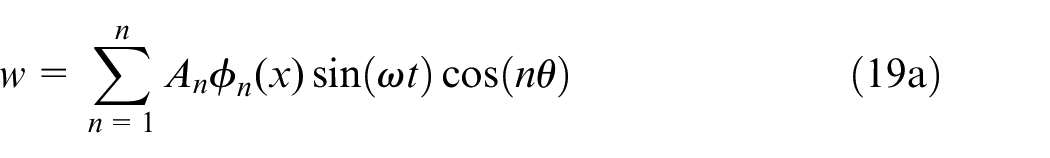
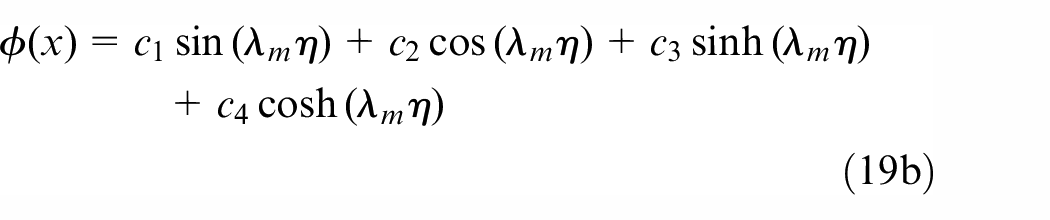
where n is the circumferential wave number, m is axial half wave number, ω is the angular frequency of the casing, t is the time variable, An is the unknown constant coefficient to be determined, φn(x) is the axial beam function to approximate the vibration modes of the casing.36–38η = x/l denotes the nondimensional axial coordinate. Coefficient c1, c2, c3, c4, and λm can be obtained by substituting equation (19) into equation (17) to satisfy the elastic boundary condition. Then, the governing equation (18) can be written as
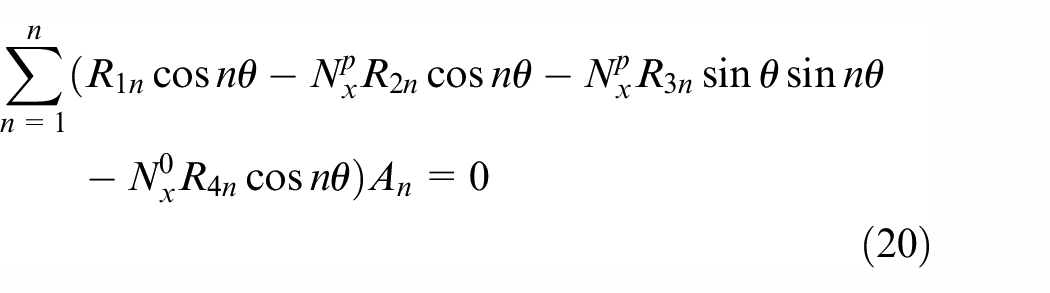
where
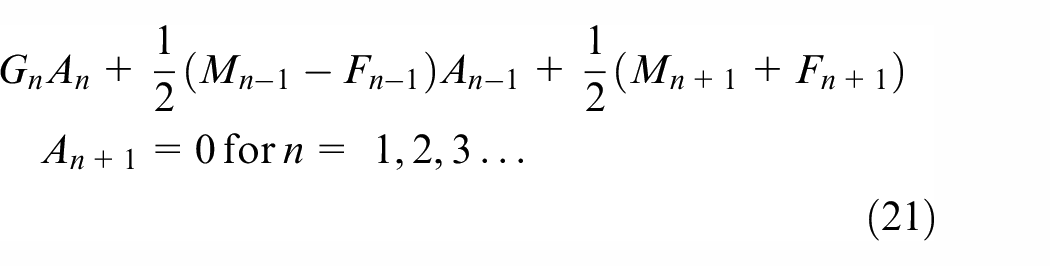
where G, M, and F are listed in Appendix A. To obtain the natural frequency, the determinant of the characteristic matrix with respect to coefficient A is set equal to zero. Based on the presented theoretical model, the effect of 3-D assembly on the dynamic characteristic can be revealed. To validate the presented theoretical model, the natural frequency of the casing is compared with the experiment result, 39 as listed in Table 1.
The natural frequencies obtained by the presented model and experiment. 39
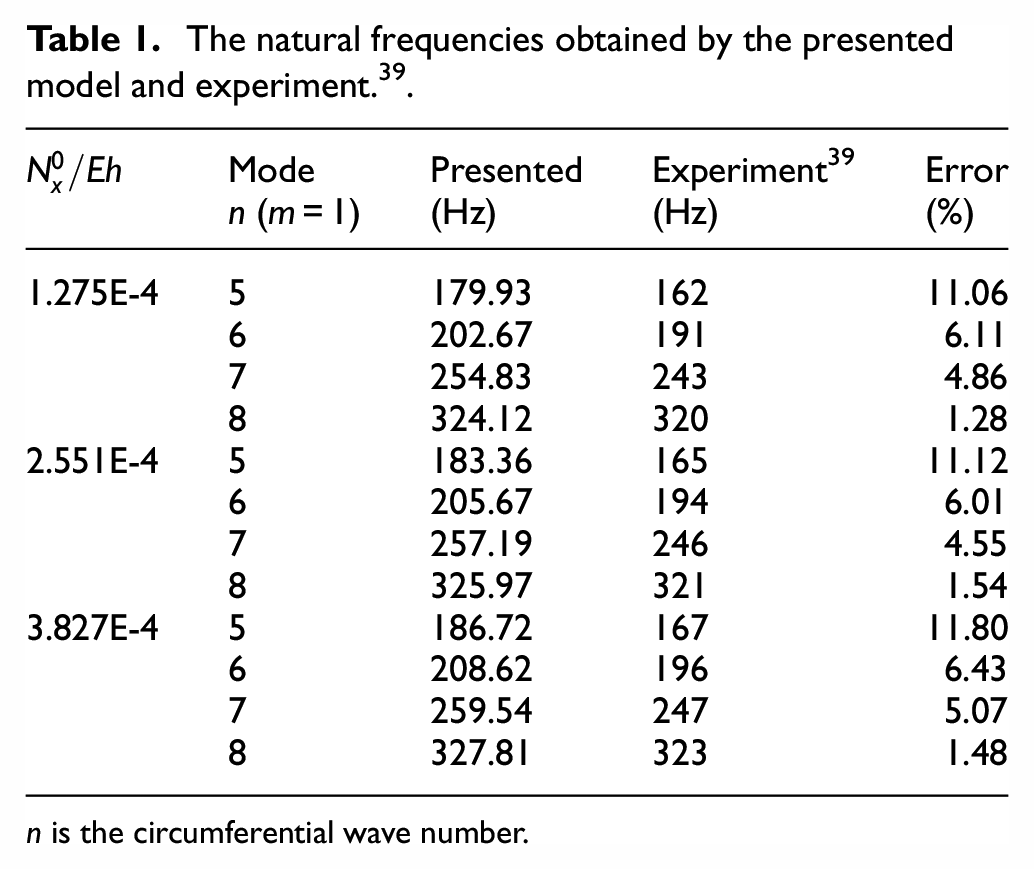
n is the circumferential wave number.
It can be found that the error of natural frequencies decreases as n increases. It means that the presented model has a good reliability, especially for the vibration mode with large circumferential wave number. As a consequence, the model can be applied to probe into the vibration response of the casing with initial assembly deviation. Furthermore, based on the effect of assembly deviation on the dynamic characteristic, the mapping relationship between assembly tolerance and fluctuation of vibration performance can be constructed. Considering that traditional tolerance design has no concern with the dynamic characteristic and it is just about the manufacturing ability and precision, the presented method herein is novel and can improve the tolerance design ability from the view of performance evaluation.
Fluctuation of vibration characteristics with 3-D assembly deviation
Axial assembly deviation
Aero-engine casing is manufactured and assembled with various tolerance requirements due to the precision limitation and accidental error. With assembly deviation propagation and accumulation, the initial assembly stress is introduced in the structure. In order to study the effect of 3D assembly deviation on the dynamic characteristic, the following physical and geometric parameters are applied: ρ = 7850 kg/m3, E=200GPa, μ=0.3, R=0.35m, h = 4 mm, L = 0.96 m. The connection stiffness of elastic boundary can be derived from Williams et al. 40 and is set equal to 1 × 10¹⁰ N/m herein. The axial assembly deviation δx in the 3D tolerance model is related to the matching condition. For δx > 0, the casing assembly is the clearance fit, and the body of the casing is tensed by the matching parts. For δx < 0, the multistage casing assembly is the interference fit, and the body of the casing is compressed. With different assembly deviations, the dynamic characteristic of the casing has the various fluctuation with respect to the nominal value.
To show the effect of assembly deviation on the dynamic characteristic, the variable Ω is applied to indicate the natural frequency of the casing with initial assembly deviation, while the variable Ω0 is the natural frequency of the casing with no assembly deviation. ΔΩ is defined as the frequency fluctuation between Ω and Ω0. Accordingly, the frequency fluctuation ratio can be obtained by calculating the ratio of ΔΩ to Ω0. Figure 7 illustrates the fluctuation ratios ΔΩ/Ω0 of the natural frequency with different axial deviation δx. It is clear that the natural frequency is sensitive to the axial deviation and increases gradually as δx varies from negative to positive. The vibration mode with lower original frequency Ω0 seems to be easily affected by the axial deviation since its fluctuation ratio is larger than other vibratory modes. For example, the original frequency Ω0 of the vibration mode (m = 1, n = 5) has the lowest value, while its frequency ratio changes more sharply than others, as shown in Figure 7(a). The similar tendency can be found in other vibration modes with different axial half wave number m. Furthermore, the comparison of frequency fluctuation with different m is conducted, as depicted in Figure 8. For the vibration modes with low Ω0 (i.e. n = 5, 6, 7, and 8), most of the fluctuation ratios increase as m varies from 1 to 6, which indicates that the vibratory mode with larger axial wave number m is more sensitive to the axial deviation.
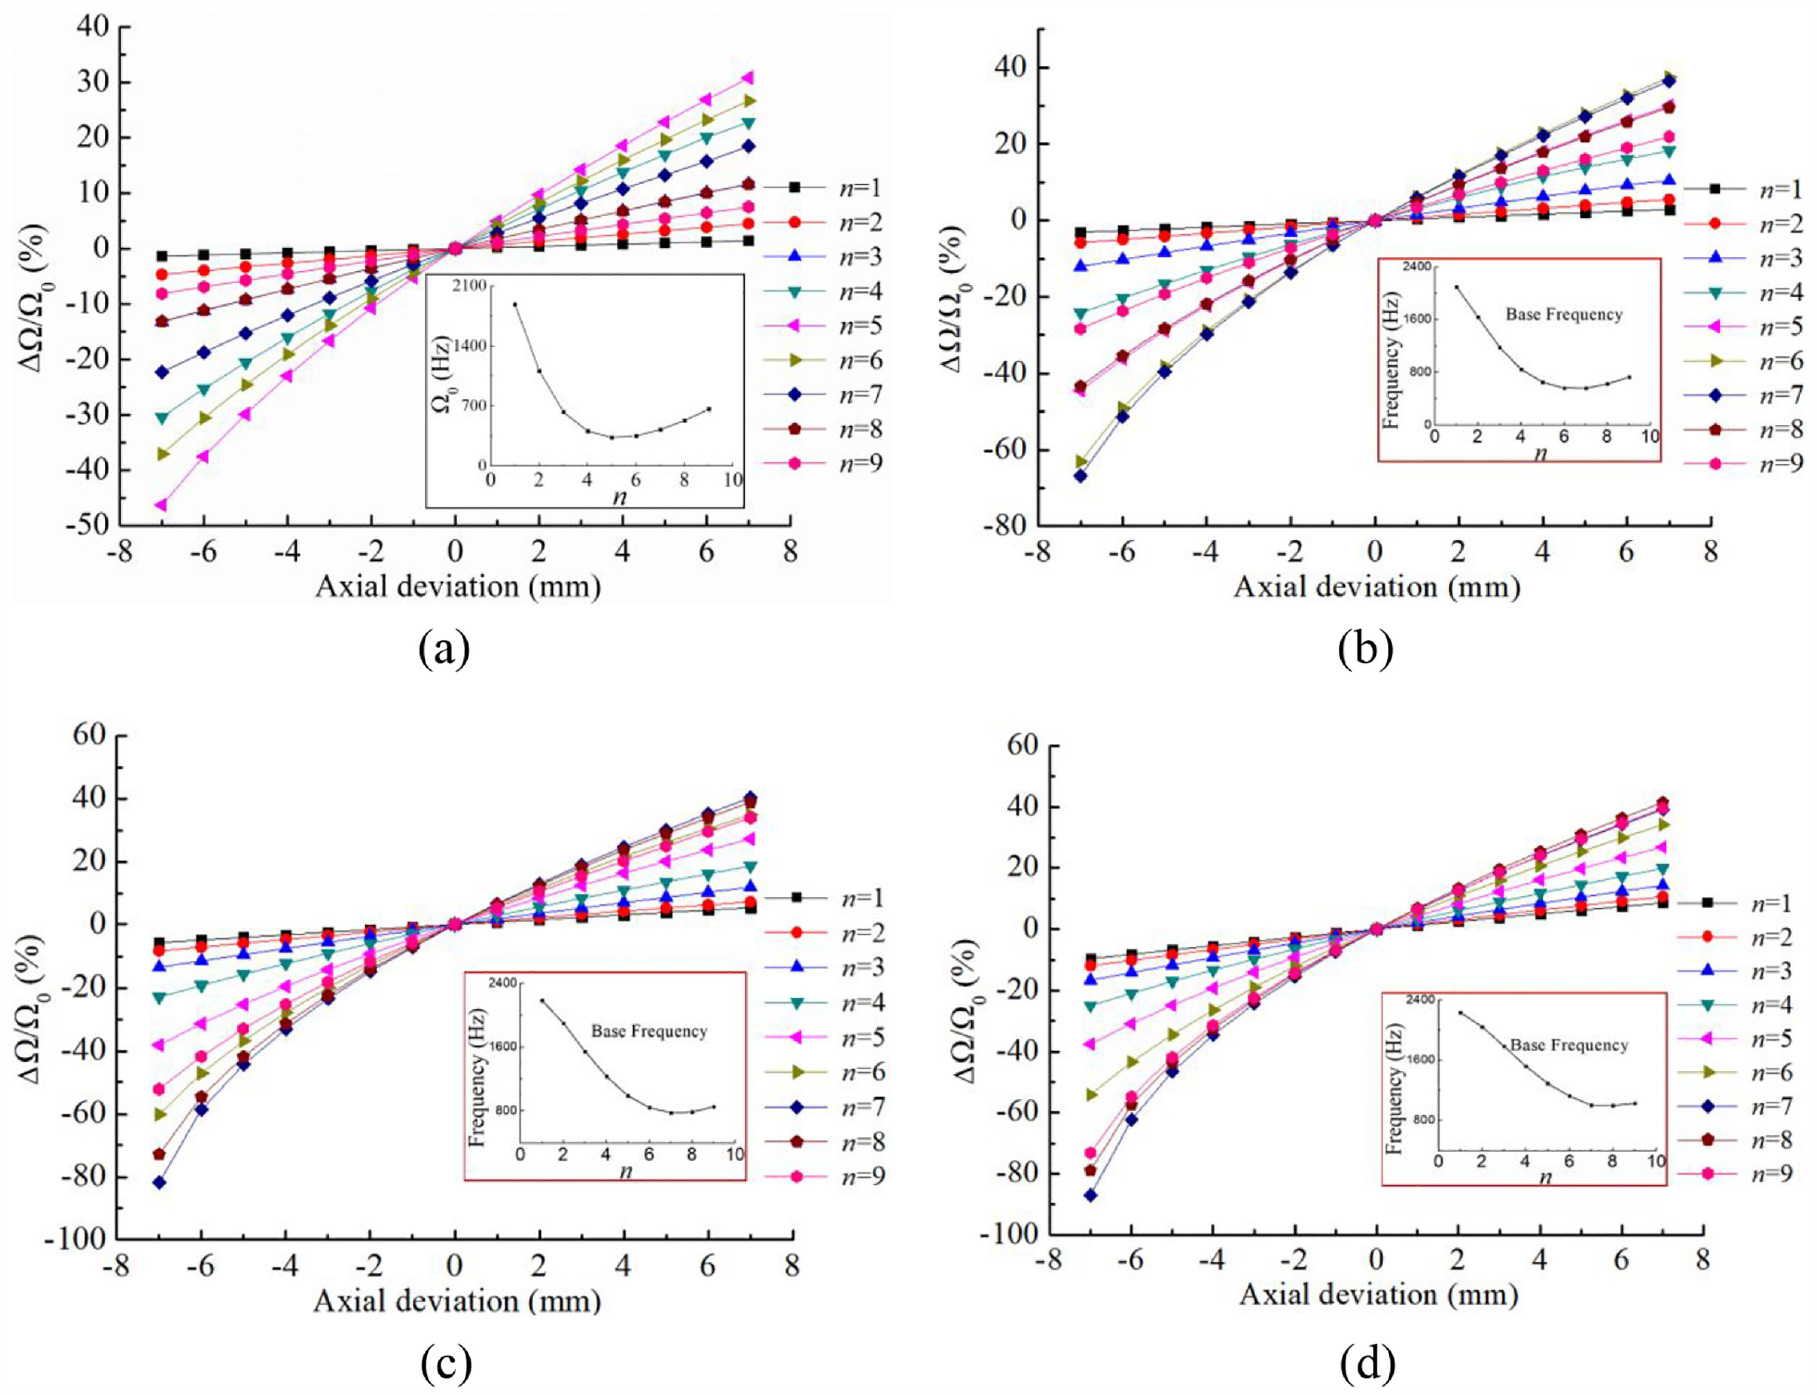
Frequency fluctuation of the casing with different axial assembly deviation δx: (a) m = 1, (b) m = 2, (c) m = 3, and (d) m = 4.
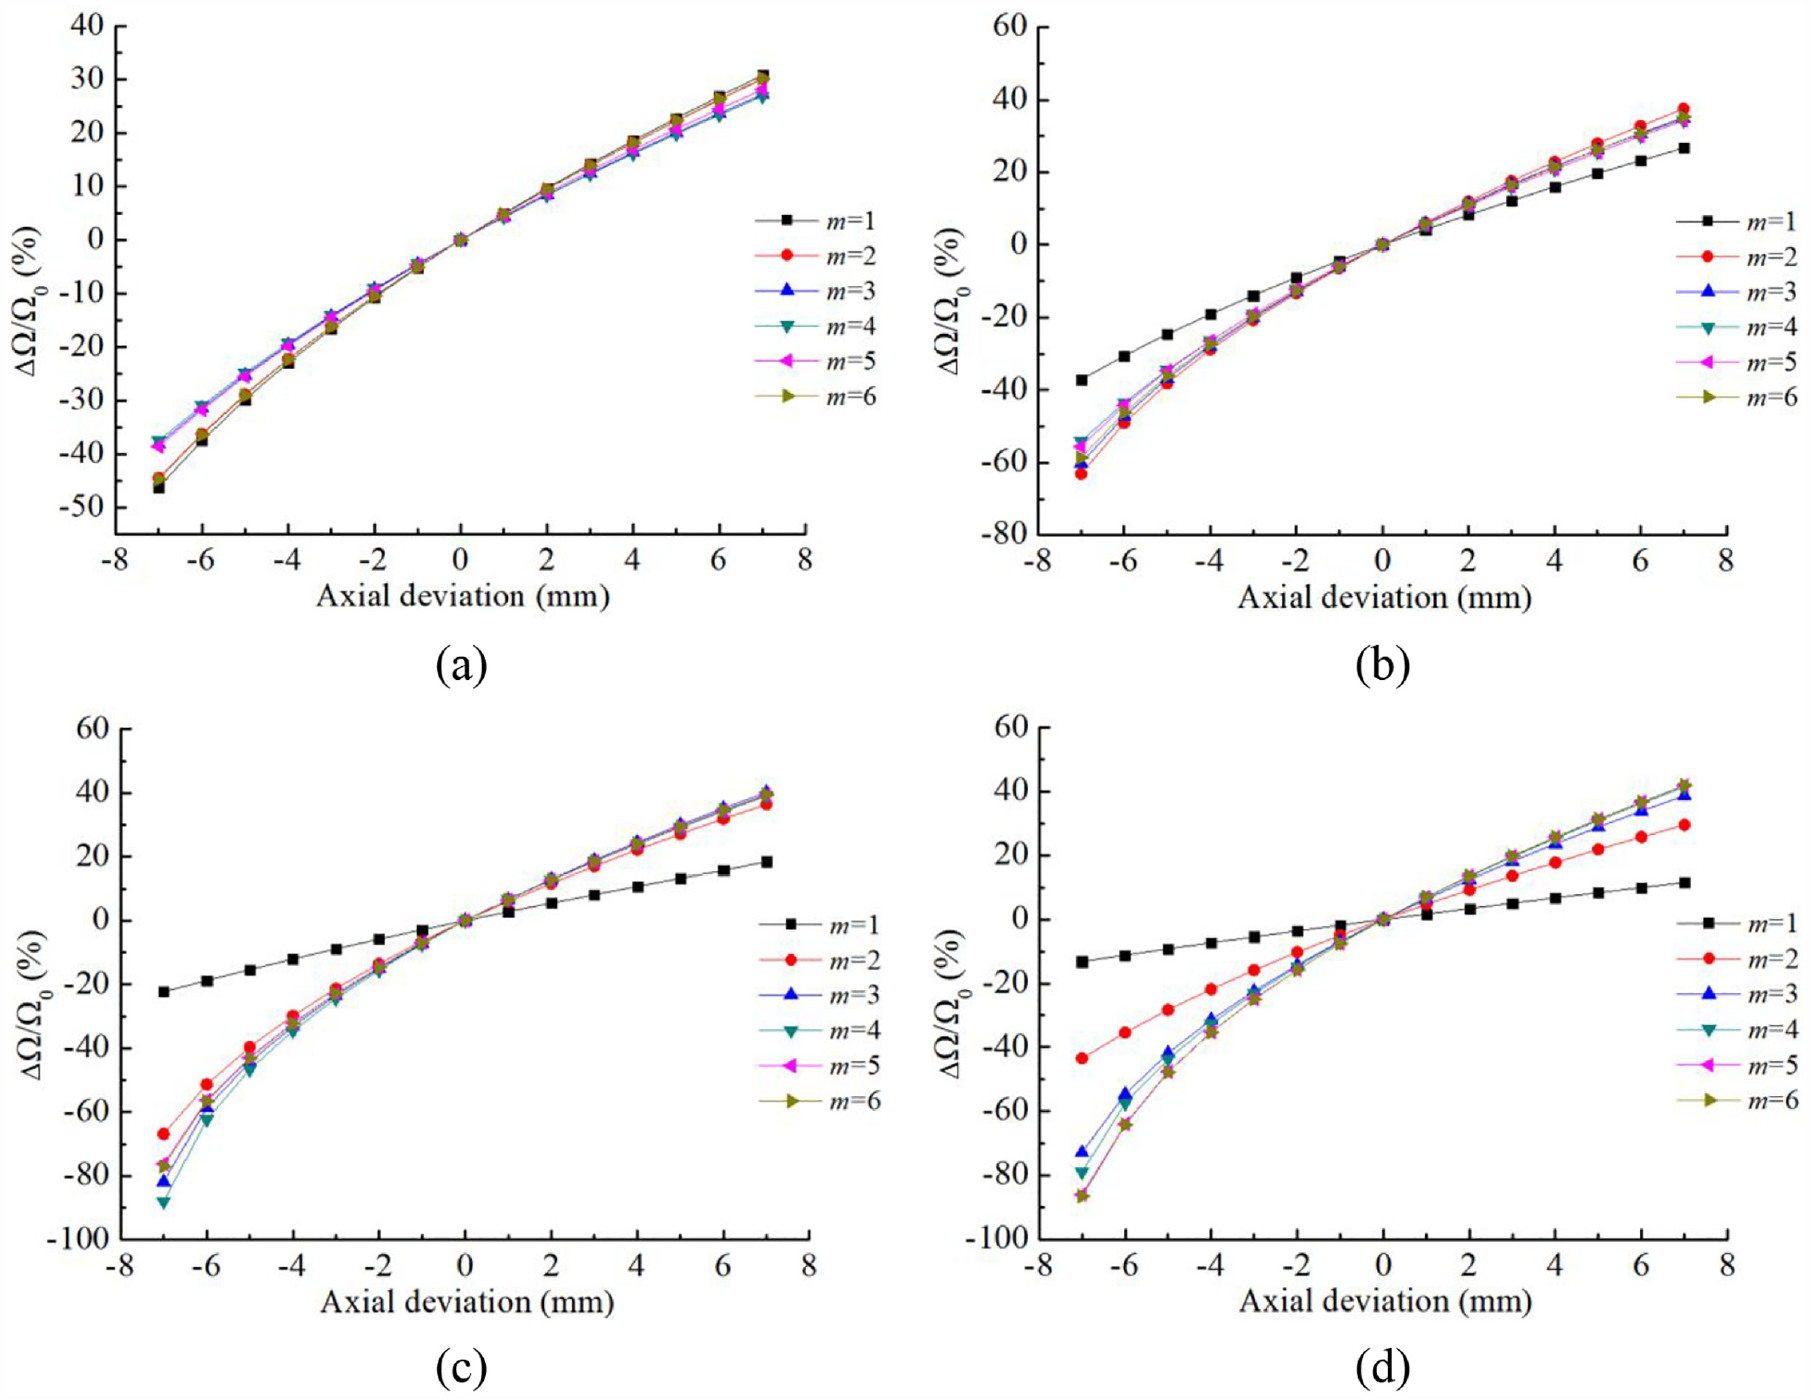
Comparison of fluctuation ratio under different m as axial deviation δx increases: (a) n = 5, (b) n = 6, (c) n = 7, and (d) n = 8.
In this section, the fluctuation ratios of the natural frequency with different axial assembly deviation are presented. The results show that the axial deviation δx is positively related to the natural frequency and has a great influence on the dynamic characteristic stability, especially for some vibratory modes with low original frequency and large axial half wave number m. Therefore, it is necessary to consider the dynamic characteristic instability caused by axial assembly deviation when analyzing and allocating assembly tolerance in the design phase of the casing.
Radial assembly deviation
Through 3-D tolerance model, the assembly deviations in corresponding specified tolerance zone are propagated and accumulated, contributing to the target deviations δr in
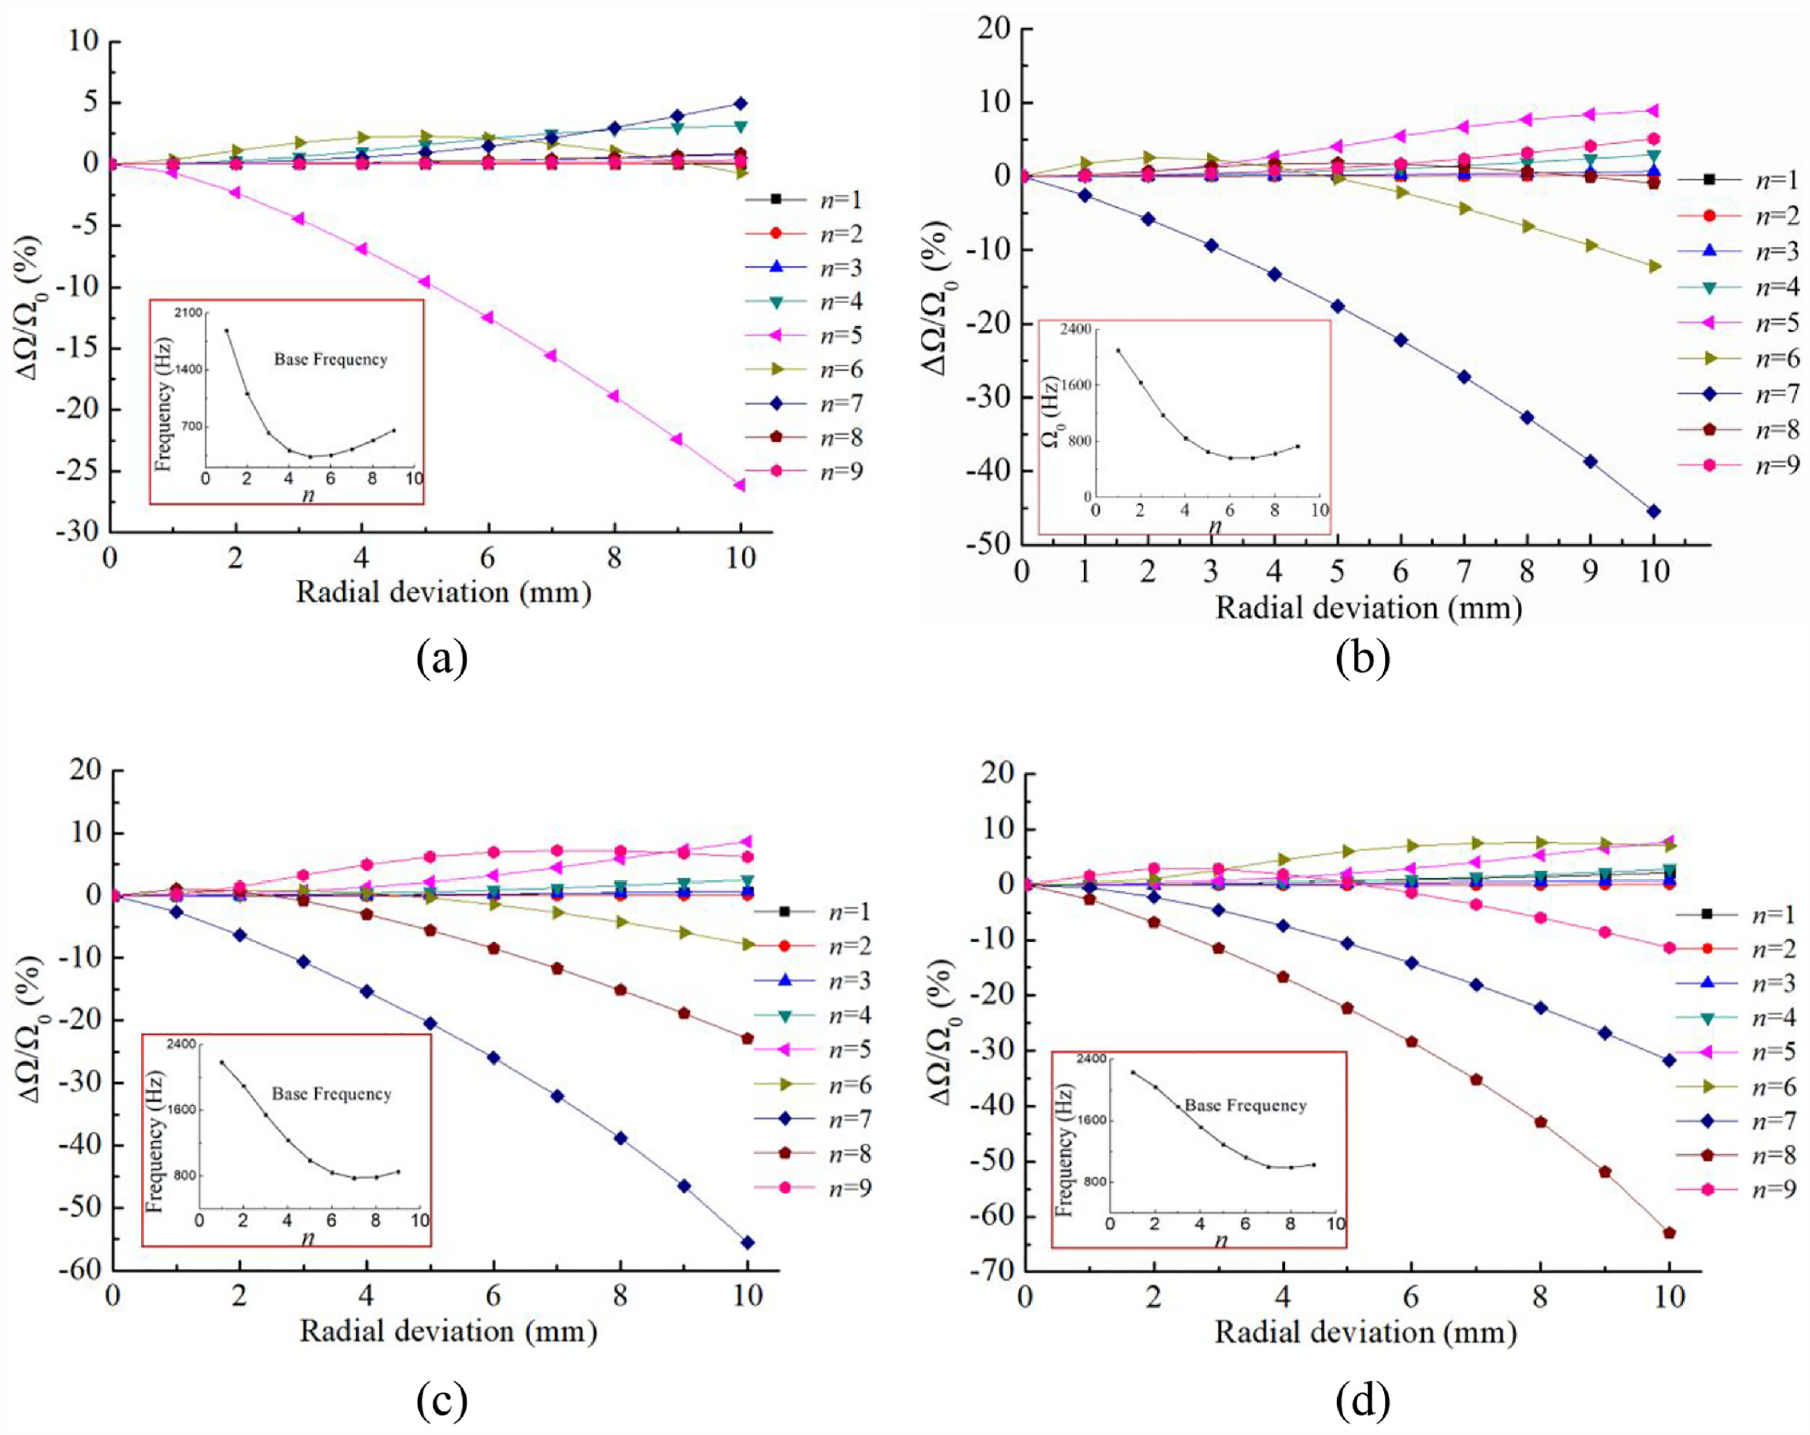
Frequency fluctuation of the casing with different radial assembly deviation δr: (a) m = 1, (b) m = 2, (c) m = 3, and (d) m = 4.
Figure 10 illustrates the comparison of frequency fluctuation with different m. For the vibration modes with n = 5, the fluctuation ratio of natural frequency has an uptrend as m increases, except for the vibration mode m = 1. For n = 6, the ratio first increases and then decreases as δr varies from 0 to 10 mm, and it has the biggest amplitude for m = 2. For n = 7 and 8, most of the fluctuation ratios show a monotonic downtrend as δr increases. Due to the various sensitivity of different vibration modes to the radial deviation δr, it is necessary to restrict the frequency fluctuation by allocating assembly tolerance with an acceptable value. In the design phase, tolerance analysis should be implemented under the constraint of specified dynamic characteristic fluctuation.
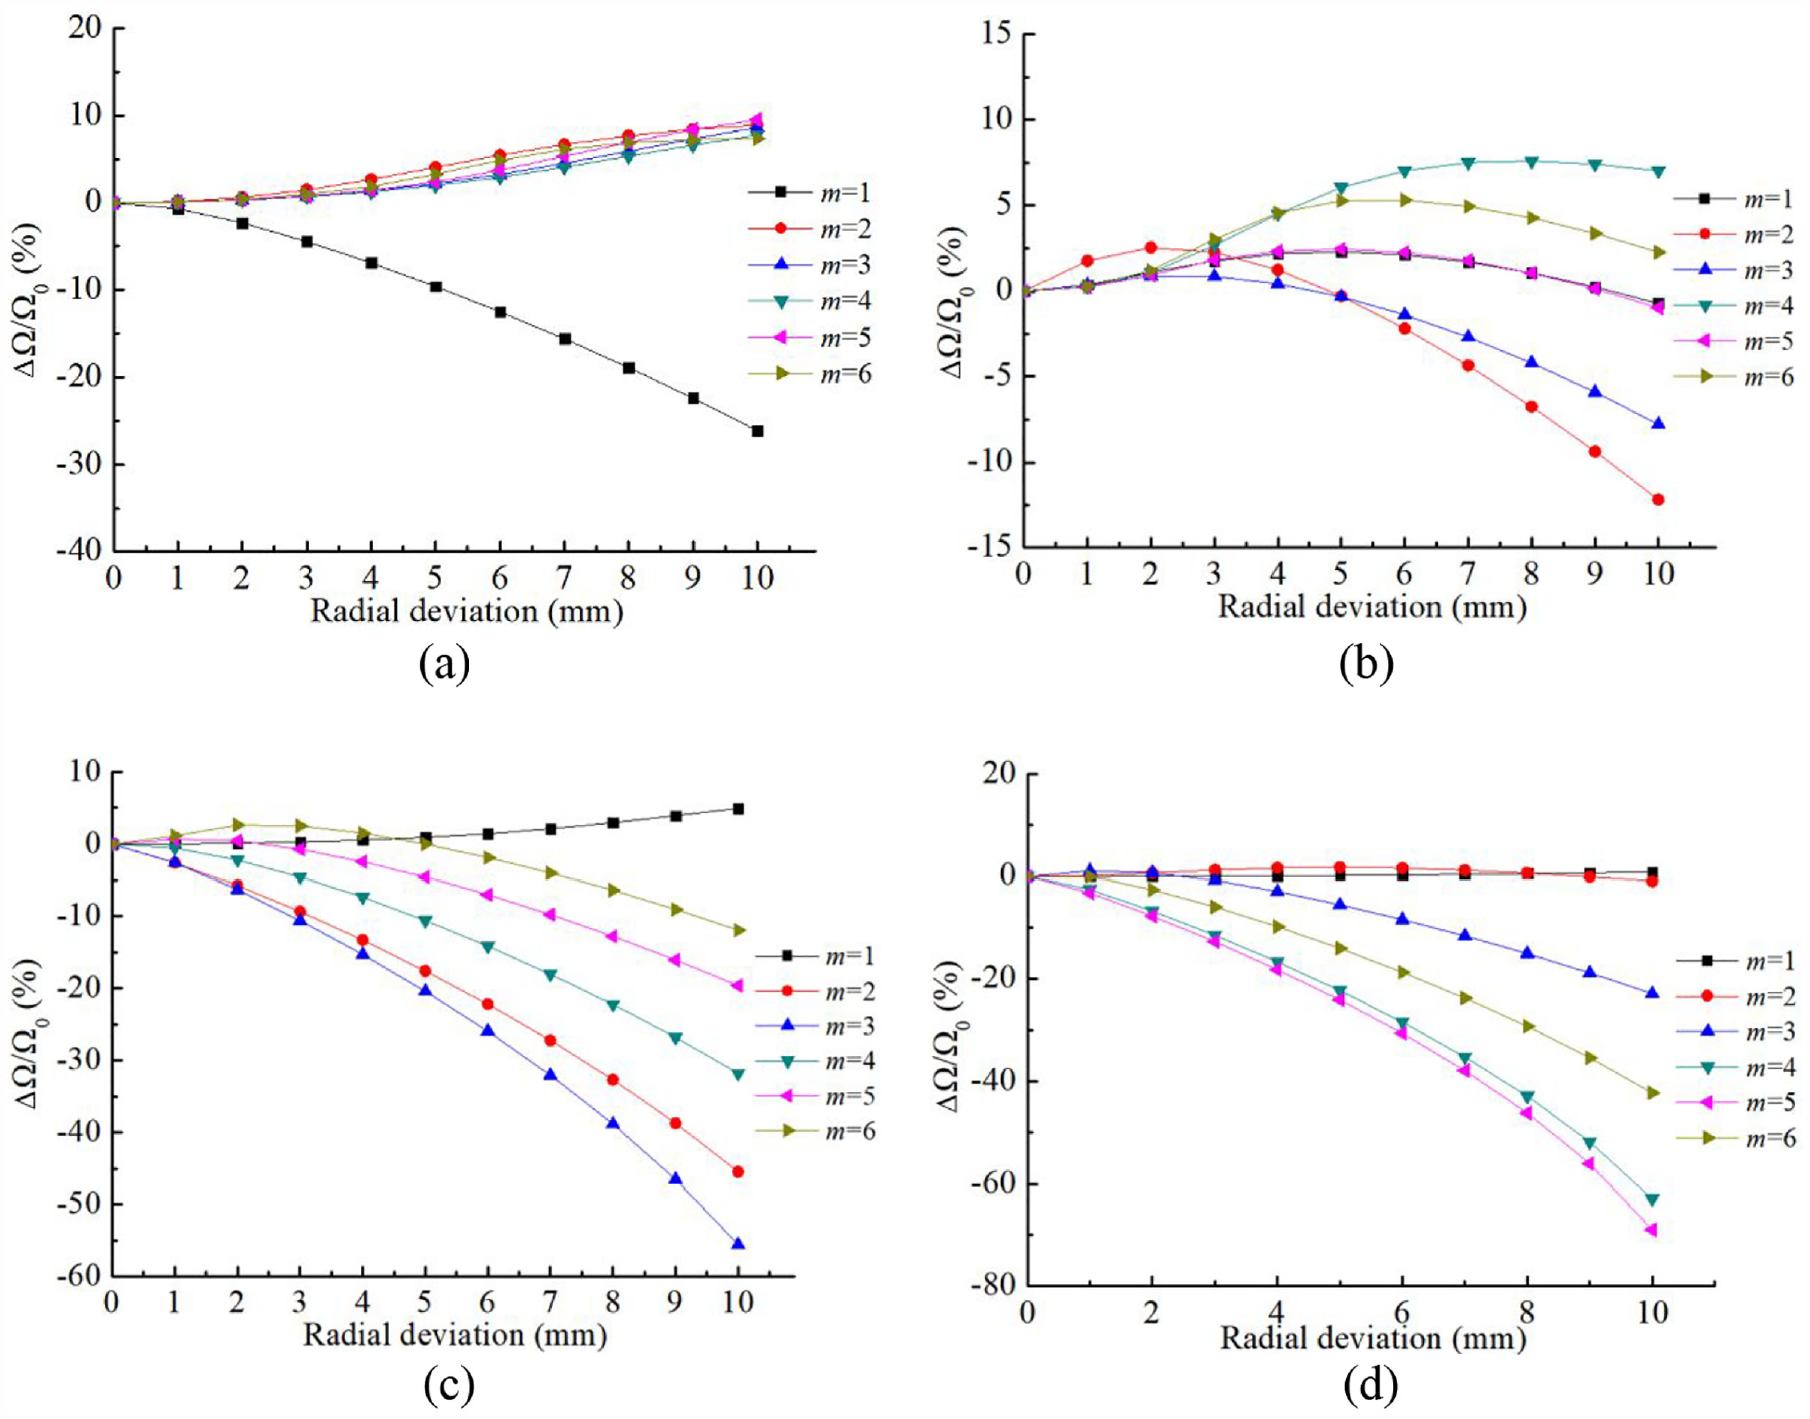
Comparison of fluctuation ratio under different m as radial deviation δr increases: (a) n = 5, (b) n = 6, (c) n = 7, and(d) n = 8.
Tolerance design under specified performance requirement
Statistical distribution of target deviation and natural frequency
All the assembly deviations are propagated and accumulated among the functional elements of the casing. The profile deviation, positional deviation and coaxiality deviation involved in the 3D tolerance model are restricted in the specified tolerance zone. The original tolerance zones of different functional elements are listed as follows: profile tolerance Ts = 0.20 mm, dimensional tolerance Td1 = 0.25 mm, Td2 = 0.3 mm, coaxiality tolerance Tc = 0.20 mm, and roundness tolerance Tr = 0.15 mm. In the engineering, the tolerance allocation is usually related to the material conditions, such as the maximum material condition (MMC) and the regardless of feature size condition (RFS). With different material conditions, the actual geometrical and positional tolerance zone might be affected by the dimensional tolerance. For example, the flange surfaces of IM casing and HP casing have the dimension tolerance Td and profile tolerance Ts. Under the maximum material condition (MMC), the profile deviation of the flange surface is determined by the actual dimension, and meanwhile it is also restrained by the initial tolerance requirement. However, under the regardless of feature size condition (RFS), the geometrical and positional tolerances are independent of the dimensional tolerance. To better understand the coupling effect between dimension tolerance Td and profile tolerance Ts, the relationships between them under different material conditions are illustrated as in Figure 11.
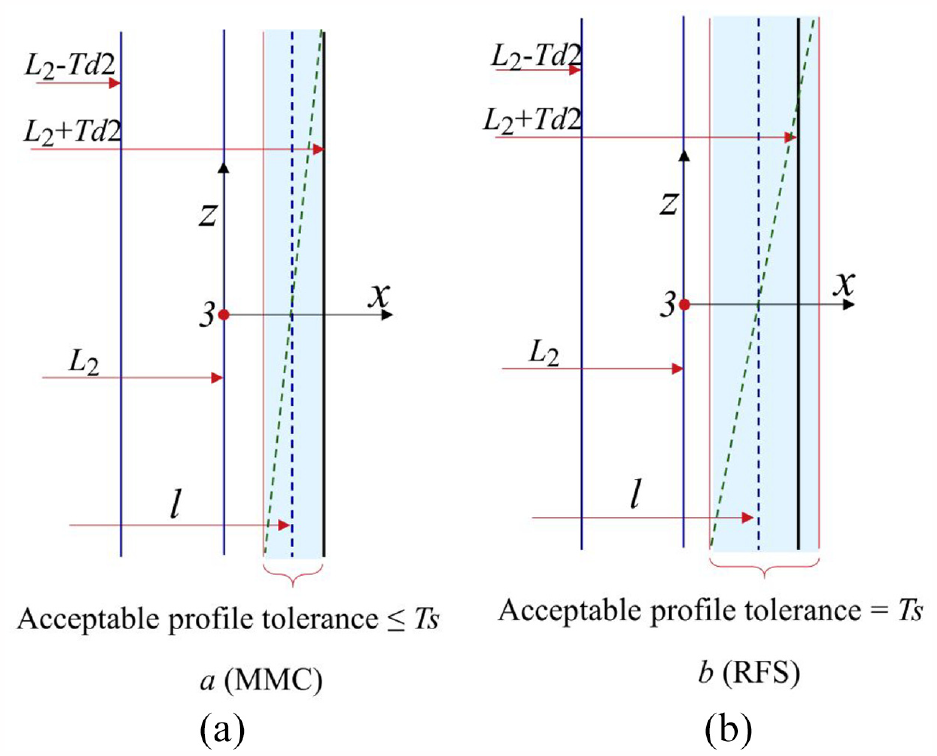
Relationship between dimensional tolerance and profile tolerance under different material conditions: (a) maximum material condition (MMC) and (b) regardless of feature size (RFS).
L 2 is the nominal length of HP casing, Td2 is the dimensional upper limit, and l is the actual dimension. It is clear that the flange surface reaches the maximum material size when the actual dimension l = L2 + Td2. Under the maximum material condition (MMC), the profile deviation is allowed to vary in the blank zone between the actual dimension l and the maximum L2 + Td2. The acceptable profile tolerance is equal to the shadow region, as shown in Figure 11(a). It is worth noting that the acceptable profile tolerance of the flange surface is not allowed to exceed the design value Ts. Considering that the actual profile tolerance is directly related to the dimension deviation of the flange surface, the maximum material condition (MMC) will influence the angular and translational torsors of Ts and thus the final target assembly deviation. For the regardless of feature size condition (RFS), it can be seen from Figure 11(b) that the profile tolerance is a constant Ts and independent as the actual dimension l varies from L2−Td2 to L2+Td2.
To show the effects of MMC and RFS on the assembly quality of the aero-engine casing, the comparison of target deviation under different material conditions is conducted. In this paper, the dimensional and geometrical deviations are random and assumed to follow Gaussian distribution. 22 Based on the established 3-D assembly tolerance model, the statistical features of target deviation with MMC and RFS are obtained. As shown in Table 2, the stand deviation σ and statistical distribution range [−3σ, +3σ] for the target deviations δx and δy with MMC are smaller than those with RFS. It means that the profile tolerance with RFS condition tends to cause more discrete statistical distribution of the target deviation.
Comparison of target deviation with different material conditions.
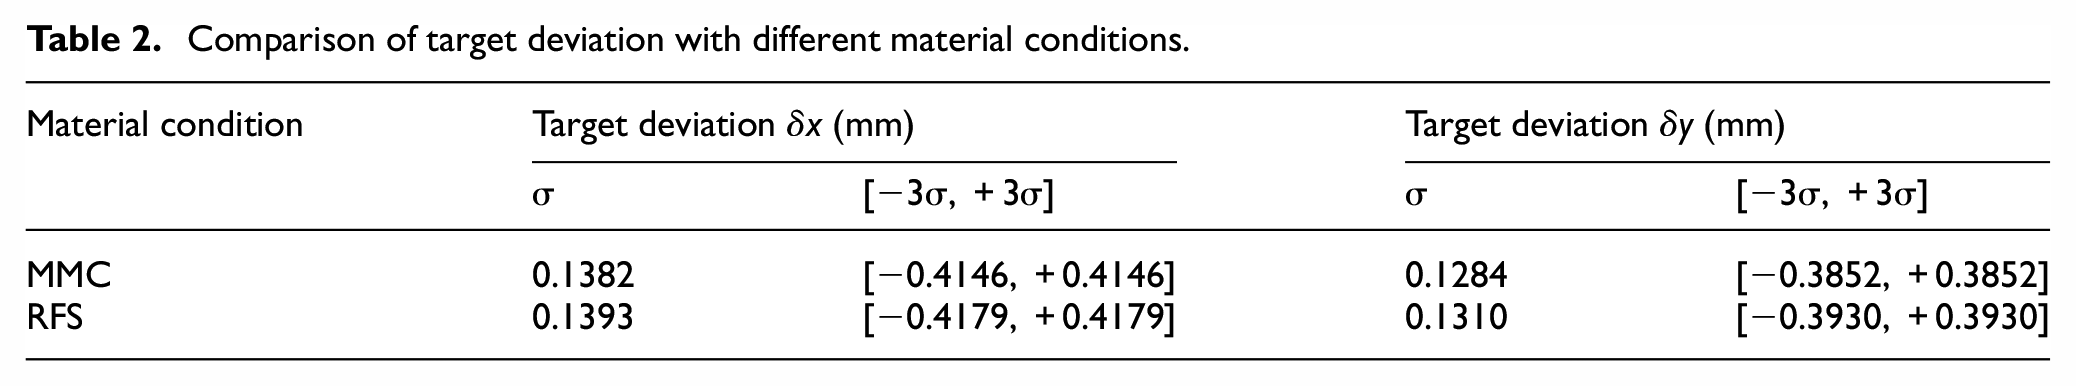
In terms of controlling assembly deviation, the maximum material condition (MMC) is suitable for the tolerance design in the casing assembly. Based on the above results, the statistical distribution ranges of axial target deviation δx with MMC is [−0.4146,+0.4146]. However, by substituting the original tolerance zones of all functional elements into the 3D tolerance model, the extremum values of target deviations with MMC are obtained as follows: −0.550 mm ≤ δx ≤ −0.550 mm, −0.765 mm ≤ δy ≤ +0.765 mm, −0.765 mm ≤ δz ≤ +0.765 mm. It is clear that all these statistical distribution ranges are relatively smaller when compared with the extremum values of target deviations. Since the axial and radial target deviations have the direct effect on the dynamic characteristic of the casing, it is necessary to investigate the relationship between extreme target tolerance and fluctuation range of the frequency herein.
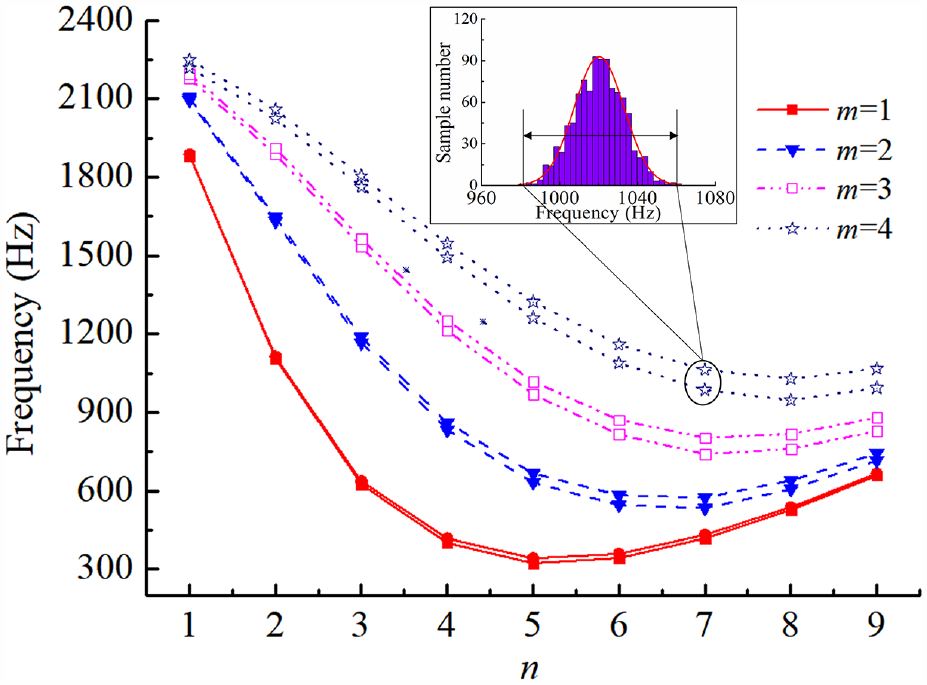
In this section, 1000 random samples of target deviation are generated in corresponding extreme tolerance zones. Then, based on the vibratory governing equation, the statistical distributions of the natural frequency are illustrated in Figure 12. Obviously, the distributions of the natural frequencies also obey the normal distribution. It should be noted that the fluctuation range of frequency is large enough to cause the undesirable dynamic performance problem. For example, the maximum and minimum of the frequency for the vibration mode (m = 1, n = 5) are 322 and 343 Hz respectively, and the fluctuation range is nearly 7% of the original frequency.
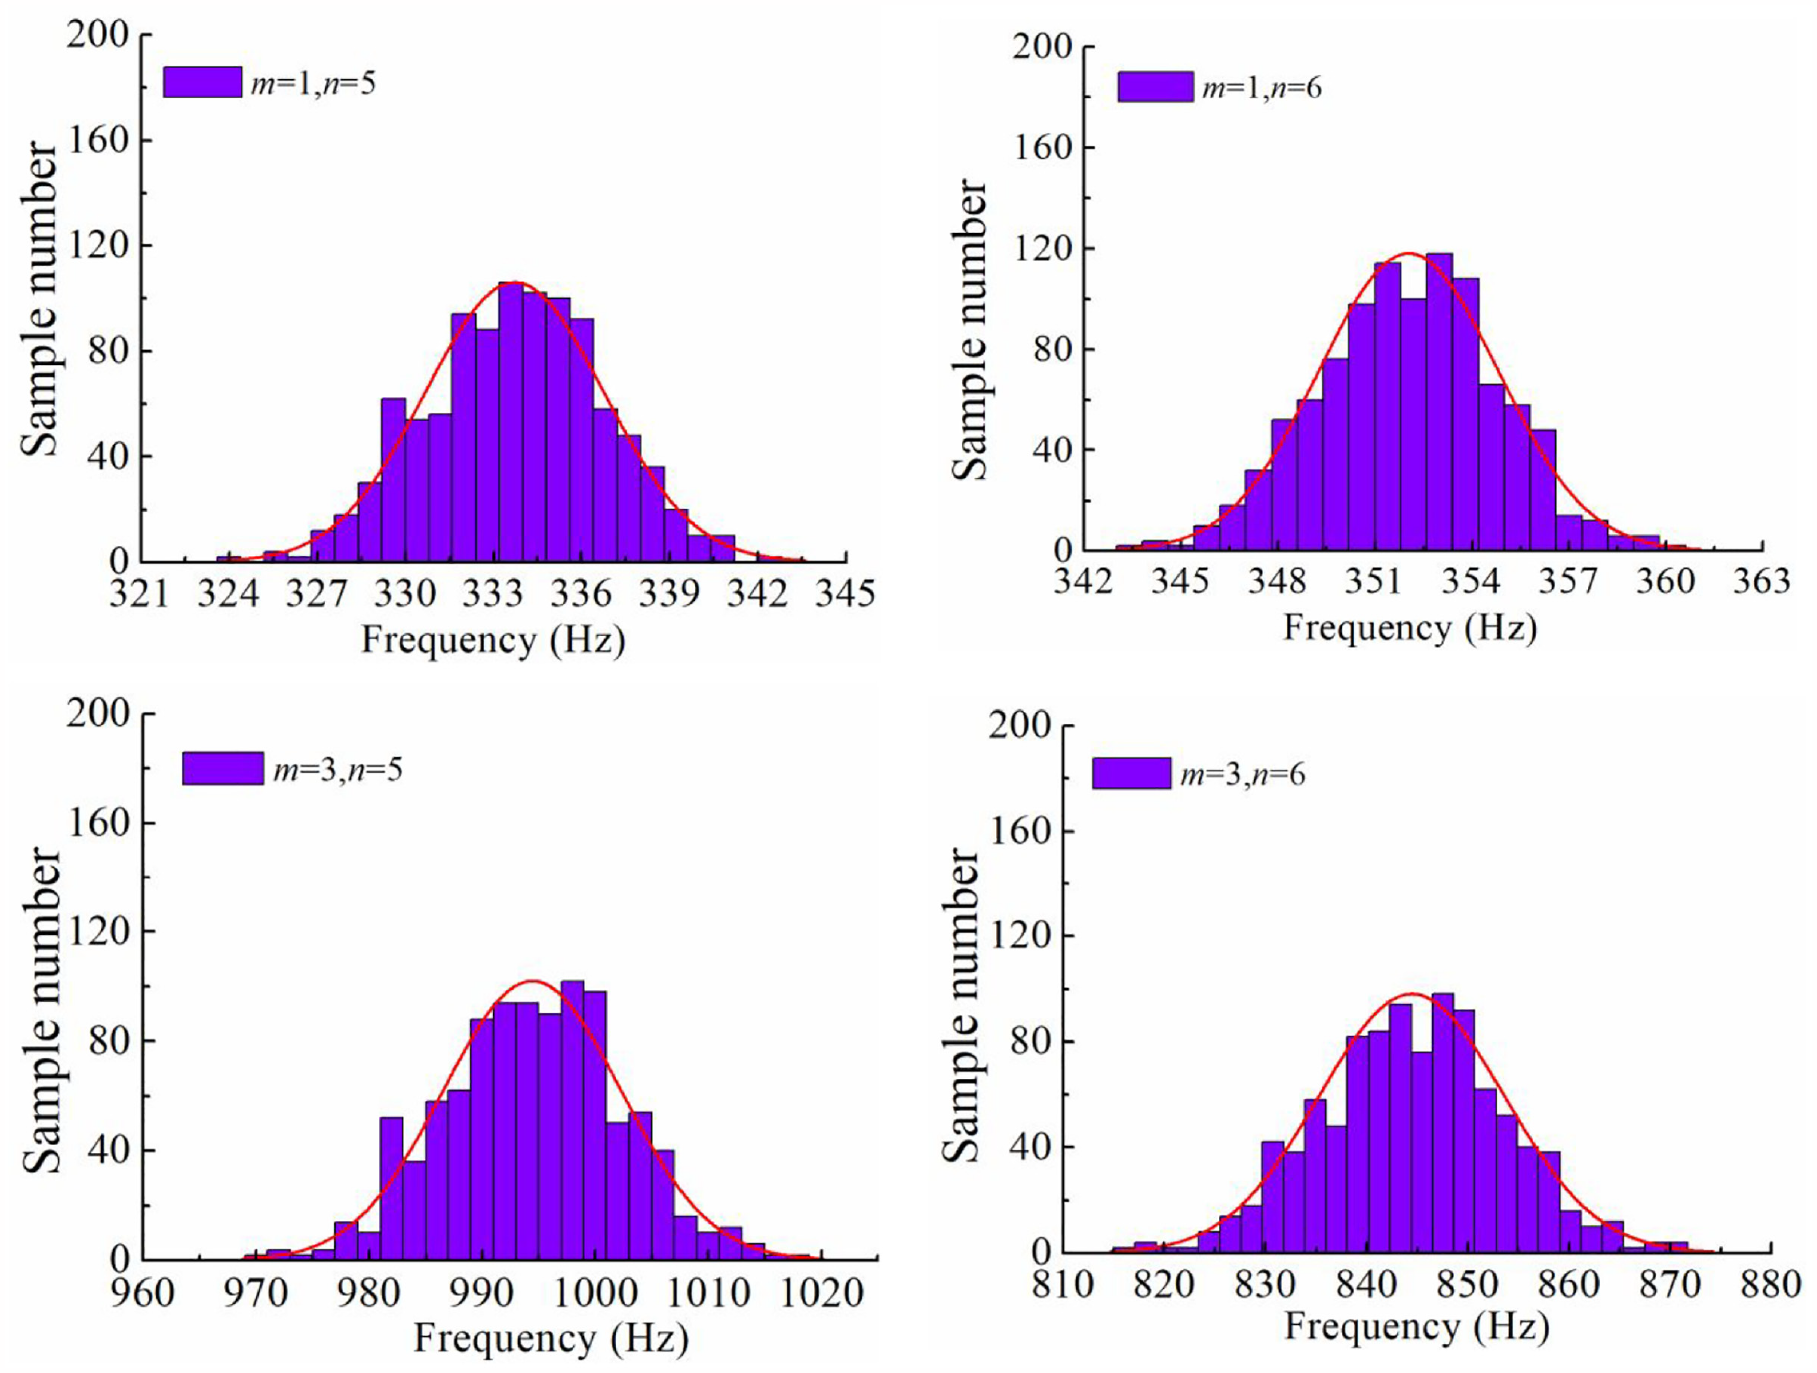
Statistical distribution of natural frequency with different vibration modes.
For any vibration mode, the statistical distribution of the frequency can be obtained through the presented approach. Figure 13 shows the fluctuation ranges of the natural frequency with different m and n. The region between upper limit and lower limit of the frequency is the fluctuation range. It is obvious that the fluctuation range increases when m varies from 1 to 4. However, the large frequency fluctuation means the serious instability of the dynamic performance, indicating the unreasonable original assembly tolerance. It is necessary to optimize tolerance with the constraint of dynamic characteristic stability.
Fluctuation range of natural frequency for different m under the specified tolerance requirement.
Tolerance design
Generally, tolerance design is usually addressed independently in the design phase and has no concern with the effect on the dynamic response. Manufacturing and assembly may not match the final performance demand, which causes the vibration problems. Given that the assembly deviation has a direct effect on the dynamic characteristic of the casing, the tolerances of all involved functional elements in 3-D tolerance model should be reallocated to restrict the fluctuation of natural frequency.
Based on the obtained results, the mapping relationship between assembly tolerance and frequency fluctuation is constructed. Figure 14 illustrates the smooth3-D fitted surfaces of frequency fluctuation ratio under different target tolerances. It can be seen that the surfaces for different vibratory modes are various. By setting a certain constrain of fluctuation ratio, the surface below the constraint value can meet the stability demand and the corresponding tolerance region is defined as the acceptable tolerance. For example, the fluctuation ratio of the frequency is restrained herein in the range from 0% to 1%. To obtain the acceptable tolerance region, the maximum fluctuation ratios of the first three vibratory modes in Figure 14(a) to (c) are extracted. Then the corresponding acceptable tolerance (shadow region) is found by filtering out the tolerance region with fluctuation ratio >1%, as illustrated in Figure 14(d). Considering the tolerance design specification, the red dotted rectangular region is defined as the optimized target tolerance zone (i.e. −0.1 mm < δx < 0.1 mm, 0 mm < δr < 0.2 mm). Based on the performance requirement, the presented method can not only address the first three vibration modes but also other vibration modes.
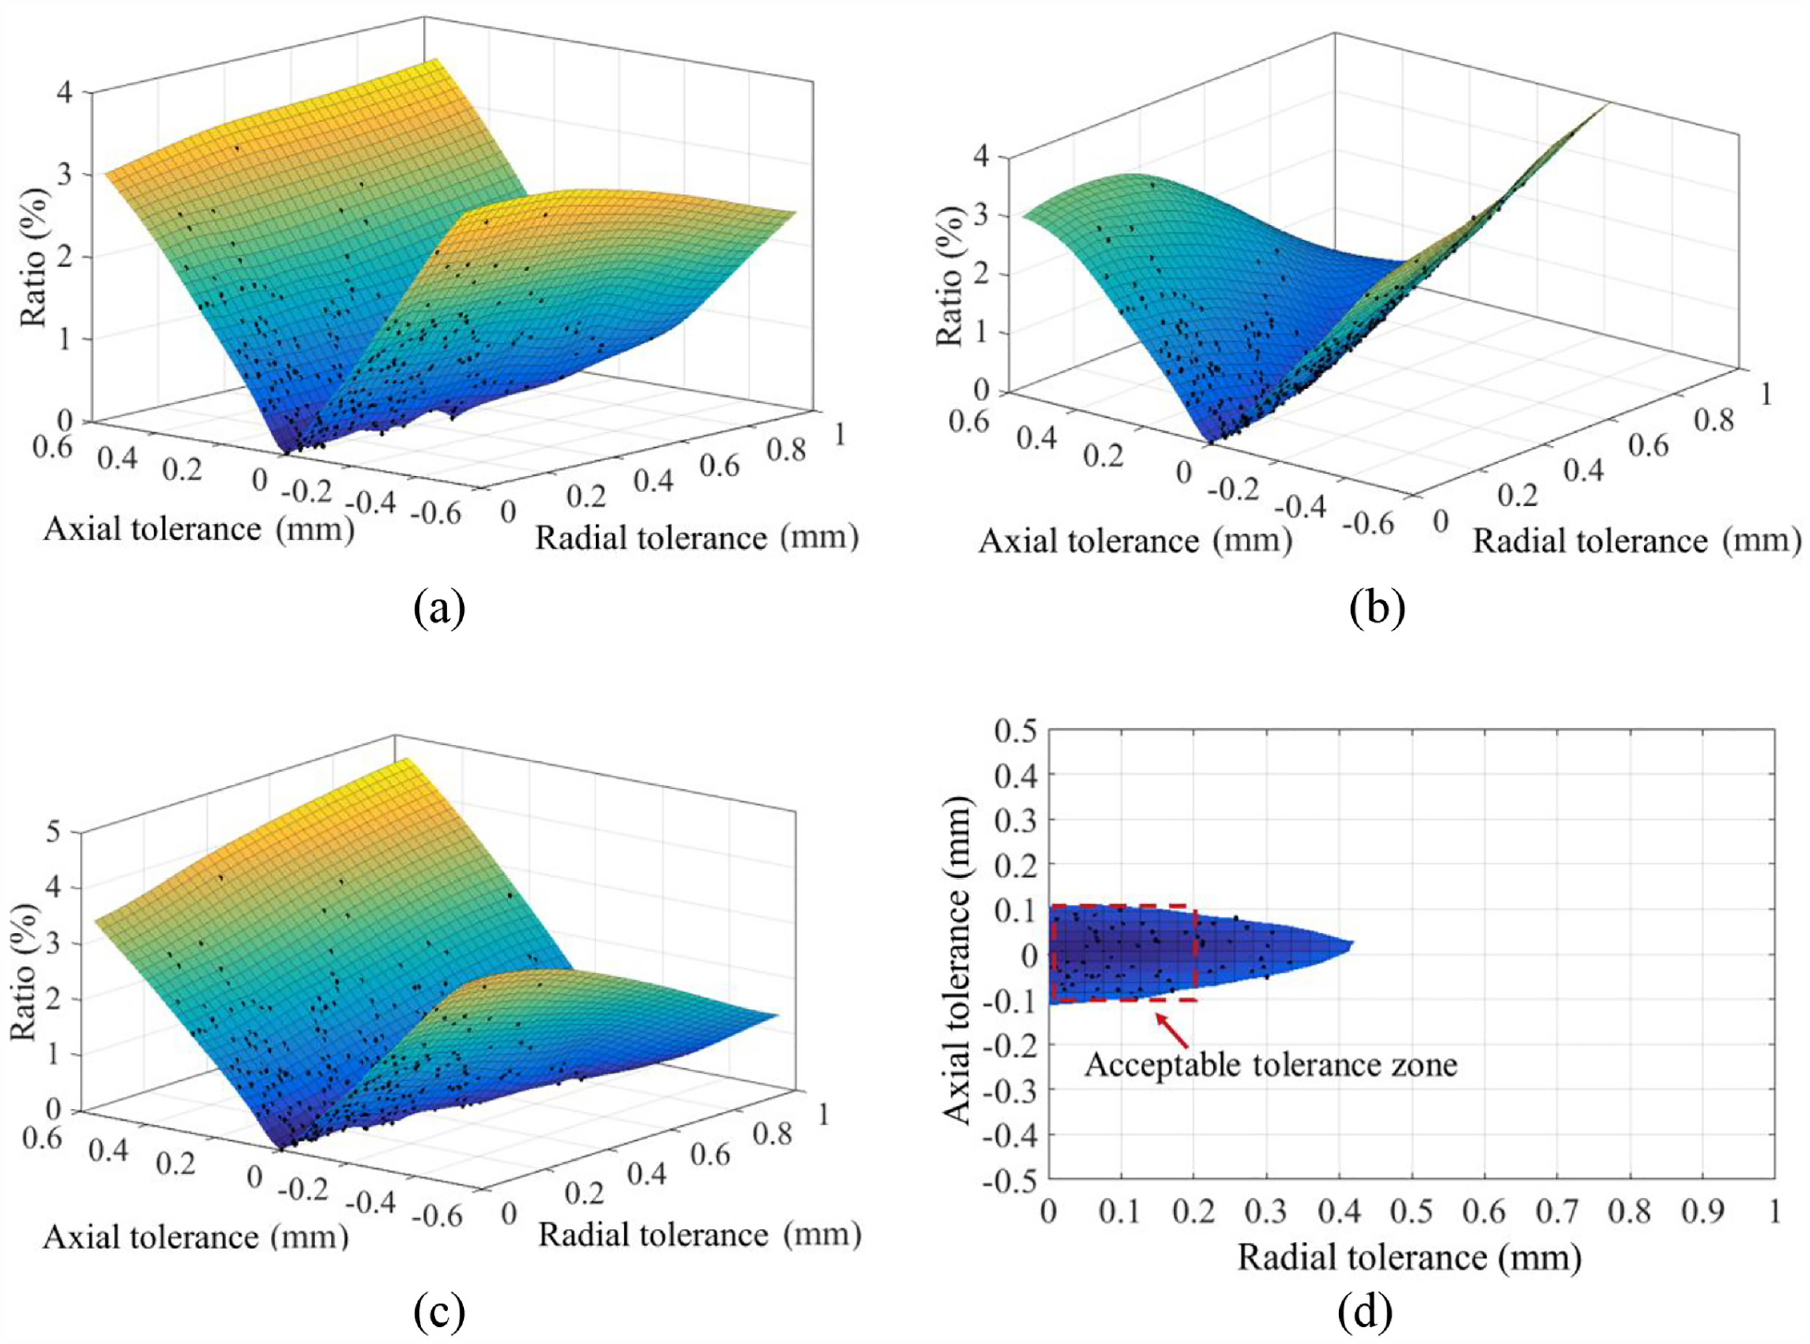
3D fitted surfaces of the fluctuation ratio under different target tolerances: (a) m = 3, n = 6, (b) m = 3, n = 7, (c) m = 3, n = 7, and (d) acceptable tolerance region.
Figure 15(a) depicts the acceptable target tolerances with different constraints of fluctuation ratio. As the fluctuation constraint varies from 0.5% to 2.0%, the acceptable target tolerance has the similar increment. Under the specified constraint, the corresponding acceptable target tolerance is defined as the input variable into the 3D tolerance model. Based on the mathematical relationship in equation (12), all the tolerance components of the functional elements can be reversely calculated. Figure 15(b) illustrates the optimized tolerances as follows: Td1 = 0.045 mm, Td2 = 0.055 mm, Tc = 0.035 mm, Tr = 0.025 mm, and Ts = 0.035 mm under the constraint of fluctuation ratio <1%. Obviously, the tolerances, such as dimensional tolerance, profile tolerance, and coaxiality tolerance, decline nearly 80% when compared with the original tolerances.
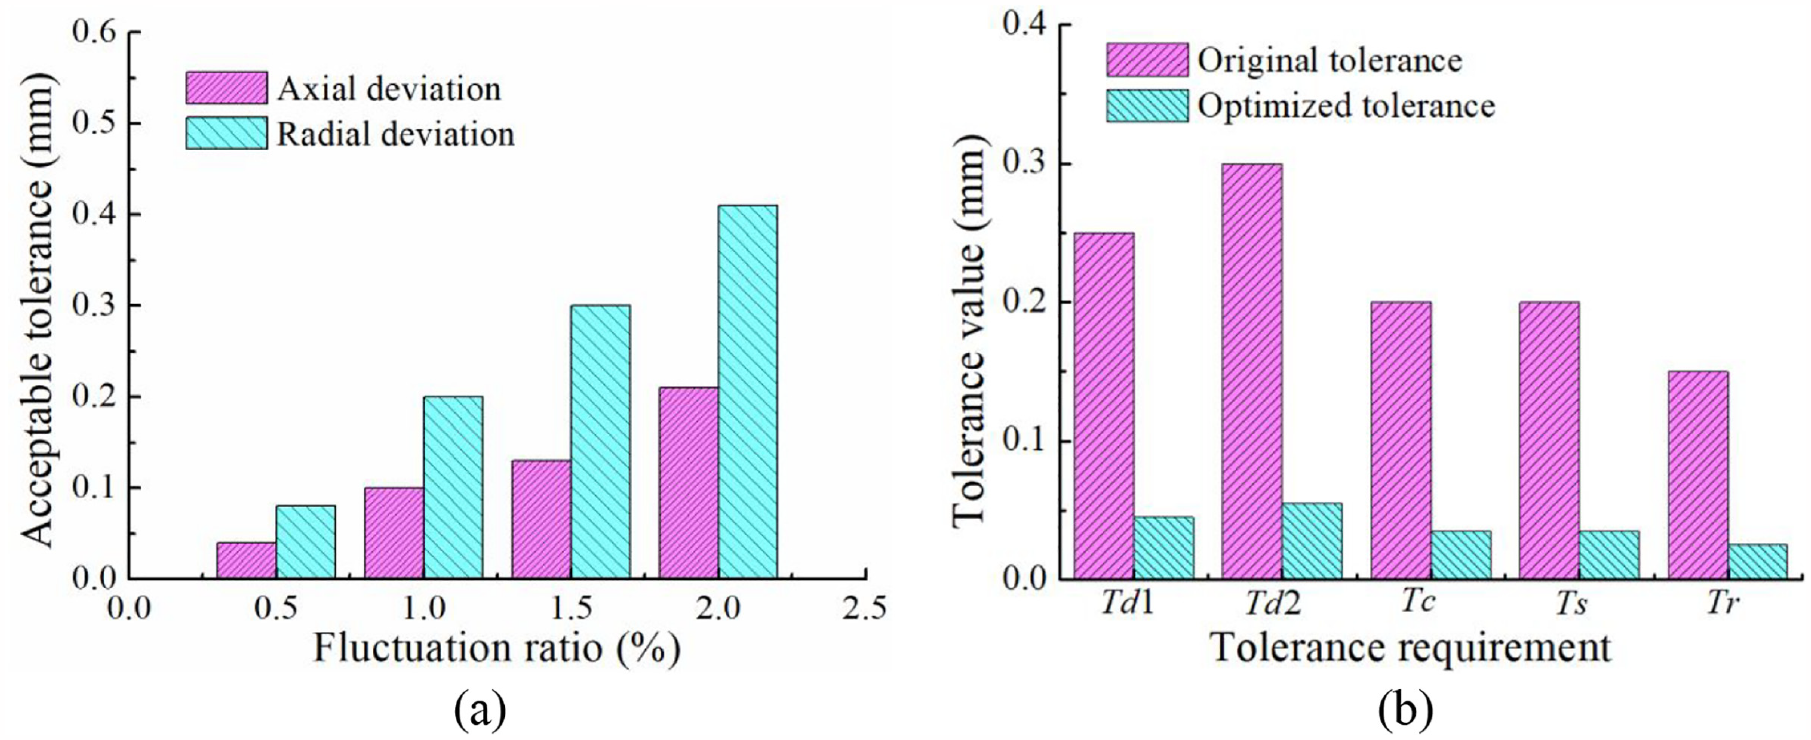
Acceptable tolerances with different constraints of fluctuation ratio: (a) acceptable target tolerance and (b) tolerance optimization of functional elements under frequency fluctuation ratio <1%.
Based on the optimized target tolerance (i.e. −0.1 mm < δx < 0.1 mm, 0 mm < δr < 0.2 mm), the statistical distributions of natural frequency with different vibration modes are illustrated in Figure 16. It can be seen that after optimization the statistical distribution range 6σ of frequency has an obvious reduction when compared with the original statistical distribution. The instability of frequency is diminished as the fluctuation ratio decreases approximatively from 7% to 1%. If better performance stability is required, the tolerances have larger reduction through the presented method. The corresponding drawing of the casing with final tolerance design is illustrated in Figure 17.
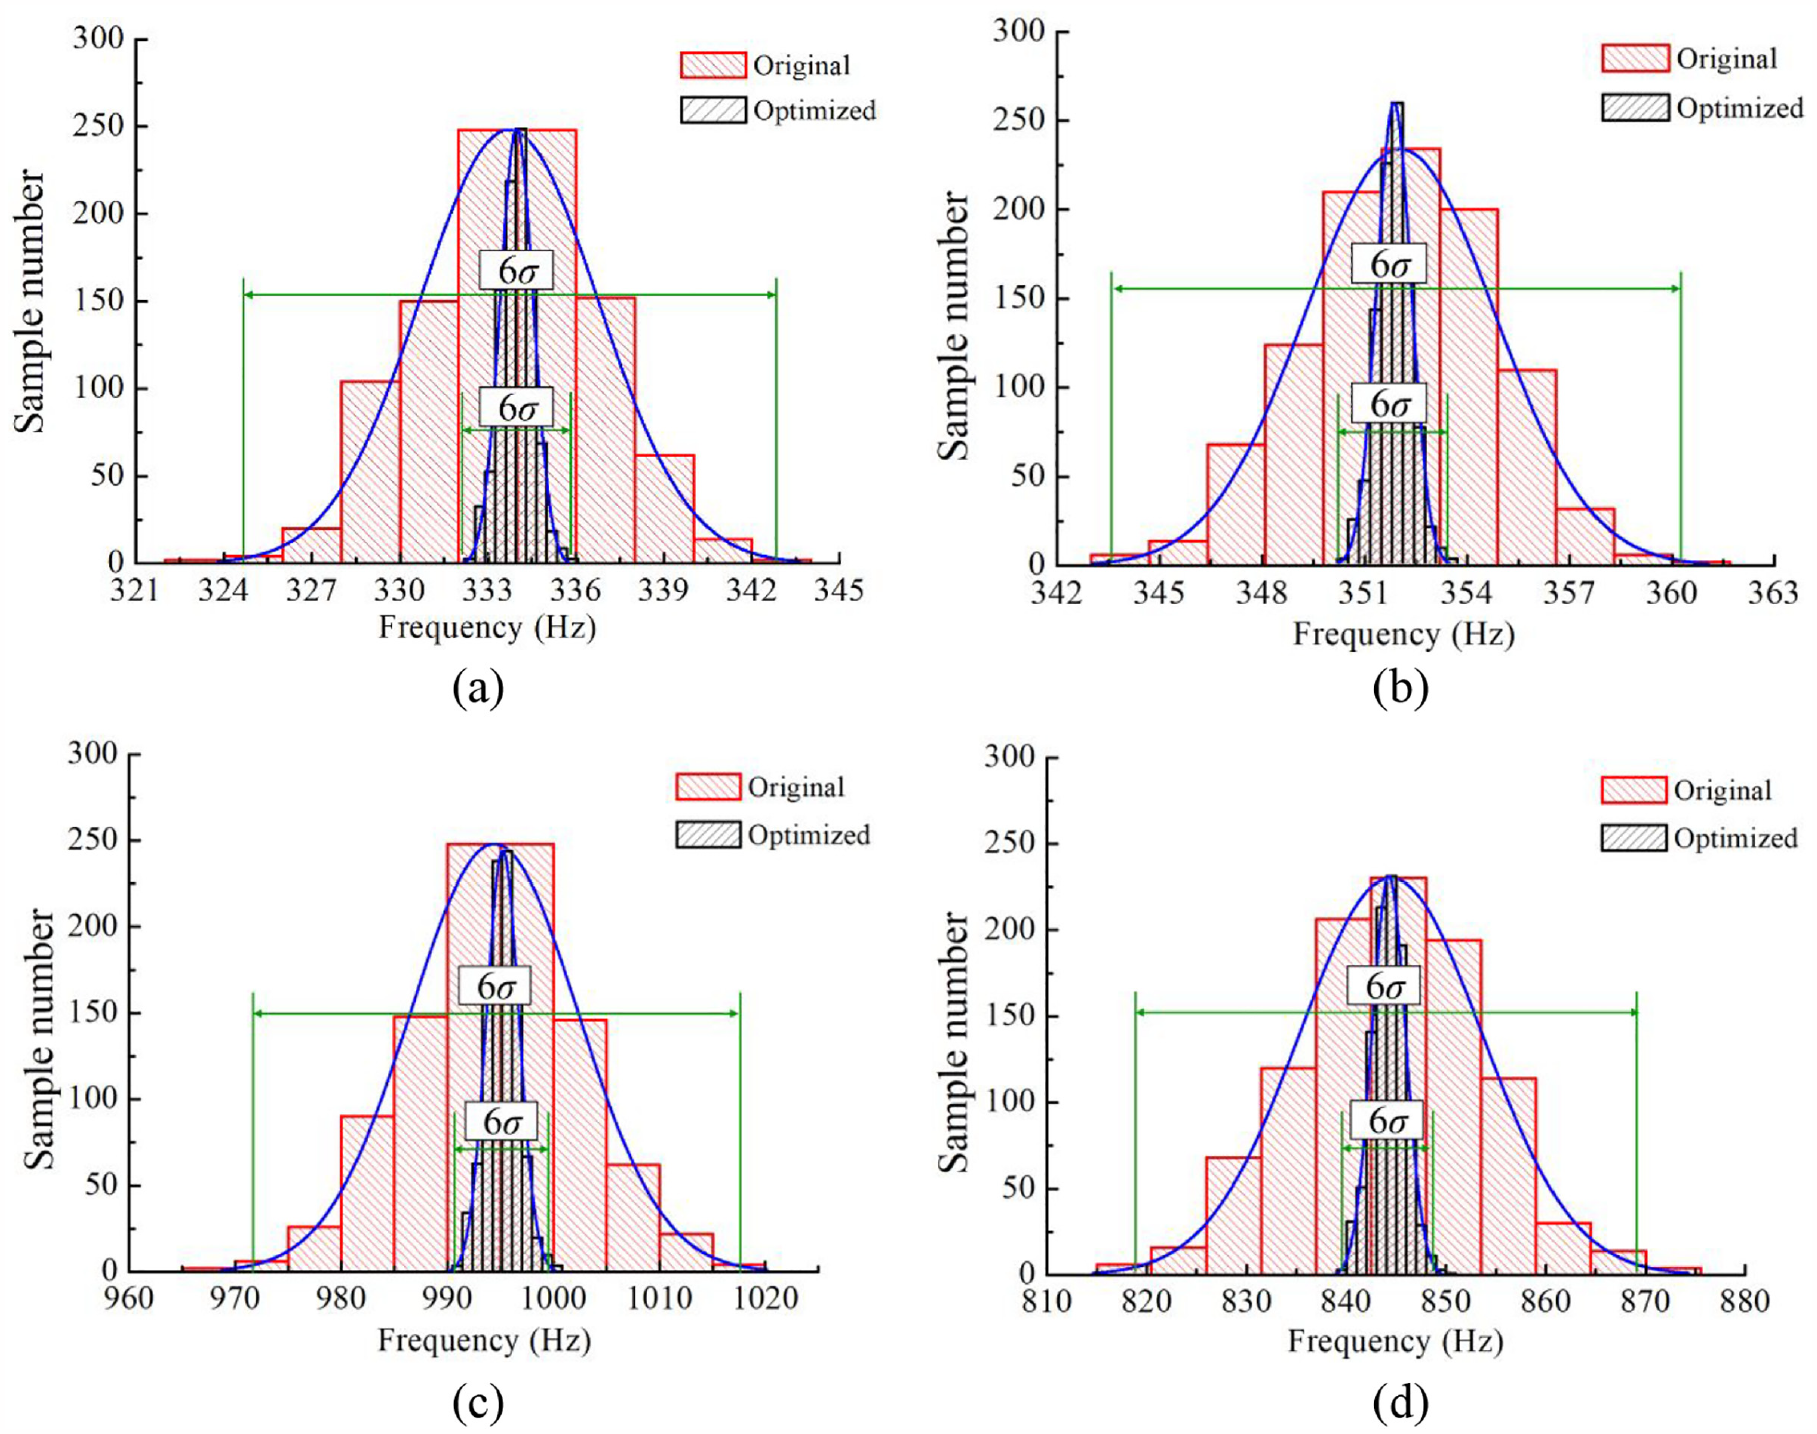
Comparison of statistical distribution for the natural frequency with different vibration modes: (a) m = 1, n = 5,(b) m = 1, n = 6, (c) m = 3, n = 5, and (d) m = 3, n = 6.
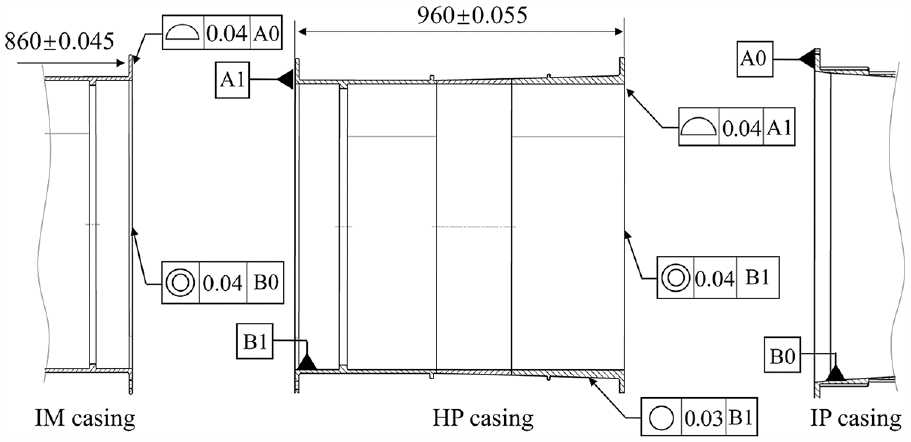
Optimized tolerance requirements of the casing under the frequency fluctuation ratio <1%.
However, the proposed theoretical model is established based on the geometrical simplification, in which the aero-engine casing assembly is defined as the thin-walled cylindrical shell and the small geometrical features are ignored. It is inevitable that the small geometrical features result in the difference between the predicted results from the theoretical model and that from the actual structure. Due to the good reliability on the engineering problem and the adaptability on the complex structure, the finite element model (FEM) is employed herein via the software ABAQUS®. Through FEM, this paper attempts to validate the effectiveness of the presented tolerance design method on the actual aero-engine casing. In order to obtain good accuracy for the FEM, a total of 273,222 hexahedral solid elements with mesh size 5 mm are used. The detailed geometrical features, such as the holes, flange surfaces, and reinforcing ribs, are all presented in the finite element model. As shown in Figure 18(a), the front end of the casing is fully fixed, while the initial displacement is applied into the nodes of the rear end to simulate the initial flexible assembly deviation.
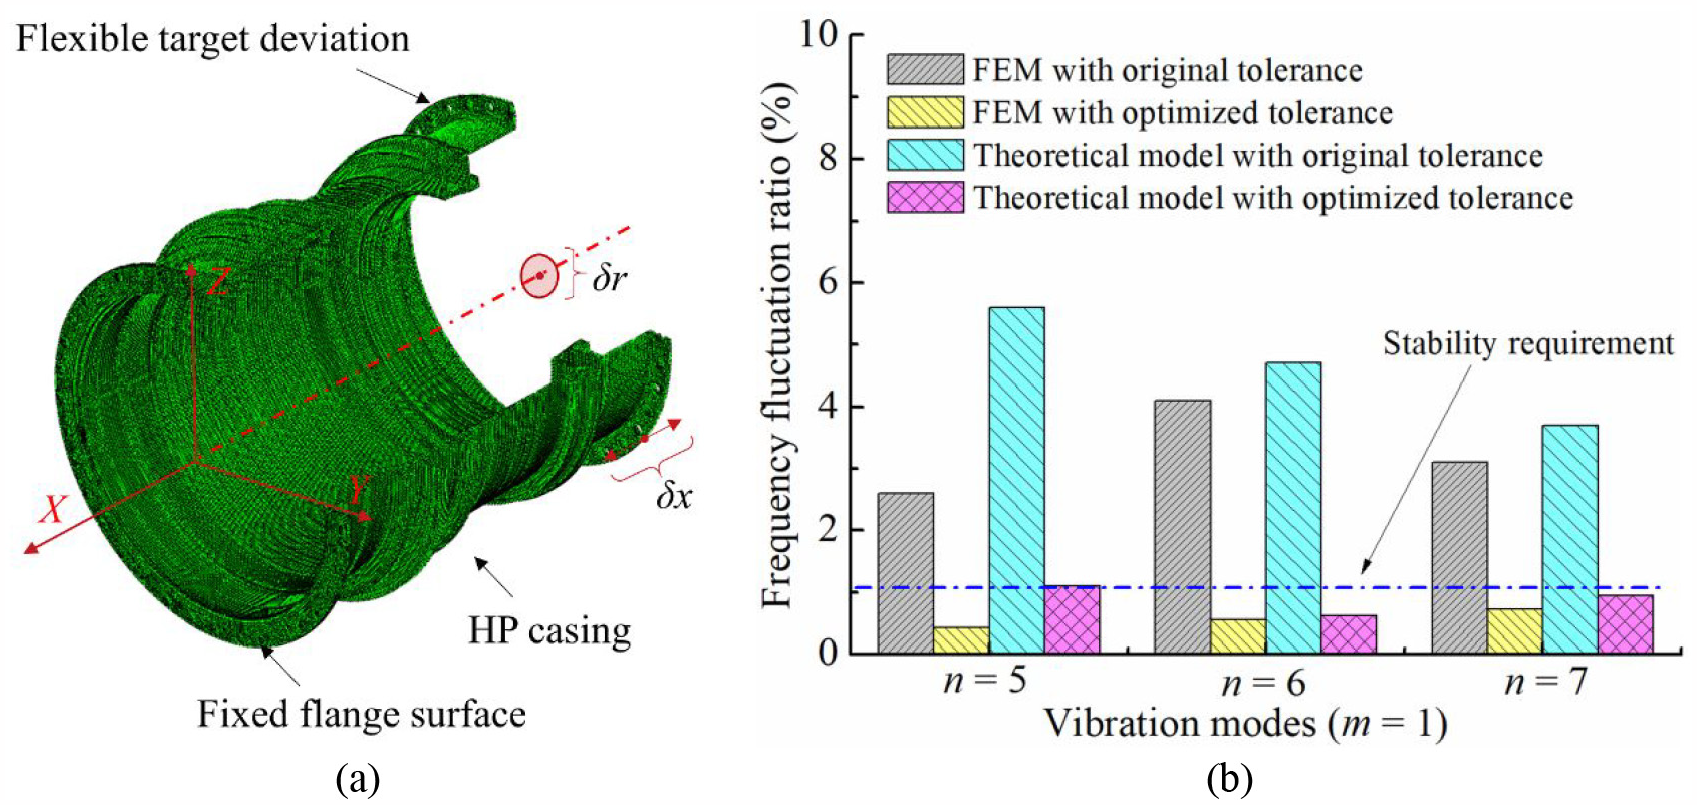
Finite element simulation with initial flexible assembly deviation: (a) finite element model and (b) comparison between finite element model and presented theoretical model.
Specifically, first the original target tolerances obtained from the established 3-D assembly tolerance model (i.e. −0.55 mm < δx < 0.55 mm, −0.765 mm < δy < 0.765 mm, −0.765 mm < δz < 0.765 mm) are applied into the finite element model. Then, the natural frequencies of the casing with original target deviations are obtained to calculate the frequency fluctuation ratio with respect to that with no assembly deviation. Similarly, the frequency fluctuation ratio of the casing with optimized tolerance ranges (i.e. −0.1 mm < δx < 0.1 mm, 0 mm < δr < 0.2 mm) is obtained by the finite element model. Finally, the comparison of the frequency fluctuation ratio between original target tolerance and optimized target tolerance is conducted. As shown in Figure 18(b), the frequency fluctuation ratio of the casing with optimized tolerance is smaller than 1% and meets the stability requirement, which denotes the effectiveness of the presented theoretical method. It also shows that the optimized tolerance from the theoretical model is relatively conservative since the frequency fluctuation ratio from the finite element model is smaller than the theoretical result. Based on the above analyses, the presented tolerance design method exhibits a good applicability on the actual engineering structure of the aero-engine casing, though some small geometrical features are not taken into account. The presented method can provide significant reference for tolerance design in the engineering application.
In summary, manufacturing precision indicates the tolerance zone of functional geometrical feature and determines the extremum of 3-D assembly deviation. Random geometrical deviation, positional deviation and dimensional deviation are propagated and accumulated in the manufacturing process, causing an undesirable flexible deformation inside the aero-engine casing. Initial assembly stress affects the dynamic behavior of the structure. Some vibration modes with low frequency and large axial wave number show significant sensitivity to the assembly deviation. It should be paid more attention to the effect of assembly deviation on the dynamic performance in the design phase. Through the work in this paper, the mapping relationship between manufacturing precision and dynamic characteristic fluctuation is constructed. The acceptable tolerance is obtained with the consideration of the stability demand. After the tolerance optimization, the distribution of natural frequency becomes more intensive around the nominal position. It is feasible to predict the dynamic performance instability by tolerance analysis. Meanwhile, the assembly quality can be evaluated by detecting the variation of natural frequency.
Conclusion
This paper presents a method to design assembly tolerance of the aero-engine casing with the constraint of dynamic performance stability. The 3D tolerance assembly model is constructed by adopting Jacobian matrix and Torsor model to characterize the assembly deviation propagation. The initial assembly deformation caused by target deviation is introduced into the vibratory governing equation. Based on the dynamic model, the effect of initial assembly deviation on the dynamic characteristic is studied.
The natural frequency shows an obvious uptrend as initial axial deviation increases. The vibration mode with low original frequency and large axial half wave number m is more sensitive to the axial deviation. For the radial deviation, the frequency fluctuations of different vibration modes show a various tendency. As axial half wave number m increases, more vibration modes become sensitive to the radial deviation. Then, by generating random samples, the statistical distributions of the natural frequency with different vibration modes are illustrated. With the constraint of frequency stability, the acceptable tolerance region is obtained. The statistical frequency distribution with optimized tolerance shows a sharp reduction when compared with original tolerance. Furthermore, the final tolerance design is validated by finite element analysis and exhibits a good applicability on the actual engineering structure of the aero-engine casing.
The work in this paper integrates manufacturing precision and vibration performance together, and it establishes the mapping relationship between assembly tolerance and fluctuation of dynamic characteristic. The presented method is novel and significant for the aero-engine casing to design tolerance and improve the stability of dynamic performance.
Footnotes
Appendix A
where
where G1n, G1n, and G1n are
Declaration of conflicting interests
The author(s) declared no potential conflicts of interest with respect to the research, authorship, and/or publication of this article.
Funding
The author(s) disclosed receipt of the following financial support for the research, authorship, and/or publication of this article: The work described in this paper is supported in part by the grant from the National Natural Science Foundation of China (NSFC Nos. 51775346 and 52005334) and National Major Science and Technology Project (779608000000200007). The authors are grateful for these financial supports.