
Abstract
Polymers have gained the attention of manufacturers due to their significant advantages such as low density, high corrosion resistance, and high humidity resistance. Producing high-precision polymeric components is one the most challenging issues especially in fabricating complex or micro-scale systems. Some of the machining techniques such as electro discharge machining (EDM) and electrochemical machining (ECM) cannot be employed for machining the non-conductive parts. Using abrasive particles is one of the best options for machining these types of materials. In this work, the capability of the acoustic energy for machining polyamide (PA) workpieces is studied. To this end, an experimental setup is installed and design of experiment (DoE) algorithm is employed to survey the effect of process parameters on surface roughness. Three parameters at three levels are considered as the effective factors of the process and the sensitivity of the surface roughness on the process factors is investigated. In the next step, a hybrid finite element/boundary element approach was used to discuss the relation of process parameters to the vibrational characteristics of the container, then the mechanism of the process was investigated employing the discrete element method. Finally, the surface topology of the optimal workpiece before and after the process was presented and compared. It was observed that acoustic energy can be considered as a vibration source of the container’s floor to provide kinetic energy for machining PA parts on the nano-metric scale. Moreover, it was found that the initial roughness of the workpiece and the chosen parameters play a crucial role in the machining process. Experimental results show that in this technique by selecting appropriate process factors the surface roughness can be reduced up to 50%.
Keywords
Introduction
Polishing parts is known as one of the most challenging processes in the manufacturing field. Different traditional and modern techniques are nominated to enhance surface quality of the workpiece according to cost, time, workpiece material, and surface complexities demands. In recent decades, the vibration of a tool or workpiece is known as an efficient assistant technique in conventional1–13 and non-conventional14–31 machining processes. Vibratory and ultrasonic machining are two main non-conventional polishing processes, which are based on vibration phenomenon. There are different research to study these techniques to improve processes efficiency and surface quality of the parts. Eifler et al. 32 have studied surface anisotropy in the vibratory polishing technique. They evaluated the topography of the surface to examine the anisotropy lost during different conditions and cases in the polishing process. Da Silva Maciel and Spelt33–36 investigated the mechanism of the abrasive particle’s motion in the vibratory tube employing the two-dimensional discrete element method to find out effective parameters of the vibratory process. They computed the effect of the process parameters and the relation of particle and container wall speeds with the exerted forces to the workpiece. Wong et al. 37 estimated a mathematical model by using experimental data to predict the processing time in vibratory polishing. They stated that by this model, estimation of the processing time to achieve desirable surface roughness is possible. Uhlmann et al. 38 studied the parameters of the vibratory polishing using discrete element method. They calculated contact forces using the Hertz-Mindlin contact model. They verified their simulations with the experimental test. Besides vibratory polishing, ultrasonic machining can be used as the main process for polishing vast types and shapes of materials. Zhang et al. 39 employed rotary ultrasonic machining for polishing the optical K9 glass. Their experiments were focused on the effects of the input variables (ultrasonic power, spindle speed, and feed rate) on the output responses (edge chipping size, cutting force, surface roughness, and ultrasonic power consumption). Sun et al. 40 compared the abrasive and ultrasonic vibration-assisted polishing and derived the factors affecting ultrasonic vibration-assisted polishing. They observed that ultrasonic vibration–assisted polishing enhanced the surface quality three times more than the abrasive polishing process. Yu et al.41,42 studied the trajectory and motion of abrasive particles impacted by ultrasonic vibration field and its influence on the machining of Inconel 718. They observed that the polishing quality of the workpiece is significantly enhanced compared with abrasive flows without ultrasonic vibration field. Zhang et al. 43 surveyed the abrasive particles behavior in machining gap in ultrasonic polishing process employing numerical and experimental techniques. They observed that suspension thin film has a significant effect on the surface roughness. Han et al. 44 studied the effect of ultrasonic vibration of the workpiece on the surface quality of austenitic stainless steel. They observed that employing this technique reduces polishing force and enhances surface quality. Zhang et al. 45 surveyed the produced local surface profile and the theoretical model to reduce machining error by controlling the ultrasonic polishing parameters. They expressed that not only their model anticipates material removal, but also provides a good understanding of the ultrasonic polishing process.
The source of the kinetic energy of abrasive particles in both vibratory and ultrasonic machining is based on mechanical vibrations of tools or containers. In this paper, a new approach is presented for abrasive machining PA parts employing acoustic energy. Acoustic energy at the low-frequency range is used as the excitation source of the container to provide kinetic energy of the abrasive particles. To this end, the effects of different process parameters on the surface roughness are studied to provide a guideline to choose desirable process parameters.
Theory review
Vibration equation of a thin plate under exerted dynamic excitation can be written as:
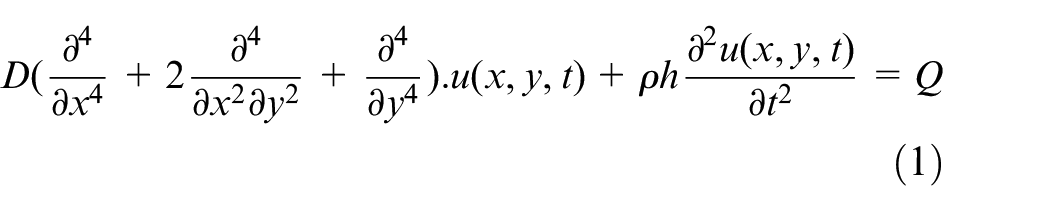
In equation (1), u is transverse displacement, Q is the dynamic excitation,
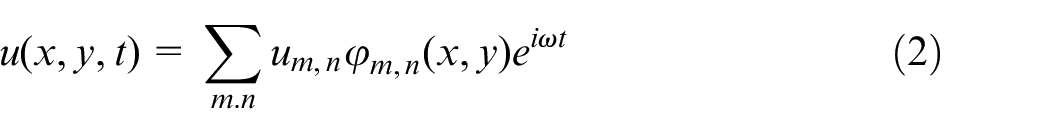
In equation (2),
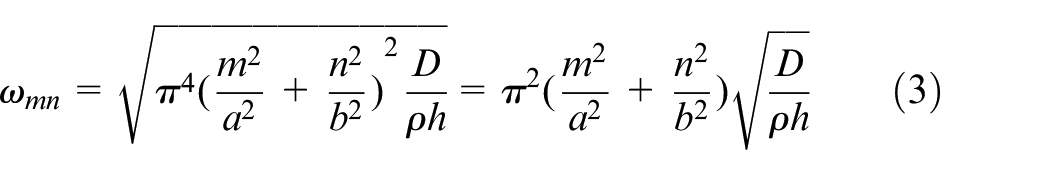
Regarding equation (3), physical and geometrical properties of the plate affect on natural frequency of the vibrating plate. To find out displacement amplitude of the plate in mode (m,n) using Galerkin method, integral of a weight residual of mode shape function should be set to zero. Therefore:
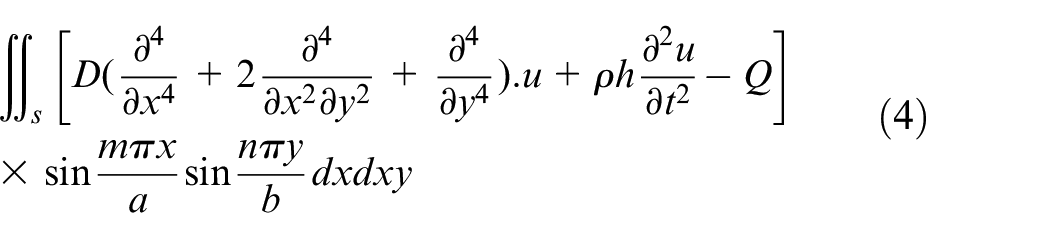
Where, S is surface area of the plate. Substituting equation (2) into equation (4) provides a linear equation set for estimating the modal displacement amplitudes

Where,
Regarding Rayleigh integral expression 46 acoustic pressure in point r can be estimated by:
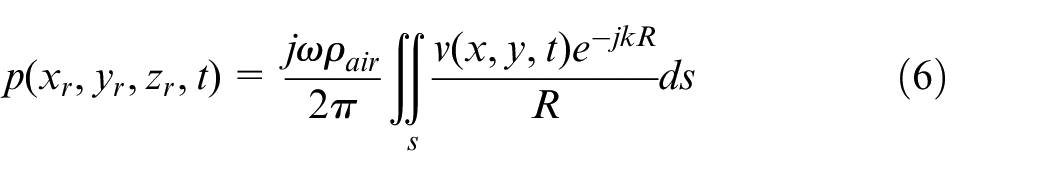
In equation (6),
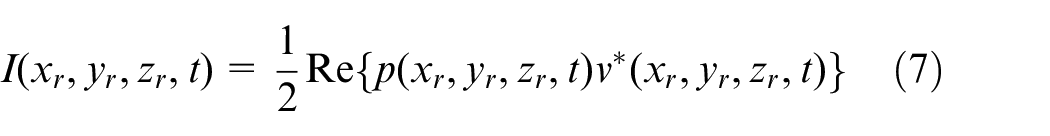
In equation (7)
Considering mode Shape function for a clamped plate in mode (m,n) that can be written as:
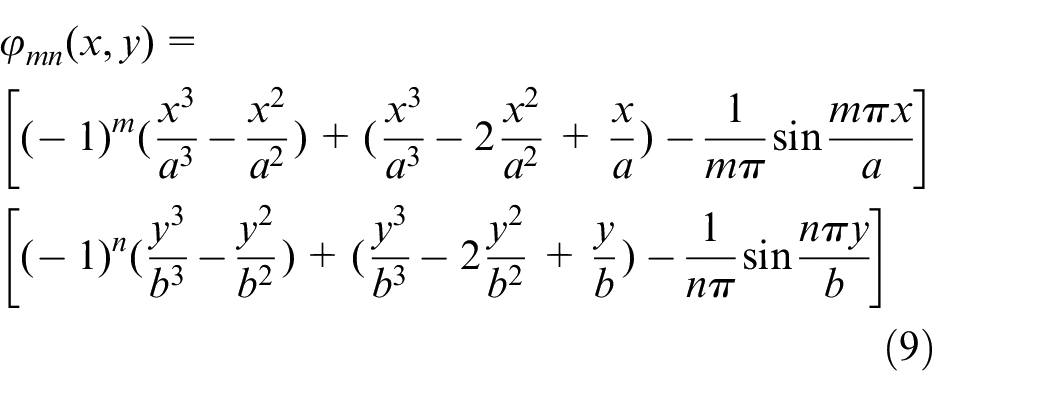
Using this modal shape function and acoustic excitation load, the response of the clamped rectangular plane can be computed.
Experimental tests
Test setup
In this research, the capability of the acoustic energy to vibrate the container’s floor in order to provide kinetic energy for particles is studied. To this end, an experimental setup is established and the effect of the process factors on the surface roughness of the workpieces is evaluated. The experimental setup consists of five main sections: (1) excitation source, which includes a closed box loudspeaker (As a monopole acoustic source), a function generator, and an amplifier. (2) An abrasive container, which consists of two parts: (a) floor with 0.1 mm thickness from C26000 series of brass alloy and (b) walls with 1 cm thickness from Plexiglass. (3) Fixtures for container and workpiece that provide adjustable positions for these parts. (4) Abrasive silicon carbide powder with the mesh size of 46. (5) Cubic PA workpieces with
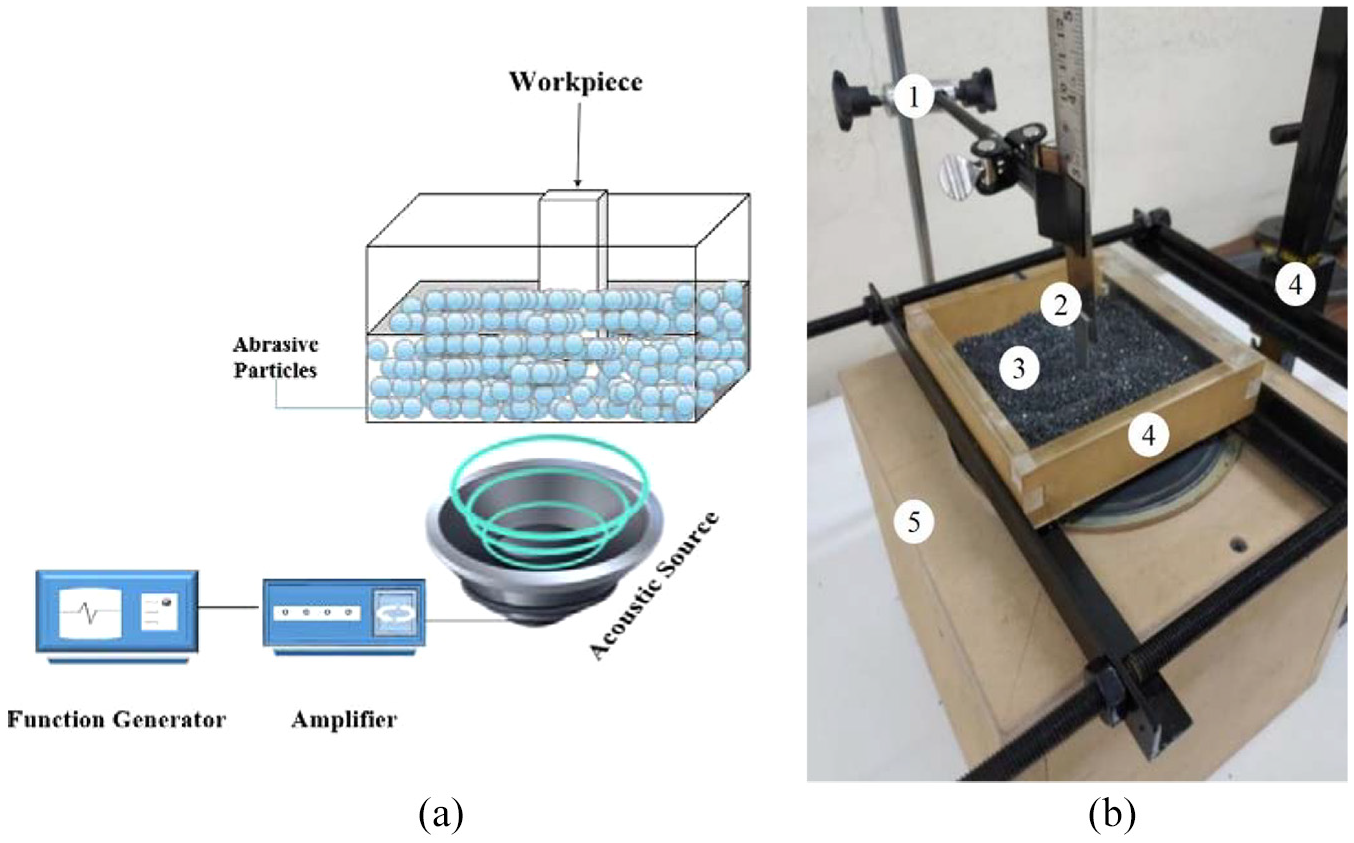
(a) Schematics of machining by acoustic energy and (b) experimental setup: 1 – fixture, 2 –workpiece, 3 – abrasive particles, 4 – machining container, 5 – sound source.
Design of experiments
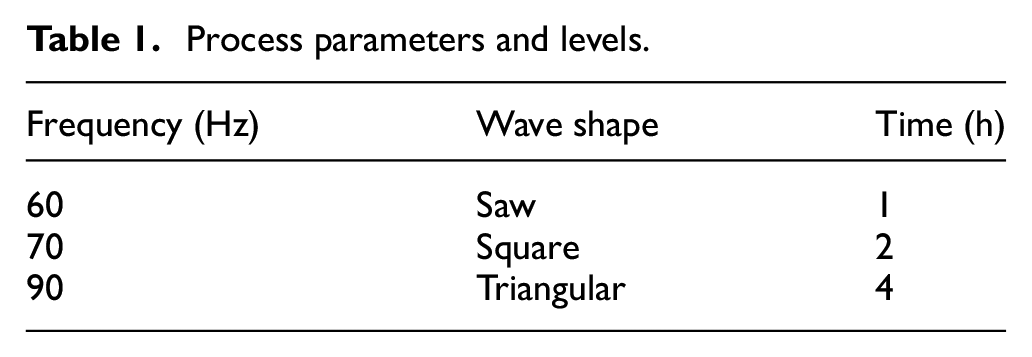
Machinability of PA parts using this technique requires the identification of process parameters and their effects on the surface roughness. For this aim, three controllable factors were chosen as the process parameters and their effects on the surface quality of the parts were investigated. Design of experiment (DoE), as one of the most confident techniques, was used to evaluate the factors of the process systematically. For this matter, frequency of the excitation, wave shape, and process duration were chosen as the main factors and each factor was studied in three levels. Table 1 demonstrates the process factors and their levels.
Process parameters and levels.
In this work, a full factorial design algorithm is selected to evaluate the process conditions. In the full factorial design, the objective is measured in all combinations of process levels. Regarding levels of the factors, 27 runs were conducted to cover all combinations.
Numerical modeling procedure
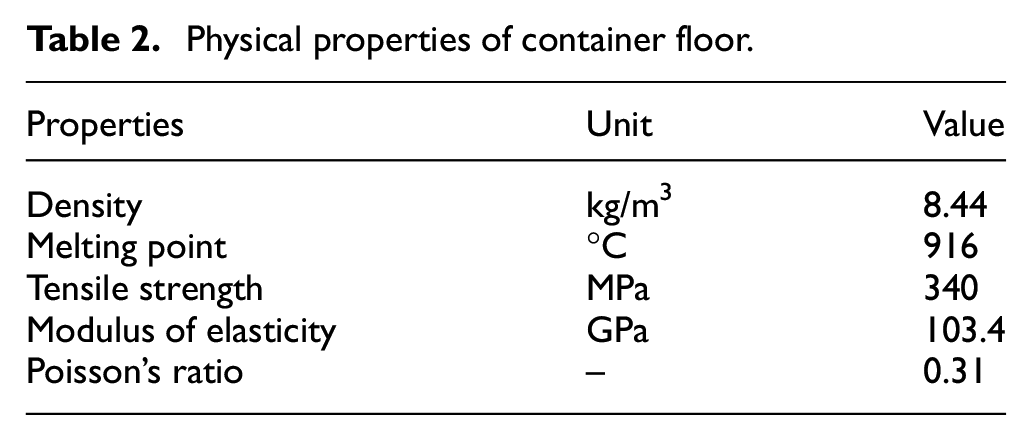
In order to simplify the study, only the motion of particles due to the floor vibration is considered as the main factor for machining, and the acoustic power transmitted to the abrasive particles and workpiece due to high impedance and attenuation is neglected.47,48 The hybrid FEM/BEM approach is employed to find out the dynamic response of the container floor and its relation to the machinability. This method provides a good understanding of the vibration behavior of the container floor due to the sound source. To this end, the finite element method is used to derive resonance modes of the floor considering the boundary conditions and imposed mass caused by the abrasive particles. The floor was meshed by the quad shell element with 0.1 mm thickness and considering the physical properties presented in Table 2.
Physical properties of container floor.
Single point constraint (SPC) was applied around the model to simulate floor fixation. Moreover, as the weight of the abrasive particles has a significant role in the vibrational features, in this study, a non-structured mass (NSM) element was employed to simulate the effect of the particle weight. To this end, particle mass was applied directly to each selected elements of the floor. Figure 2 shows the FEM model of the floor and its constraints. To perform modal analysis, the Lanczos algorithm was chosen to obtain resonance frequency modes.
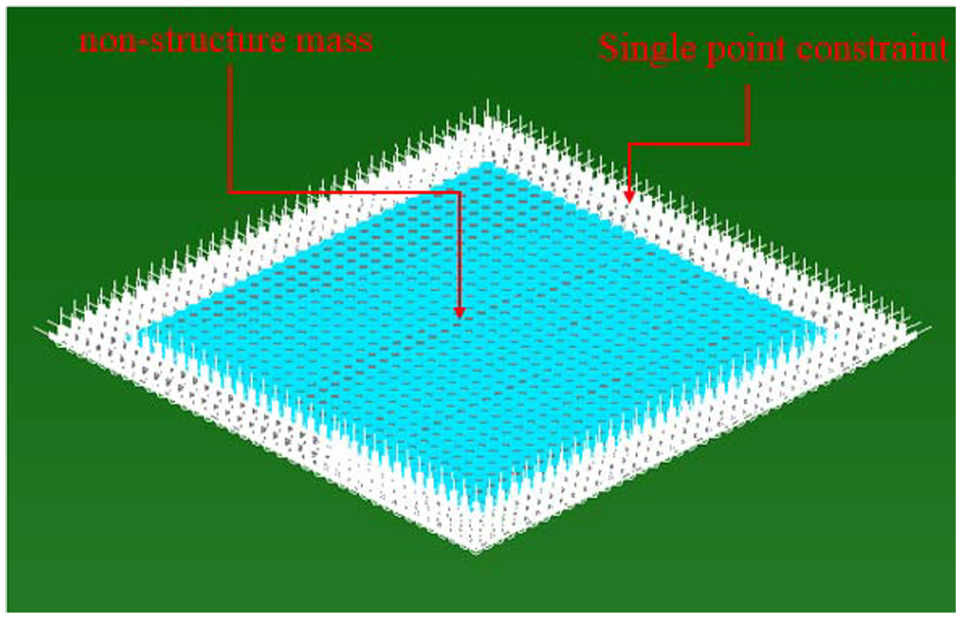
FEM model of the container floor.
To estimate the dynamic response of the floor using the boundary element method, two categories of data are required: first, modal frequencies of the floor that are achieved from FEM simulation, and second, the acoustic power of the excitation source.
To obtain acoustic power characteristics of the sound source, the experimental tests were conducted. For this aim, acoustic measurements were performed in an anechoic chamber using an acoustic camera for different signal shapes to estimate acoustic power. The V1.1 MICROFLOWN acoustic camera was utilized for acoustic measurements, which included a CCD camera, supporting grid, signal router box, Heim data acquisition signal module, Heim data acquisition power supply module, and pressure-velocity(p-v) sensors. The acoustic camera was located above the sound source, in the position of the powder container, to measure the radiated acoustic power. Measurements were performed for all three signal wave shapes at swept frequencies. Figure 3 shows the experimental setup for acoustic measurements of the sound source and acoustic power level for different wave shapes.
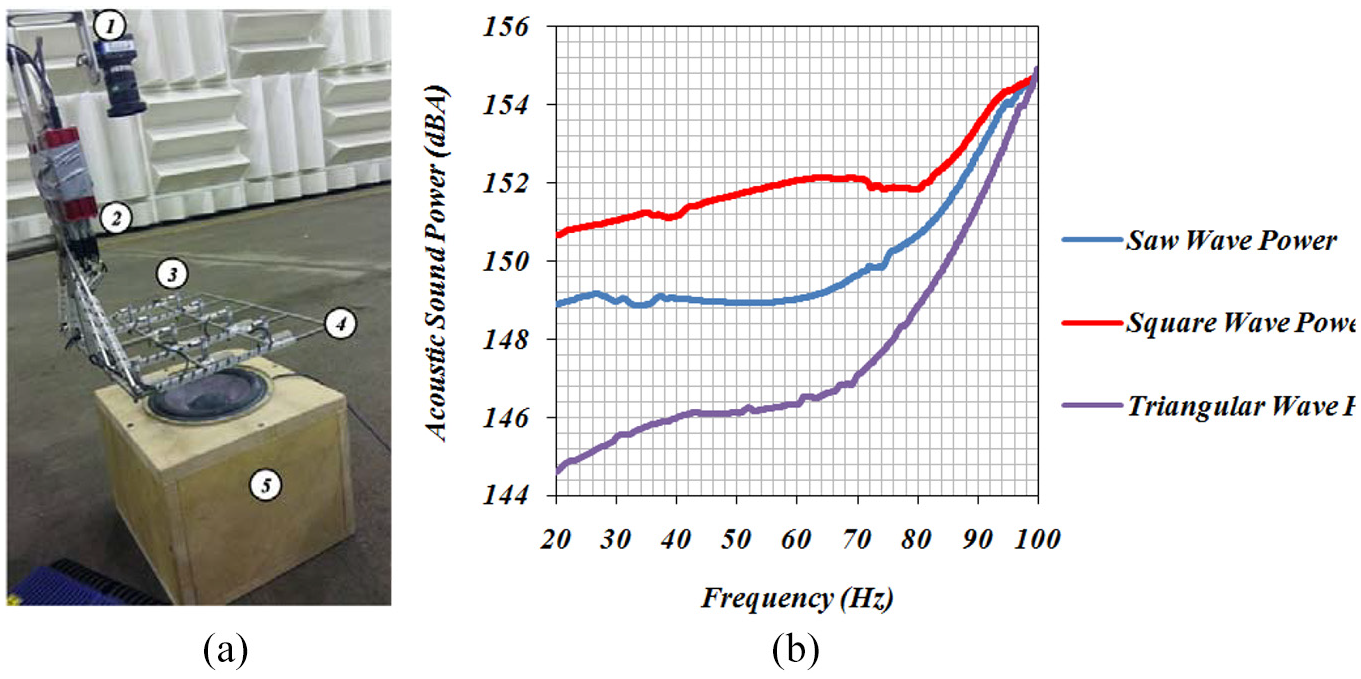
(a) Acoustic source power measurement test setup (includes: 1 – CCD camera, 2 – signal router box, 3 –p-v sensors, 4 – supporting grid, 5 – sound source) and (b) acoustic power level versus frequency curve.
According to Figure 3, the value of acoustic power increases by growing up the frequency, but by increasing the frequency, the difference of acoustic power reduces for various wave shapes. Measurements show that the square wave shape has the most energy in comparison to the other wave shapes that are observed subjectively during the tests. The acoustic power difference between the square and triangular wave shapes at the frequency of 60 Hz is about 6 dBA, while this difference is about 2 dBA at the frequency of 90 Hz.
To build a boundary element model of the excitation source, a monopole acoustic source was exerted to the diffuse acoustic field, and the measured acoustic power was considered for this source. Figure 4 depicts the boundary element model of the floor.
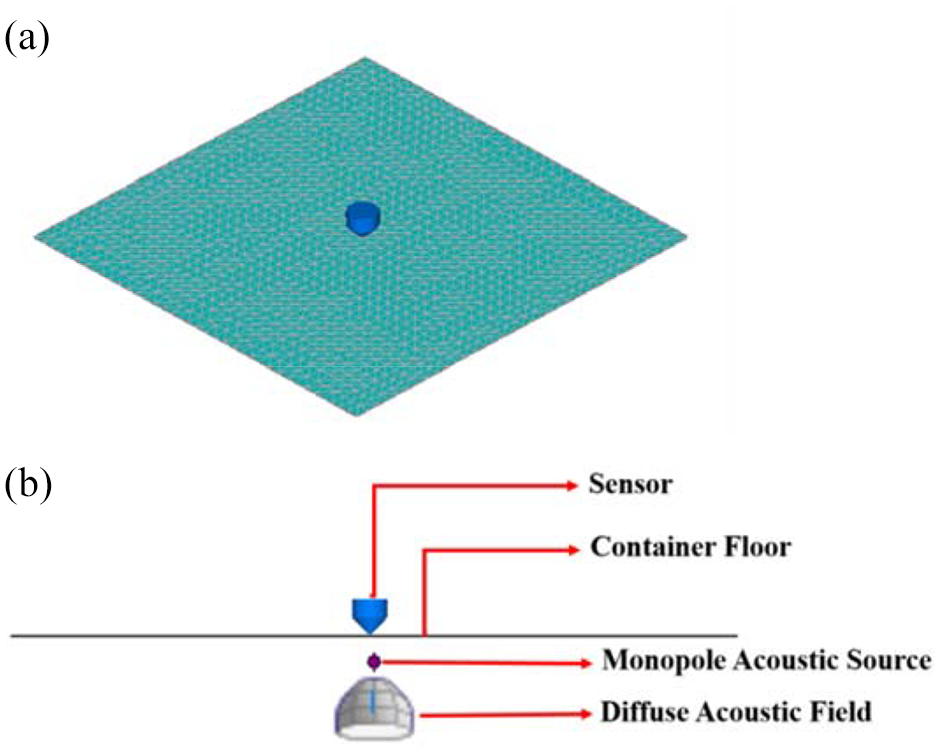
(a) Isometric view and (b) side view of boundary element model of the container floor.
Validation procedure
To verify FEM/BEM results, forced vibration at the center of the floor due to the acoustic excitation should be measured and compared to the numerical results. Attaching a conventional accelerometer sensor in this study has a significant effect on the vibration features of the floor due to its mass. Solaser Doppler vibrometry, as a non-contact technique, was established to measure vibration of the floor. Since in this method, the laser beam should be directed to the vibrating surface, the presence of powders in the container is a big obstacle. To overcome this problem, a thin and light rod was fixed at the center of the container using a cyanoacrylate adhesive and the laser beam was directed to it in order to measure the displacement. The Ometron type VH300+laser Doppler vibrometer (LDV), B&K data acquisition, and Pulse software were employed to measure the displacement, data collection, and signal analysis, respectively. Figure 5 shows the test setup for the validation of the numerical results.
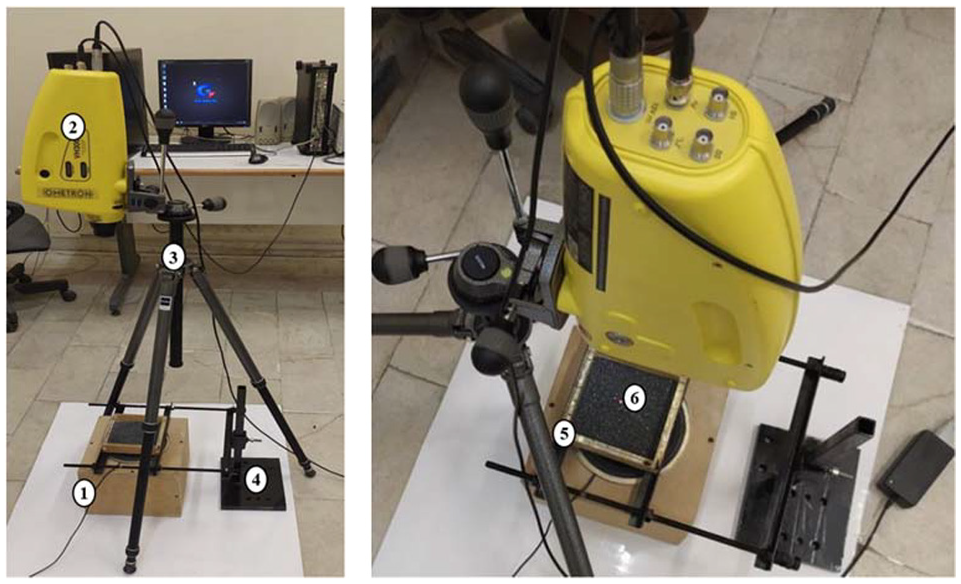
Experimental setup for verification tests (includes: 1 – acoustic source, 2 – LDV, 3 – Tripod, 4 – fixture, 5 – powder container, 6 – laser beam).
Responses of the floor were measured under different acoustic excitations. To this end, signals with different frequencies and shapes were generated by the signal generator and sent to the loudspeaker. Each test was performed at about 10 s with a sample rate of 800.
Results and discussion
Process evaluation results
In order to study the effect of the process parameters on the surface roughness of the PA workpieces, it is needed to determine a quantitative term to compare the surface quality characteristics. For this matter, the machining efficiency term was defined as equation (10) to survey the effect of the process parameters on the surface characteristics of the workpieces.
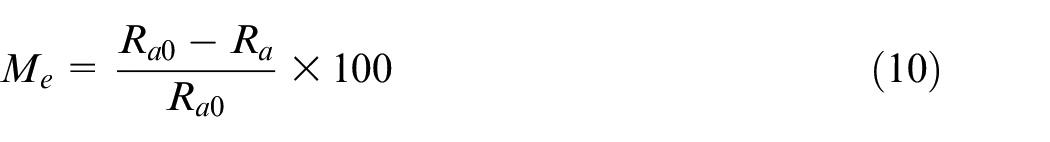
Where
Machining efficiency results for test configurations.
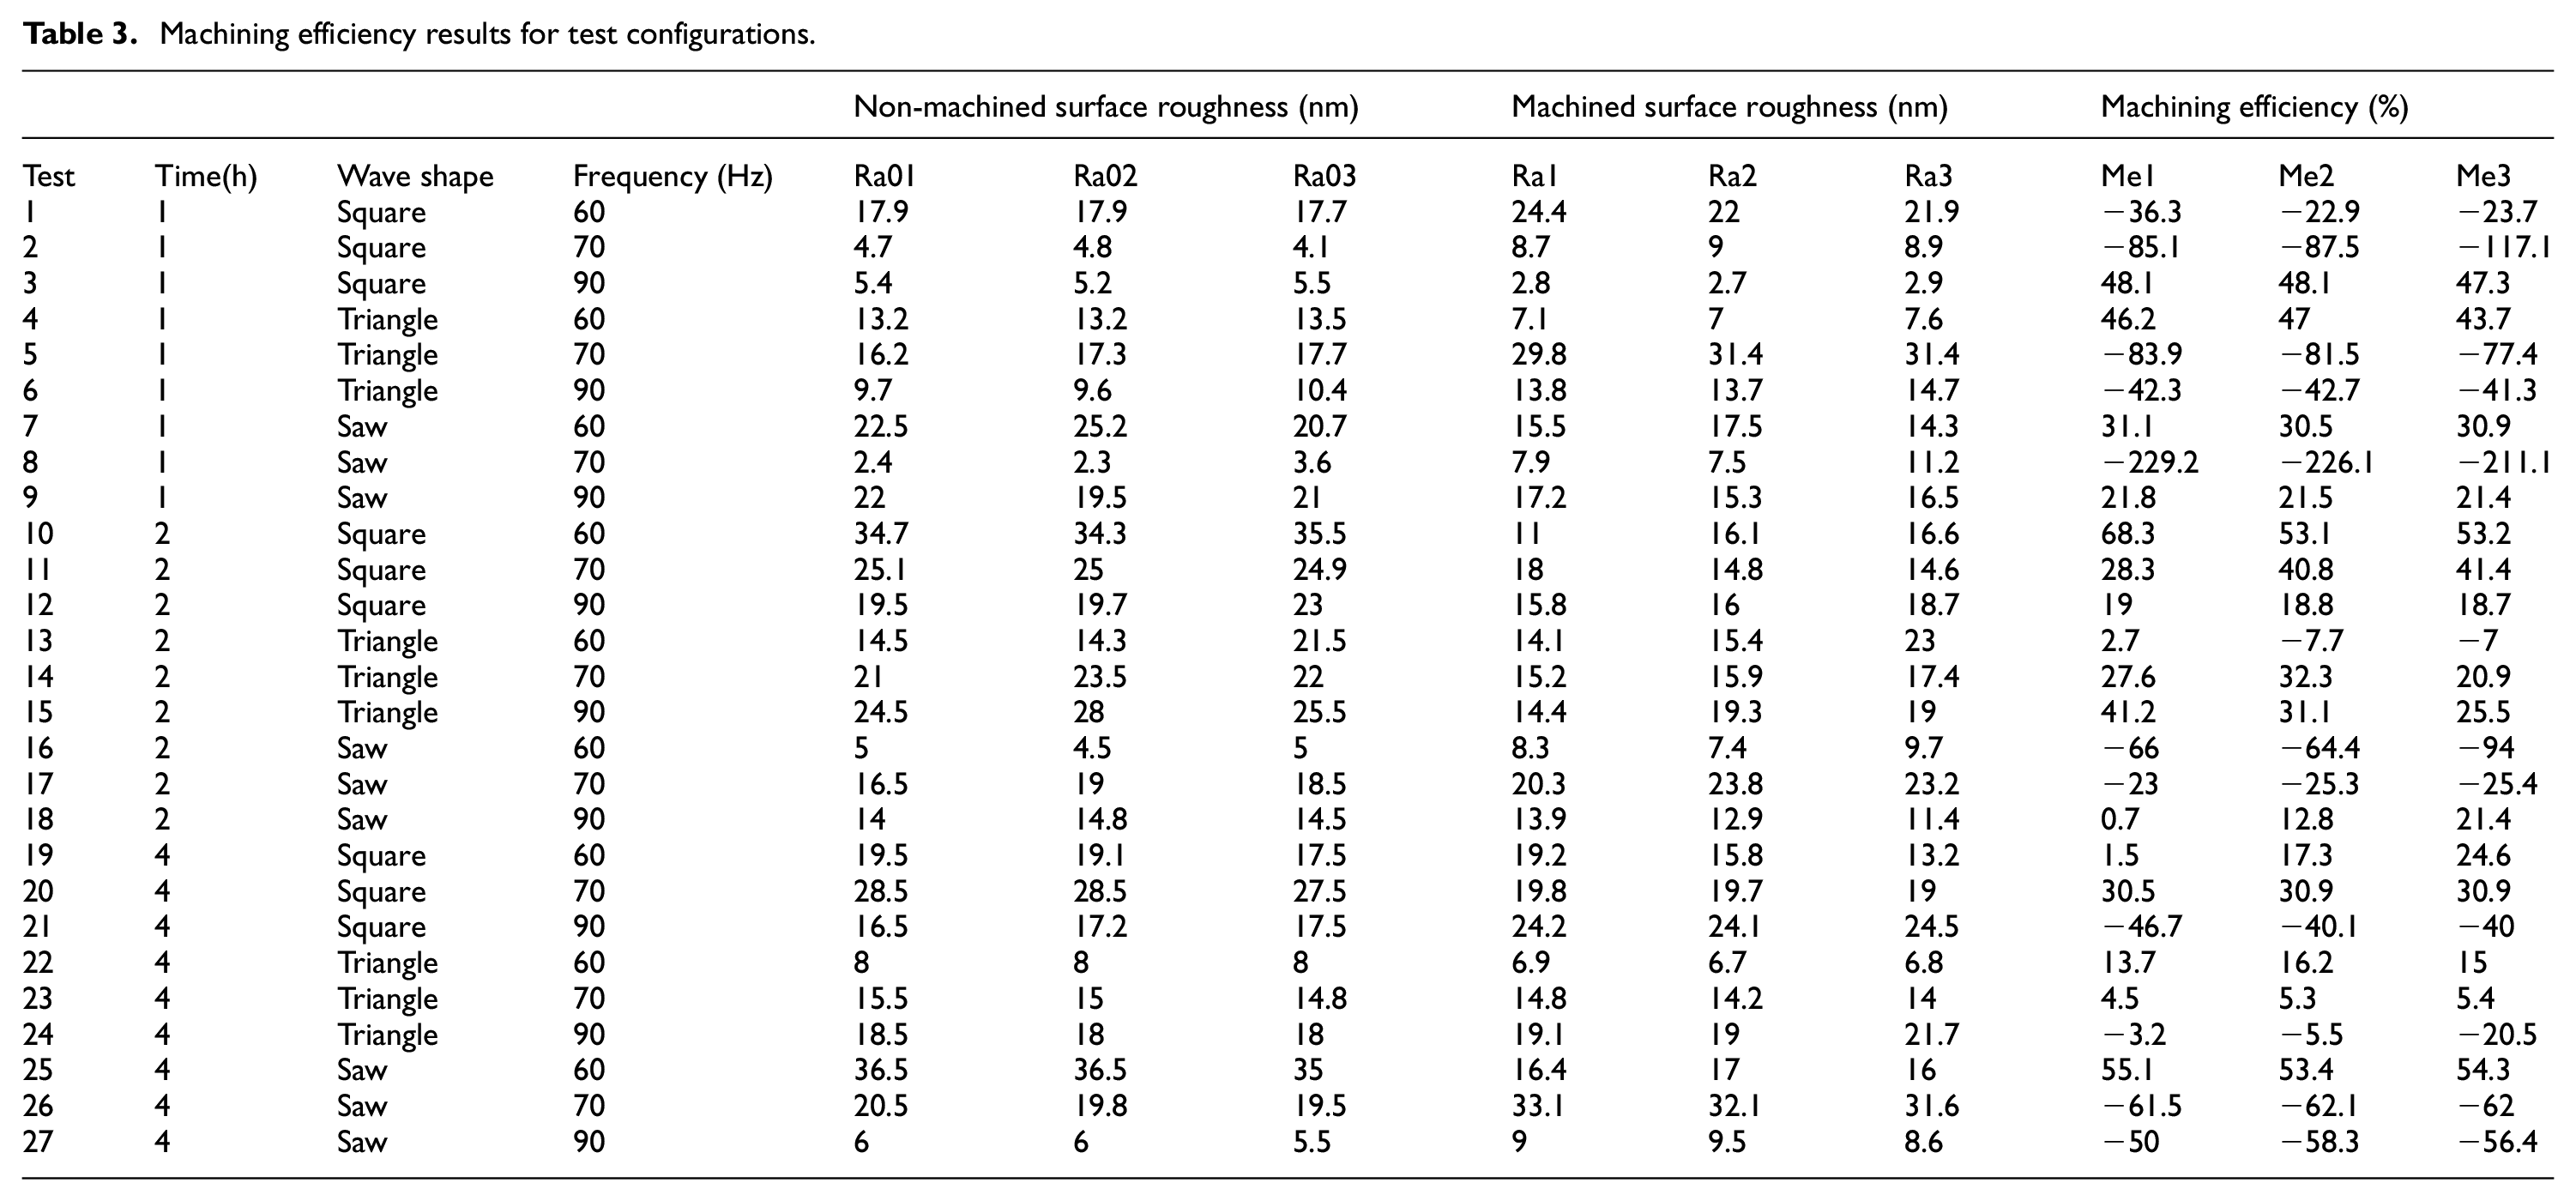
According to the experiments (Table 3), the machining efficiency of the process is not constant and the quality of the final machined surface depends on the initial roughness and process parameters. At the first look at Figure 6, it can be found that machining efficiency depends on the initial roughness of the workpiece. For initial roughness more than 22 nm, this method enhances surface quality regardless of process parameters, but for initial roughness smaller than this value, choosing suitable levels for process parameters plays a crucial role.
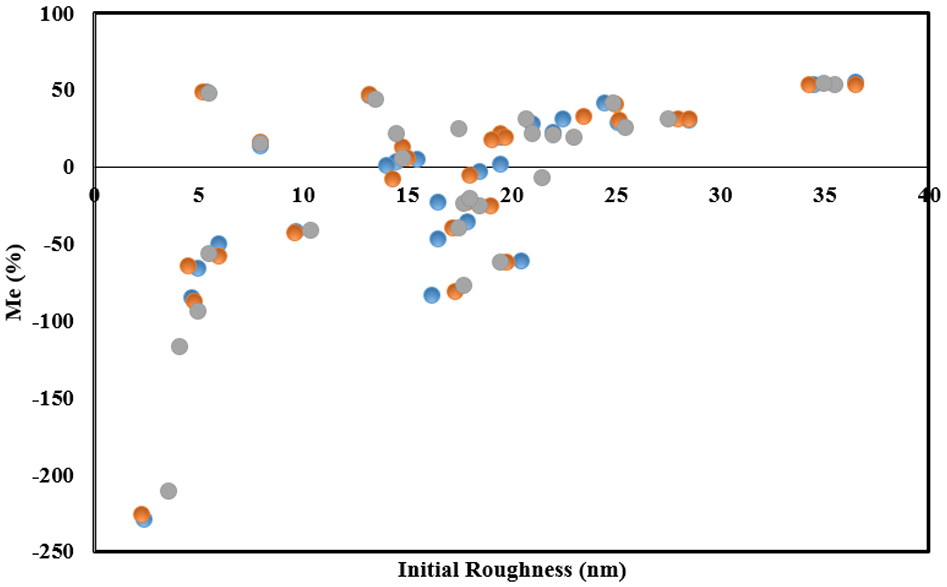
Initial surface roughness versus machining efficiency.
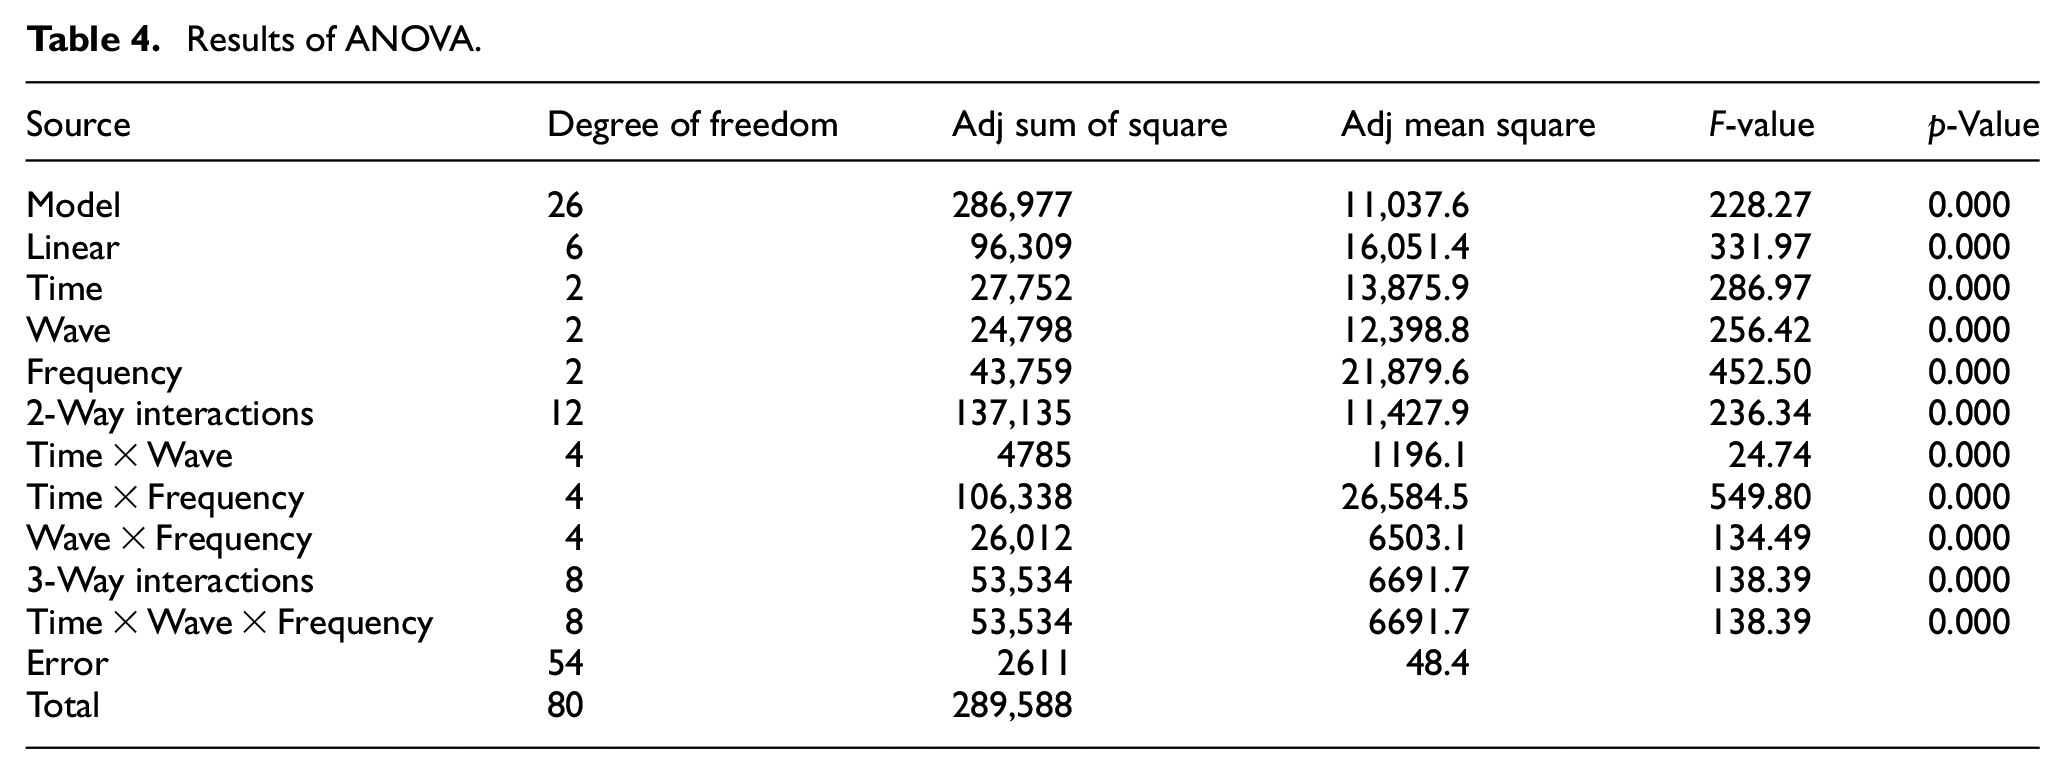
Analysis of variance (ANOVA) was performed to evaluate the main and interaction effects of the process factors and the results are shown in Table 4. For this matter, blocking was carried out on the repetitions of the machining efficiency measurements. 49 R2 and Adjusted R-square 49 from ANOVA are 99.10% and 98.66%, respectively, which show that the achieved regression model fits data appropriately.
Results of ANOVA.
According to the main effect plots in Figure 7, the roughness of the surface was increased after 1 h of the process, but by increasing the processing time up to 2 h, this term was reduced and the surface quality of the workpiece was enhanced. For the wave shape factor, the square wave provides the best surface quality, while the saw wave has the least machining efficiency. Concerning the main effect plots, the maximum machining efficiency is generated when the excitation frequency is set to 60 Hz while employing a frequency of 70 Hz causes that the machining efficiency takes a minimum value. In a matter with several factors, the interaction effect has a crucial role in the response. In multivariable topics, the interaction effect has more superiority than the main effect to choose the optimum process factor. 49
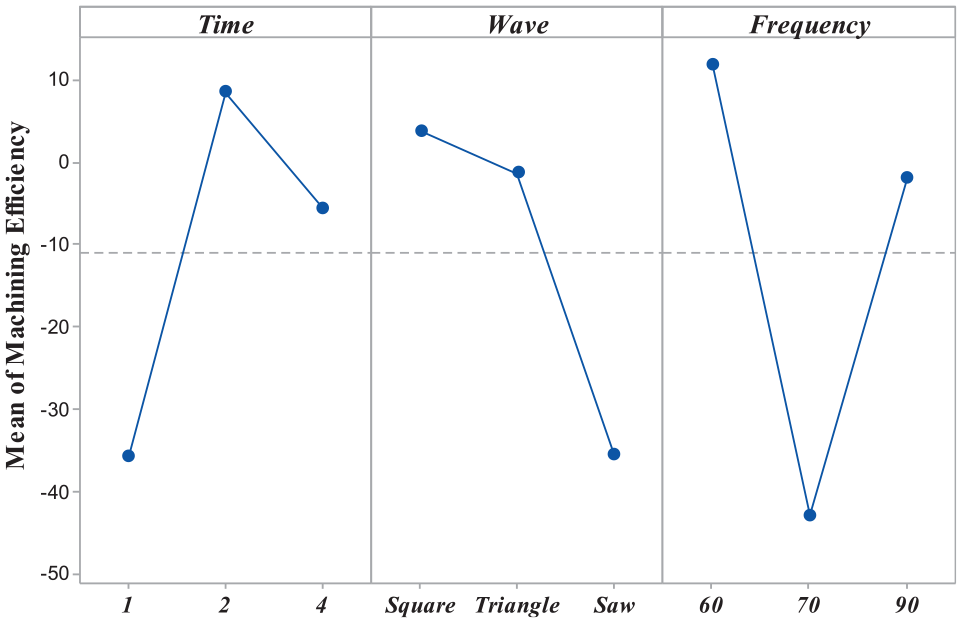
Main effects plot for machining efficiency.
In the time-wave interaction plot in Figure 8, triangular and square waves are in good conformity with the time main effect plot in Figure 4. It shows that by using square and triangular waves machining the workpiece for 2 h provides better efficiency than other times. However, for a saw wave, although increasing the time enhances machining efficiency, employing this wave shape reduces surface quality in comparison to the unmachined workpiece. In addition, it can be observed that the square wave shape has more ability to improve the surface quality in comparison to other wave shapes. The frequency-wave interaction plot shows that setting the excitation frequency at 60 Hz for triangular wave provides the best surface quality, but considering the interaction of time-wave and wave-frequency simultaneously, square wave causes better efficiency in machining workpieces. In conclusion, regarding all the above mentioned descriptions, machining PA workpiece by setting the acoustic source with a square wave at 60 Hz for 2 h provides better surface quality in comparison to the other configurations.
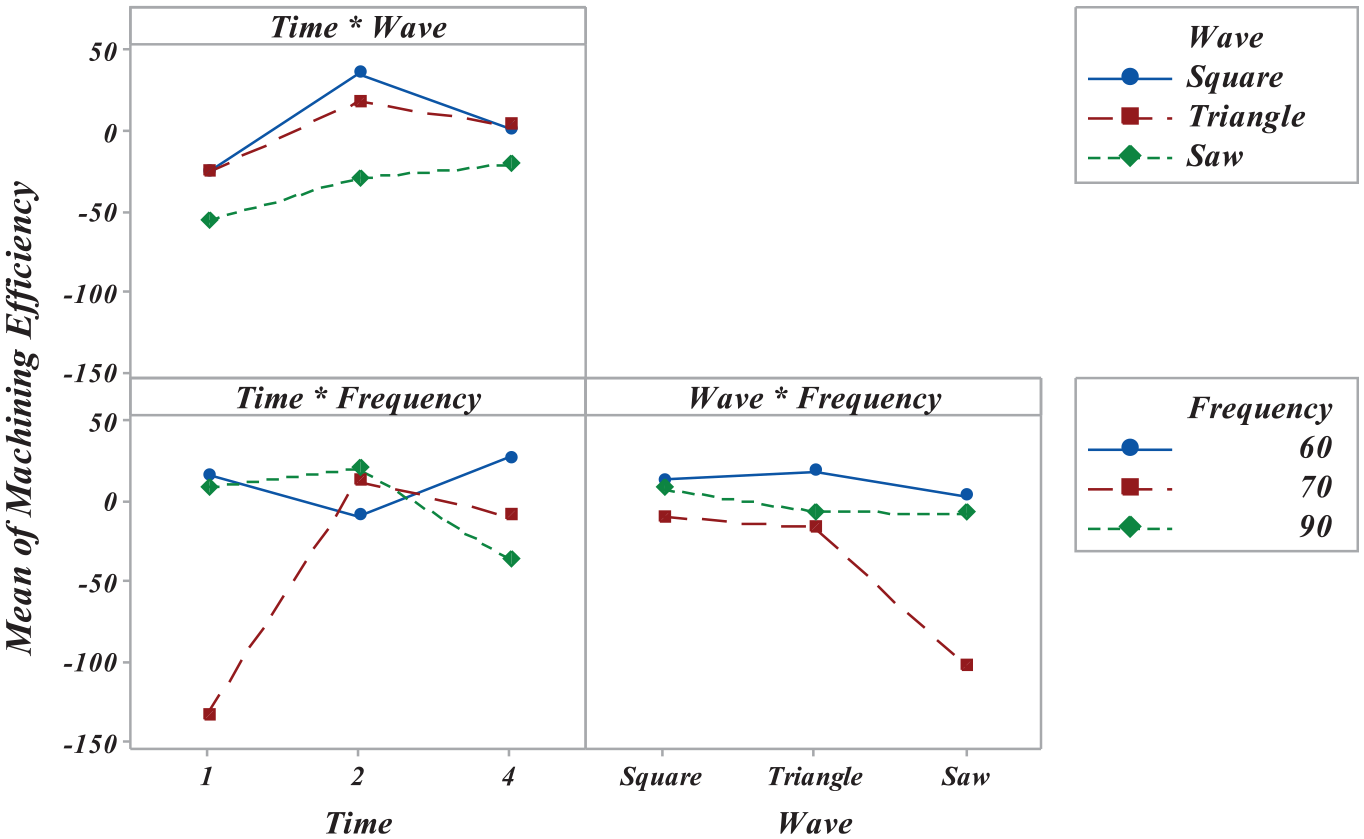
Interactions plot for polishing efficiency.
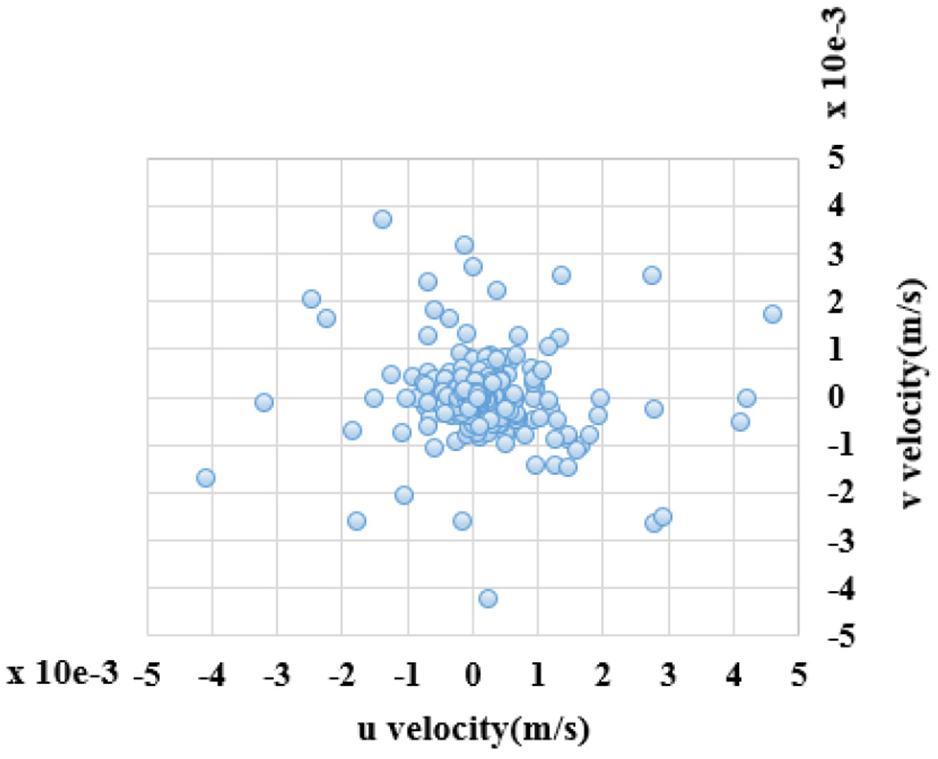
After finding the optimal configuration of the process, studying the mechanism of the machining provides a good understanding to choose the appropriate parameters. The mechanism of the machining process using particles generally is based on abrasion and micro-cutting. The ability of this method for chip removal depends on the different factors such as abrasive particle attributes and process parameters. In this work, irregular-shaped SiC particles were employed as the abrasive. Therefore, the collision angle and contact forces with the workpiece have a significant effect on surface roughness. Harsh impact with sharp edges not only removes surface peaks, but can also cause a deep scratch on the surface. The contact loads between the abrasive particles and the workpiece depend on the velocity of the particles. Y and Z components of the velocity (Figure 9(a)) have a significant effect on the abrasion mechanism, but the X component of the particle’s velocity generally causes indention and deep cutting on the workpiece. The magnitude and direction of the velocity components depend on the interaction of the wave shape and frequency. According to measurement and simulation results, which are presented in section 4.2, the velocity of the particles in the Z component for the square wave is higher than the other wave shapes at the corresponding frequency, which is due to a higher level of acoustic power. To study X and Y velocity components, particle image velocimetry (PIV) was conducted to survey the velocity of the particles close to the workpiece during the process. According to Figure 9, it is observed that the Y component of the velocity of the particles at 60 Hz for the square wave is greater than other cases, while at 70 Hz for the saw wave (worst machining efficiency case) the X component has the highest value. It was found that abrasion has a dominant role in machining due to the high values of the tangential velocity components of the particles, especially in z direction. On the other side, when the saw wave is used at 70 Hz, because of the higher x component velocity, particles collide with the workpiece with a higher level of normal contact force. In addition to the small initial roughness of the workpiece, in this case, the greater value of the normal contact forces causes deeper penetration of particles and lower surface quality for the workpiece.
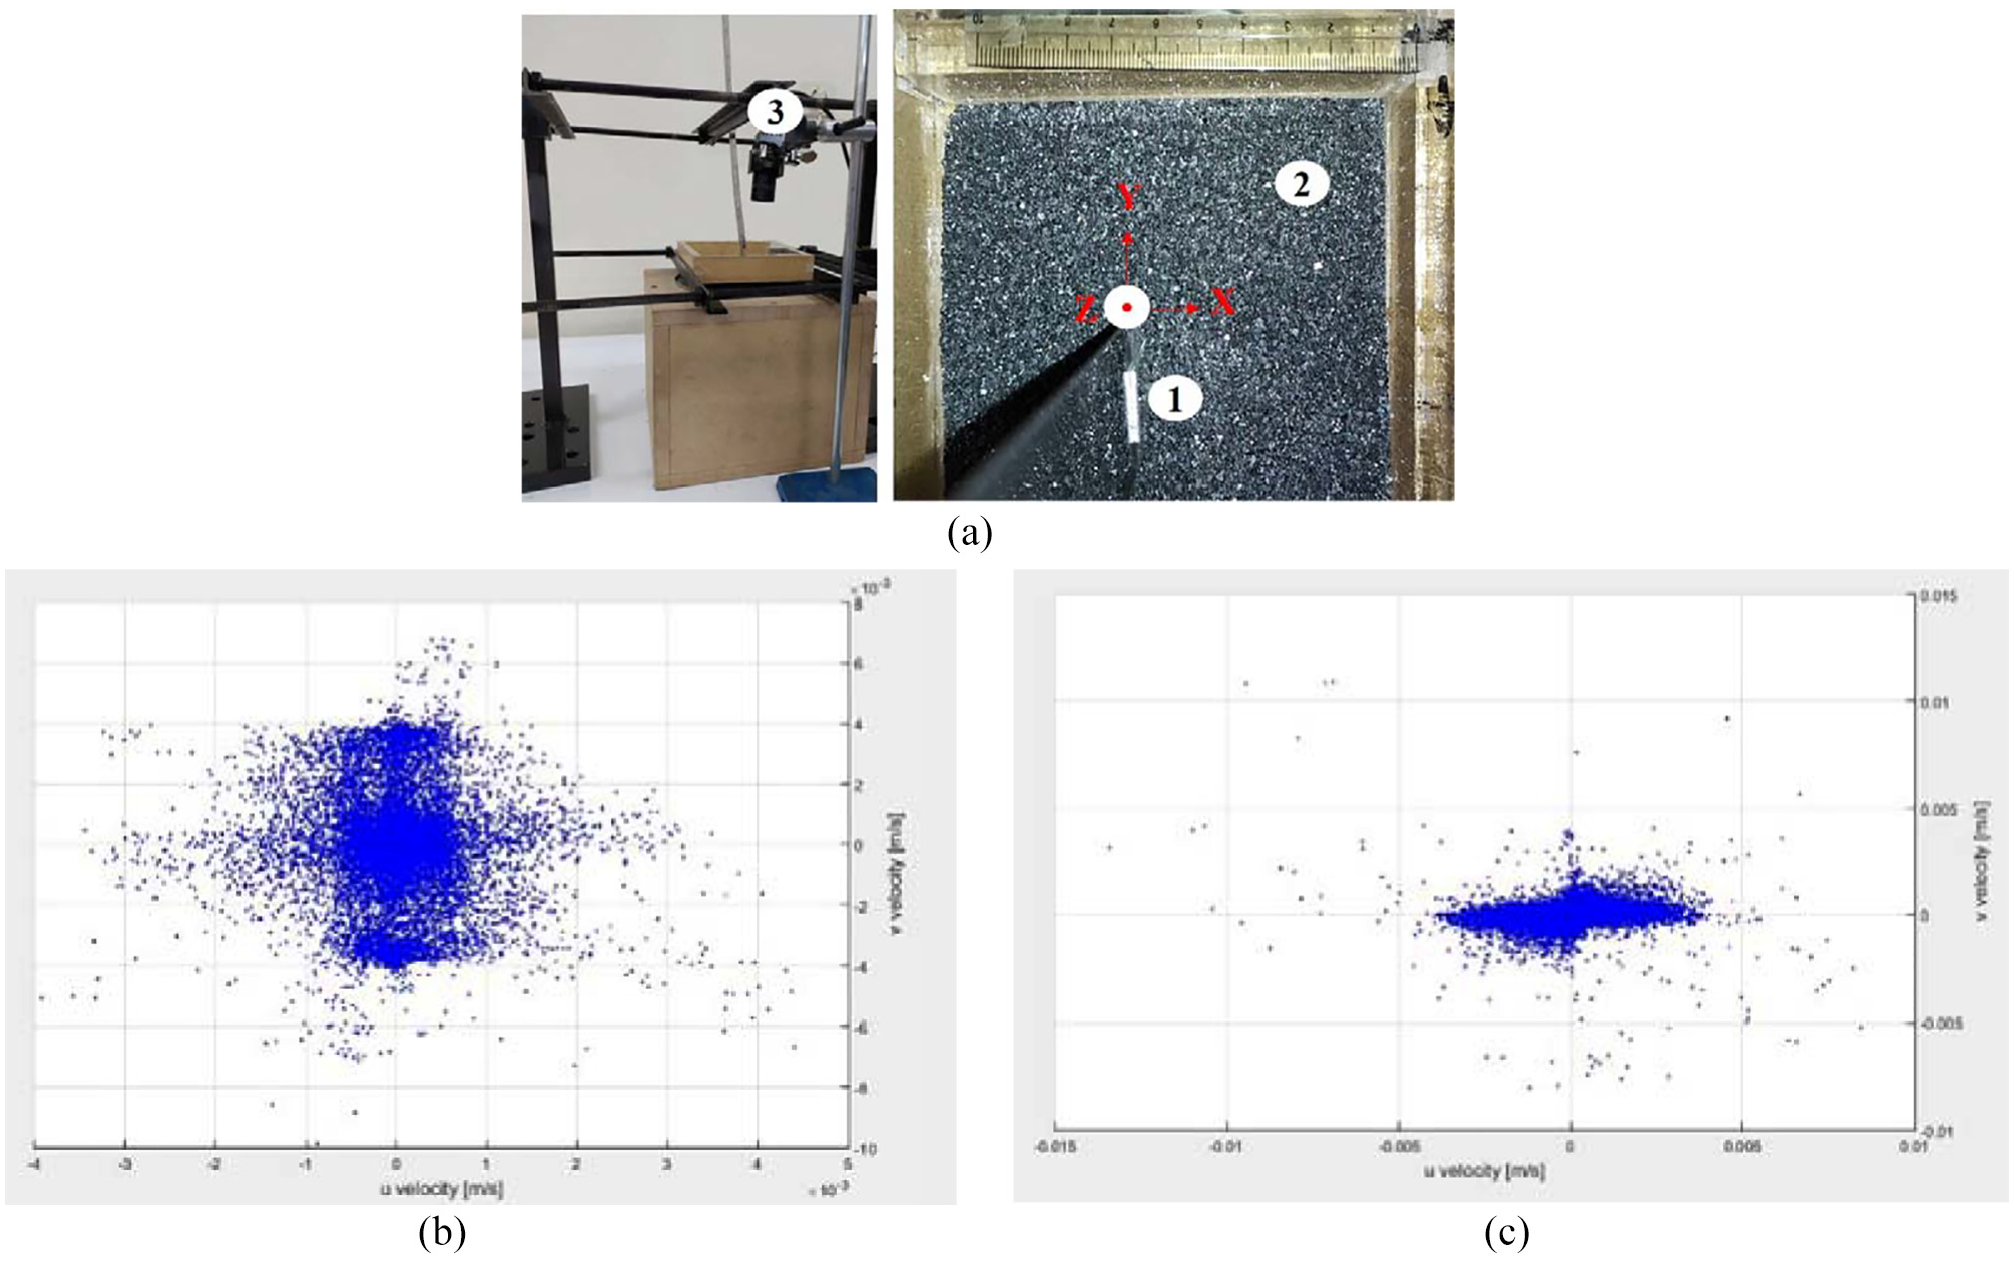
(a) PIV setup: 1 – workpiece, 2 – abrasive particles, 3 – High Speed Camera, (b) Velocity distribution in X(u) and Y(v) directions for square wave at 60 Hz, and (c) velocity distribution in X(u) and Y(v) directions for saw wave at 70 Hz.
Moreover, regarding main and interaction time plots, it is observed that for most of the experiments during the two first hours of the machining, peaks are removed due to the abrasive contacts, and the surface profiles are flatted for most of the cases. But by increasing the processing time up to 4 h, the cutting mechanism causes the reduction of the surface quality by creating scratches.
Numerical simulation results
In order to verify the numerical results, simulated responses of the floor were compared with measured data for the desired frequencies and wave shapes. Numerical and experimental results show that acoustic power affects the displacements of the floor. According to Figure 10, the overall displacement level for square wave shape in the desired frequency range has the highest value compared to the saw and triangular waves, which is due to the greater level of acoustic power. Moreover, displacement of the floor for the triangular waves has the least value due to the lower level of acoustic power for this waveform. Numerical results for displacements show about 34% overall deviation from experiments for all the nine measured layouts. One reason for such differences can be the non-uniform distribution of abrasive powders on the floor during the tests. Vibrations change the mass distribution on the floor. The minimum deviation between numerical and experiment results is about 14% that belongs to the saw wave at 60 Hz and the maximum value occurs when the floor vibrates at 90 Hz with a triangular wave shape and its difference is about 60%. But, the displacement response of the floor has not obeyed the trend of the exerted acoustic power. Since the response of the floor in different points is not the same at each frequency, so variations of the floor’s response at each point differ from acoustic power curves.
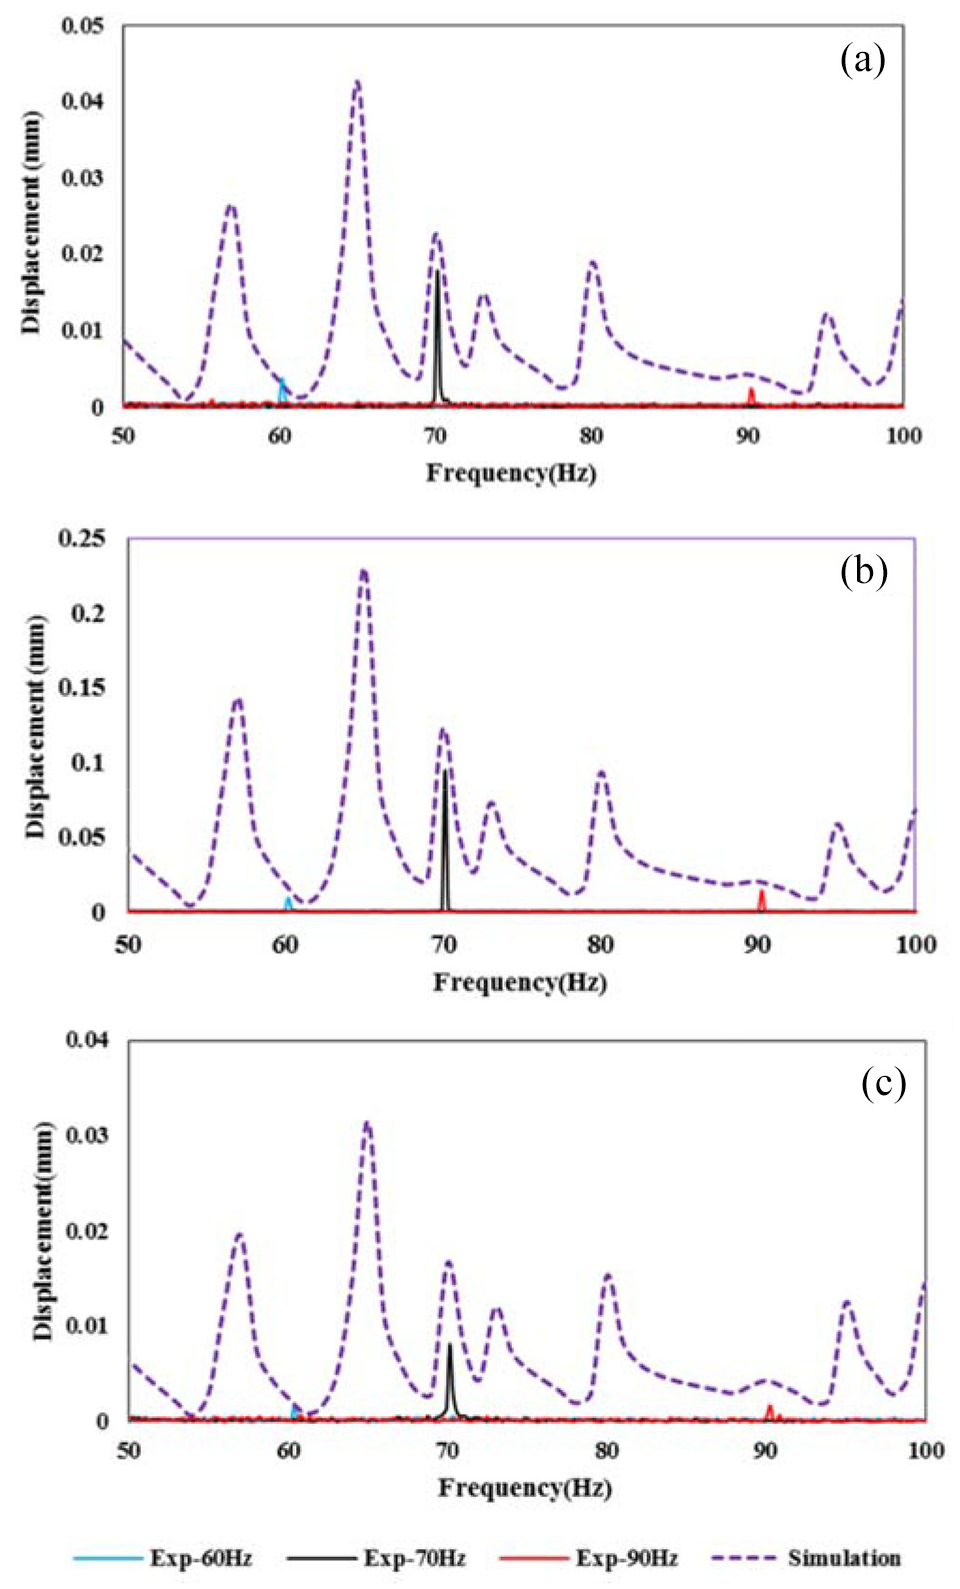
Numerical and experimental displacement of center of floor versus excitation frequency of acoustic source: (a) saw wave, (b) square wave, and (c) triangular Wave.
Numerical simulations depict that by increasing the frequency up to 100 Hz, the amplitude of displacements is reduced, but experimental measurement shows that the acoustic power increases by growing up the frequency in the studied range. The level of displacement in the chosen range, for saw and triangular waves, is close to each other and is significantly lower than the square wave. For all three waves, the maximum amplitude of displacement on the center of the floor occurs at 65 Hz. Regarding main and interaction effects in the DoE section, the square wave, in which the maximum response of the floor happens, has significant potential for machining of workpieces. Comparing experimental results, it is observed that machining efficiency in the lower frequency band has more efficiency regardless of being positive or negative. The simulation results also show that the level of the floor’s response in the lower frequency ranges has higher values in comparison to the upper range.
To find out a better understanding of the floor response due to the excitations, the velocity distribution was investigated. With regards to the velocity response of the floor in Figure 11, which is due to the imposed acoustic excitations, although the magnitude of the response differs for corresponding points in the floor, the total pattern of the floor response is not changed for each frequency with wave shape. According to Figure 11, the response frequency for the square wave is at a higher level than the other wave shapes all over the floor. Regarding to this figure, the maximum velocity for abrasive particles around the workpiece is supplied by setting the excitation frequency at 70 Hz. Comparing the frequencies of 60 and 90 Hz shows that the response value of the velocity at the center of the floor is higher at the excitation frequency of 90 Hz, but the overall velocity of the floor at 60 Hz frequency response has a greater value.
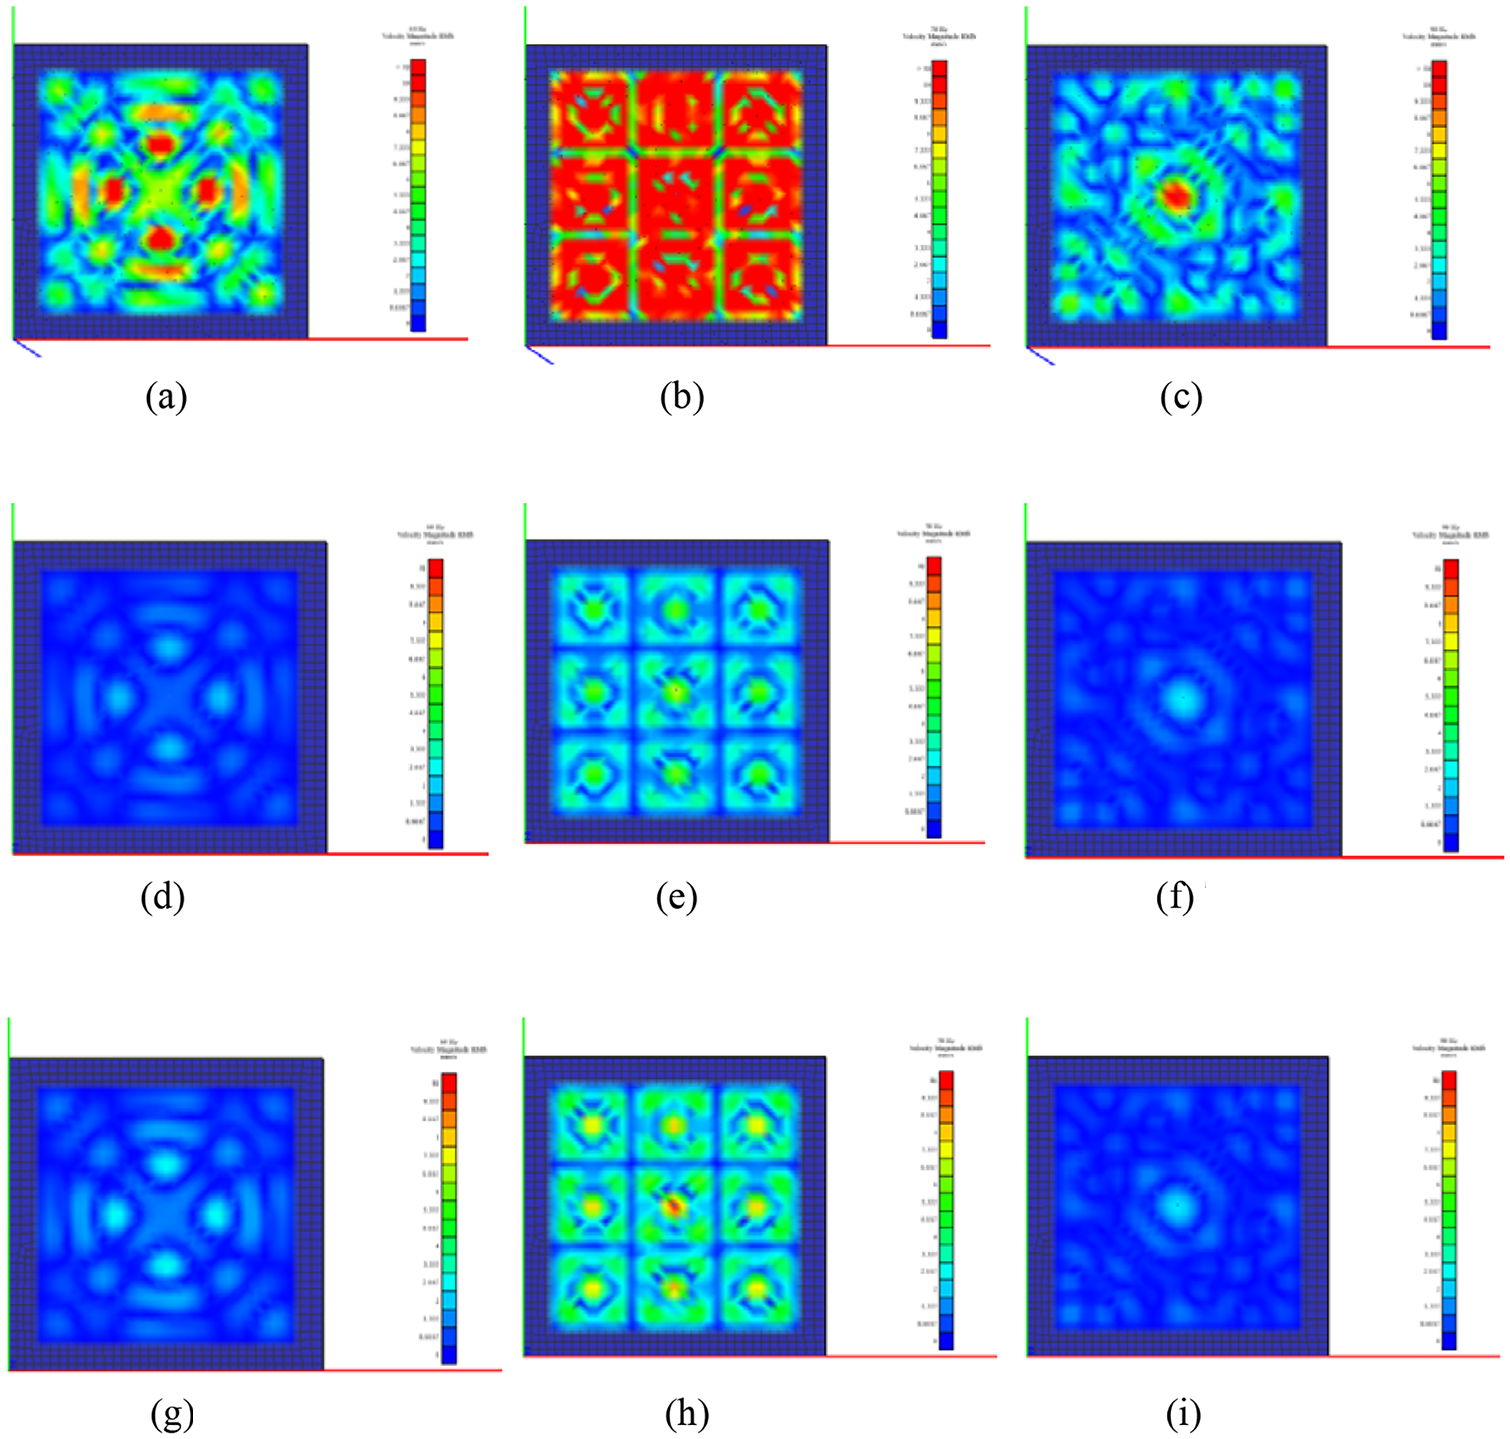
Velocity response of the floor under acoustic excitation: (a) square wave@60 Hz, (b) square wave@70 Hz, (c) square wave@90 Hz, (d) triangular wave@60 Hz, (e) triangular wave@70 Hz, (f) triangular wave@90 Hz, (g) saw wave@60 Hz, (h) saw wave@70 Hz, and (i) saw wave@90 Hz.
Figure 11 demonstrates that at the frequency of 60 Hz, the maximum speed of floor occurs around the workpiece, but for two other cases, the velocity of the floor has the highest value at the bottom of the workpiece. Paying attention to the experimental results, the machining efficiency at the frequencies of 60 and 70 Hz possess a higher value due to the upper level of the kinetic energy of the particles. Moreover, enhancing the surface quality is a sensitive term that depends on the combination of the wave shape and frequency.
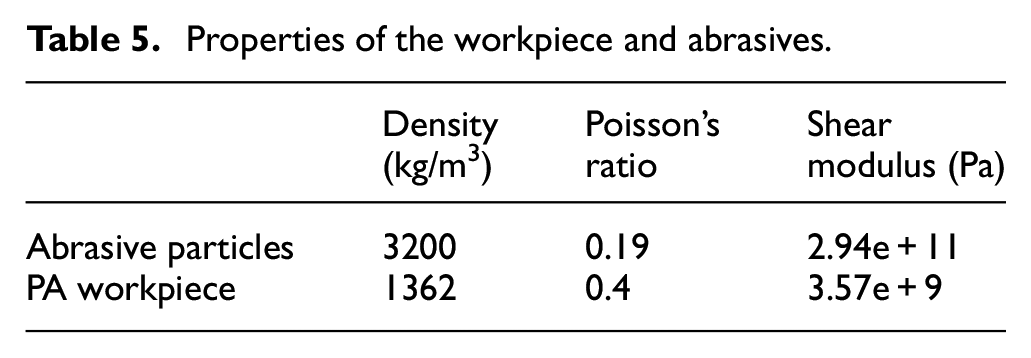
To find out the pattern of particles motions near the workpiece and the mechanism of the machining during the process, the discrete element method (DEM) was employed. As modeling the whole volume of the container consumes a lot of computational time and cost, a domain with dimension of
Properties of the workpiece and abrasives.
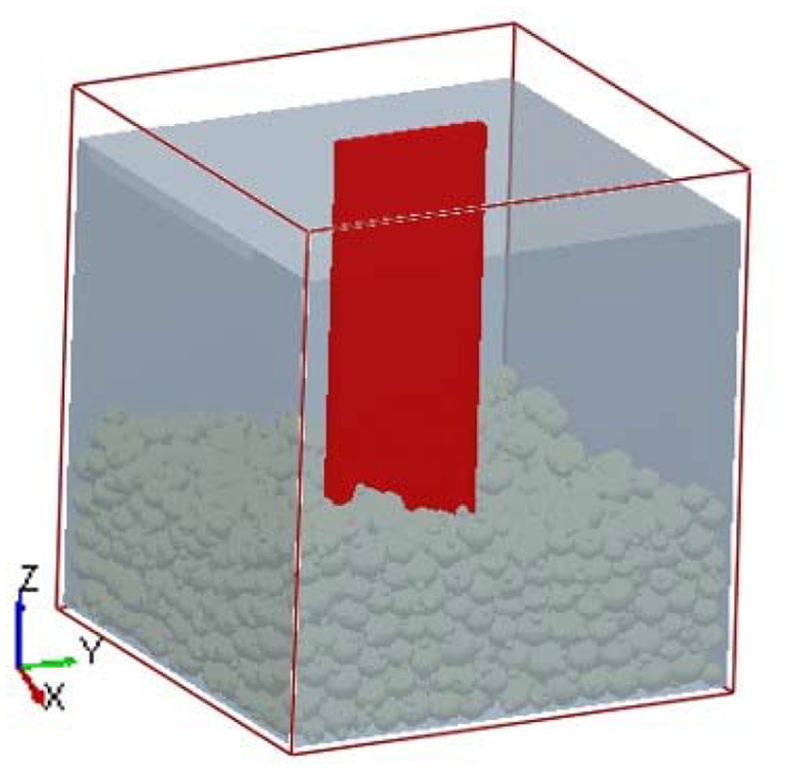
The position of the workpiece in computational domain.
In this study, boundary conditions of the workpiece and the container’s walls were chosen fixed and the motion of the container’s floor was set as harmonic displacement. The amplitude and the frequency of the floor’s motion were considered regarding experimental test results. As SiC particles have irregular shapes and sizes, choosing the appropriate shape is a challenging task. To this end, packing simulation was conducted and validated with the experiment to find out the suitable abrasive shape. In the primary stage, the size of the 50 random particles was measured. The mean particle size was calculated 1.93 mm with a standard deviation of 0.33. The numerical results for different types of particles pattern show that modeling particle shape using three spheres, as shown in Figure 13, has a good agreement with the experimental result.
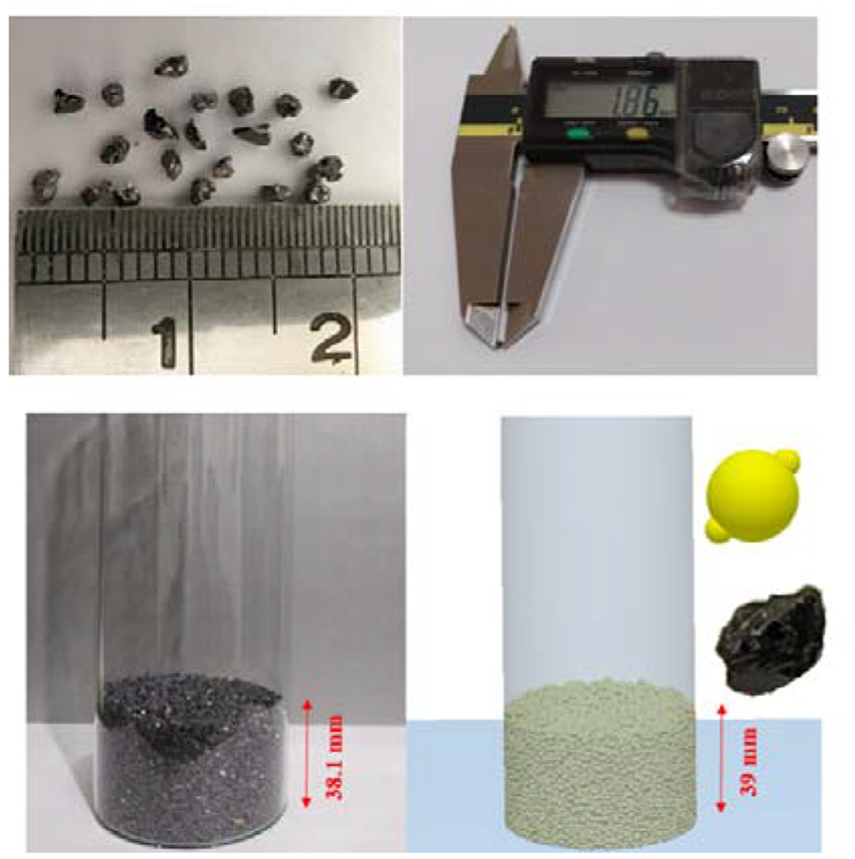
Particle size and shape determination for packing test.
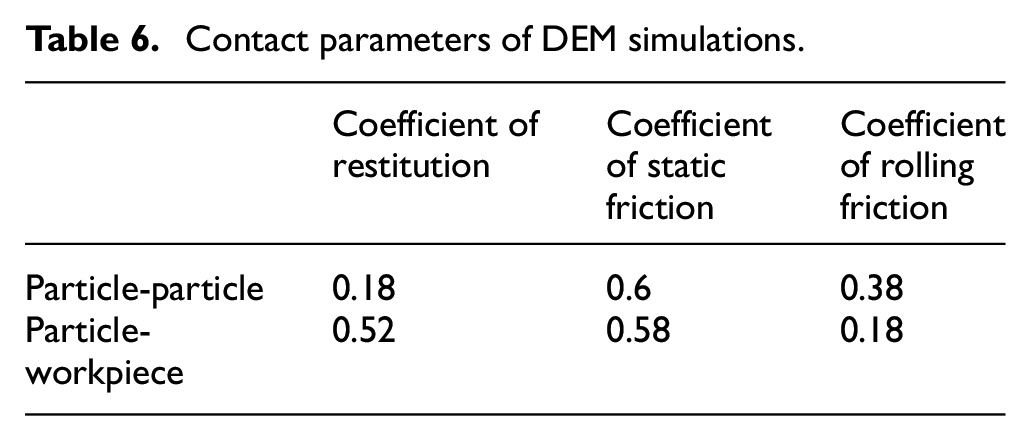
To study contact forces between particles and workpiece, Hertz–Mindlin50–52 with no-slip and Hertz–Mindlin with Archard contact models were considered for particle-particle and particle-workpiece contacts, respectively. Table 6 shows the contact parameters for the simulations. These parameters were derived from experimental tests and their procedures are presented in Teffo and Naudé.
53
The simulations were conducted for 1 s duration of the process with
Contact parameters of DEM simulations.
Particle velocity distribution around the workpiece shows a good agreement with experimental results that are achieved from PIV. Figure 14 depicts particle velocity distribution for the square wave at the frequency of 60 Hz.
Velocity distribution in X(u) and Y(v) directions for the square wave at 60 Hz.
As above mentioned, the contact loads of the particles depend on the velocity of the particles. Tangential directions (z and y) of particle velocity have the most contribution in abrasion, but the normal component causes the indentation of particles into the workpiece and micro-cutting. By considering the excitation of the floor in the vertical direction, the velocity of the particles in the z-direction is higher than that of the x and y-directions. Moreover, this component depends on the acoustic power and for the square wave, its value is more than two other wave shapes. Figure 15 illustrates the total velocity of the particles at 60 Hz for the square wave and 70 Hz for the saw wave in x, y, and z directions as the maximum and minimum machining efficiency cases, respectively.
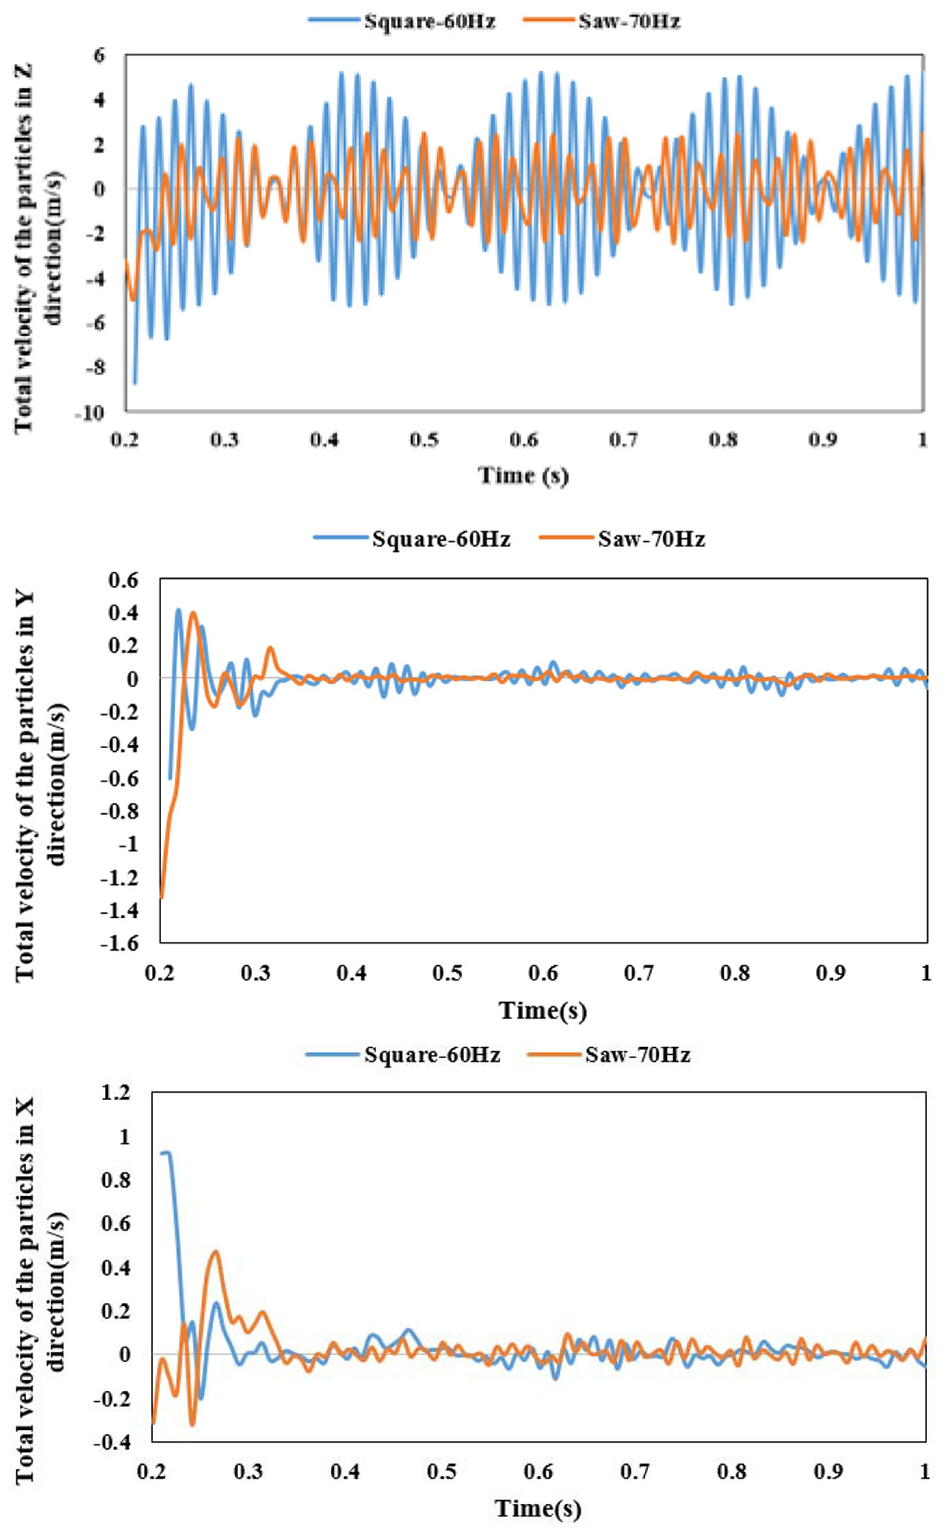
Total particle velocity in different directions.
Numerical results show that total velocity of particle in z-direction significantly has an upper level in comparison to the other components for all cases. For the square wave at 60 Hz, the total velocity of the particles in y and z components is bigger than the other configurations due to the high level of floor excitation. For a saw wave at 70 Hz overall x velocity component is a big value in comparison to the other cases. Investigation of the contact forces on the workpiece (Figure 16) shows that for the machining with a square wave at 60 Hz, the force imposed at z-direction has a bigger overall value, while the x component of the force, for the saw wave at 70 Hz, has a higher magnitude. According to these results, it can be found that abrasion plays a dominant contribution in machining workpieces in this process. On the other hand, particle indention due to the normal contact force creates some valleys on the surface of the workpiece, especially in the cases with small initial roughness, which leads to the reduction of the surface quality.
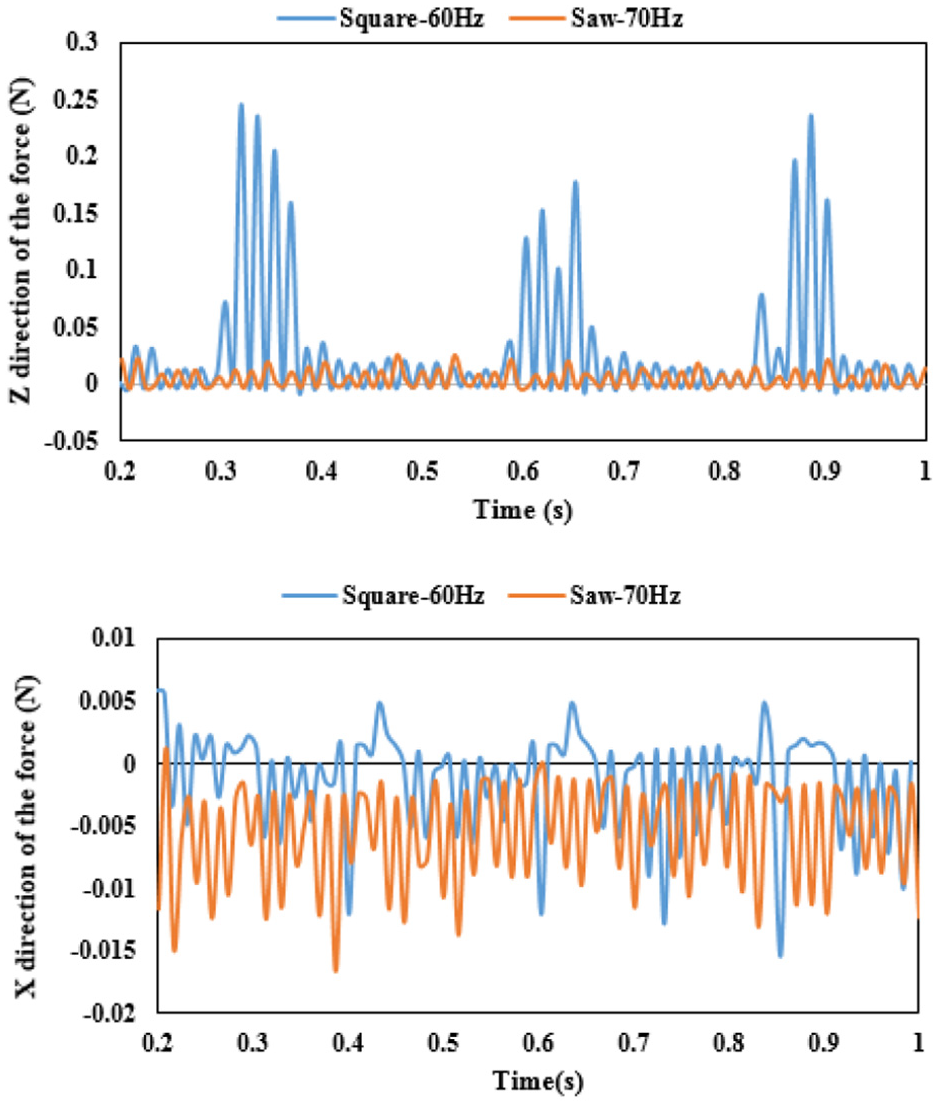
Contact force in X and Z directions.
Surface topology of the optimal case
In this section surface quality of the optimal sample is surveyed. For this goal, an atomic force microscope (AFM) was employed to observe the topology of the optimal case before and after the process, Figure 17(a) and (b), respectively. Measurements were performed on three different areas of a processed workpiece with dimensions of
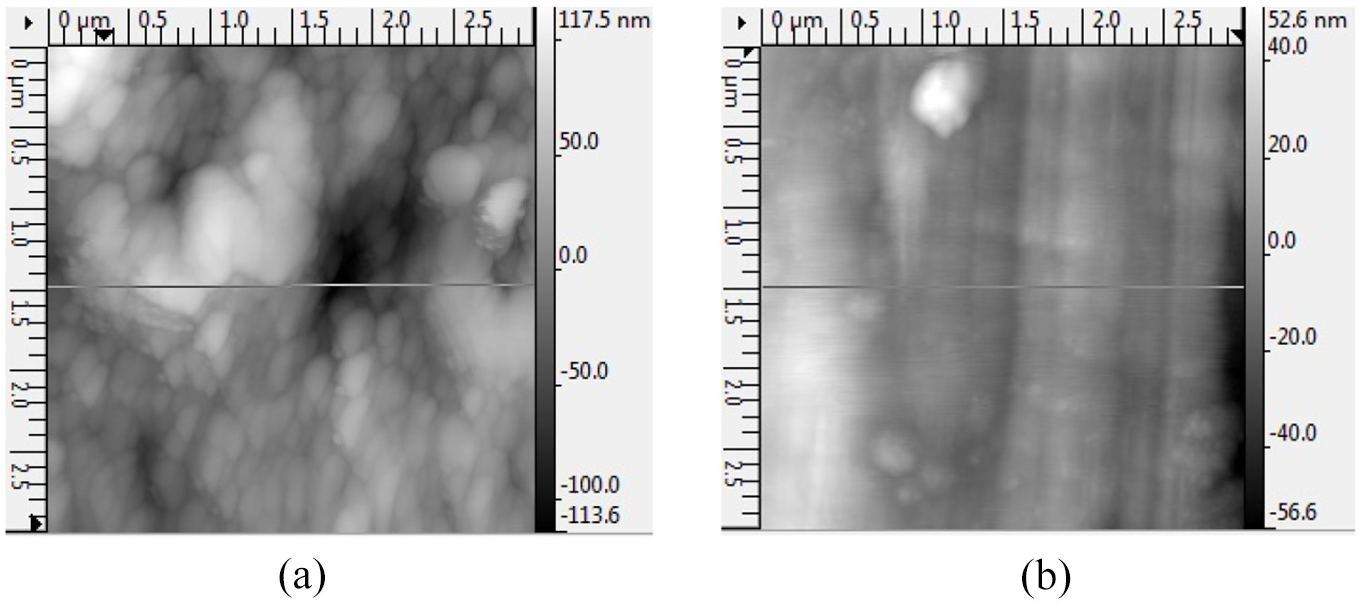
2D surface topography of the workpiece (a) before (b) after machining with a square wave at 60 Hz for 2 h.
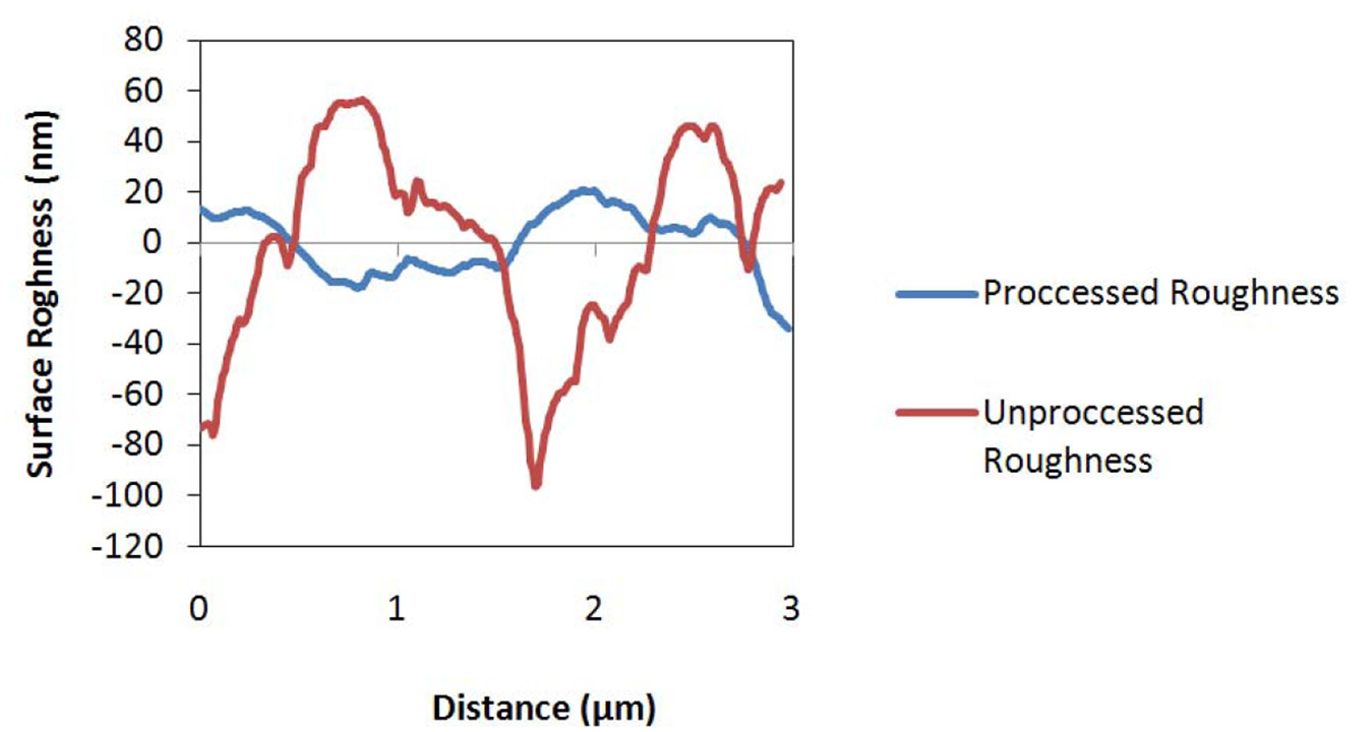
Roughness along the instant line before and after machining.
According to Figure 19, which shows the 3D topography of the sample before and after the process with the square wave at 60 Hz for 2 h, the roughness of the workpiece was reduced significantly during the polishing process and its uniformity was enhanced considerably.
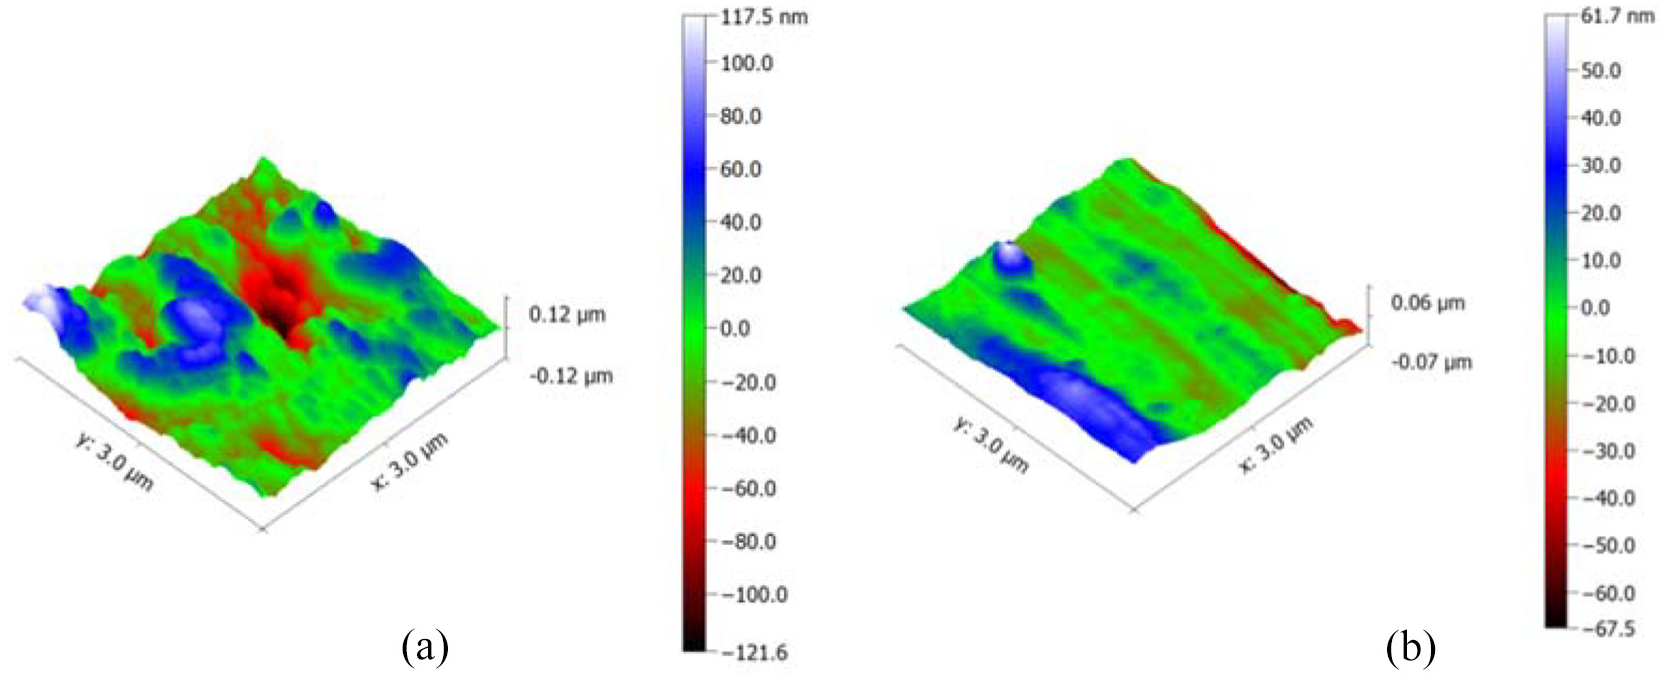
3D surface topography of the workpiece (a) before (b) after machining with a square wave at 60 Hz for 2 h.
To approve the enhancement of the uniformity of the workpiece after the process, a scanning electron microscope (SEM) was utilized. According to Figure 20, the polishing process has improved the surface quality, considerably. SEM images show that the improvement of the surface uniformity, which was observed in the AFM topography images at the scale of
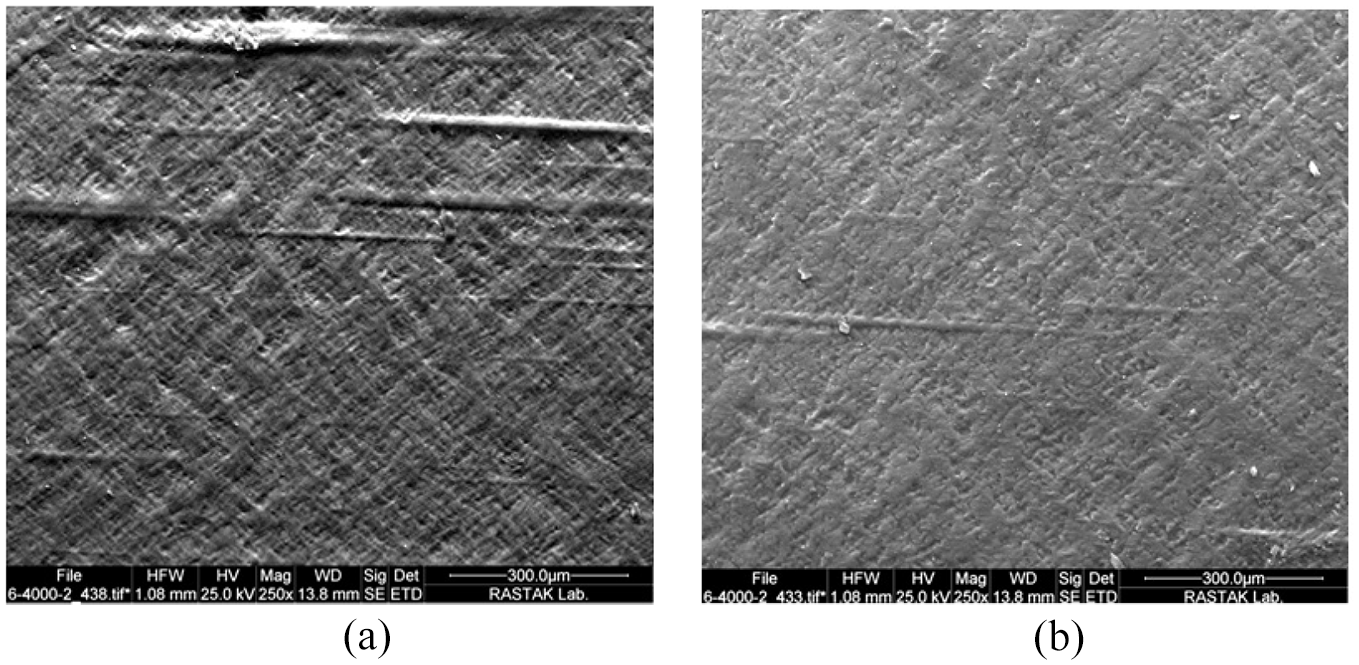
SEM images of the workpiece (a) before (b) after machining with a square wave at 60 Hz for 2 h by 250× magnification.
Conclusion
In this research, the capability of the acoustic energy for the machining PA workpieces is investigated. Experimental tests alongside a hybrid numerical simulation approach were employed to find out the effective parameters of the process. The conclusion of this study can be summarized as follows:
It was observed that acoustic energy can be employed to vibrate the particles for machining PA parts in nanoscale.
According to numerical and experimental results, the abrasion mechanism has a dominant role in polishing the parts using this technique. It is observed for the square wave at 60 Hz, tangential velocity and force components are in the upper level in comparison to other configurations.
It is concluded that normal contacts of the particles, not only cause material removal but also can reduce the surface quality by creating valleys, especially for small initial roughness. For the saw wave at 70 Hz the normal component of the contact loads has an upper level in comparison to other layouts.
It was observed that in addition to the initial roughness, all three considered process factors have significant roles in the machining of the workpiece using acoustic energy, and the final surface quality strictly depends on the suitable level of these factors. According to the main effect results, by increasing the machining time from 1 to 2 h the machining efficiency was enhanced from −35.9% to 8.5%. The efficiency of the saw wave was about −35.5%, while this value for the square wave was about 3.9%. Moreover, this term for the frequency of 60 Hz was 11.8% while for the frequency of 70 Hz was −42.9%.
From the interaction of factors point of view, it is observed that by setting the square wave at 60 Hz for 2 h the initial surface quality of the workpiece enhanced more than 50%.
Numerical simulations show that the level dynamic response of the floor due to the acoustic excitation is higher at the frequency range between 60 and 70 Hz and the machining efficiency of the workpiece can be reached to 116% in this range.
Footnotes
Declaration of conflicting interests
The author(s) declared no potential conflicts of interest with respect to the research, authorship, and/or publication of this article.
Funding
The author(s) received no financial support for the research, authorship, and/or publication of this article.