
Abstract
The solid state friction stir welding (FSW) has been recently the choice for joining of thermoplastics. The present work aims at analyzing the implementation of FSW in joining of different thermoplastics namely, polycarbonate and nylon-6 sheets using varying tool pin profiles, cylindrical, square, and triangular. The novelty of this article is the comparative assessment that has been made on the weldability of these two thermoplastics by determining the mechanical properties of the joint along with real-time acquired force, torque, and temperature signals. Higher axial force with reduced torque has been observed for nylon-6 as compared to polycarbonate. The joint efficiency was found to be maximum (>50%) at tool rotational speed 1800 rpm and welding speed 20 mm/min using square tool pin profile for each of the base materials. Minor undercut defect along with improved material mixing has been seen during the tool stirring process. The study would be helpful for the industries to choose thermoplastics based on their applications.
Introduction
In recent years, the thermoplastic polymers are found to be highly popular over metallic structural parts in automobile and aerospace sectors because of their relative merits like high strength to weight ratio, lightweight, and resistance to corrosion. The high-temperature polymers are classified as amorphous and semi-crystalline plastics, where the amorphous thermoplastic like polycarbonate is characterized by randomly ordered molecular structure without a specific melting point whereas the semi-crystalline thermoplastic like nylon is specified as uniformly ordered molecular structure with a sharp melting point. The amorphous polymers are isotropic in nature with better dimensional stability over the semi-crystalline plastics without the risk of distortion. These random order polymers are easier to thermoform and have superior impact strength which makes them suitable for structural applications. On the other hand, the ordered polymers have strong intermolecular force which makes them tougher and they have higher wear resistivity. Thus, these materials perform extremely well in applications involving wear, bearings, and structural loading. The coefficient of friction is also found to be less when using these ordered crystalline materials.
With such appreciable properties, the thermoplastics are being explored. However, when it comes to welding of these thermoplastics, it becomes a challenging task using fusion welding processes owing to their lower thermal conductivity. The solid state friction stir welding (FSW) has been found to be an alternative solution without melting the base materials. FSW was patented by “The Welding Institute (TWI), the UK” in December 1991. 1 It utilizes a rotating tool and translating bed to weld workpieces in various configurations.
FSW has been previously utilized to weld several semi-crystalline thermoplastics. The joint strength of high density polyethylene was significantly influenced by tool rotational speed 2 whereas tool tilt angle is found to be predominant on polyethylene welds. 3 The weld zone thickness reduces with higher tool tilt angle which in turn deteriorates the joint efficiency because of undercut welding defects. On the other hand, tool rotational speed and tool tilt angle both are found to be significant in case of polypropylene composites (with 30% chopped Glass Fibers) welded using FSW. 4 The cylindrical grooved tool was found to be improving the polymeric materials weld joint efficiency. 5 As the thermoplastics are characterized by low thermal conductivity with respect to metals, the heat does not get conducted, and gets accumulated at the weld region. Therefore, several advanced heat input methods such as indirect tool and base plate heating using hot air gun and heating plate have been proposed, through which, 20% improvement in joint strength was noticed. 6 The electrical resistance heating is also used to preheat the tool using a hot shoe through the tool shoulder before initiation of FSW process. 7 The material flow behavior in dissimilar polyethylene to polypropylene plastics welding by using different FSW tools was also investigated. 8 A hot shoe was proposed to be used along with the traditional FSW tool during welding of polypropylene.7,9 The tool pin’s contour profile was also found to be a major concern to improve the weld quality. The influence of left hand threaded pin was investigated with clockwise and anticlockwise rotations during welding of the nylon-6 sheets. 10
Similarly, the parametric study for evaluation of weld quality has also been investigated for joining of different amorphous polymers using FSW. The tool pin profile was found to be a prime factor in improving the weld joint quality in case of the non-crystalline materials.11–17 The joint efficiency of friction stir welded acrylonitrile butadiene styrene sheets (ABS) was found to be higher with conical tool pin as compared to cylindrical. 18 For welding the ABS sheets, a stationary shouldered tool with a threaded pin was also utilized. 19 The tool shoulder driven material almost melted followed by tool squeezed action formed the joint and pin driven flow in the thermo-mechanically affected zone (TMAZ) during welding of thick polymethyl methacrylate (PMMA) material developed the stirred zone. 20 A newly designed tool comprised of the stationary rectangular cross-sectional shoulder (shoe) with a heating coil positioned inside the shoe was used in ABS plates joining. 19 The stationary shoulder have also been proposed to weld ABS plates without any external heating. 21 Pin contour with flat faces are indicated eccentricity which in turn affects the material flow around the pin. The square pin orthodoxy allows the plasticize material to flow over the pin boundary through tool rotation. The dynamic to static volume ratio of FSW pin is highly subjective to the flow path of soft heated weld material from leading to trailing edge of the revolving tool.13,22–24
From the above literature, it may be observed that the reported studies involve parametric variations, or have used hot shoe as tool for welding. As brought out in the introduction, thermoplastics are classified into amorphous and semi-crystalline based on their molecular structure. Thus, it is intriguing to know how FSW is effective for these two classes of materials. To the best of the authors’ knowledge, there is no such study. Thus, this work attempts to make a comparative study between the weldability of these two classes of thermoplastics. The study covers welding of materials using various pin profiles on the weld quality characteristics. In addition, information from several sensors has been utilized to further identify the influence of varying tool pin profiles on the welds. Along with these, the failure mode analyses using stress-strain plots during the tensile testing has also been carried out. The parametric influence on mechanical properties of the welded joint considering different pin contours has been compared using response surface methodology. The weld bead geometry with associated micro-hardness profiles through the weld bead centerline has also been compared.
Experimental procedure
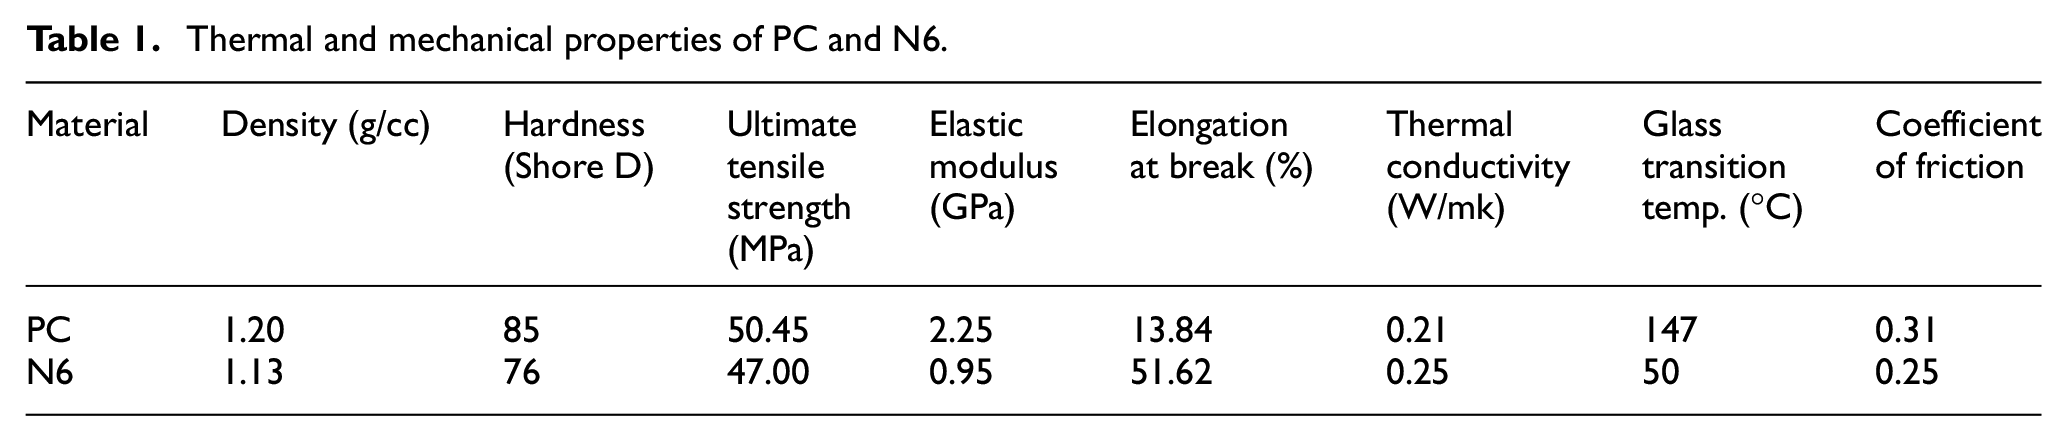
In the present work, semi-crystalline nylon-6 (N6) and amorphous polycarbonate (PC) thermoplastic polymers have been considered as base materials. The thermal and mechanical properties of the base materials are summarized in Table 1. The weldability has been compared for various parametric conditions using three different tool pin profiles in FSW process. The joint tensile strength with corresponding elongation capability influenced by bead profile and geometry has been considered as weldability performance parameters. However, micro-hardness variation profiles along with respective weld failure modes has also been studied using stress-elongation plots. The axial thrust load fluctuation with associated torque signals has been acquired to completely characterize the process dynamics on weld quality issues. Two separate K-type thermocouples have also been positioned at middle point toward both tool advancing and retreating side of 10 mm distance from weld base plates interface for precise data acquisition during welding as tool shoulder radius was 9 mm.
Thermal and mechanical properties of PC and N6.
The welding experiments have been conducted using a 2 ton three-axis CNC FSW machine (ETA, Bangalore). Butt welding has been carried out. The welded base plates were accurately fastened using bolts constricted over the heavy fixture base so that zero root gap between weld base pair can be maintained. Some trial experiments were carried out to select feasible parametric range of tool rotational speed (N) and tool traverse speed (V) for each base material that is, PC and N6. However, the tool tilt angle toward the trailing edge, tool plunge depth was maintained constant at 10 and 0.1 mm, respectively throughout all welding experiments. The range of each parameter were also considered same for each base thermoplastic to compare their weldability in a better way.
The cylindrical hardened H13 tool steel having 18 mm shoulder diameter, 6 mm pin diameter, and 5.6 mm pin length was used as FSW tool. Three different tool pin profiles namely cylindrical, square, and triangular were used without any change in shoulder diameter, pin diameter, and pin length of the cylindrical FSW tool as shown in Figure 1. The experimental set-up with an expanded view of the weld base sheets clamping in FSW machine is indicated.
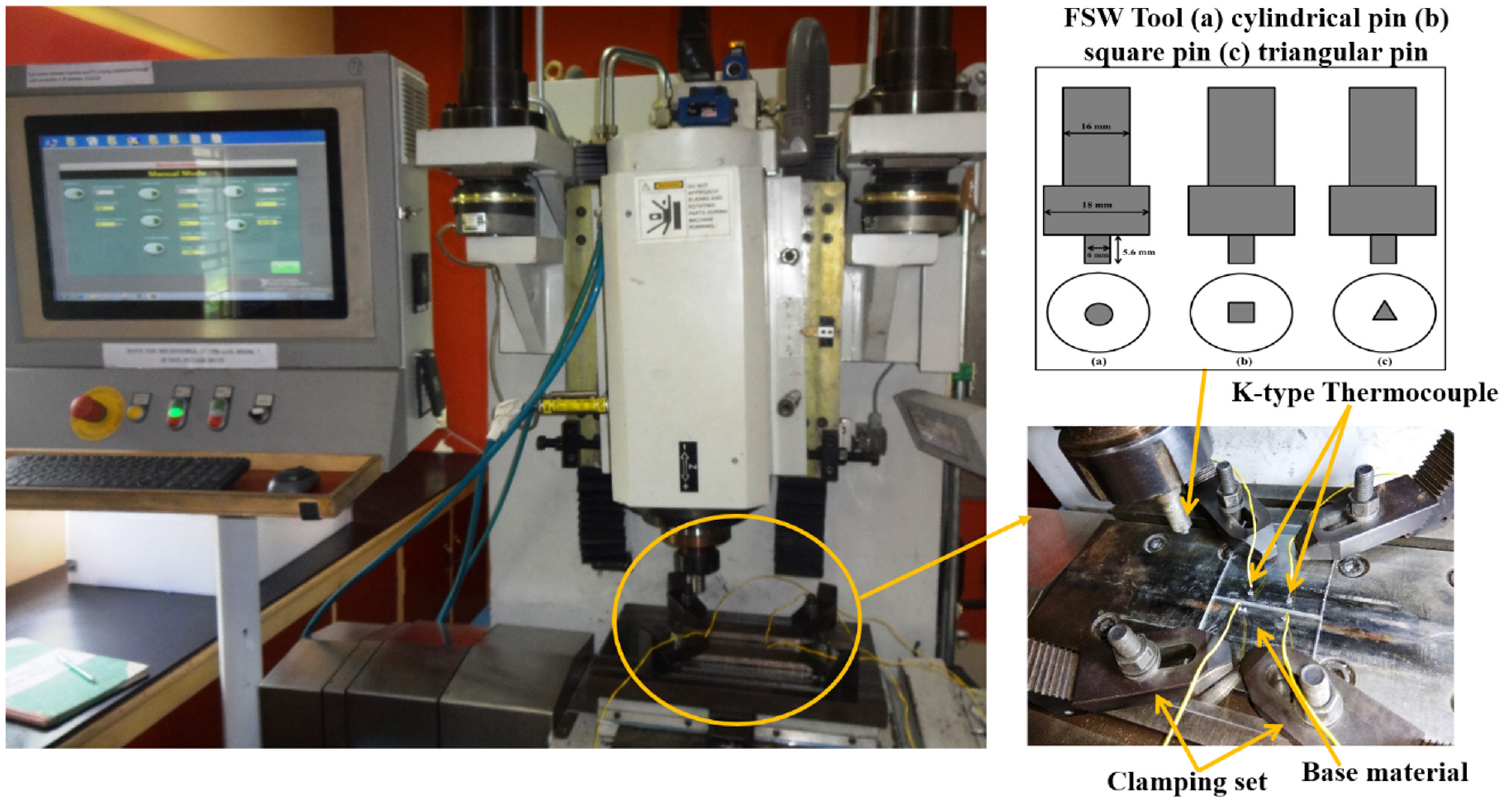
FSW experimental set-up with fixture arrangement.
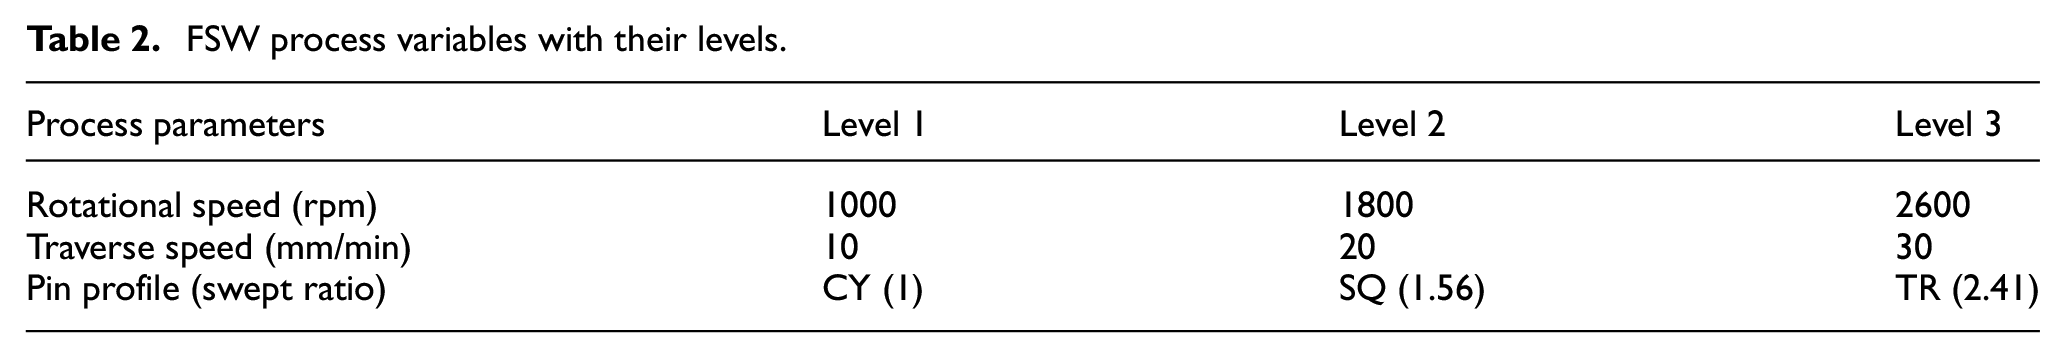
Design of welding experiments
The design of experiments has been developed as per the selected range of each process variable considering each tool pin profile that is, cylindrical (CY), square (SQ), and triangular (TR) for PC and N6 work materials separately. Thus, the pin swept ratio (r) has also been considered in the design of welding experiments. Three parametric levels like low, medium, and high for tool rotational speed, tool traverse speed, and pin swept ratio was considered in full factorial experimental design as presented in Table 2, that is, a total of 27 experiments have been conducted for each weld material with six randomly chosen experiments on each work material was repeated to check the repeatability of the machine.
FSW process variables with their levels.
Pin shape with flat faces is associated with eccentricity which helps to flow the material around the pin. The square pin permits the plasticized material to flow simply around the pin during tool rotation. The ratio of dynamic to static volume of the rotating tool pin is known as swept ratio. The swept ratio of the pin highly effects on the soft heated weld material which is stirred from the leading edge to the trailing edge of the rotating tool during welding.13,16,17,23 The measurement of swept ratio of each pin profile used in this work is presented in Table 3. The square and triangular pin creates a pulsating action for the reason for flat faces which benefit in better material mixing. The triangular pin profile creates 90 pulses per second whereas the square pin profile creates 120 pulses per second at 1800 rpm tool rotation as shown.
Influence of pin profile on the swept ratio.
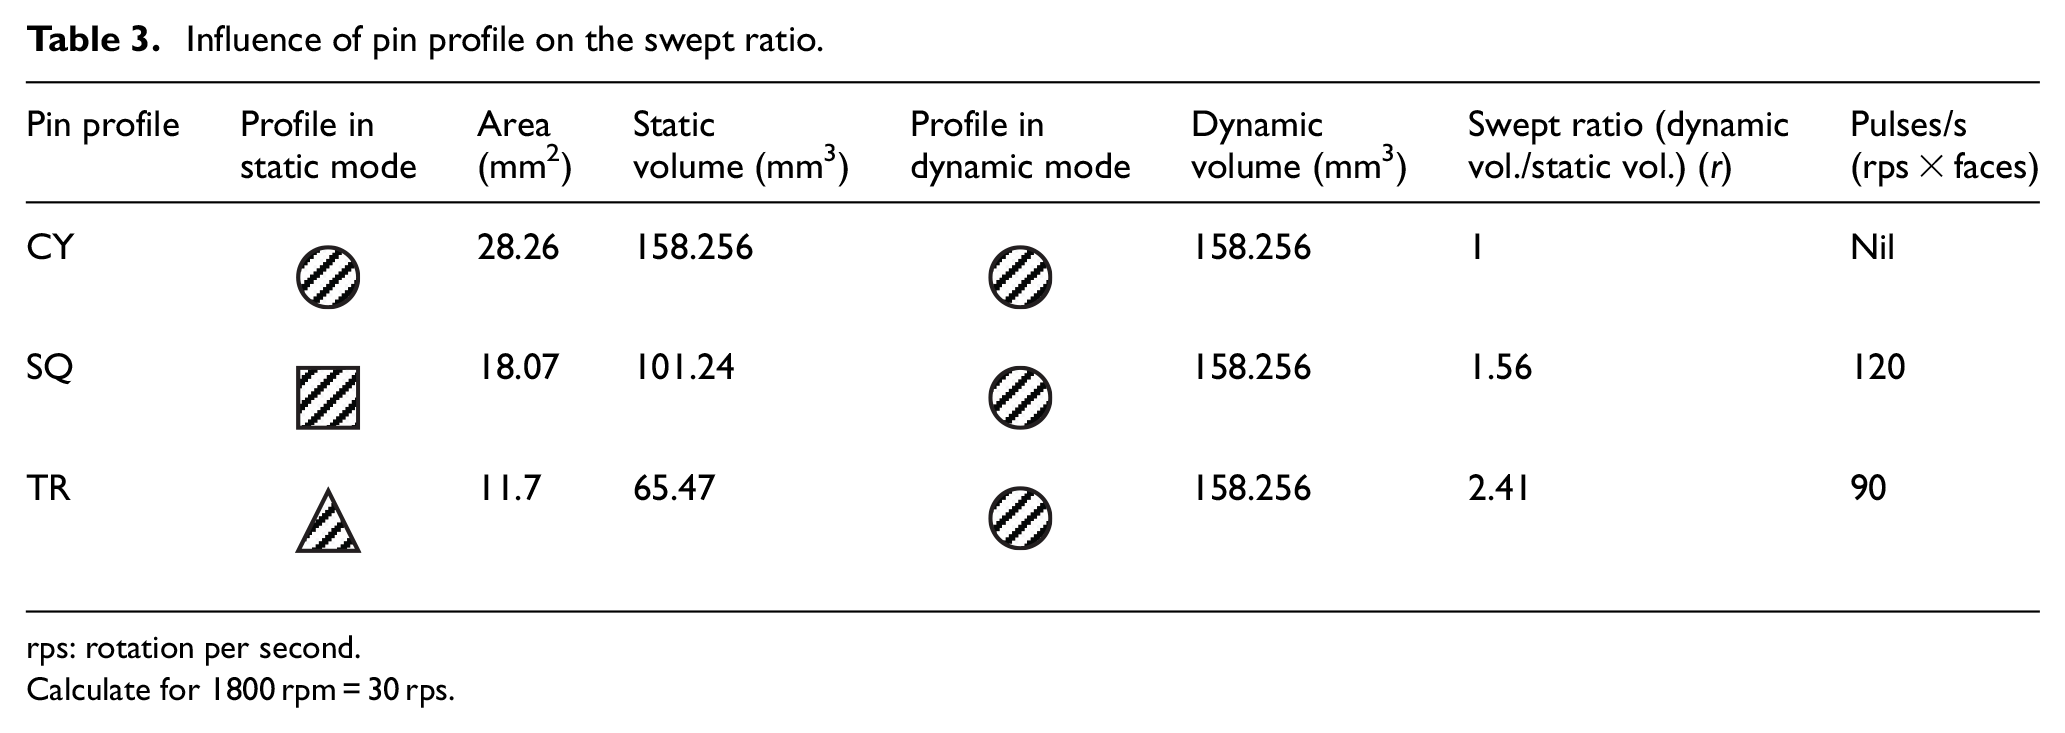
rps: rotation per second.
Calculate for 1800 rpm = 30 rps.
Measurements of weld quality features
In the present work, the friction stir weldability index was characterized by joint strength with elongation capability during tensile loading and weld micro-hardness variation. However, top weld bead profile and bead geometry have also been processed to investigate the overall weld quality. The butt welded samples have been sized perpendicular to the welding direction as per the ASTM D638 standard, 25 for the study of joint behavior during tensile test. The tensile tests have been conducted using a strain rate of 0.1 mm/min by “Universal Tensile Testing Machine (Instron 1344).” The elongation with respective load has also been acquired during the test for each welded sample using the integral data acquisition system within UTM. The welded samples were carefully polished using emery papers with successive grit sizes from 400 to 4000 series of silicon carbide for smooth surface. The welded specimens having 20 mm length were cut crosswise for micro-hardness measurement and bead geometrical study. The bead geometry comprised of different welding zones, which was identified using an optical image analyzer (Leica, DMLM). The micro-hardness along the weld centerline from advancing side (AS) to retreating side (RS) of rotating tool on each polished weld bead sample have been measured using “Shore D hardness tester.” However, the average value of micro-hardness at weld zone and heat affected zone have been calculated by taking mean of five successive points of respective zones over polished weld samples.
Measurements of sensor based statistical features
The linear FSW machine having inbuilt sensors for axial force, torque with PLC-based control system, and Lab view software for real-time data acquisition have been acquired during the welding experiments. The axial force and torque signals have been analyzed in time domain considering statistical root mean square (rms) of welding experiments to scrutinize the correlation with weld quality parameters. “rms” is generally known as quadratic mean which is used in statistics and mathematics. This formulation provides the total sum of square root of each data in an observation. It is normally denoted by
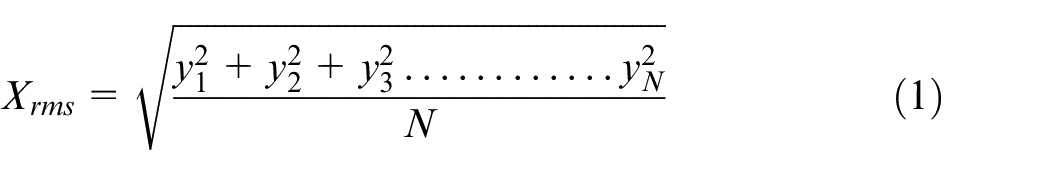
Where
The weld peak temperature is the highest temperature of the weld thermal cycle which comprised of heating and followed by cooling of the weld bead. The weld cooling rate that is, the slope of weld cooling curve just after welding has been determined at 25 second (s) later just after reaching weld peak temperature time24,26 that is, weld peak temperature to instantaneous temperature at 25 s intervals after reaching peak temperature, which may be expressed as
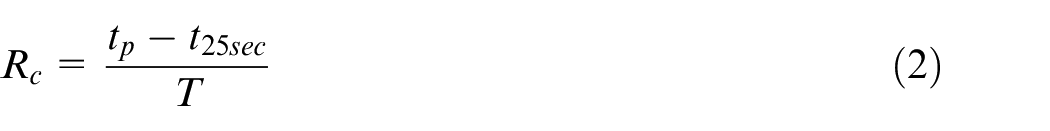
Where
Analysis of experimental results
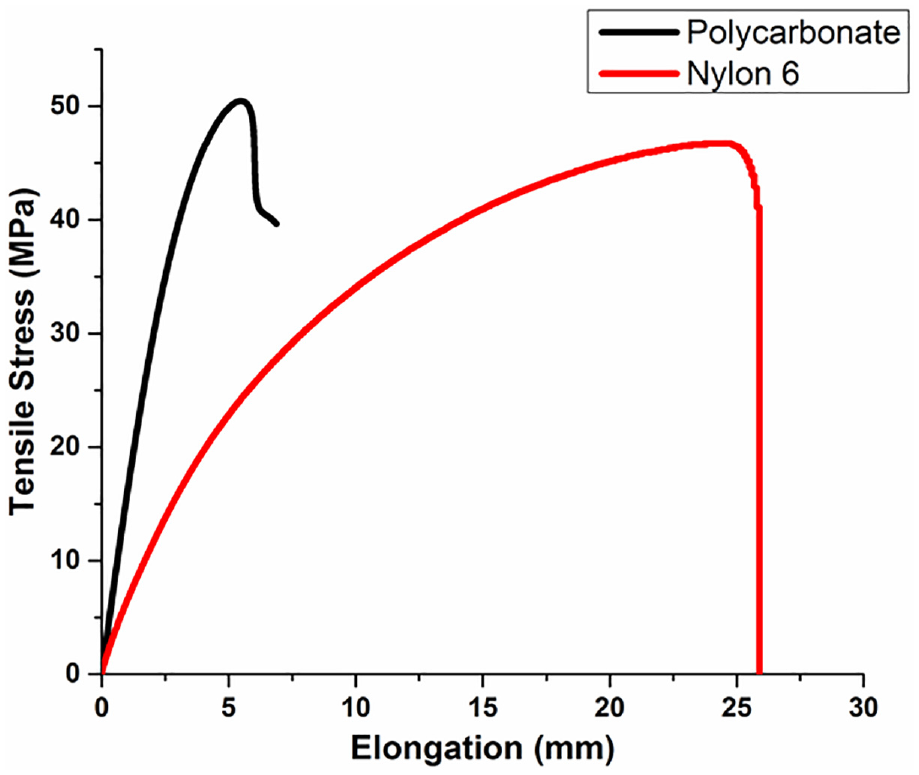
The stress-elongation diagram of weld base materials that is, polycarbonate and nylon-6 have been plotted as per typical acquired data during tensile test, as presented in Figure 2. The ultimate stress of PC was found to be slightly higher (7.34%) than N6, whereas, the elongation capability up to breaking point was significantly higher for N6 (2.73 times) (Table 1). Thus, it may be concluded that N6 has more thermoforming capability than PC during the friction stirring process.
Stress elongation diagram of PC and N6.
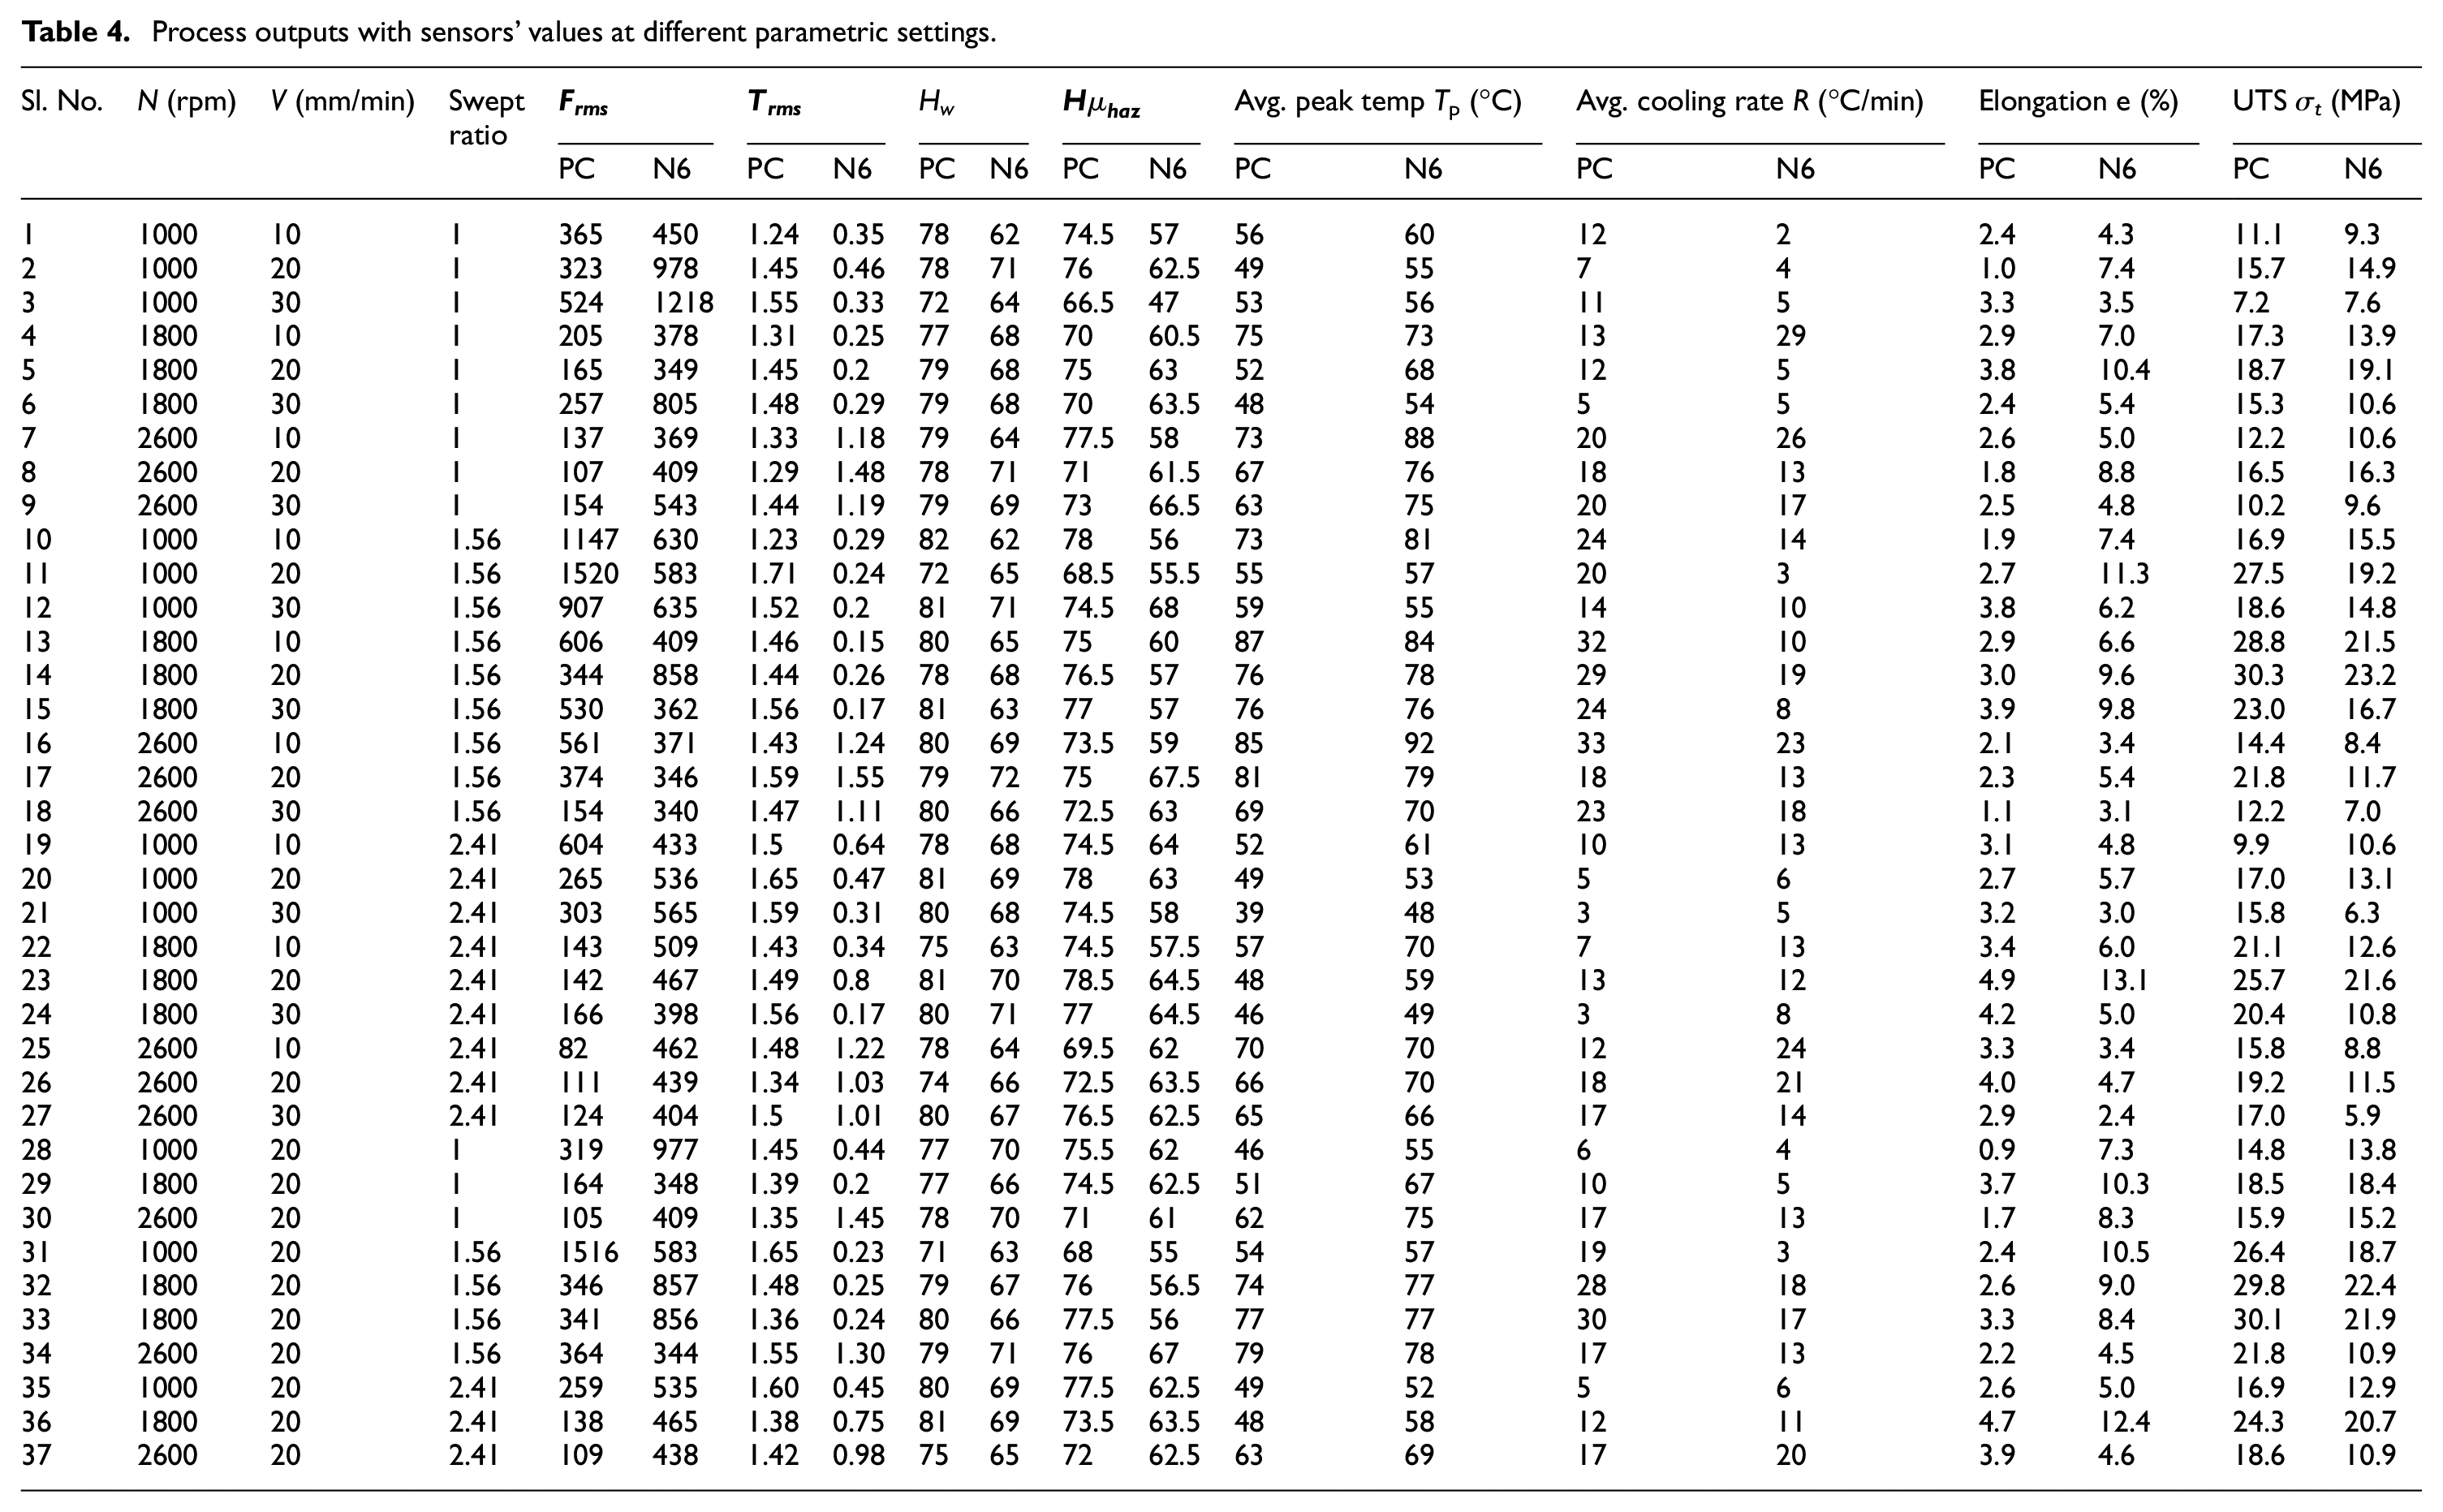
The root mean square value of axial thrust force with corresponding torque due to FSW tool rotation for different parametric settings have been presented (PC and N6 as work materials) in Table 4. The mean value of hardness at weld zone (WZ) and heat affected zone (HAZ); ultimate tensile stress and elongation at break of weld joint are measured as per ASTM standards.
Process outputs with sensors’ values at different parametric settings.
The influence of FSW process variables (i.e. tool rotational speed, traverse speed, tool pin geometry) on weld ability in terms of axial thrust force with associated torque generation, weld thermal cycles, and mechanical behavior during tensile test using polycarbonate and nylon-6 base materials have been discussed in section 3.1 and 3.2, respectively. The primary objective was to investigate the impact of parametric changes (within specified weld-able range) on real time force-torque-temperature variations during welding phases. A comparative assessment on weld ability has been made for different weld materials using three tool pin contours. This sensor based dynamic analysis has also been used as an indicator during the analysis of solidified weld stress-strain behavior due to tensile load.
Influence of process parameters on axial thrust with associated torque
The effect of tool rotational speed and traverse speed (welding speed) on axial thrust force with associated torque development for different tool pin profiles have been presented graphically in Figure 3. The axial thrust force generation was higher for N6 than PC in most of the cases using cylindrical and triangular tool pin as shown in Figure 3(a) and (c). However, it was found to be reversed when using square tool pin as indicated in Figure 3(b). The axial force as well as torque variation was found to be significantly higher for N6 with the variation of tool rotational speed or traverse speed using cylindrical pin which was diminished with higher swept ratio square to triangular pin as shown. However, this thrust load variation was found to be increasing with higher swept ratio pin profiles in case of PC. On the other hand, the torque development was found to be reduced significantly for N6 than PC using each tool pin due to better thermal formability of N6 which was more predominant at lower tool rotational speeds (1000 and 1800 rpm). However, the axial thrust generation was higher possibly due to less heat generation (low coefficient of friction) at same parametric conditions even having higher hardness of N6 than PC. The variation of torque with the parametric changes was higher for N6 than PC using each tool pin profile.
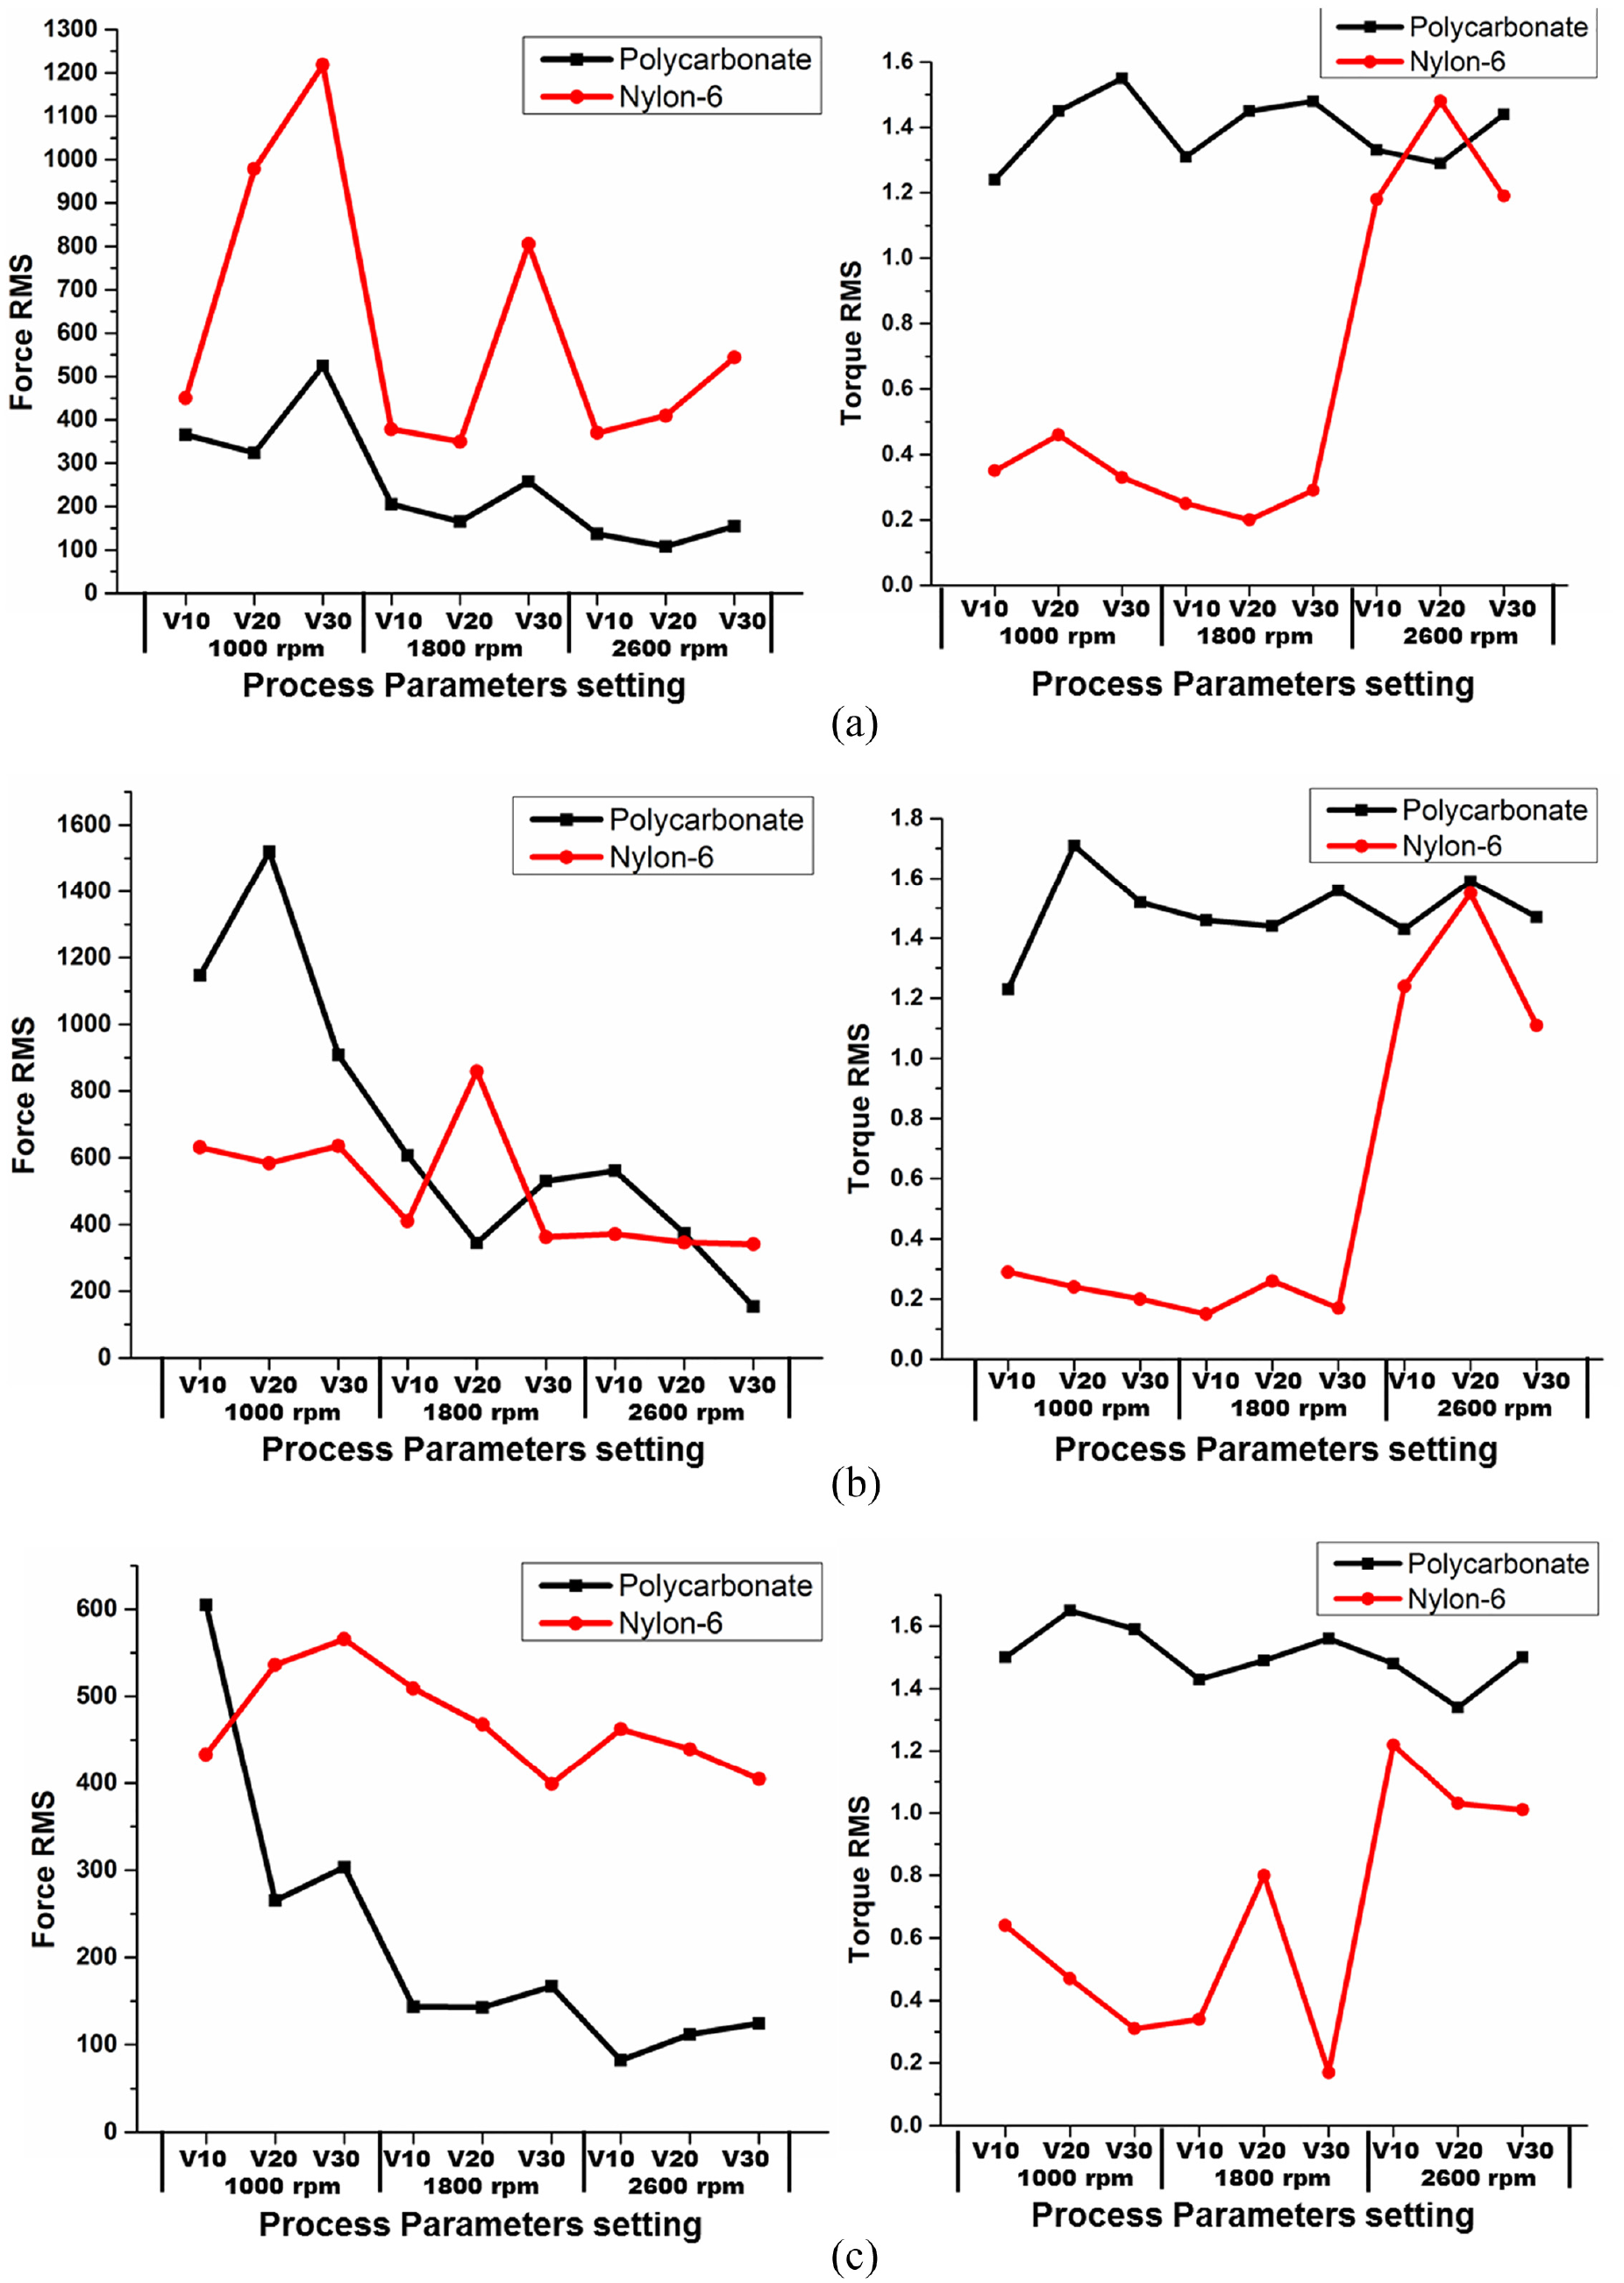
Variation of axial thrust force and torque with FSW parameters: (a) cylindrical pin, (b) square pin, and (c) triangular pin.
The mean axial thrust was found to be reducing with an increase in tool rotational speed for both the weld base materials which was more pronounced in case of PC as shown. However, the reduction of mean torque with tool rotation was not as predominant except at high tool rotational speed (2600 rpm) using N6 as base material. The variation of axial force with welding speed was found to be significant at low tool rotation (1000 rpm) using cylindrical pin for N6 as well as square and triangular pin for PC. Thus, it may be concluded that there was an axial thrust force reduction with more torque requirement at high tool rotational speeds as noticed in previous works.13,23,24,27 However, the thrust force with respective torque reduction was more predominant for PC and N6, respectively.
The influence of process variables on weld thermal cycle considering mean value of weld peak temperature and weld cooling rate as process outputs have been presented in Figure 4. The repeated experimental results regarding mean weld peak temperature with associated weld cooling rate have also been presented in the figure. The weld peak temperature primarily indicated total heat input to the weld and cooling rate of solidified weld signified ratio of weld volume to surface area that is, size and shape of heat influenced weld. The average weld peak temperature was found to be higher for N6 than PC particularly for cylindrical and triangular pin profiles in most of the welding experiments. However, the mean weld cooling rate was significantly less when using square tool pin for PC than N6 whereas it found to be opposite when using triangular tool pin. The weld peak temperature and cooling rate were found to be increasing with an increase in tool rotational speed. However, the peak temperature was found to be decreasing with an increase in tool traverse speed as expected. Whereas, the cooling rate was influenced by heat influenced weld area with associated weld heat input rate during welding. Thus, weld cooling rate was dominated not only by heat input to the weld but also by total volume of the weld. The foregoing study also revealed that the weld cooling rate was highly influenced by the variation of swept ratio (pin profile) rather than average weld peak temperate.
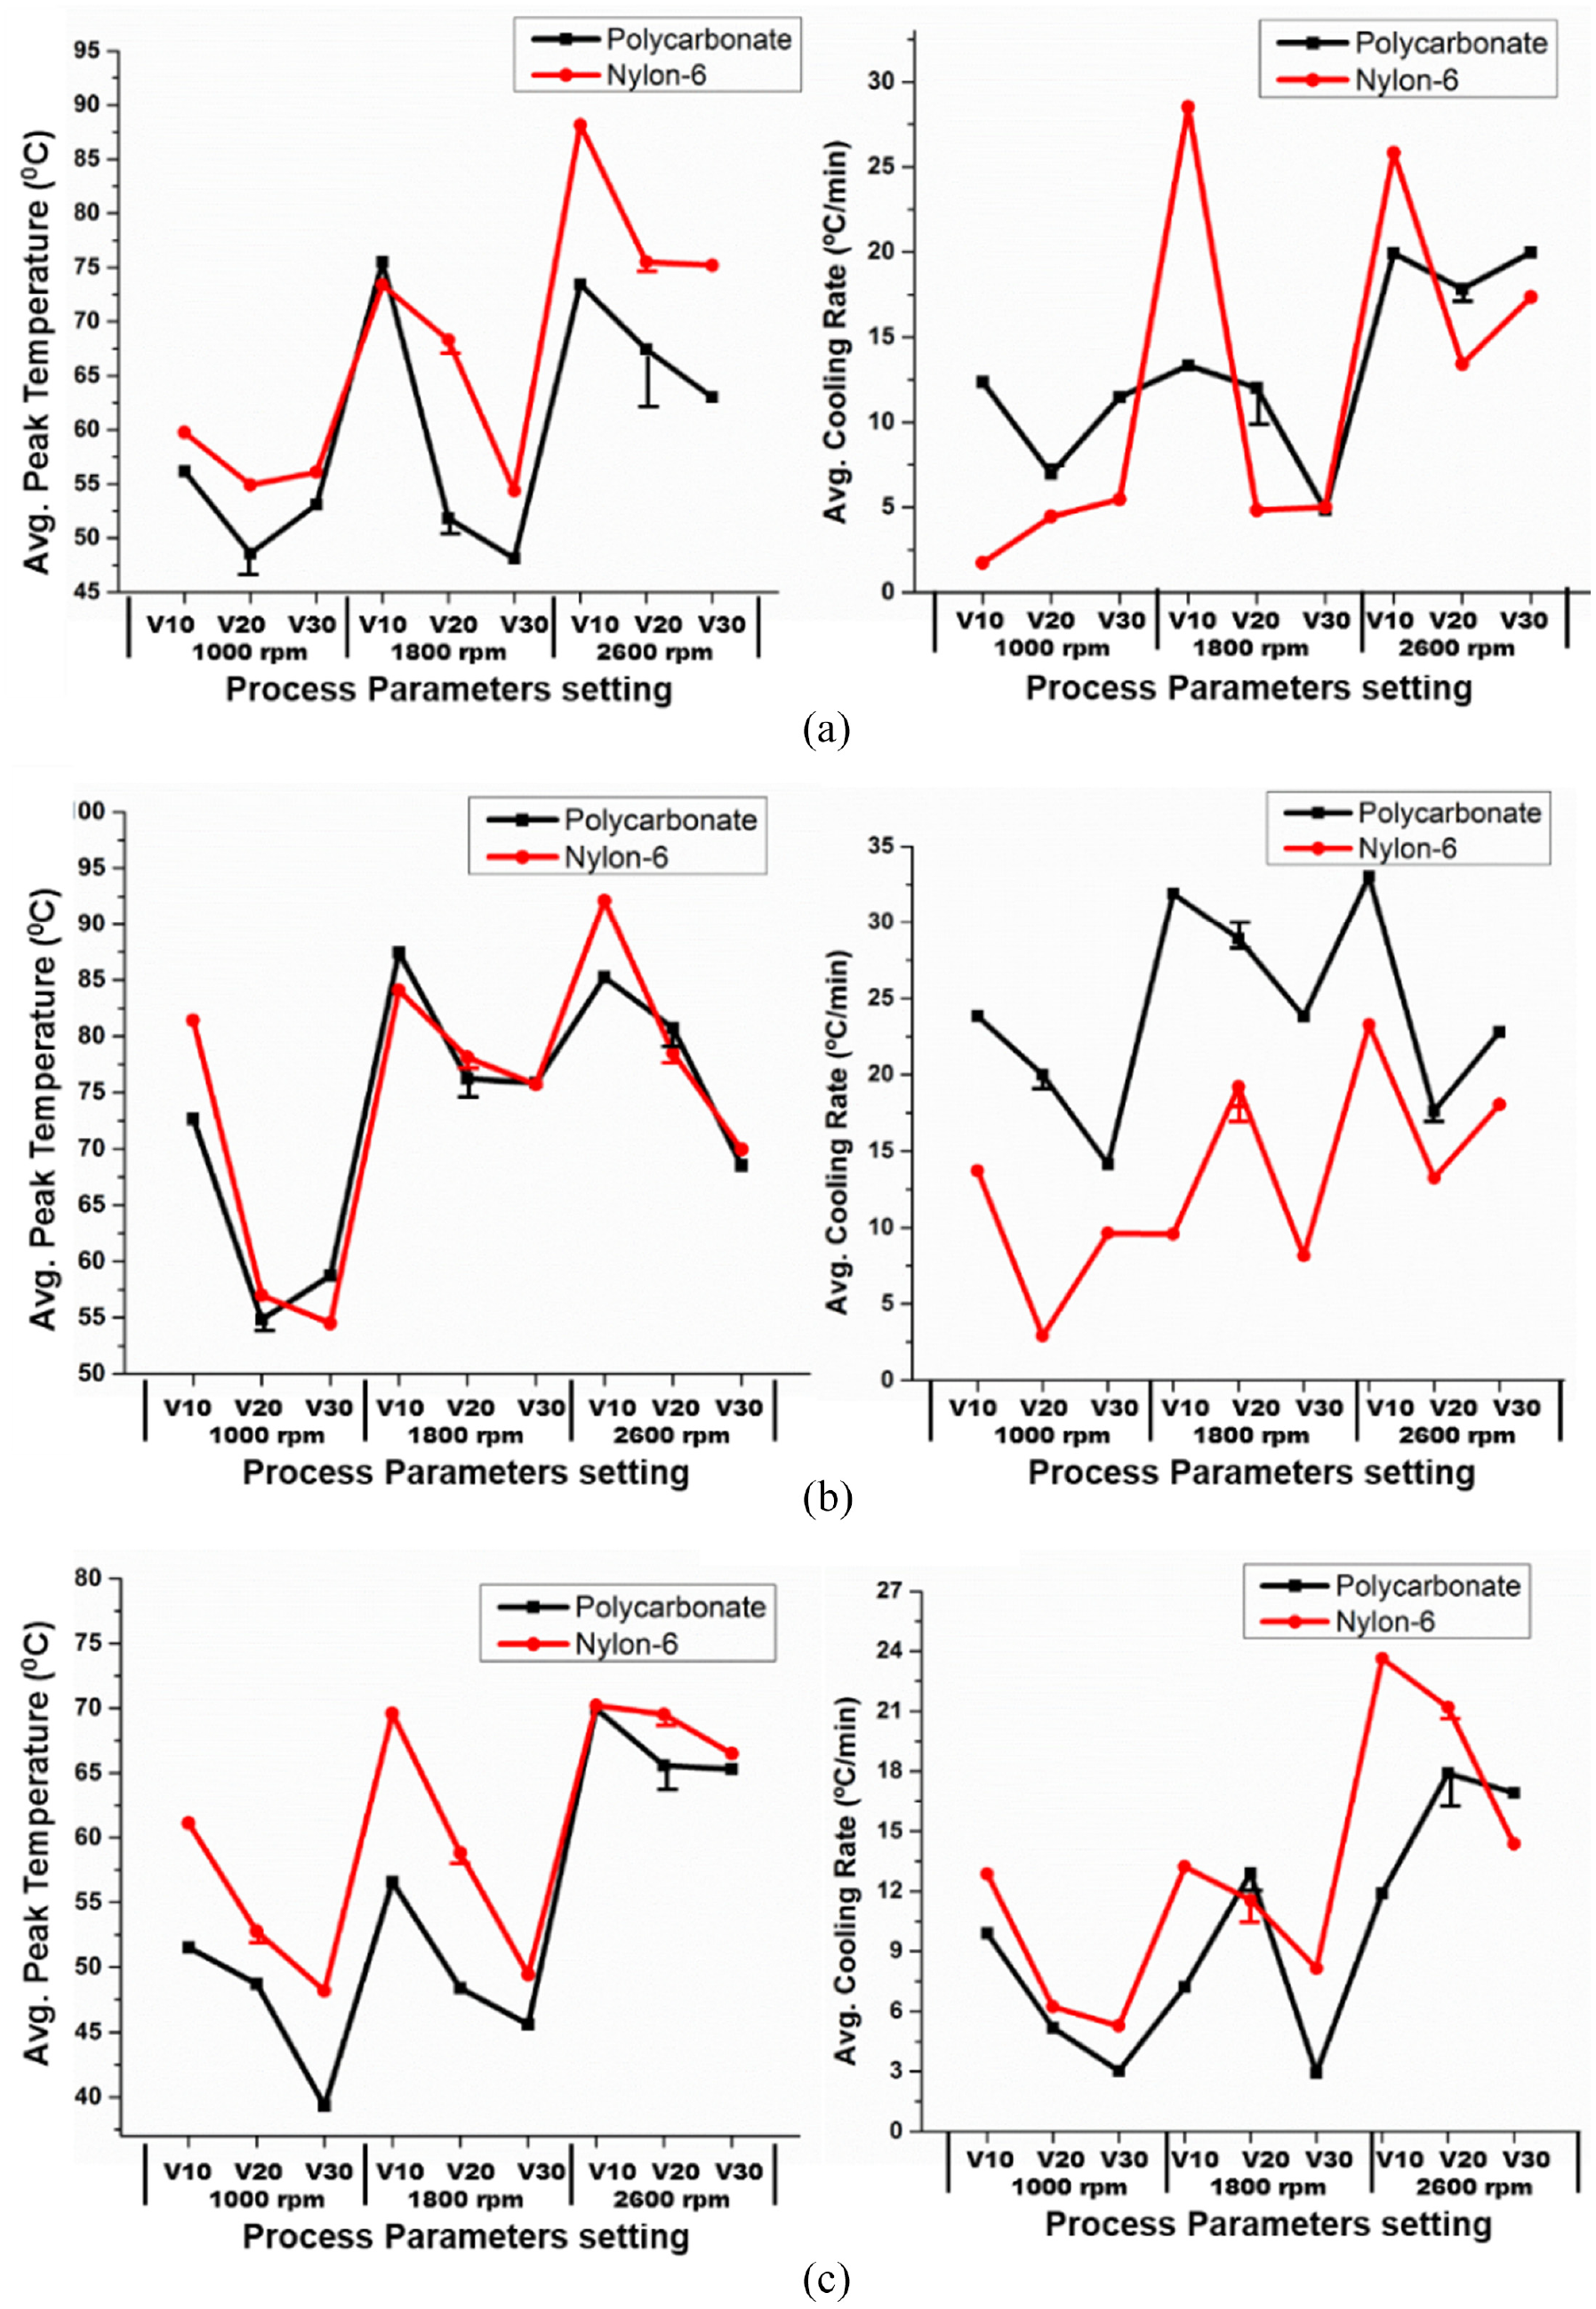
Variation of average peak temperature and cooling rate: (a) cylindrical pin, (b) square pin, and (c) triangular pin.
Influence of process parameters on joint mechanical behavior
The response surface methodology has been used for the regression model of weld strength as a function of two process variables. The parametric influence on joint tensile strength using different tool pin profiles on amorphous polycarbonate and crystalline nylon-6 along with mechanical force/torque signals simultaneously were compared using second order regression models.
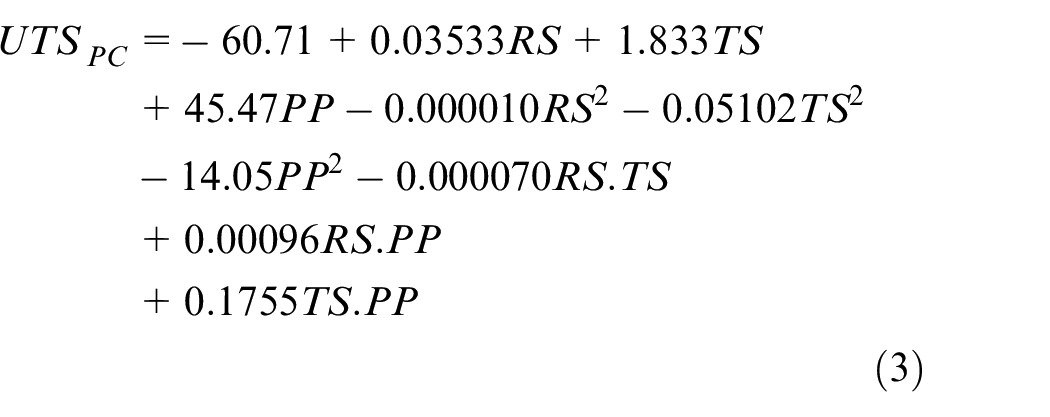
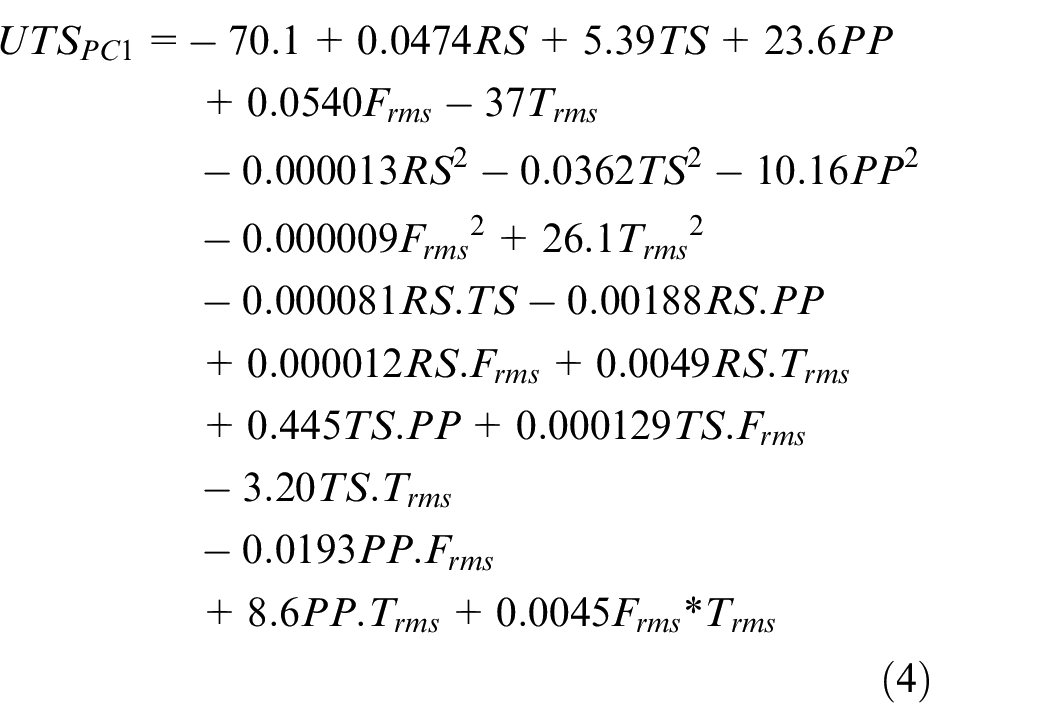
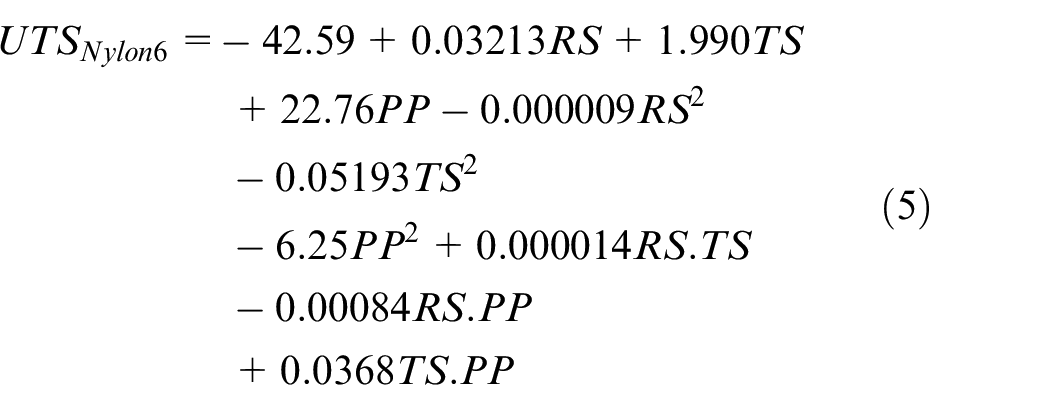
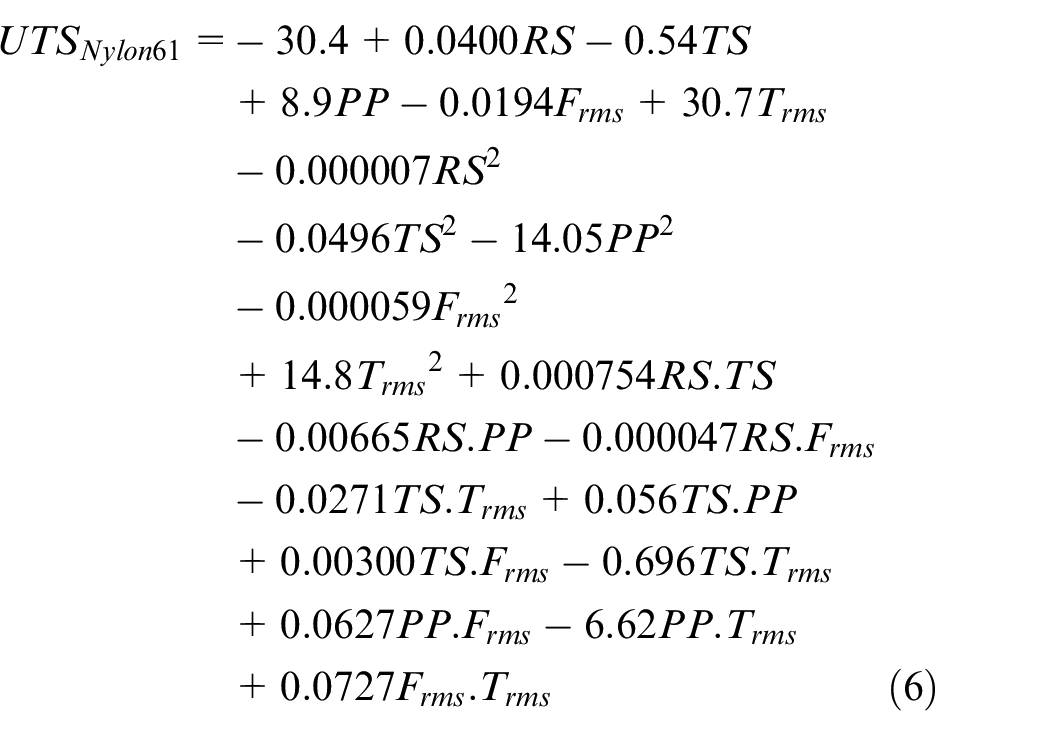
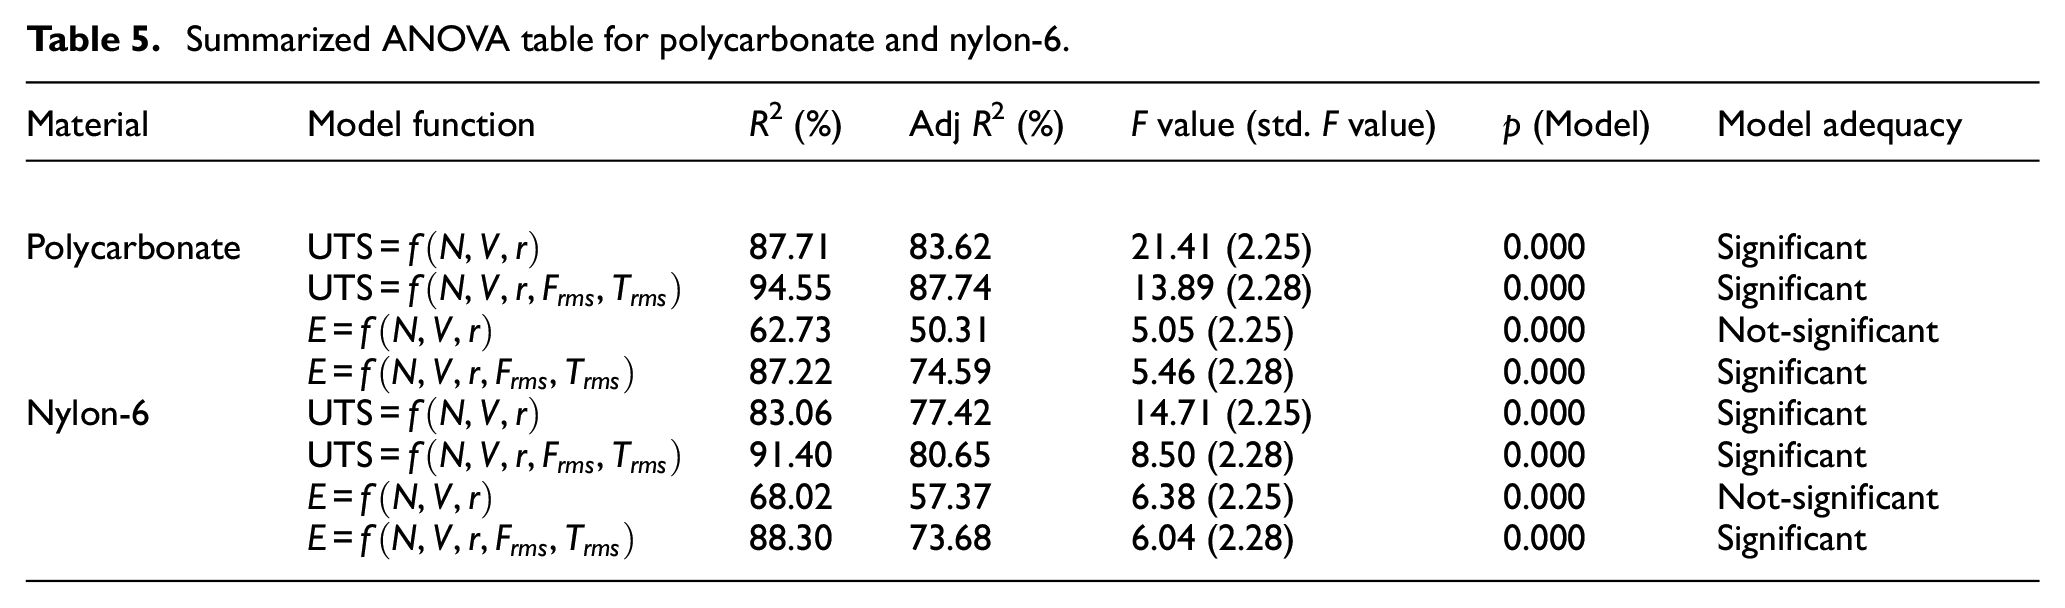
The summarized ANOVA table of both the models indicated their adequacy for fitness as R-squared value well above 80% with significant p value and F value as per degrees of freedoms (Table 5). The surface plot for interaction effect of tool rotational speed and traverse speed on weld strength considering each tool pin profile separately for polycarbonate and nylon-6 have been presented in Figure 5(a) to (c), respectively. However, the elongation models for each base weld material were found to be inadequate as both R-squared value and Adj-R-squared value were significantly less (<70%). However, combine both signals slightly reduced improvement of R-square value. The combination of mechanical tool force/torque signal with thermal cycle was found to be better indicator to describe the process.
Summarized ANOVA table for polycarbonate and nylon-6.
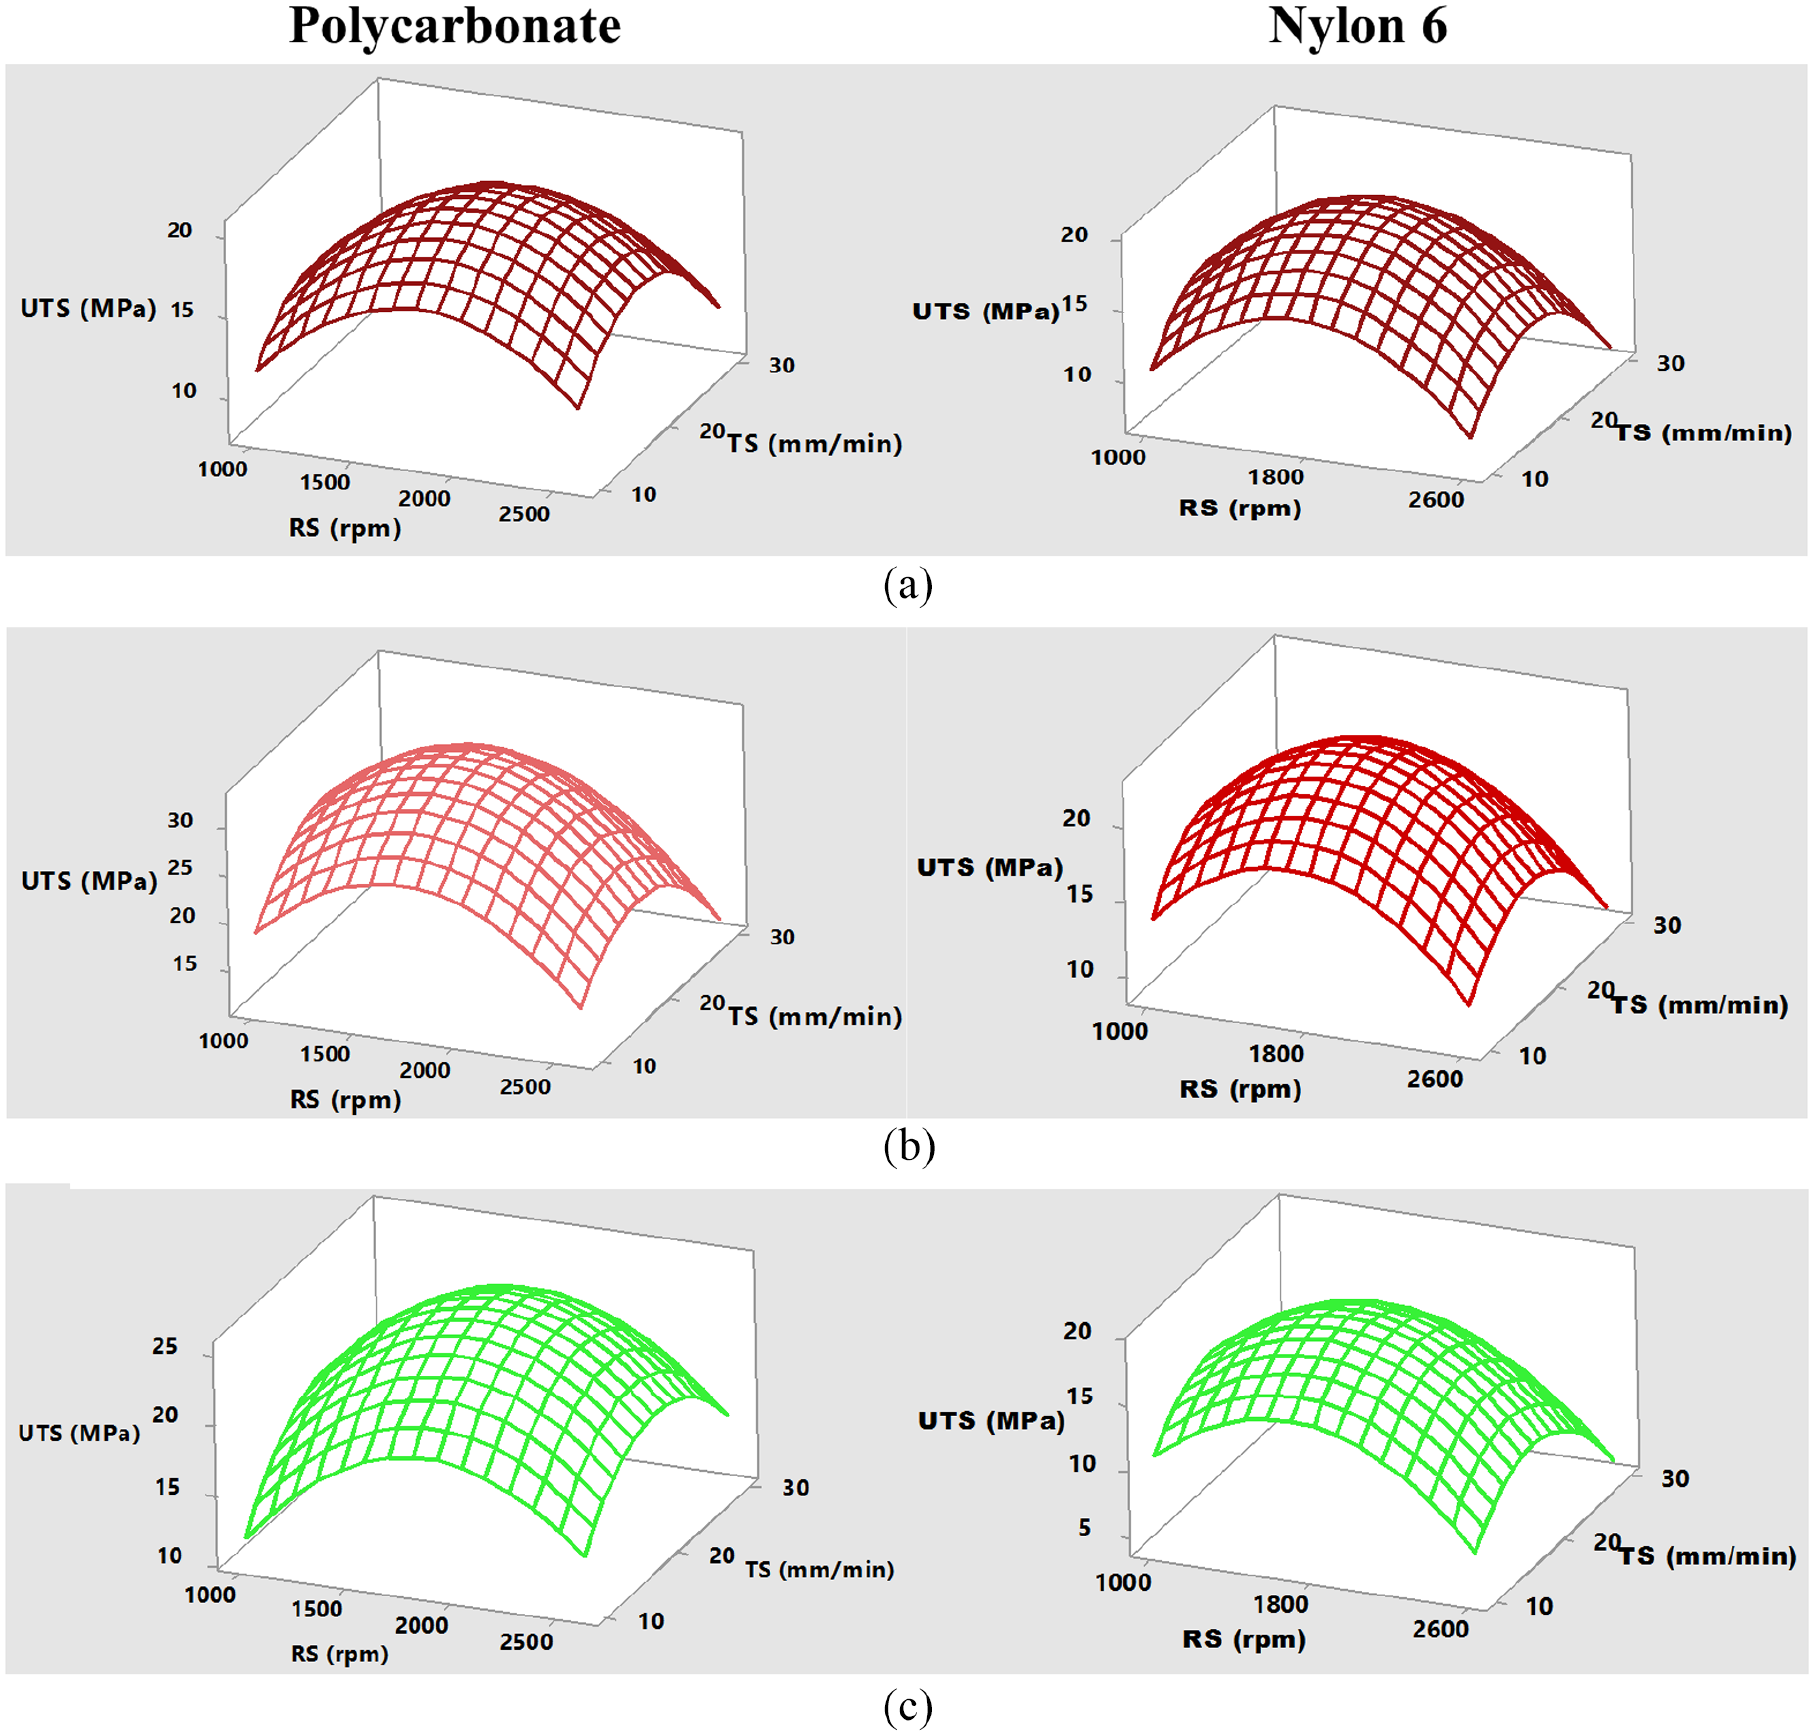
Interaction effect of tool rotational speed and traverse speed on joint strength: (a) cylindrical pin, (b) square pin, and (c) triangular pin.
The joint strength was found to be the maximum at the center point experiment that is, medium tool rotational speed (1800 rpm) with intermediate traverse speed (20 mm/min) using each tool pin profile for PC as well as N6. It was significantly low at high (2600 rpm) and low (1000 rpm) tool rotations especially when using higher swept ratios. The same phenomenon had also been noticed with the variation of welding speed. However, the surface plot was more symmetric with respect to tool rotational speed in case of cylindrical pin and square pin whereas it was skewed toward lower or higher tool rotation for polycarbonate or nylon-6, respectively. It was found to be flatter when using cylindrical pin, and it was found to be sharp when using higher swept ratio pins. On the other hand, the surface plots related to variation of welding speed were found to be symmetric with each tool pin contours. The amorphous PC had slightly higher (7.3%) strength than N6. However, the ultimate stress was significantly improved for PC when welded using square pin (30.6%) and triangular pin (19.2%), whereas it was slightly reduced (2.5%) while using cylindrical pin. The elongation capability was drastically reduced for PC welds (from 13.84% to 3.76%, 2.95%, and 4.94%) as well as N6 (from 51.62% to 10.42%, 9.61%, and 13.12%) when welded using cylindrical, square, and triangular tool pins, respectively. The mean elongation of N6 was found to be highly reduced (4.67 times) than PC (3.57 times) with respect to base materials. Thus, the deviation in elongation capability of PC to N6 (37.8%) was increased >60% (63.9%, 69.3%, and 62.4%, respectively) considering each tool pin profiles. The hardness ratio (hardness of PC to N6) base materials was 1.12 which was increased (1.15–1.16) for weld zone (WZ) considering the highest joint efficiency welds using three different pin profiles. It was found to be severe at HAZ where this ratio increased to 1.19, 1.34, and 1.22 for cylindrical, square, and triangular pin, respectively. Thus, it may be concluded that the hardness of N6 weld HAZ that is, the interface of base materials to weld had the lowest hardness (weakest) than WZ. The axial thrust was found to be considerably less for PC than N6 (2.12, 2.49, and 3.27 times) with subsequent highly significant increase (7.25, 5.54, and 1.86) in torque development using each tool pin profile considering only three higher joint strength cases that is, center point experiments (Table 2). As the N6 was softer with more ductility than PC, there was significant reduction of torque generation. However, the amount of softened weld material around the tool surroundings was found to be more for N6 than PC which in turn increased the axial thrust force development.
Comparative study on polycarbonate and nylon-6 weld joint properties
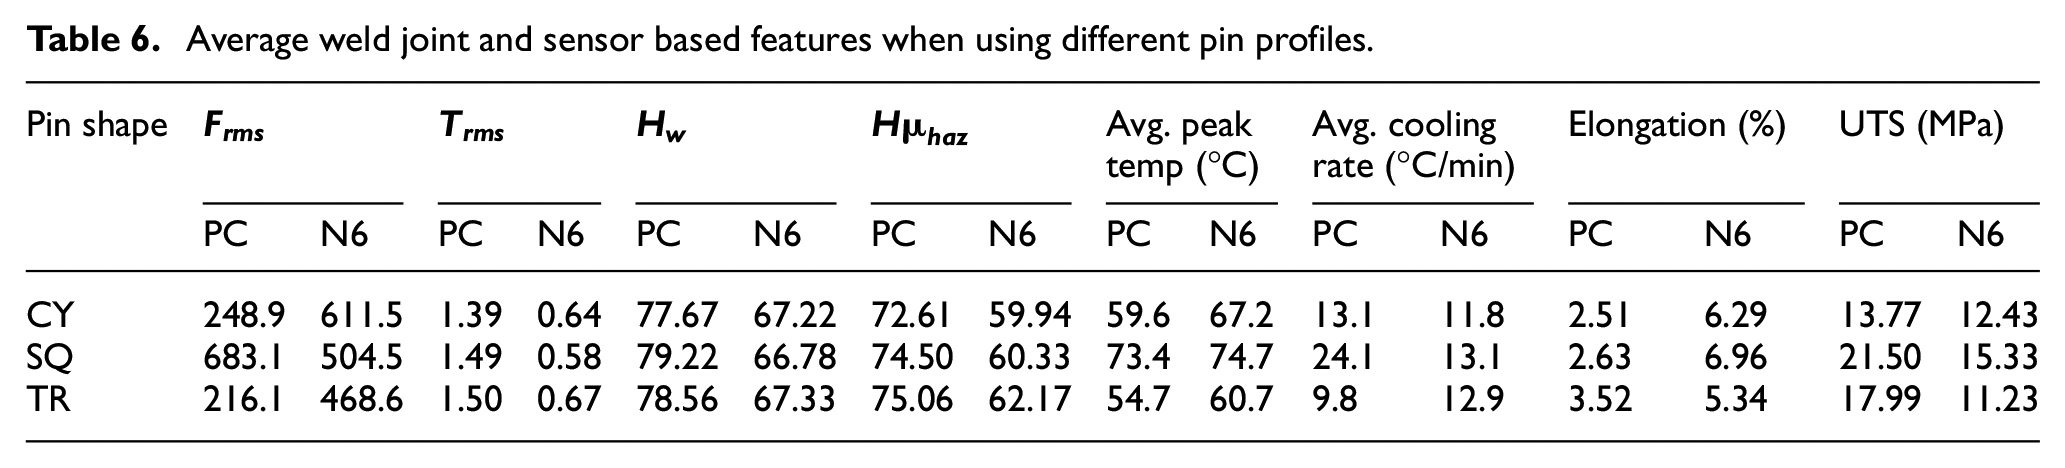
The average value of each weld quality features along with mean axial thrust and torque considering first 27 experiments as per full factorial design have been presented in Table 6. The mean joint strength was found to be higher for PC when using cylindrical pin profile (10.8%), and was more significant with higher swept ratio pin contours (i.e. 40.3% and 60.2% with square and triangular pin). However, the percentage elongation was increased for N6 than PC in almost same rate. But, the weld ductility was significantly reduced than respective base materials especially in case of N6 (7.4–9.7 times) than PC (3.9–5.5 times). The mean hardness in WZ was slightly decreased whereas it was predominantly reduced in HAZ (12.9% and 20% for PC and N6, respectively) than the respective base materials. Thus, the weld strength (joint efficiency) was less with more reduction in elongation capability in case of N6 rather than PC. The average axial thrust was found to be particularly higher (2.46 times for cylindrical and 2.17 times triangular pin) for N6 than PC except with square tool pin, whereas the mean torque reduced significantly (2–2.5 times) using each tool pin contour. The average weld peak temperature and cooling rate both were found to be higher when using square pin followed by cylindrical and triangular tool pin contours for PC as base material as indicated in Table 6. The same phenomenon has also been noticed for N6 base material except the mean weld cooling rate when using triangular pin. However, the average weld peak temperature was slightly higher with relatively slow cooling rate in case of N6 rather than higher thermally conductive PC as weld material considering each tool pin profile except with triangular pin. It was possibly due to higher coefficient of friction (high weld heat input) together with larger weld area (or volume) for PC weld than N6 which was more predominant than thermal conductivity aspect in this case.
Average weld joint and sensor based features when using different pin profiles.
The top weld bead profiles of the strongest and weakest joint using each tool pin profile for PC and N6 as base materials is shown in Figure 6. The strongest welds for each tool pin profile was found to be at center point experimental conditions for PC (joint efficiency 37%, 60.1%, and 50.9% using CY, SQ, and TR pin respectively) as well as N6 (joint efficiency 40.7%, 49.4%, and 45.9% using CY, SQ, and TR pin respectively for PC) as base material. The weld bead was relatively smoother without any reinforcement on PC welds with square pin, though several onion rings that is, tool rotational indention marks with or without material expulsion along tool retreating side on weld bead profile was found when using triangular and cylindrical pins. However, there was slight weld reinforcement without significant tool scribing ripples when using square pin on N6 welds and slightly non-uniform with reinforcement or minor scribing marks when using cylindrical or triangular pins at center point welding condition, respectively. Therefore, there was significant drop in joint efficiency (about 10% or more) using low swept ratio cylindrical pin as well as high swept ratio triangular pin profile due to drastic variation of weld profile for PC whereas it was <10% for N6.
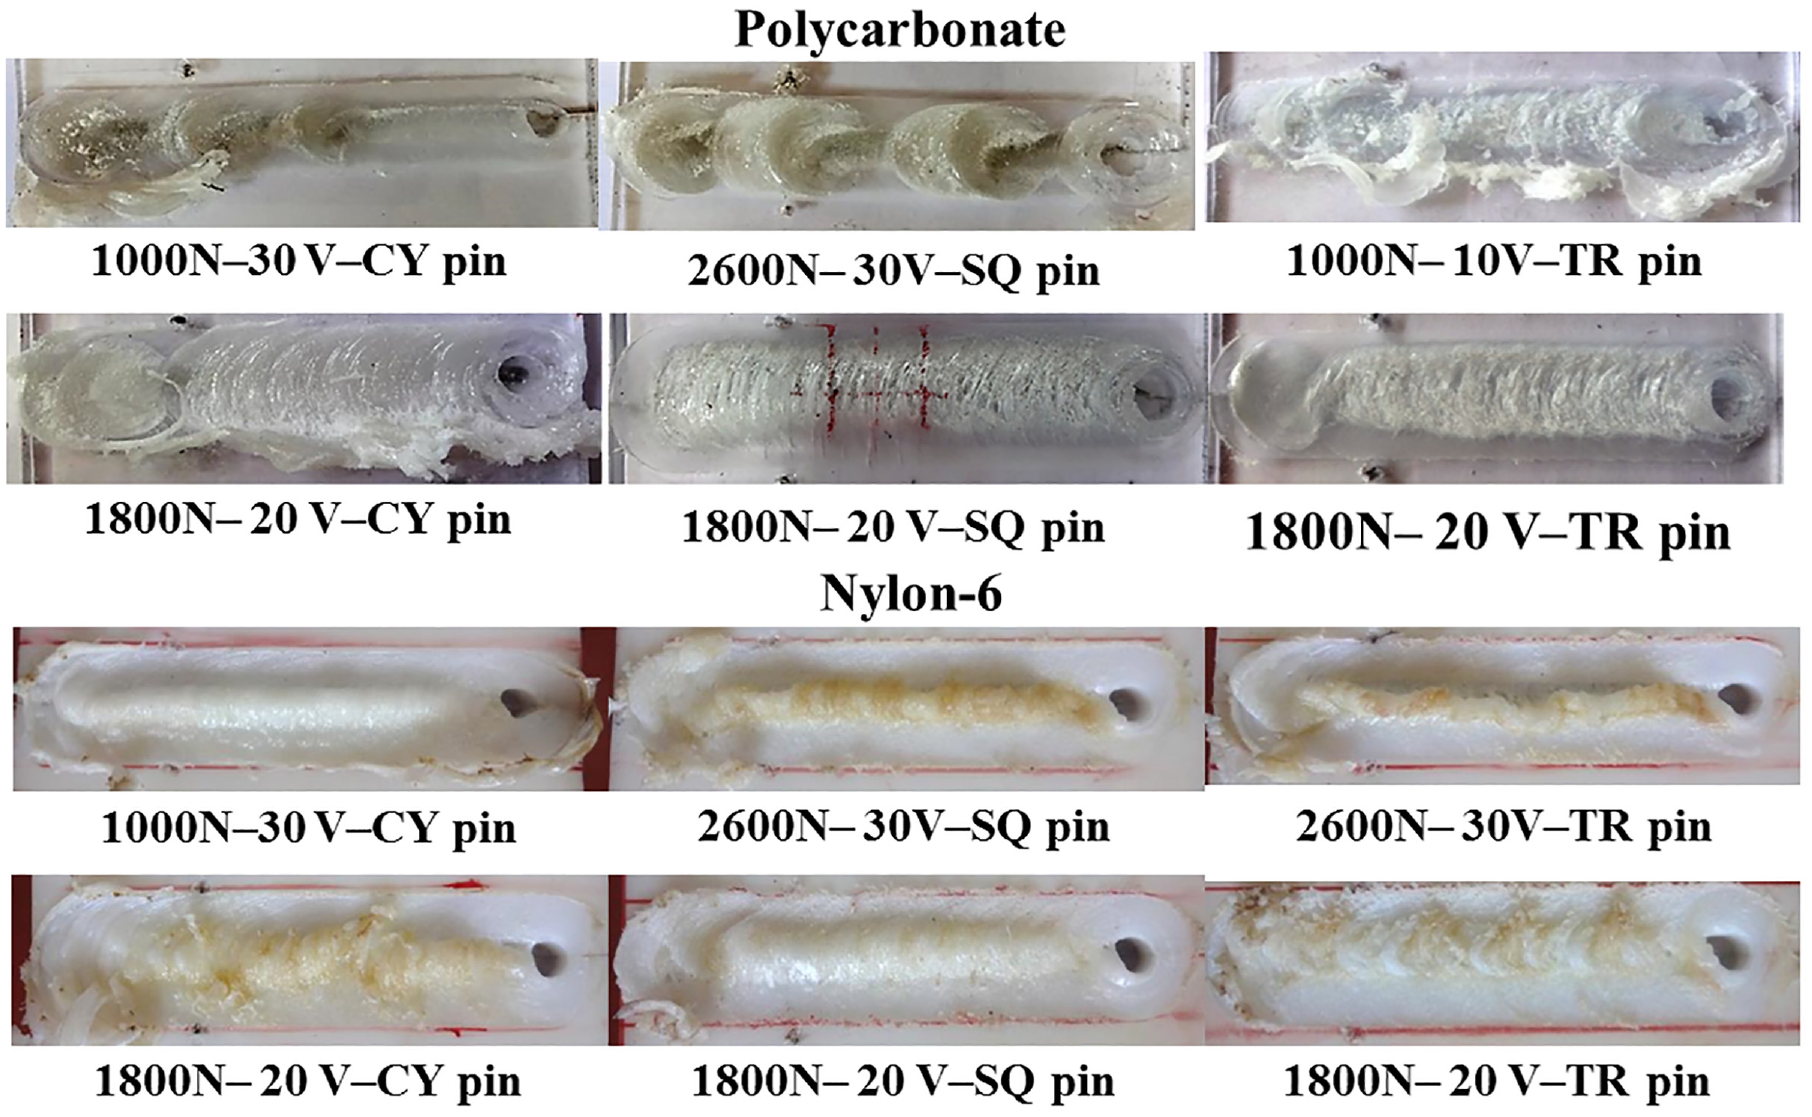
Weld bead profiles for strongest and weakest joint.
The weakest joint bead profiles for PC welds comprised of deep tool indented marks at regular or irregular intervals with asymmetric weld reinforcement when using square (2600N-30V) and cylindrical (1000N-30V) pins whereas irregular material expulsion was observed for triangular pin (1000N-10V). However, the top weld profile non-uniformity was not so predominant for N6 welds. There was uniform thinner welds with reinforcement when using cylindrical pin (1000N-30V) which was slightly wider with undercut or fine surface crack and undercut defect along the weld direction with cylindrical (1000N-30V) or triangular (2600N-30V) pin profile as shown. Therefore, it may be concluded that weld bead profile variation was more significant with the changes in process variables for PC rather than N6. Thus, the joint efficiency was significantly poor during low tool rotation with high traverse speed or both high tool rotations with high welding speed for cylindrical (<10%) or square (12.15% and 6.98% for PC and N6 base materials) tool pin contour. However, it was found to be the minimum (<10%) at both low or high tool rotation and low traverse speed respectively for PC (9.91%) or N6 (5.93%) using triangular pin.
The axial force with corresponding torque signals for strongest weld joints obtained using square pin profile at center point experimental condition (1800N-20V) for the two selected base materials have been presented in Figure 7(a) and (b). The peak (and rms value) of axial force was found to be significantly higher (2.49 times) for N6 than PC though variation profiles were almost same as shown. However, there was a significant drop (5.54 times) in rms torque (and peak) for N6 than PC. Therefore, it may be concluded that the higher axial force development together with relatively less torque (and low fluctuation also) requirement using N6 as base material due to significantly higher (4.5 times) ductility (elongation capability) though the hardness was marginally less (1.12 times). It was because of unrestricted material transfer from tool advancing to retreating side (low torque) by using highly elongated N6 as surrounding base material along with high axial thrust (and high fluctuation also) generation for the stable frictional stirring process.
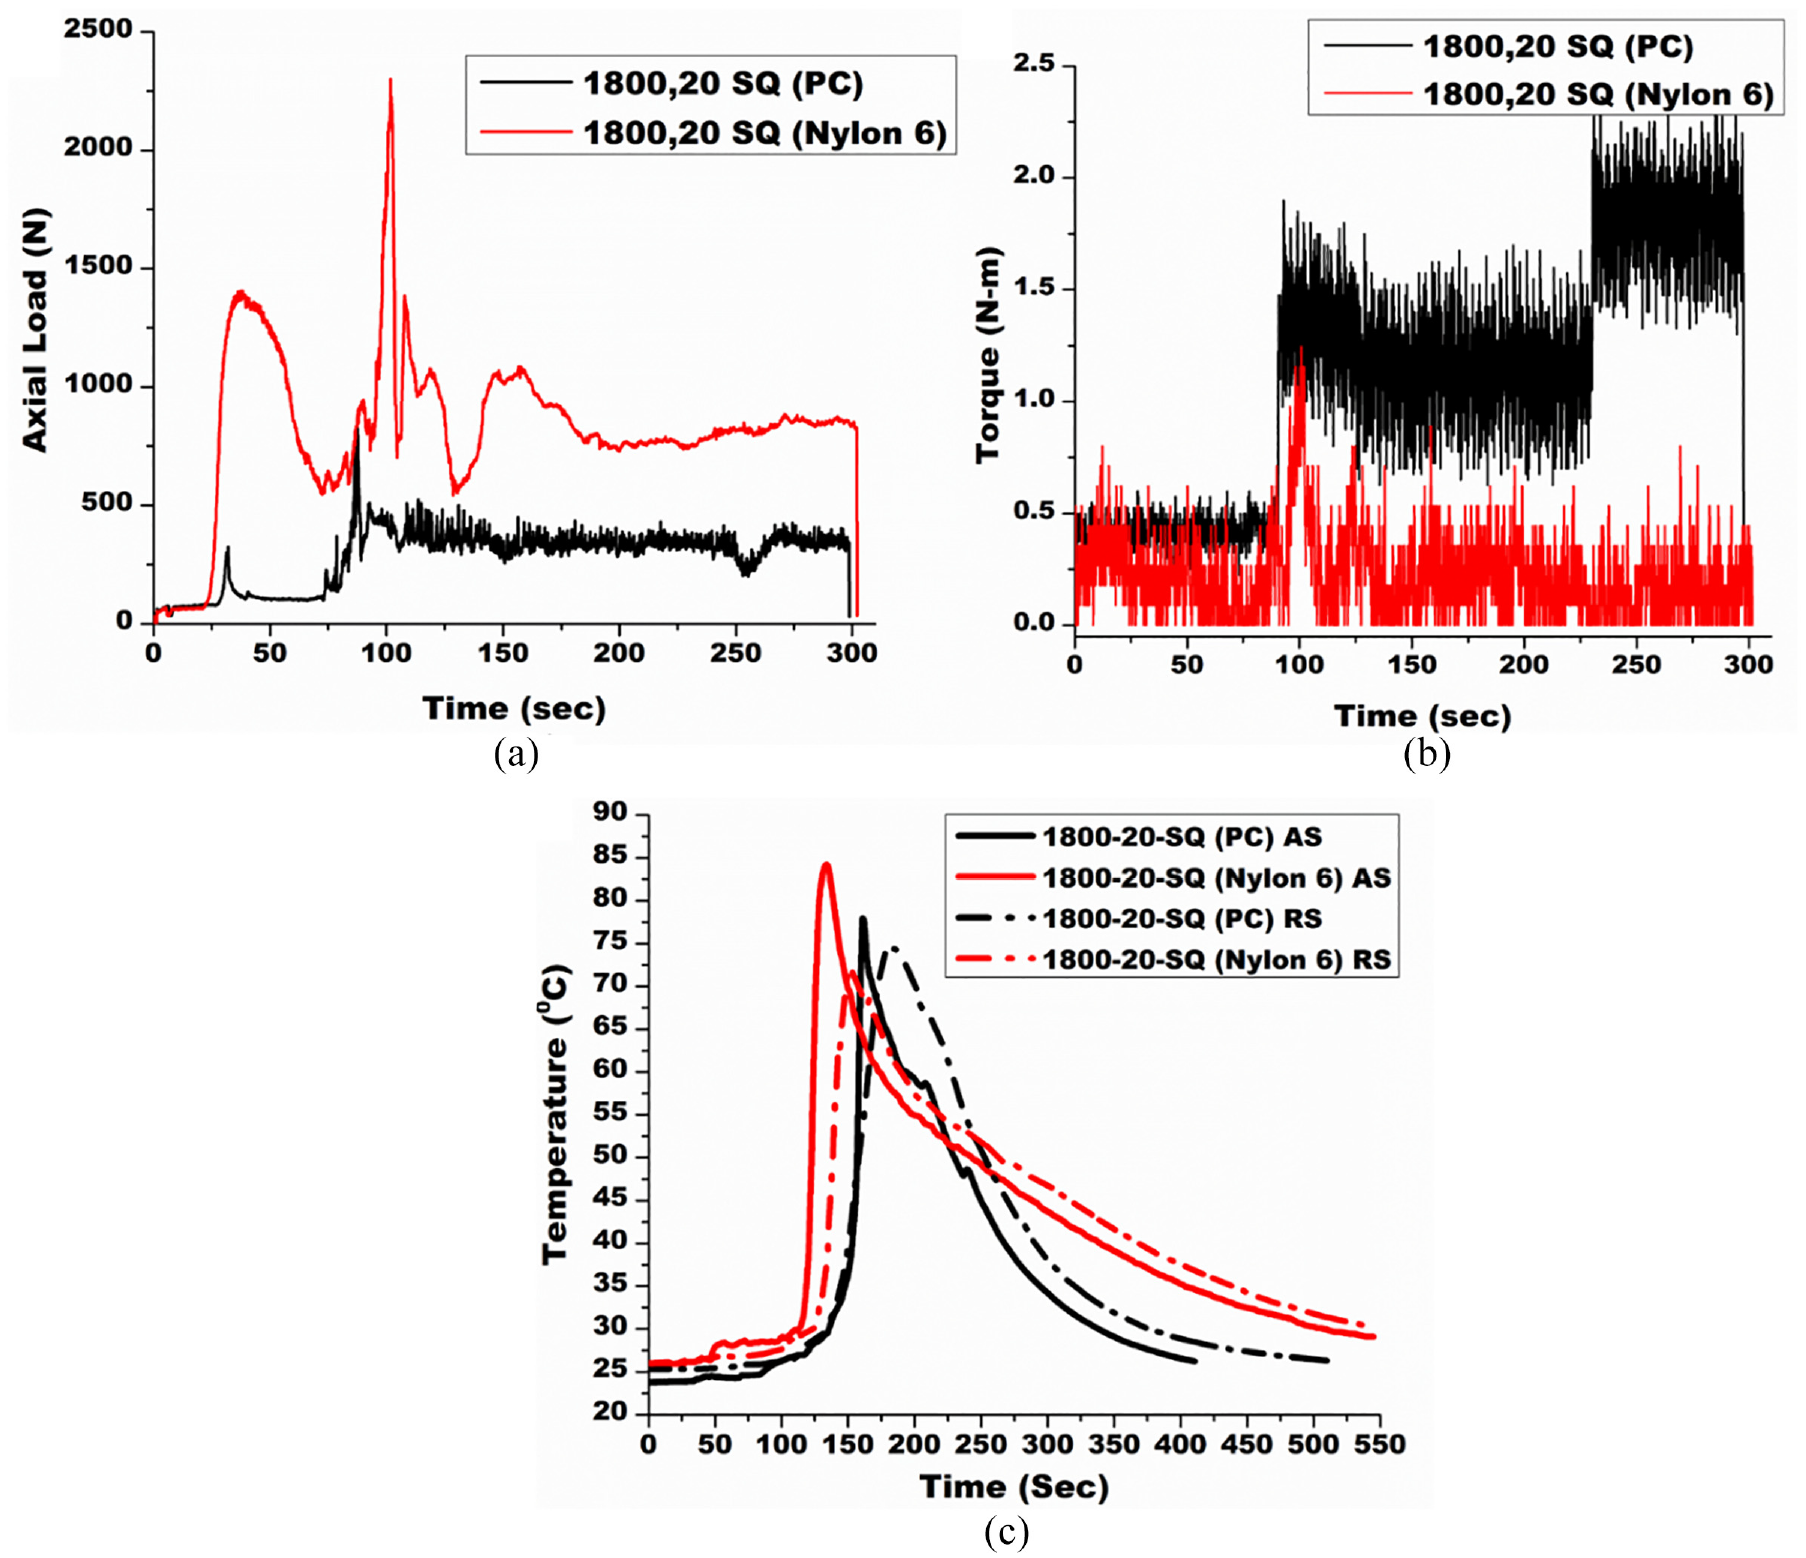
(a) Thrust force with respective (b) Torque and (c) Weld Thermal signals for strongest weld joint of PC and Nylon 6 (Expt. #14).
The thermal cycles along advancing and retreating sides of tool rotation for the above two best weld joints have been illustrated in Figure 7(c), respectively. The weld peak temperature was somewhat less with relatively higher cooling rate at advancing side whereas the peak temperature and cooling rate both were slightly higher at tool retreating side for PC weld than N6. Thus, the cooling rate was comparatively higher along the weld interface toward advancing side than retreating side, though, the weld peak temperature was almost found to be same at both ends of the weld. Therefore, weld micro-hardness along advancing should be higher in the weld samples.
The stress elongation behavior of the strongest and the weakest joints for PC and N6 using each tool pin profiles have been indicated respectively as per acquired load versus elongation data during tensile test in Figure 8(a) to (c). There was sudden drop in stress development using cylindrical pin whereas it was slightly curved using higher swept ratio pin contours indicating brittle failure and ductile failure, respectively for the strongest welds particularly in case of N6 as shown.
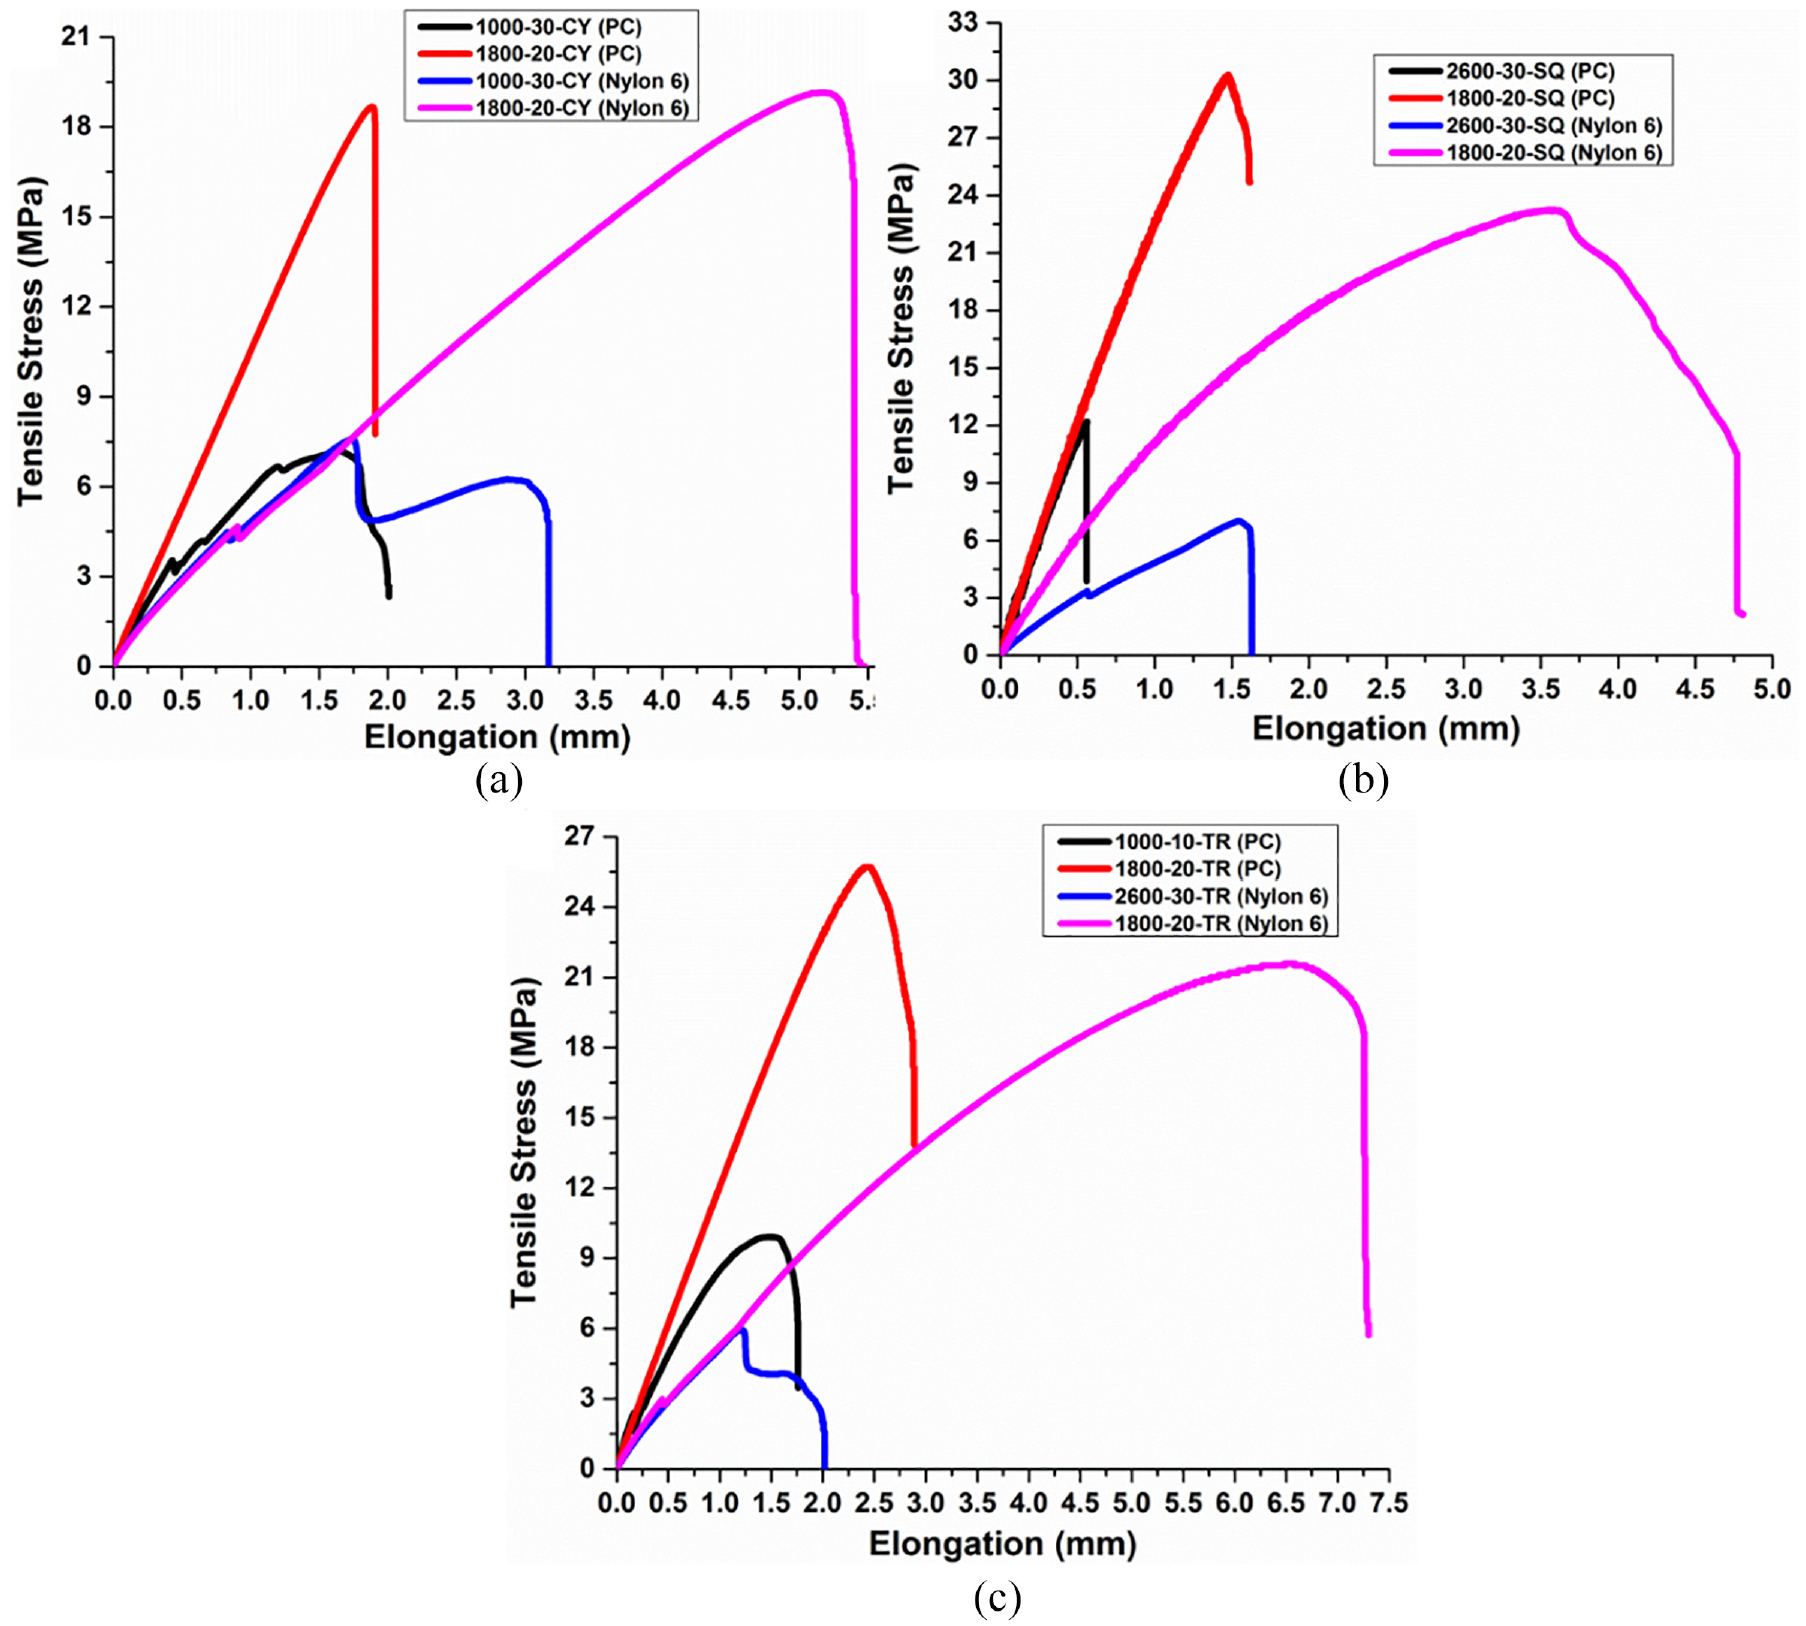
Stress elongation diagram for strongest and weakest joint using: (a) cylindrical, (b) square, and (c) triangular tool pin.
The micro-hardness variation profile for the strongest and the weakest joints for PC and N6 as base materials using each tool pin profiles have also been illustrated in Figure 9(a) to (c) respectively. The hardness deviation from weld zone to weld bead interface was found to be higher28,29 for the weakest welds than the strongest joints for PC irrespective of tool pin profiles. However, there was some discrepancy was observed using higher swept ratio tool pin contours particularly using triangular pin (Figure 9(c)). This hardness variation was also more pronounced in case of N6 as base material rather than PC as shown. It was to be noted that minimum “shore-D” hardness was found to be at the weld interface rather than stirred weld zone in all the welds indicated adequate material stirring during tool rotation. The micro-hardness was found to be higher toward advancing side rather than retreating side of tool rotation using each tool pin profiles for PC as well as N6 as weld material due to higher cooling rate as per acquired thermal cycles stated above. However, the weld stirred zone hardness was considerably less than base material hardness for both the base materials due to slow cooling caused by low thermal conductivity of these thermoplastic polymers.
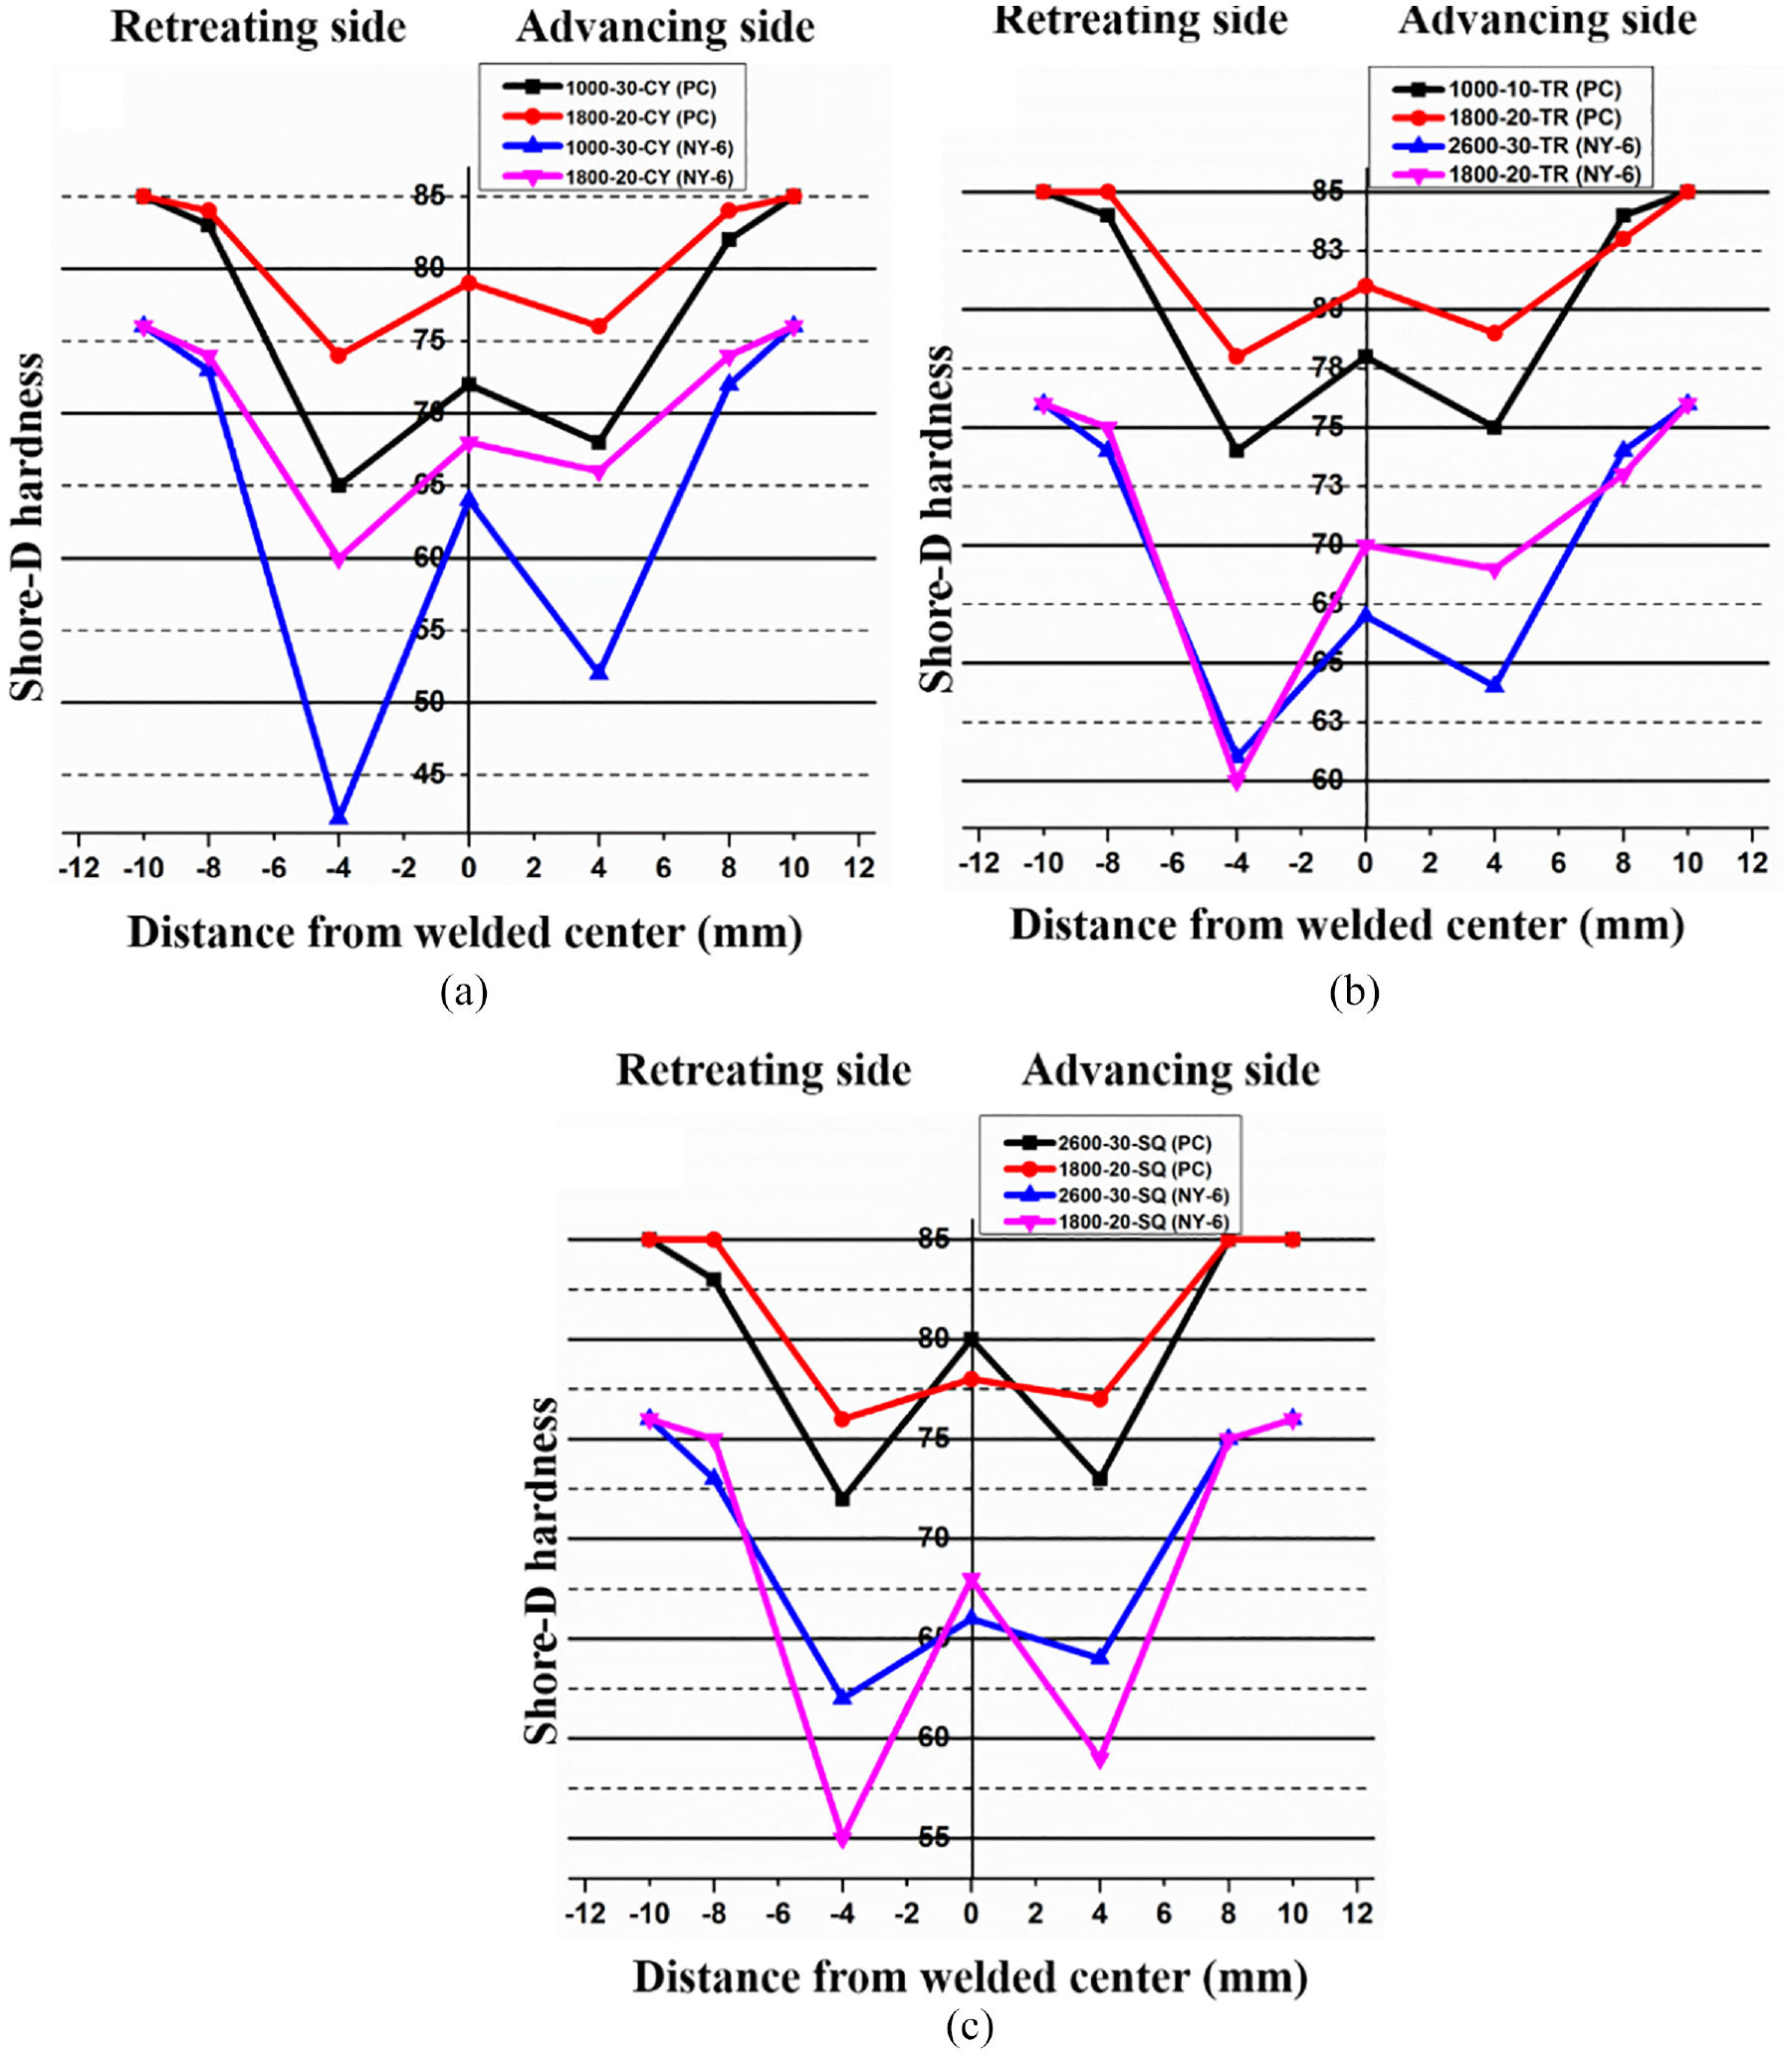
Variation of weld micro-hardness for strongest and weakest joint using: (a) cylindrical, (b) square, and (c) triangular tool pin.
The fractured weld samples after the tensile test for the strongest and the weakest joint using PC and N6 as base materials have been shown in Figure 10(a) to (d), respectively. The weakest zone was found to be along the advancing side of weld interface for all the welds (as hardness deviation was more at this zone) except using PC as base material with square tool pin contour in which failure started at tool stirred zone rather than weld interface as shown in Figure 10(b). The retreating side of the welds was found to be stronger than advancing side possibly due to material scooping action from advancing to retreating side during tool stirring action though hardness deviation was found to be the maximum at retreating side.
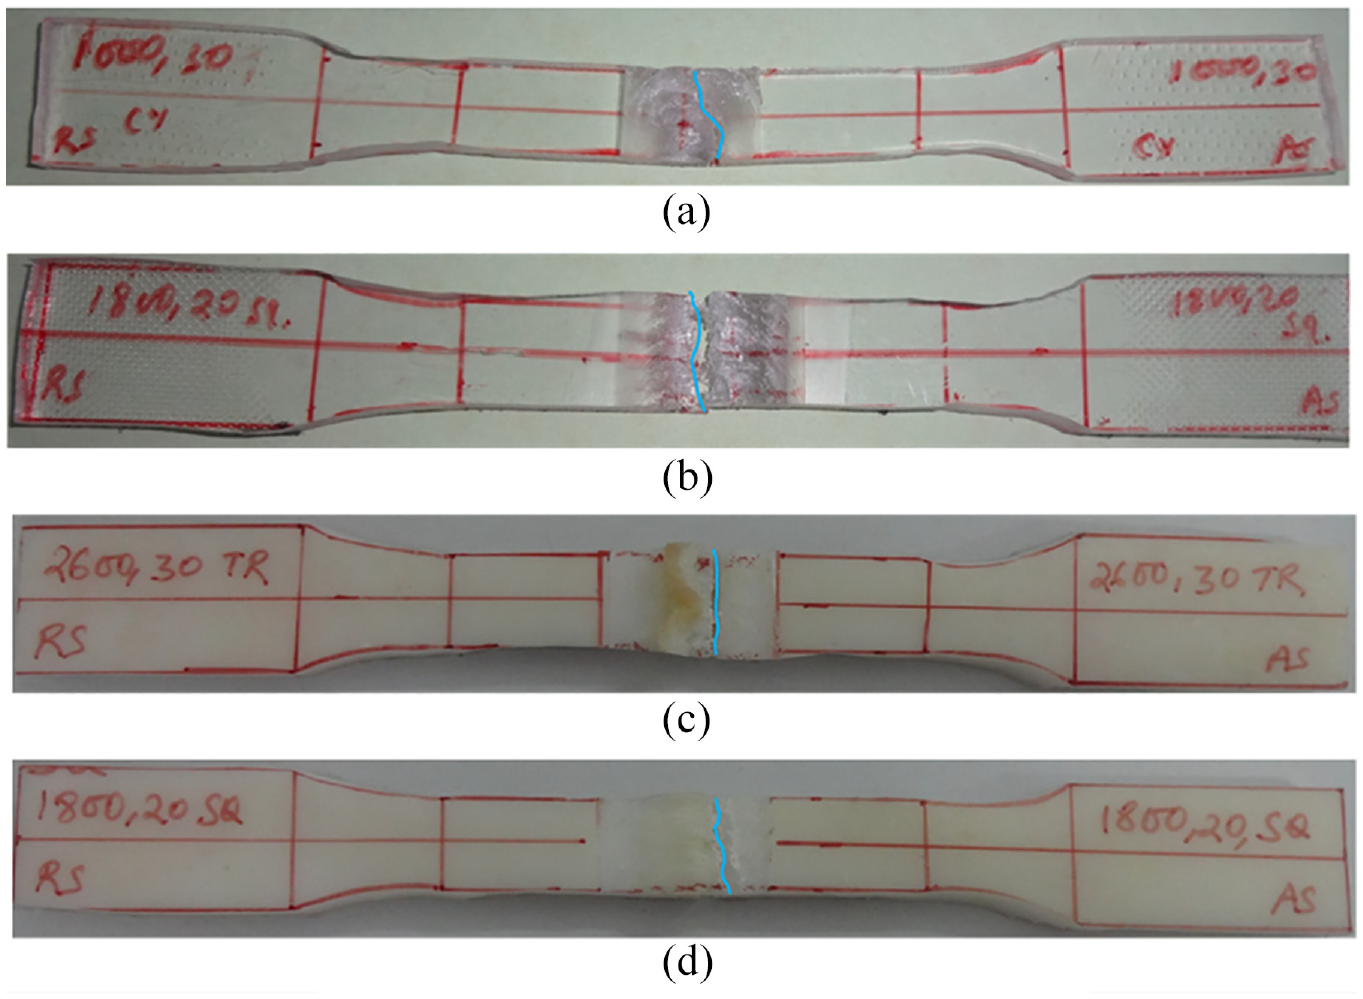
Weld joint samples of strongest and weakest joint after tensile test: (a) 1000 RS – 30 TS – cylindrical pin (PC), (b) 1800 RS – 20 TS – square pin (PC), (c) 2600 RS – 30 TS – triangular pin (N6), and (d) 1800 RS – 20 TS – square pin (N6).
The weakest failure zone during tensile test considering of all weld joint failures corresponding to first total 27 number welding experiments using different pin profile for polycarbonate and nylon-6 as base material have been presented using histogram in Figure 11. It indicated that the stirred zone was found to be weaker only in case of polycarbonate base material using higher swept ratio tool pin (37% cases). However, the maximum number of weld failure occurred at tool advancing side (40.7% and 77.8% respectively using PC and N6 weld material) particularly using cylindrical tool pin for each weld material as shown. It was occurred primarily due to higher cooling rate toward advancing side which resulted harder surface for crack initiation during tensile test.
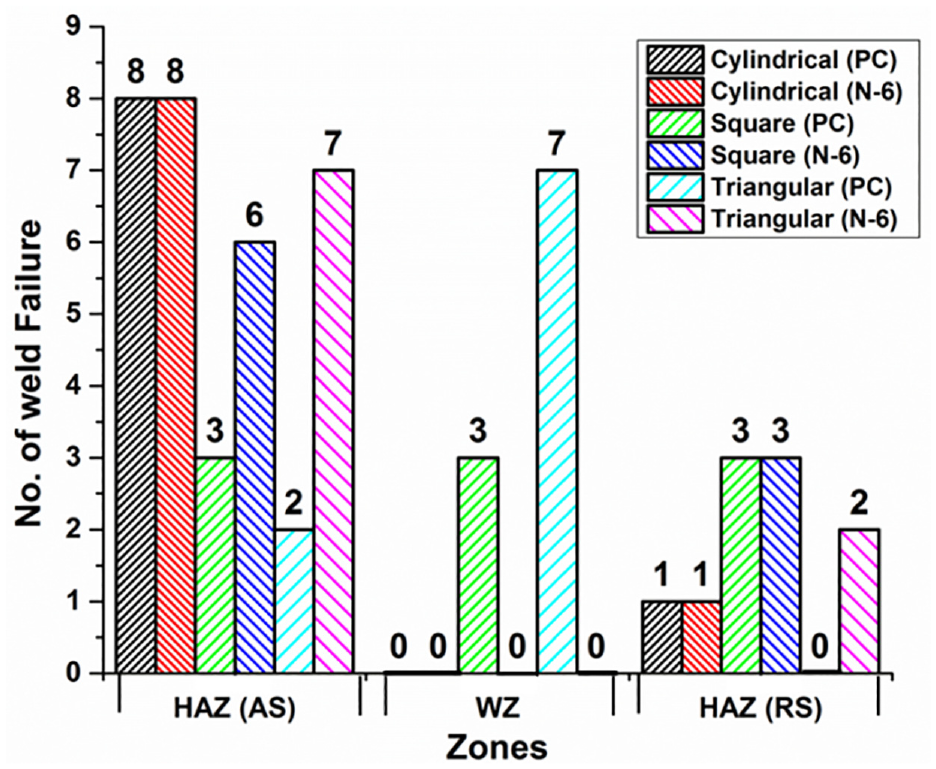
Histogram indicating weld failures in different weld zones for different pin profile.
The macrographs of the cross weld bead geometry having different welding zones such as weld stirred zone (WSZ), thermo-mechanically affected zone (TMAZ), and heat affected zone (HAZ) have been examined for better understanding regarding weld quality issues. The influence of process variables on weld bead shape (and size) have been studied using each base material. The strongest weld joints were found to be using square tool pin whereas the weakest joint with cylindrical and triangular pin for PC and N6 as base weld materials, respectively. The weld bead geometry macrographs for the best and the worst joints have been presented in Figure 12. The shoulder influenced area was found to be wider than pin influenced zone as the shoulder effect was limited on the surface of the base work, while the lower part of the weld primarily influenced by the tool pin as shown. The tool shoulder affected area was relatively higher than pin affected area for PC, whereas pin influenced area was thinner using N6. Thus, the gross weld joint area was higher using PC than N6 as shown.
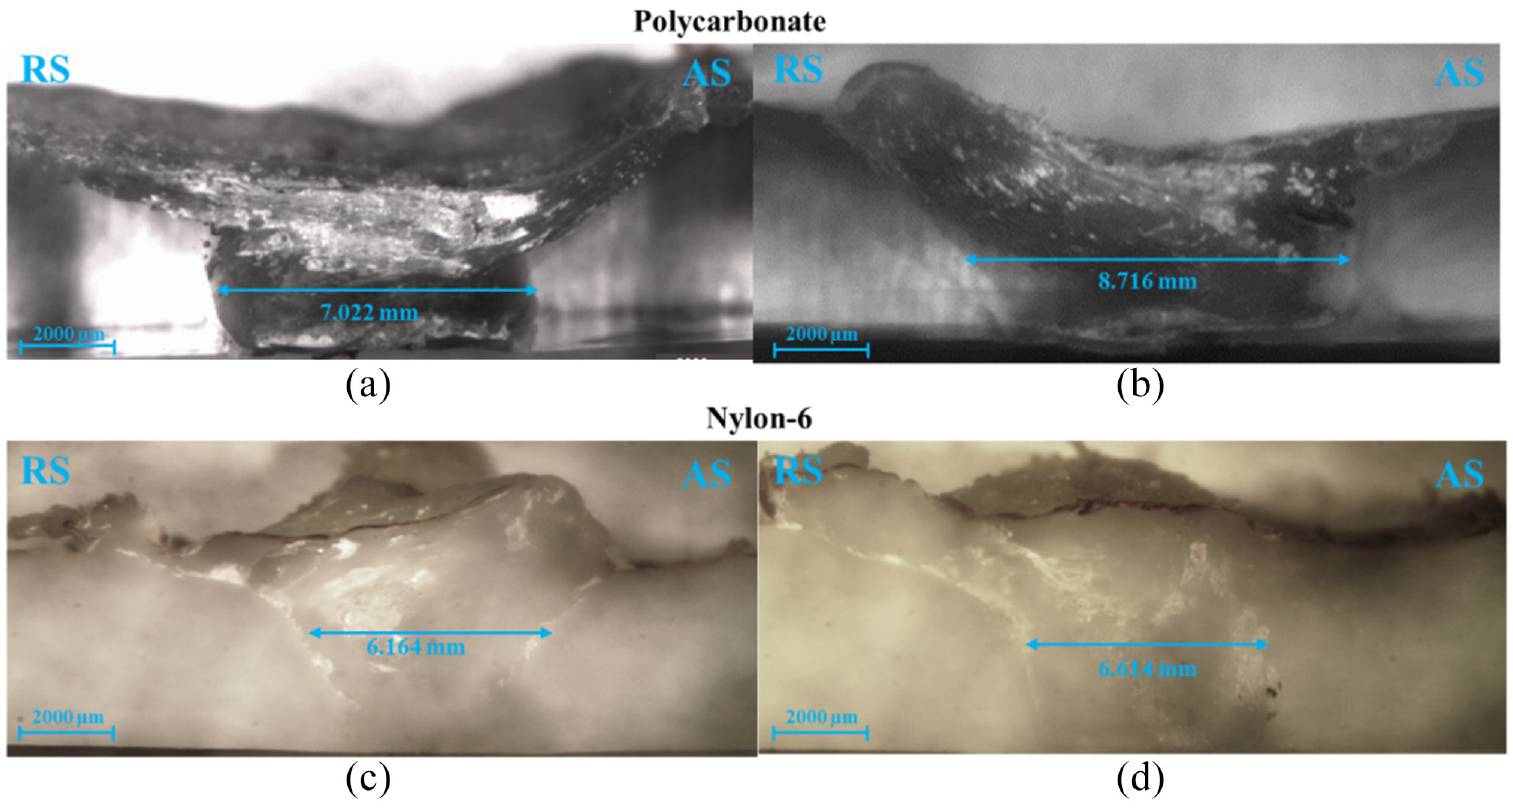
Weld bead macrograph of strongest and weakest joint: (a) 1000 RS – 30 TS – cylindrical pin (PC), (b) 1800 RS – 20 TS – square pin (PC), (c) 2600 RS – 30 TS – triangular pin (N6), and (d) 1800 RS – 20 TS – square pin (N6).
The stirred material was found to be unidirectional following tool rotational path from advancing (AS) to retreating side (RS) in case of square as well as triangular pin profile. It indicated essential material stirring by the square as well as triangular tool pin which in turn improves weld strength. However, there was slight non-uniformity in weld profile was noticed using each pin profile particularly cylindrical pin. The weld bead was somewhat trapezoidal shape for PC which was changed to tool replica that is, T-shape using N6 as base weld material. However, there were minor undercut defects due to material stirring from AS to RS (at weld center or weld interface) more weld reinforcement height (at weld interface only) for using PC or N6, respectively. This undercut problem was more predominant at weld center and tool AS or RS at 1000RS-30TS with cylindrical pin and 1800RS-20TS with square pin respectively (weakest and strongest joint respectively) for PC welds whereas, this phenomenon was minor or over-reinforcement height at 2600RS-30TS with triangular pin and 1800RS-20TS with square pin using N6 as base weld material as shown in Figure 12. This undesirable high weld reinforcement was due to higher material expulsion at high tool rotational speed even with high traverse speed using high swept ratio triangular pin for N6 (Figure 12(c)). It was resulted into poor joint strength (<6 MPa) where failure occurred at the weld interface along tool advancing side (AS). On the other hand, the weakest PC joint was due to non-uniform tool stirring process, lead to higher weld reinforcement along tool advancing side for which joint failure occurred at the weld interface along this side as shown in Figure 12(a). In the same manner, the minor undercut at weld center or tool advancing side which in turn primarily dictated the weakest weld zone for PC or N6 welds in Figure 12(b) and (d), respectively. The back side offsite weld reinforcement image also clubbed over focused weld bead reinforcement in case of N6 welds due to slight non-uniformity in weld profile as shown. The weld reinforcement height with undercuts on both sides was found using cylindrical pin whereas it was reduced significantly without noticeable undercut for square or triangular pin for N6 welds. The width of weld stirred zone was found to be increased with higher aspect ratio pin profiles for each weld material. However, the joint strength slightly reduced using triangular pin than square pin because of over expulsion of weld material along with asymmetric weld bead shape. The pin influenced U-shaped stirred zone was more noticeable with square or triangular pin contour.
Discussions on summarized outcomes
The present investigation on the feasibility of friction stir butt welding for crystalline N6 and amorphous polycarbonate indicated its better feasibility for the joining of each base material. The mechanical behavior of the joint due to tensile load has been studied with corresponding weld bead geometrical macrographs along with hardness variation through the weld centerline.
The major work outcomes have been summarized as follows:
The joint quality was expressively improved at center point welding parametric condition (i.e. N1800-V20) for each tool pin profile, especially using square pin with the highest joint efficiency of 49.86% and 60.06%, respectively for N6 and polycarbonate weld material.
The hardness variation is more noticeable in N6 rather than polycarbonate. This hardness nonconformity from weld stirred zone to heat affected zone is comparatively improved using higher swept ratio pin profiles for N6 as well as polycarbonate welds.
There was higher axial force generation along with relatively low torque requirement using N6. It was primarily due to unrestricted material transfer from tool advancing to retreating side with highly elongated N6 as surrounding base material together with high axial thrust and its fluctuation for stable material stirring process.
The weld peak temperature was slightly less with relatively higher cooling rate toward tool advancing side while both the peak temperature and cooling rate were relatively higher along tool retreating side for polycarbonate than N6 weld.
The weld zone to heat affected zone interface particularly toward the tool advancing side was found to be weaker due to higher cooling rate in most of the cases for each base material.
The joint efficiency reduces also due to undercut defects along weld interface or even at weld center caused by material scooping from tool advancing side or over material expulsion during material stirring process for N6 or polycarbonate welds, respectively.
Concluding remarks
The friction stir welding is highly practicable for the joining of polycarbonate and nylon-6 in similar butt configuration. The highest joint efficiency of polycarbonate weld is somewhat better (>10%) than nylon-6 weld due to lower axial tool thrust (0.4 times) and higher material stirring torque (5.54 times), higher weld cooling rate (1.53 times) along with higher weld joint area using square tool pin at intermediate rotational and traverse speeds. Thus, the mean joint efficiency can be improved up to 40%–60% using square and triangular tool pin profile, with a drastic corresponding reduction in ductility (0.38 and 0.66 times respectively) in polycarbonate weld considering same input parametric range. The variation of each process parameter is more sensitive on joint strength using triangular followed by square pin particularly in polycarbonate weld. In contrary, the degree of uniformity in weld hardness improves using higher swept ratio tool pin profiles for each weld base material. The most of the tensile failures in both N6 and PC welds (>75% and 40% respectively) are found to be occurred along the tool advancing side interface due to harder brittle surface or material scooping action. The higher tool shoulder influenced weld stirred area (i.e. more material expulsion) weakens the weld center in PC welds in specific parametric conditions.
Footnotes
Appendix
Acknowledgements
The authors are remarkably grateful to “Friction stir welding Laboratory and Steel Technology Centre (STC)” of the Department of “Mechanical Engineering,” IIT Kharagpur for carrying out the welding experiments, weld sample preparation, and post weld measurements.
Declaration of conflicting interests
The author(s) declared no potential conflicts of interest with respect to the research, authorship, and/or publication of this article.
Funding
The author(s) received no financial support for the research, authorship, and/or publication of this article.