
Abstract
During the fabrication of pressure hulls, plastic processing is indispensable, which is an environmental, highly effective, and economical processing method. However dimensional error is also induced during plastic processing. This kind of error is one type of defection, which makes the hulls in danger, especially when the hulls suffer eternal pressure. Von Mises theory is an effective approach to study failure of pressure hulls. In this paper, numerical simulations are performed to investigate influence of distribution of defections along the axial direction on the ultimate strengths of titanium alloy pressure hulls of long barrel shape with two vessel heads using ABAQUS. The results of numerical simulations show that the ultimate strengths of pressure hulls with defections are relative to the location and distribution of defections, and they are decreasing with reduction of the average ratio and standard deviation when the hull suffers eternal pressure. The method of evaluating degradation of ultimate strength based on simulations can be employed to check the safety of pressure hulls.
Introduction
Deep-sea vehicles have been developed rapidly with the increasing demand of exploiting mineral and biological resources distributing at the bottom of the sea. The safe and robustness of the most key component in the deep-sea vehicles – the pressure hull, have been focused by more and more researchers.
In all shapes of the pressure hulls used in deep-sea, spherical shape shell is used most widely because of its simple structure and processing convenience. There are two modes for failure calculation of spherical shape pressure hulls. One is the plastic failure, the other is buckling failure. In the plastic failure mode, the ultimate strength is related to the yield strength of the material, the thickness and radius of the spherical shell. In the buckling failure mode, lots of investigations have been conducted.1–3 Which failure mode occurs depends on the ratio of the thickness to the radius of the spherical shell. When the ratio is low, the spherical shell is prone to failure in the plastic mode. When the ratio is high, the spherical shell is prone to failure in the buckling mode.
Ultimate strength and structural design of the spherical shape pressure hulls have been studied in-depth, and some standards have been formulated. However deep-sea vehicles of new generation demand long-time service and high capacity. Ultimate strength and structural design of pressure vessels of long barrel shape with two vessel heads need investigating. On the other hand, defection induced by processing during the pressure vessels fabrication cannot be avoided. To investigate the influence of the defection on the pressure vessels, four kinds of assessment methods have been proposed, which are Crack Opening Displacement (COD) method, 4 Stress Intensity Factor (SIF) method, 5 two-criteria approach, 6 and J-integral method. 7 The defections on the pressure vessels are usually caused by nonuniform of the sheet thickness, plastic processing, residual stress caused by welding and stress concentration effects caused by discontinuities on the shell. Miller 8 summarized the limit load solutions for cylinders with though-wall, surface, and extended surface axial defects under internal pressure available before 1987. Recently Staat,9,10 Kim et al.11,12 proposed different solutions for cylinders with axial defects with the help of finite element analysis. Defection is difficult to be removed entirely because of the manufacturing process. 13 It is more executable to evaluate the effect of the defection on the ultimate strength and find the method to control the damage of the defection to ensure the pressure vessels to serve safely.
In the investigations on the deep-sea vessels, finite element method (FEM) and tangent modulus theory are often used to calculate the ultimate strength. Hsu et al. 14 used the finite element procedure based on the Hibbitt and Karlsson’s methodology to analyze the curvature effects and failure modes influence on stress concentrations around opening of the pressure hull. Graham 15 employed FEM to predict the nonlinear elasto-plastic collapse of ring-stiffened cylinders under hydrostatic loading. Blachut and Smith 16 conducted numerical and experimental study into buckling performance of multi-segment pressure hull subjected to uniform hydrostatic pressure.
Introducing some preset cracks or imperfections into the deformation body is one normal method to investigate the influence of defections on the plastic forming performance. Marciniak and Kuczynski 17 (M-K) presented a method that introduced an initial imperfect band into an infinite sheet metal in the form of thickness reduction as a mechanism to trigger the deformation instability. M-K model has been extended to analyze sheet metal necking by considering different aspects of forming processes. Yao and Cao 18 improved the accuracy of FLD prediction under nonlinear strain paths by evolving the center and curvature of the yield function using M-K analysis. Wu et al. 19 evaluated the predictive capability of the anisotropic yield criteria with the help of FLD obtained by M-K analysis. Safikhani et al. 20 introduced an internal length scale into conventional constitutive equations in conjunction with M-K approach to determine the forming limit stress and strain diagrams. Yu et al. 21 employed effective failure strain ratio (EFSR) 22 to study the anisotropic influence on the degradation of edge stretchability in hole-expanding. The method that employing M-K concept to set imperfection in simulations is proved useful to investigate the influence of material properties and geometrical characteristic on the failure of structures or forming process.
The locations and shapes of defections on the surface of the pressure hulls are random, but the distribution of these defections can be classified in meridian direction, in the axial direction or the combination of the above two. The influence of defections in meridian direction on ultimate strength of pressure hull has been investigated by the authors in the method of changing the eccentricity of the barrel. 23 In this paper, a quantitative method is proposed to evaluate effects of distribution of defections along the axial direction on a pressure hull of long-barrel shape on ultimate strength. The method adopts the M-K concept to characterize dimensional defections from previous manufacturing operations. An index, the degradation ratio (DR), is introduced in this article to describe the deterioration of ultimate strength of the hull. Average ratio (AR) and distance standard deviation (SD) are employed to describe the distribution of the defection in the axial direction. Numerical studies with ABAQUS/Explicit are conducted to demonstrate applicability of those indexes. The results show that the degradation of ultimate strength of the pressure hulls can be described in the form of average ratio and distance standard deviation. The degradation ratios decrease with increasing of average ratio and distance standard deviation. And a qualitative link between degradation ratio and average ratio with distance standard deviation has been clearly demonstrated.
Methodology
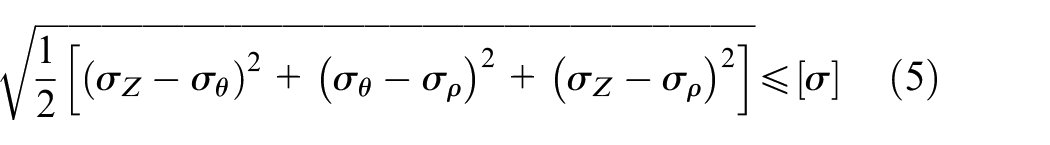
Von Mises yield theory is widely used to describe yielding performance of metal materials. It is assumed that the hardening behavior of the material during the eternal pressure loading gradually is isotropic. Von Mises yield criterion is also used as the failure criterion. The precisely predicting failure of pressure vessel is not the main purpose of this paper. The adoption of failure criterion is to make the fracture of the hull visible and in the same failure mode. Von Mises theory is shown as equation (1).
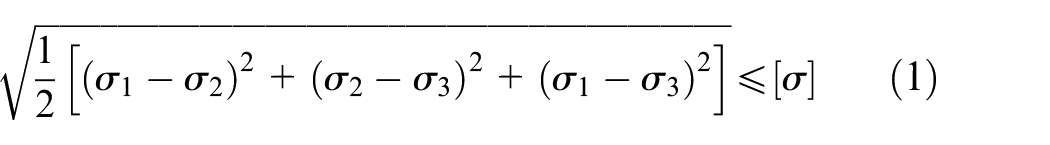
In equation (1),
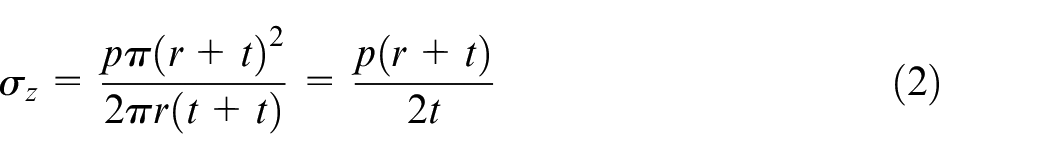
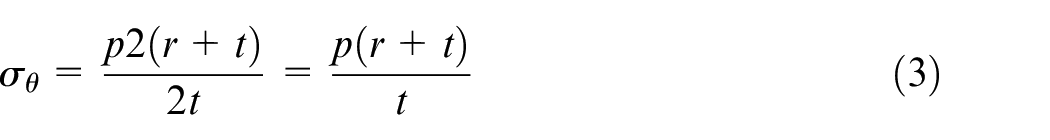
For a thin-wall pressure hull with the inner radius r and thickness t as shown in Figure 1, if the hull suffers eternal pressure p, the stress components can be calculated as equations (2)–(4).

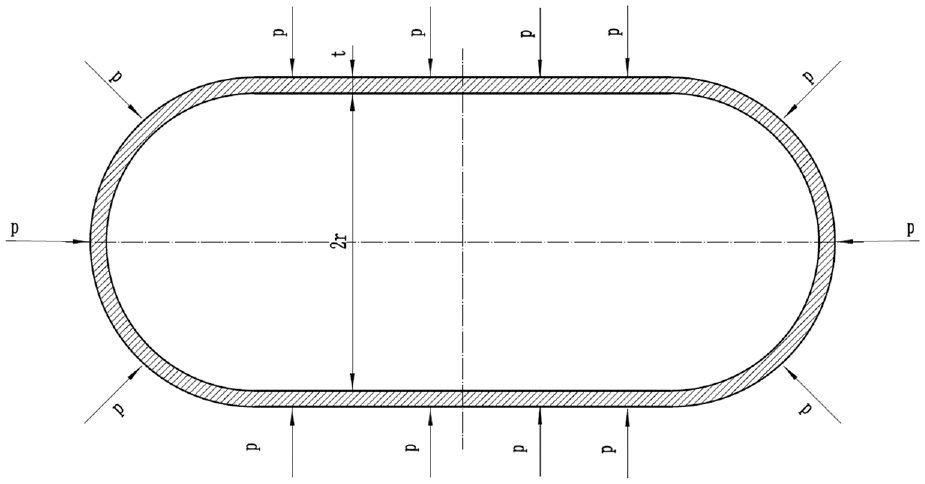
Pressure hull suffering eternal pressure.
Where
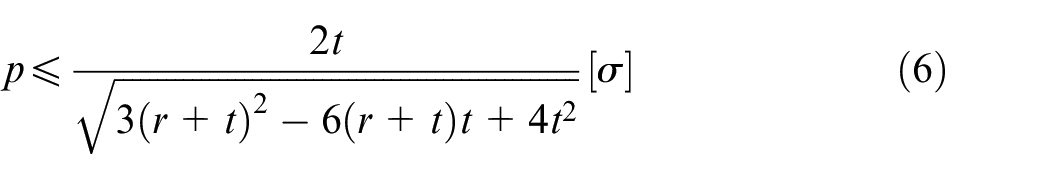
For a perfect long barrel shape pressure hull, the ultimate strength suffering eternal pressure is
Simulations
Material properties
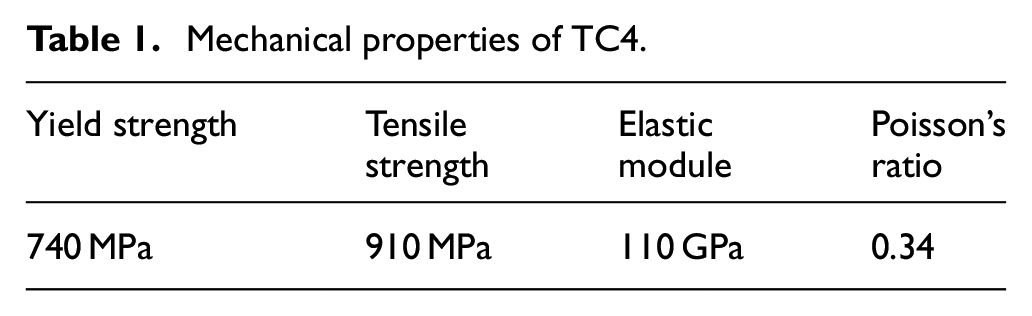
The material employed in this paper is TC4 titanium alloy. TC4 titanium alloy is a typical α+β alloy. It is widely used in warship building, medicine industry, aircraft and aerospace fields because of its good corrosion-resistance and high specific strength. The mechanical properties of TC4 are shown in Table 1.
Mechanical properties of TC4.
Simulation settings
In simulation models, the thickness of the pressure hull is set as 3 mm. The length of the barrel part is set as 260 mm. The inner diameter of the hull is 200 mm. The thickness and inner diameter of vessel heads of the hull are the same as those of the barrel part. The shape of the hull with dimensions is shown in Figure 2.
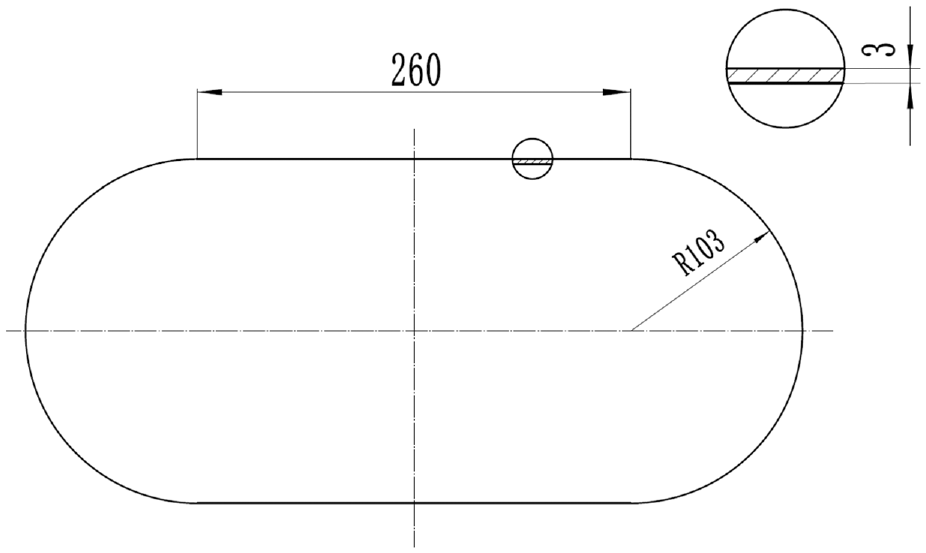
Illustration of pressure hull in simulations with dimensions (Unit: mm).
In order to study the influence of distribution of defections along the axial direction, several defections are preset on the hull surface. The defections are expressed as thickness reduction. In the zone of defection, the thickness is 2.1 mm, which is 30% thinner than the other part, with the width of the defections set as 12 mm. The numbers of defections are set as 1 to 7. The location of the central lines of defections are set as 0, 28, 56, 84, 112 mm to central line of the hull. The locations and the shape of defections are shown in Figure 3.
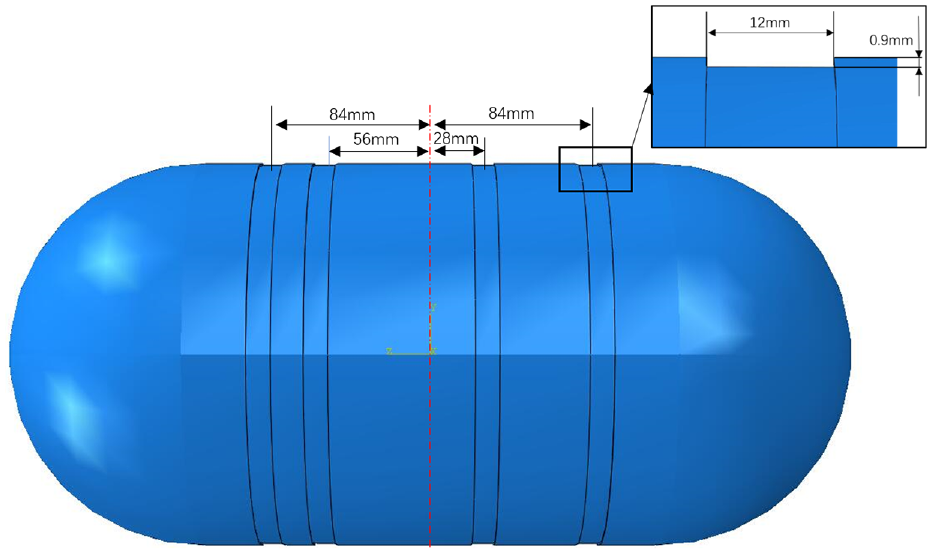
Illustration of locations and shape of defections (one type of distributions with 4 defections).
In the numerical models, defections on the surface of the pressure hulls are expressed as thickness reduction, which adopts the M-K concept to induce imperfection. This assumption is rare in current literatures. In current literatures, there are two methods to deal with the dimensional error. One is inducing the buckling in the ultimate pressure analysis, the other is inducing the initial deflections obtained by measurement system. Neither two methods can evaluate the distribution of defections systemically, because these two methods lack parameters which can change regularly.
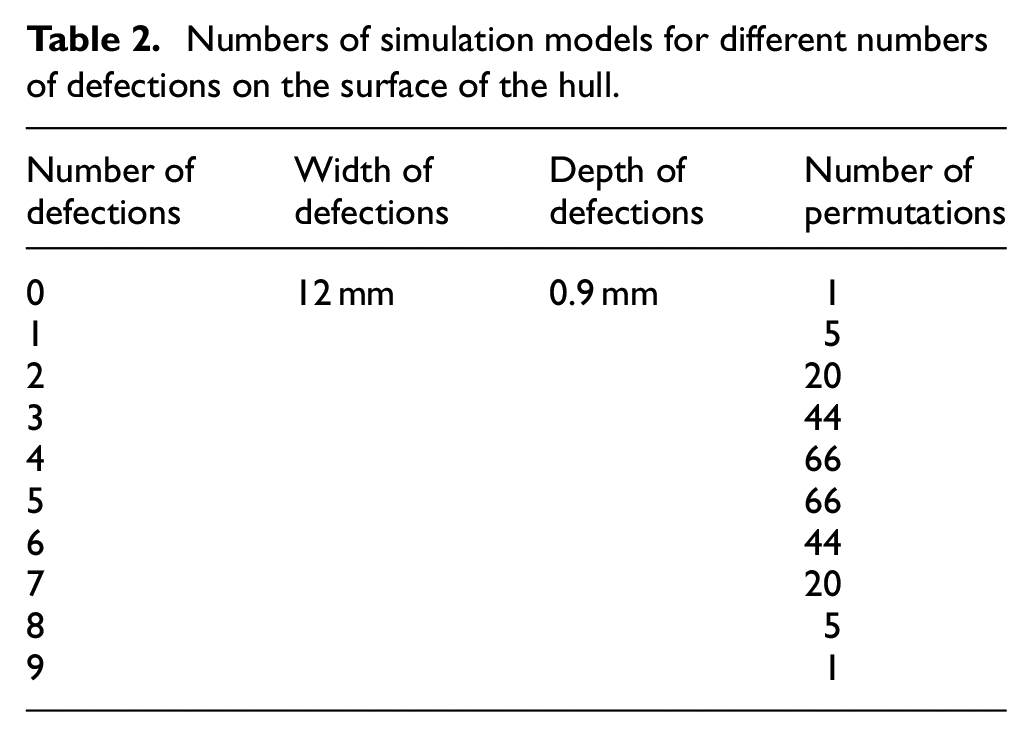
With different numbers of defections preset, the numbers of simulation models are different, which are shown in Table 2.
Numbers of simulation models for different numbers of defections on the surface of the hull.
Simulations are performed with ABAQUS/Explicit. Isotropic hardening and Von Mises criterion are assumed. The threshold value of cracking is set the same as the tensile strength of TC4, which is embedded in ABAQUS with the help of user subroutine VUSDFLD. The size of the elements is set as 1.5 mm × 1.5 mm × 1.5 mm. The type of the elements is set as C3D8R. C3D8R in ABAQUS/Explicit is an element type, which is eight-node linear brick, reduced integration with hourglass control. The loading conditions and the constitutive models employed in the numerical models are the same. The differences among these models are only the locations and number of the defections. Though this type of element is not stiff enough for bending and less precise in stress simulation than full integration, C3D8R can cost less time to conduct enough models and obtain enough data for analysis.
Eternal pressure is applied on the outer surface of the hulls. In order to obtain the ultimate strength of the hull, the pressure is set to increase with the time gradually. The field variables including the damage value are set to output by every 0.01 MPa to obtain the accurate ultimate strengths of the pressure hulls when the hulls are pressed to fracture.
Simulation results
Visualization of the crack propagation
With the increasement of eternal pressure, the evolution of damage value of the hull is observed in ABAQUS. The increasing of damage value of the pressure hull with one example of 7 preset defections is shown for example in Figure 4.
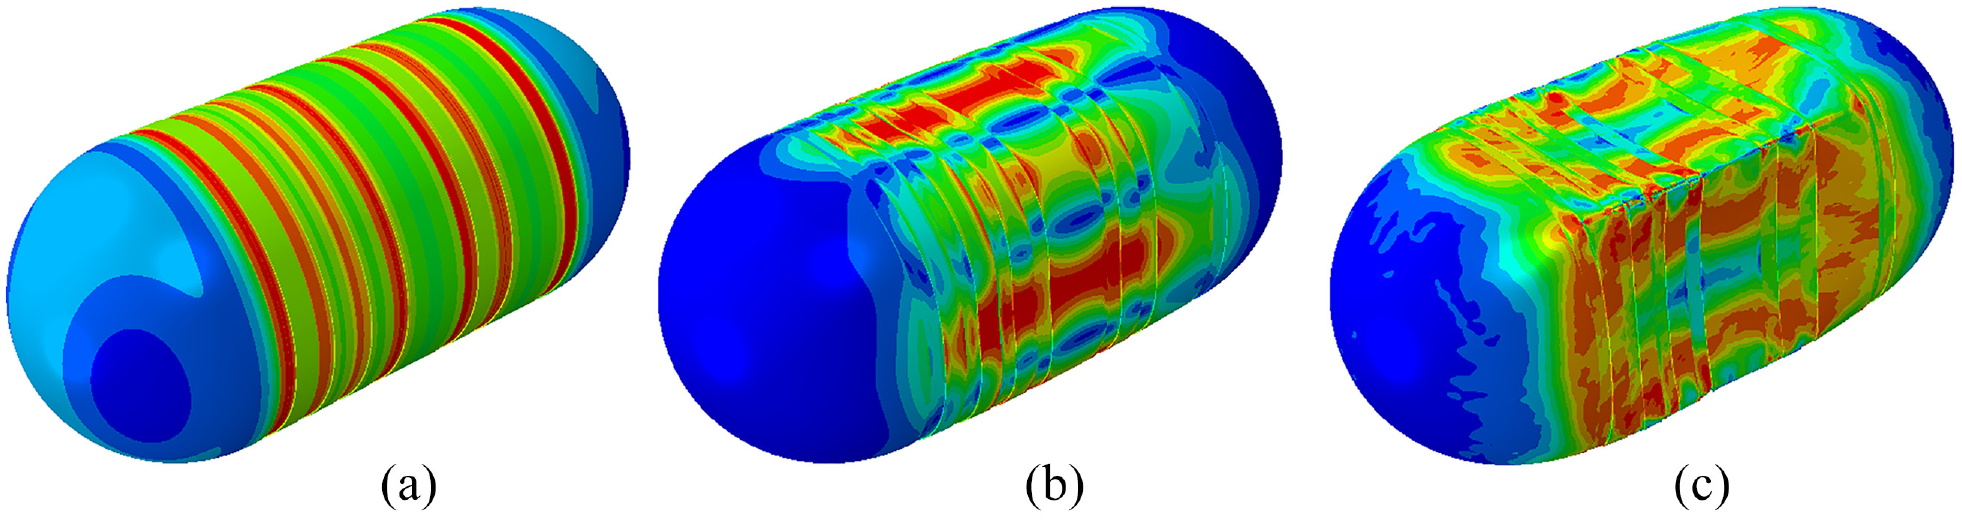
Crack propagation on the structure with one example of 7 defections location (p is the eternal pressure at the moment): (a) p = 10.41 MPa, (b) p = 14.72 MPa, and (c) p = 14.8 MPa.
The simulation of exerting pressure gradually could make the cracking propagation visible, and the accurate ultimate strengths can be obtained easily in this way.
Average values of the ultimate strengths of pressure hulls
Inducing defections makes the ultimate strengths of the hulls down. In order to describe the deterioration of the ultimate strength, degradation ratio (DR) is introduced in equation (7).
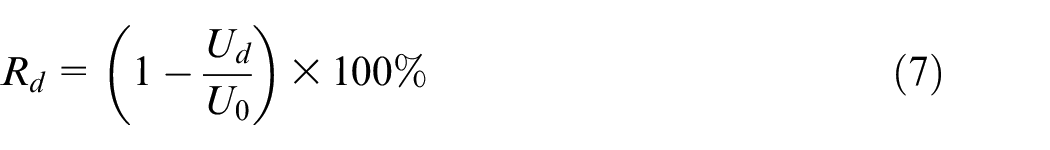
In equation (7),
After calculating the results of ultimate strength with different numbers of defections, the average degradation ratios of ultimate strength with different numbers of defections on pressure hulls are shown in Figure 5.
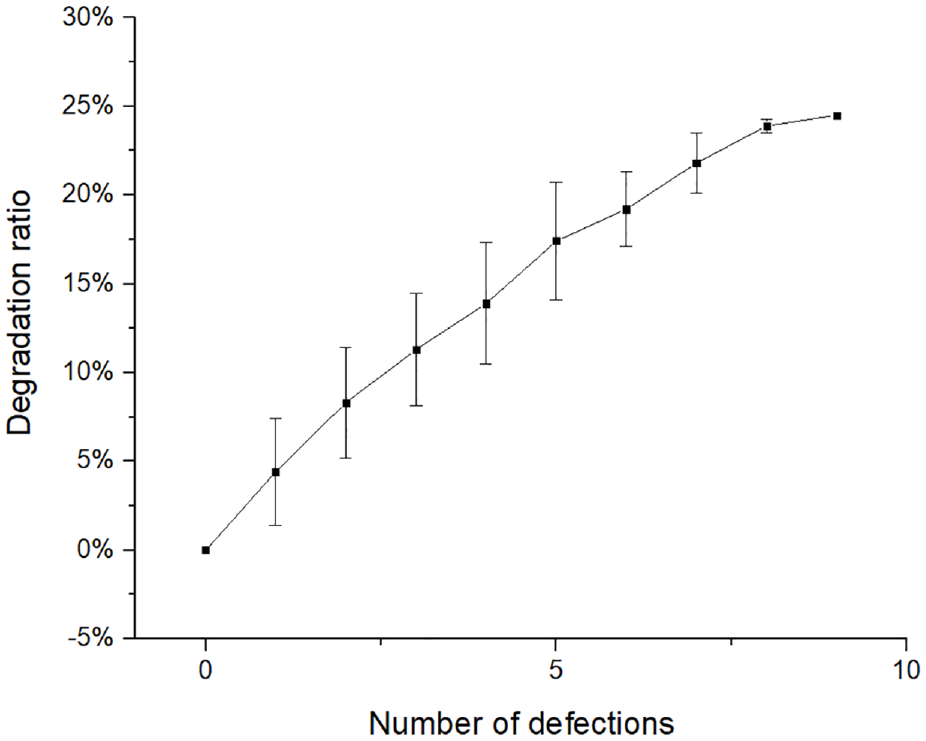
Degradation ratio of ultimate strength with different numbers of defections.
After polynomial curve fitting of the data, an equation about the degradation of ultimate strength of pressure hull relative to the numbers of defections is obtained as equation (8)

In equation (8),
Ultimate strengths with different numbers of defections
There are different combinations of the locations with different numbers of defections (see Table 2). With the same numbers of defections, the degradation ratios of ultimate strengths with different defection distribution are quite different.
In order to quantify the influence of distribution of defection of the pressure hull on the ultimate strength, two indexes are proposed, which is average ratio (AR) and distance standard deviation (SD). Average ratio refers to the average value of the distance from each defection to the middle axle line of the pressure hull (see equation (9)).
In equation (9),
Distance standard deviation refers to location localization of defections, which is the standard deviation of the distance from each defection to the axle line of the hull (see equation (10)).
In equation (10),
Distribution of defections on the pressure hull is relative to the ultimate strength of the pressure hull. With numbers of defections from 1 to 8, the degradation ratios of ultimate strengths are shown in Figure 6.
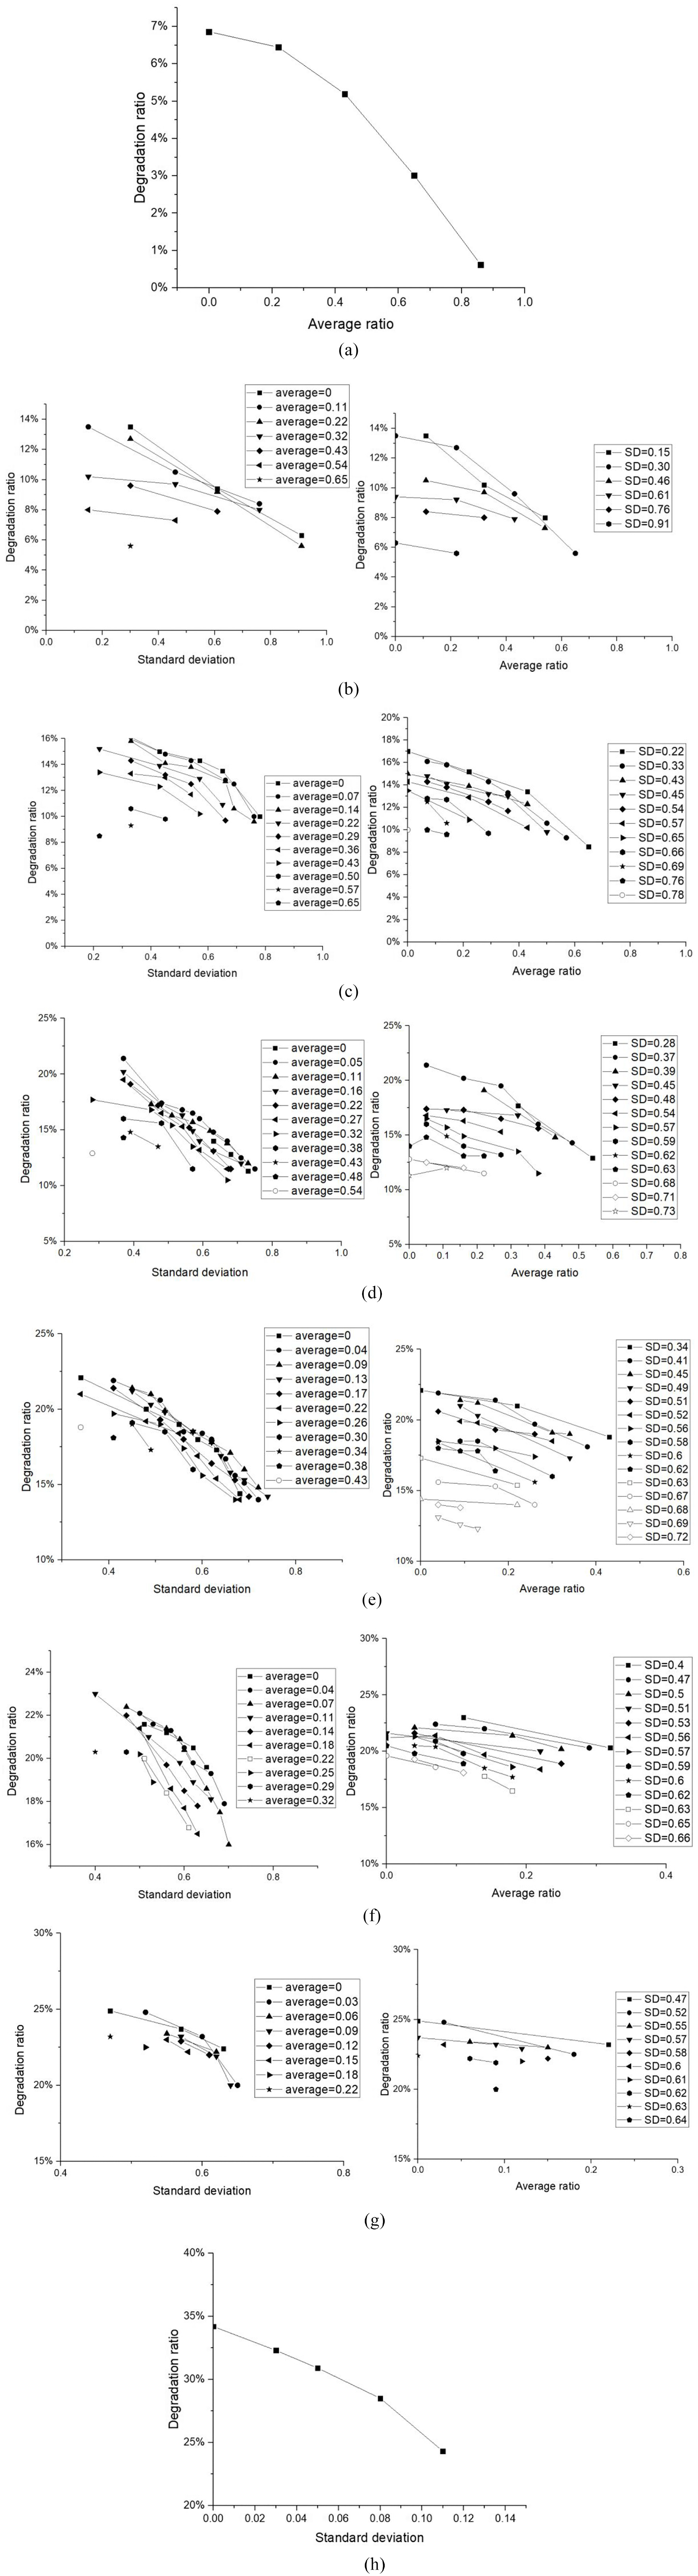
Relationship between degradation and average ratio and standard deviation: (a) 1 defection, (b) 2 defections, (c) 3 defections, (d) 4 defections, (e) 5 defections, (f) 6 defections, (g) 7 defections, and (h) 8 defections.
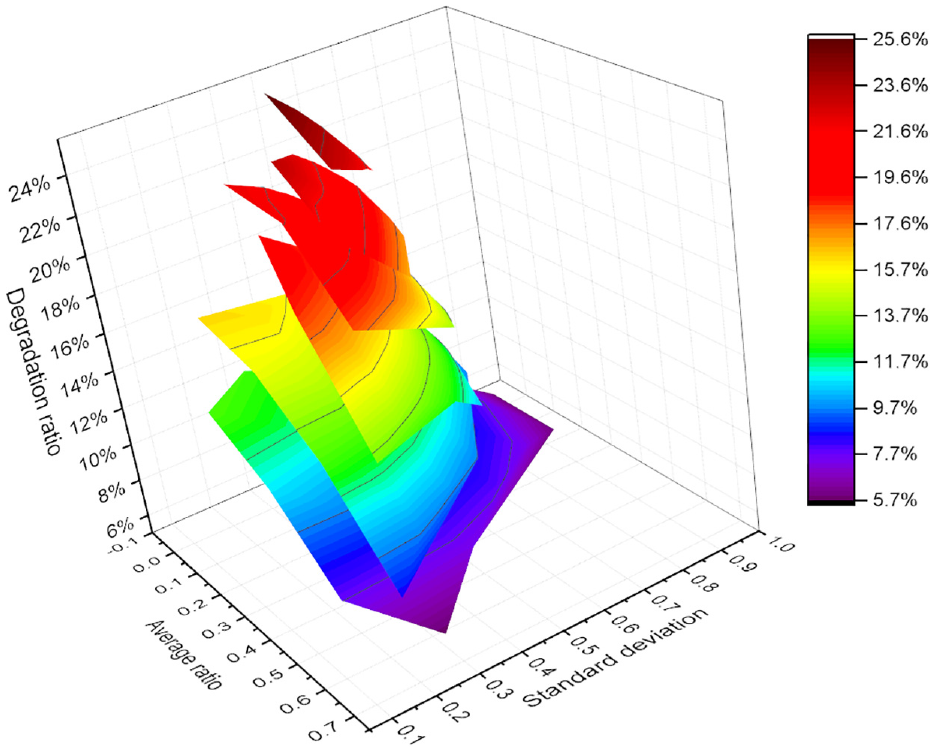
In Figure 6 it is shown that the degradation ratios are going down with the increasement of both average ratios and distance standard deviation with different numbers of defections. The rate of deteriorating of degradation ratio with average ratios and standard deviation is difficult to be indicated in form of curves. In order to show the relationship between degradation ratio and average ratio and standard deviation more clearly, 3D surfaces are employed in Figure 7.
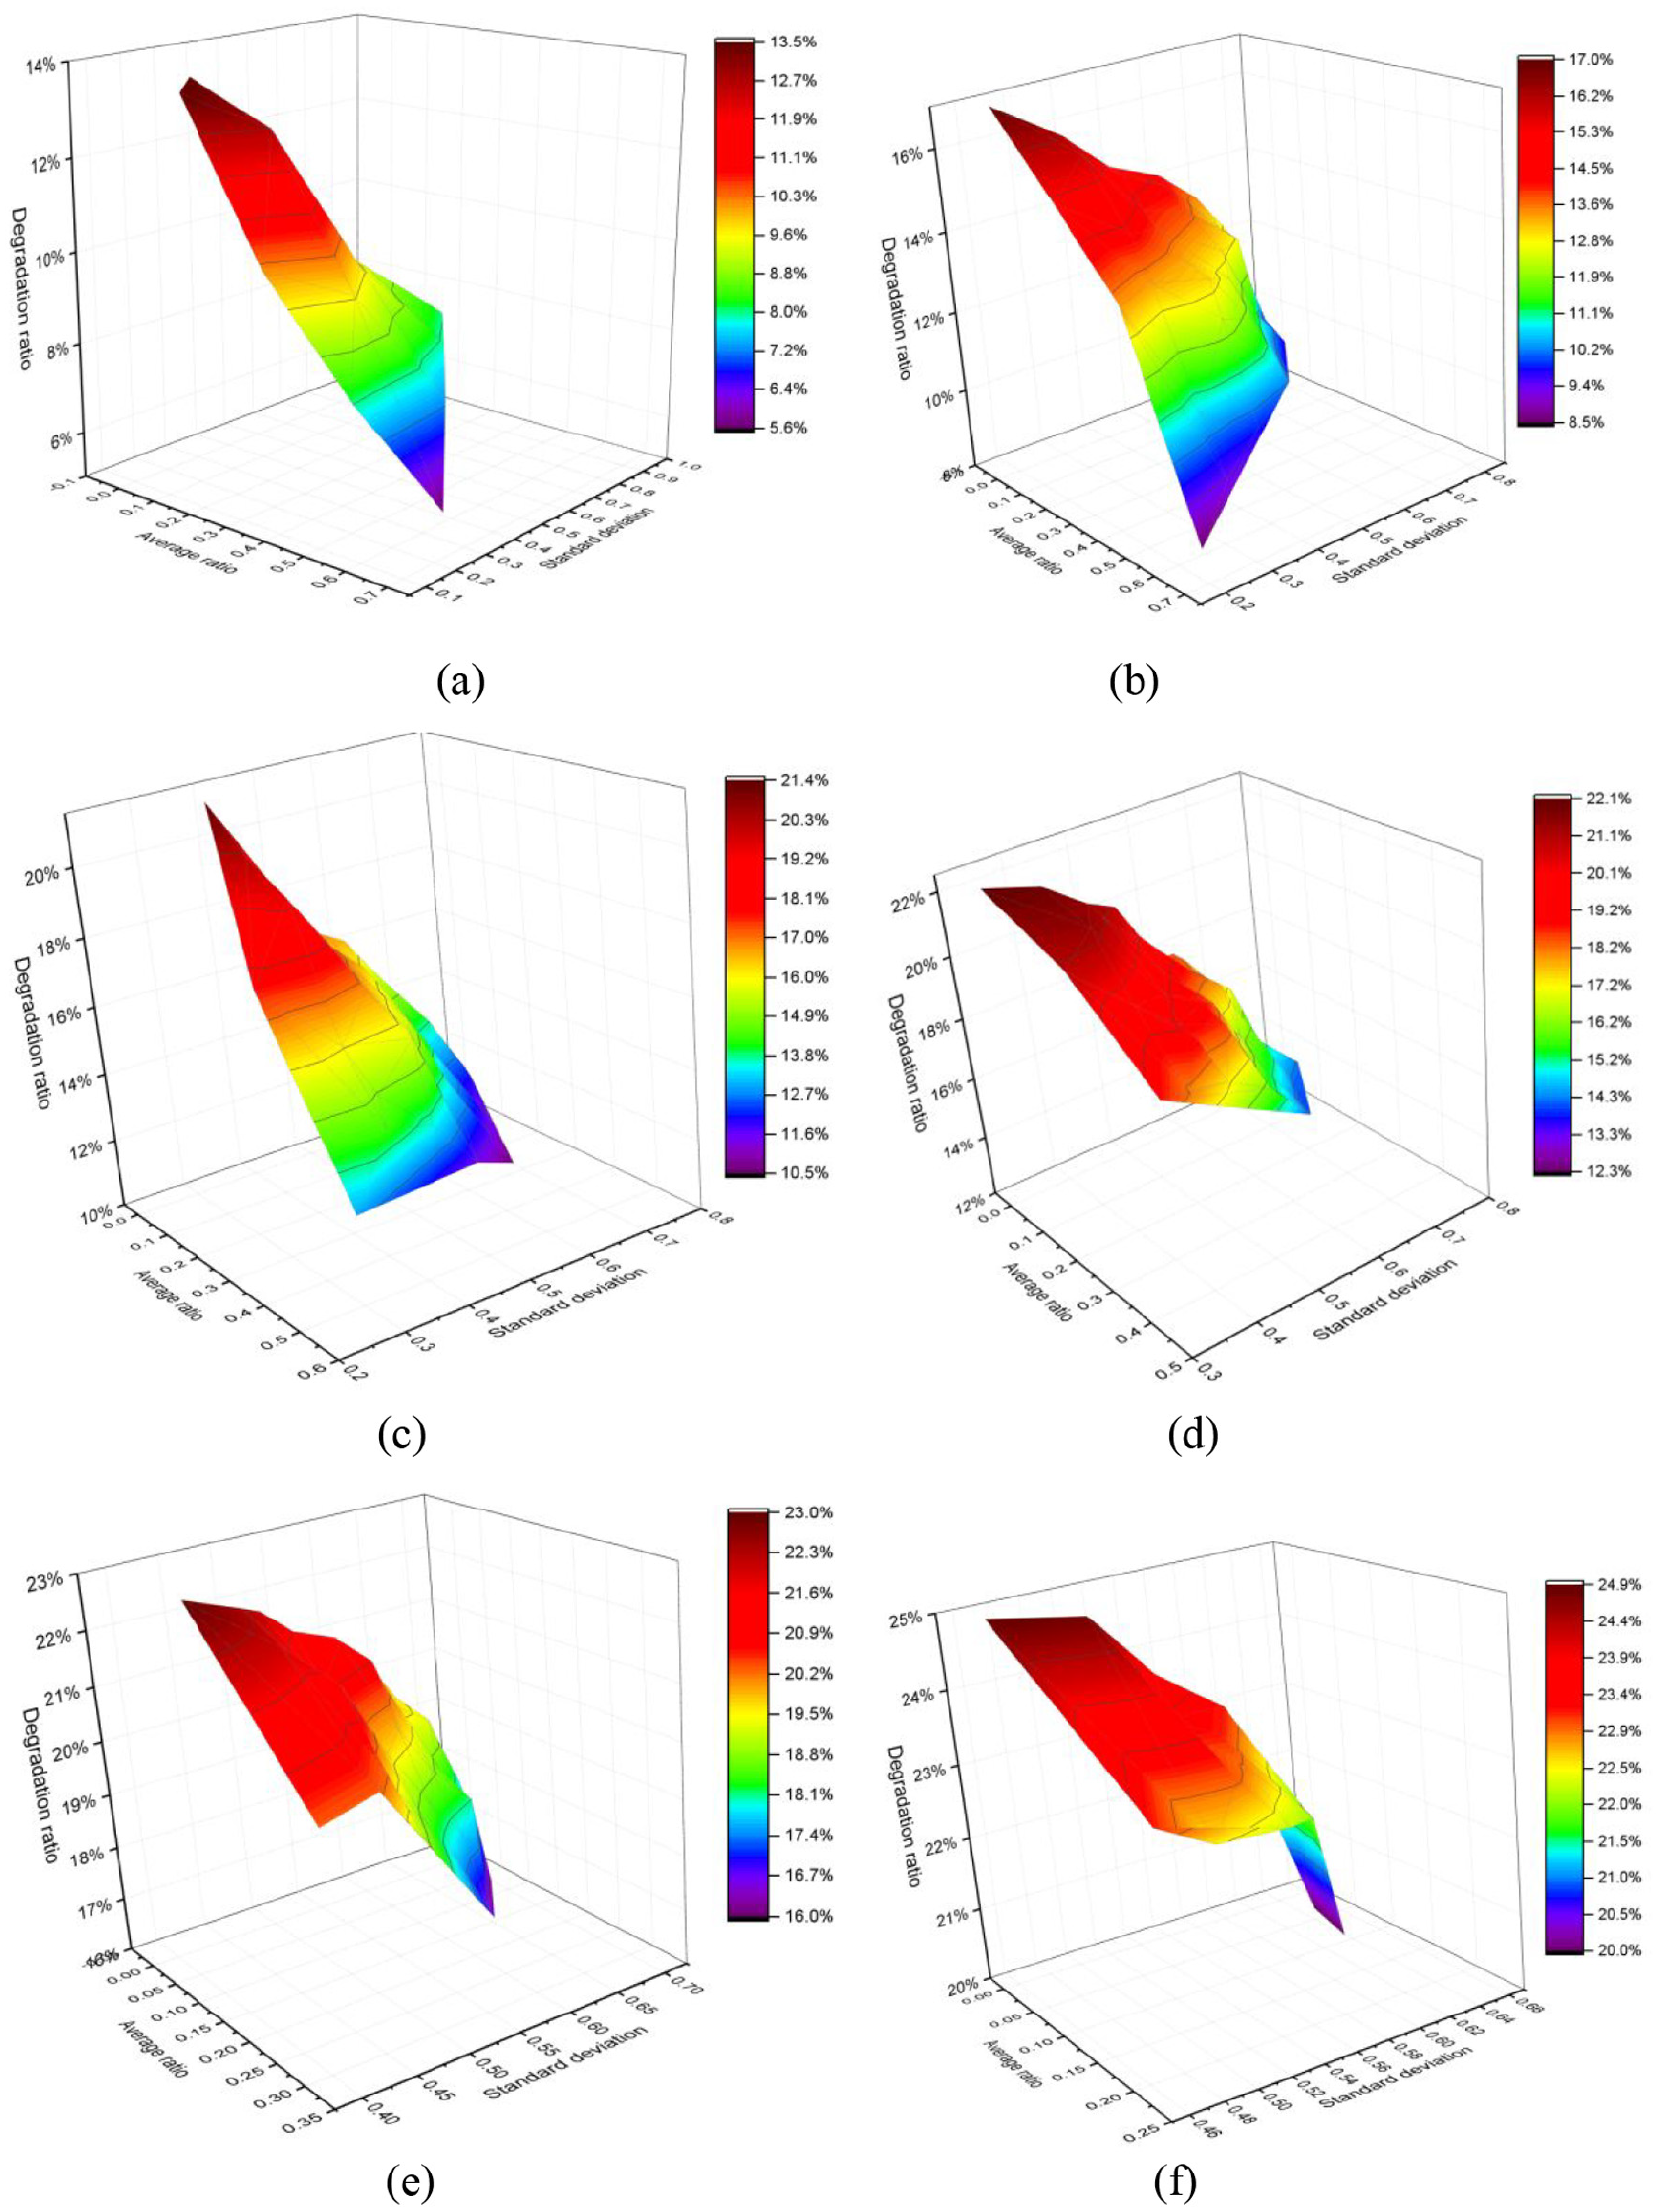
3D surfaces showing relationship between DR and AR and SD: (a) 2 defections, (b) 3 defections, (c) 4 defections, (d) 5 defections, (e) 6 defections, and (f) 7 defections.
The degradation ratio is impossible to be indicated for pressure hulls with 1 and 8 defections. So only the results of ultimate strengths with 2 to 7 defections are shown in Figure 7. The ranges of degradation ratio of different numbers of defections are different. In order to compare the ranges of degradation ratios with different numbers of defections, the results of degradation ratios of pressure hulls with 2–7 defections are shown together in Figure 8.
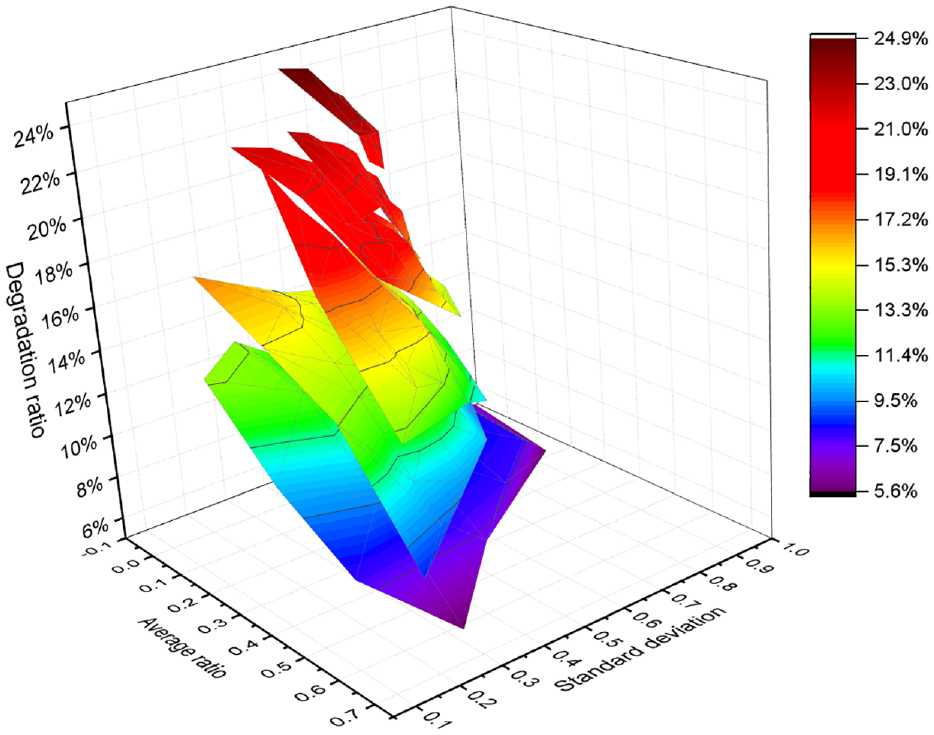
Degradation ratios of pressure hulls with 2–7 defections.
In Figure 8, the trends of degradation ratio with different numbers of defection are almost the same, except the range of degradation ratio. This phenomenon indicates the relationship between degradation ratio and average ratio and standard deviation can be expressed in the same type of equation.
Expression of degradation ratio
Poly2d functions (equation (11)) are employed to fit the scatters. The fitting results of degradation ratios of pressure hulls with 2–7 defections are shown in Table 3.
Fitting results.
In equation (11),
The R2 are all above 0.94, which means fitting results are good enough. In Figure 9, the scatters of simulation results are redrawn based on the fitting function.
Redrawing of 3D degradation ratio surfaces of ultimate strengths with 2–7 defections based on fitting functions.
Discussion
The defection on the surface of the pressure hulls is inevitable. Thickness reduction is adopted as the defection in this paper. And Von Mises theory is employed to simulate fracture. The ultimate strengths which are obtained in simulation models may be not match the actual ones, because of the approximate and simplified settings. But all the simulations are conducted with the same material model except the defection settings. The difference between the simulations and actual situations can be assumed as system error.
Simulation results show that with the increasing of the numbers of preset defections, the degradation ratio of the hull is going up, because the robust of the hull is deteriorating with more defections.
The degradation ratio is not the same under the same number of defections, which means that the ultimate strengths refer to the locations of the defections. There is no sense to investigate the absolute location of each defection on the surface, because the dimensions of the real pressure hulls are deferent one from one. In the common sense, the larger the distance between the location of the defections and the center line along the axial direction is, the more robust the hull is. And the more dispersive the defections are, the steadier the hulls are. So the distribution of defections along the axial direction can be expressed in the form of average ratio and standard deviation. The degradation ratios go down both with the increasement of average ratio and standard deviation in nonlinear form. The nearer the center line of the hull the defections lie, the higher degradation ratio is. The more concentrated the defections are, the higher the degradation ratio is. Poly2d functions fitting results are very close to the samples in the simulations, which could be used to predict the degradation ratio of other location situation under the same number of defections.
Since many approximate value and idealization are applied in this method, the absolute value of the ultimate strength simulated cannot be used as the real one. But the method of describing the distribution of defections and the trend of the degradation ratio with different locations of defections can be employed when the influence of distribution of defections needs to be investigated.
Conclusion and future work
The influence of numbers of defections and their location distribution on the ultimate strength of pressure hull is investigated based on Von Mises theory and numerical software. With the help of degradation ratio, average ratio, and distance standard deviation, several conclusions are drawn as follows.
The ultimate strengths are deteriorating with the increasement of numbers of defections.
In the frame of average ratios and distance standard deviation, the degradation ratios are decreasing with the increasement of average ratios and standard deviation. This phenomenon means that the nearer the center line of the hull the defections lie, the lower the ultimate strength of the pressure hull is, and the more concentrated the defections are, the lower the ultimate strength of the pressure hull is. This trend is the same for pressure hulls with different numbers of defections
The difference among the ranges of degradation ratio with different numbers of defections are large. The more defections there are, the narrower the ranges of degradation ratios are. This phenomenon means that the fewer defections are, the more sensitive to the distribution of defections the ultimate strength of the pressure hulls are.
More work needs to be done in the next step to investigate the combined influence of defections distribution both in the axial direction and circumferential direction, and the effects of dimensions of the defection on the ultimate strength will also be analyzed.
Footnotes
Declaration of conflicting interests
The author(s) declared no potential conflicts of interest with respect to the research, authorship, and/or publication of this article.
Funding
The author(s) disclosed receipt of the following financial support for the research, authorship, and/or publication of this article: This work is funded by the Natural Science Foundation of Jiangsu Province of China (BK20190152).