
Abstract
The present study has investigated the role of the addition of TiC nanoparticles on the microstructural, mechanical, physical, and metallurgical properties of the Cu-TiC nanocomposites. A Powder metallurgy route was used to fabricate the samples. Cold compaction of powders was done at 480 MPa which was followed by sintering at 950°C. Wt.% of TiC was varied from 0% to 20%. A Pin-On-Disc tribometer was used to carry out the wear and friction tests. SEM and EDS techniques were used to explicate the morphology and microstructures of worn surfaces and to comprehend the underlying wear mechanism. The fabricated samples were investigated against the applied normal load (10, 20, and 30 N), sliding speed (0.5, 1.0, and 1.5 m/s), and sliding distance (900, 1800, and 2700 m). The results revealed that the Hardness and tensile strength were improved by 88.76% and 37.26% respectively due to the addition of TiC and were maximum for Cu-20%TiC while the relative density shows the reverse trend. Further, it was found that wear resistance and coefficient of friction were improved by 87.18% and 51.85% respectively as a function of nano-TiC content. The presence of oxide layers and mechanically mixed layers are detected from worn surface analysis which modulates the tribological behavior of the contact.
Keywords
Introduction
Copper is one of the most common materials used for different applications owing to excellent thermal, electrical as well as mechanical properties. But it has certain limitations due to which applications of the pure copper can be suppressed like its yield strength is low, having less hardness, less wear resistance capacity. To overcome such limitations, reinforcement like titanium carbide (TiC) can enhance mechanical as well as tribological properties. TiC is a very hard material, having a high melting temperature and good thermal shock as well as excellent abrasion resistance properties, and the addition of such kind of reinforcement with copper leads to improve the properties of the composites.1–6 The majority of the metal matrix composites (MMCs) have many advantages like good strength, high wear and corrosion resistance capacity, very good resistance against the creep, high temperature operating capacity, good frictional resistance capacity and also having better dimensional stability, etc. Due to certain kinds of advantages metal matrix composites are finding many industrial applications where sliding contact is there as well as in bushes, disk brakes, 7 electronic packaging, 8 resistance welding electrodes, 6 and for anti-frictional materials.
Although stir casting is commonly used, many other routes are used to fabricate the metal matrix composite like powder metallurgy,9–11 rapid prototyping,12,13 pressure infiltration, forging 14 and microwave sintering,4,15,16 etc. for different pressure and temperature conditions. But they have certain kind of limitations like stir casting does not have the capacity of homogeneous dispersion of the particles; rapid prototyping technology has the disadvantage of curling of parts, hot isostatic pressing having density variation in the final part,9–14 besides it powder metallurgy (P/M) route does not have certain kind of disadvantages and has the advantage of better densification rate, lower segregation, and the volumetric heating during the sintering process due to which the part becomes denser. Such advantages of the P/M process make it more attractive for the fabrication of composites.
Different reinforcements are used for the enhancement of mechanical, thermal as well as electrical properties of the fabricated composite 17 . TiC,1–6,10 aluminum oxide (Al2O3), 18 and SiC14,18–24 are commonly used as hard reinforcements. Several authors have reported their work on such studies.
The microstructure and the mechanical properties of the composite (Al-4.5 Cu-xTiC) were studied by Yang et al. 25 During their study, they observed that the strength of the nanocomposites was increased due to the addition of the TiC. Chung et al. 26 worked on copper-based composites using TIB2 and whiskers of SiC. It was found that for low volume fraction, the composites made by the P/M method having superior properties like high hardness, good electrical and thermal conductivity, higher yield strength, and also having a low thermal expansion. Loh et al. 27 found that due to the addition of TiC, micro-hardness, and density were increased. By increasing the sintering temperature, the physical and mechanical properties were improved. Khanra et al. 28 worked on the fabrication of MMCs by using the ZrB2 and copper (Cu) to find out an appropriate combination for the composite which is having high conductivity and also having good wear resistance capacity. Result reveals that the addition of ZrB2 leads to an increase in the wear resistance capacity of the composite while the thermal conductivity has shown the reverse trend. Zhan et al. 29 investigated the wear mechanism and frictional behavior for copper metal matrix composites (CMMC) reinforced with the graphite (C) and SiC particles. In their study, it was observed that a graphite layer has adhered on the tribo surface which was enhancing the tribological properties like less wear and less frictional coefficient of the hybrid composites at lower normal loads. Rajkumar and Aravindan 4 made Cu/C/TiC based composite by using microwave processing and was used under different testing parameters to evaluate their tribological properties. They found that hardness increases with the content of TiC however, hardness decreases with increasing concentrations of graphite. Nemati et al. 1 has investigated the microstructural, mechanical, and wear properties of the nanocomposite (Al-4.5 wt.% Cu-TiC). Wt.% of TiC was varied from 0% to 10%. During the experimentation, they found that due to the addition of the TiC, hardness and the wear resistance properties of the nanocomposites were increased but the relative density was decreased. SEM micrographs reveal that the wear mechanism was delaminating and abrasive. Rathod et al. 2 has worked on Cu-TiC composite. The composite was fabricated by the SHS process. During their study, they found that the addition of TiC particles into the matrix element leads to an increase in the hardness and better homogeneity while the density shows the reverse trend. Zhang et al. 3 also concluded that the addition of the TiC particles into the Cu matrix element increases the strength of the composite. Huseyin et al. 27 worked on Cu–B4C composite. During their study, they observed that the addition of B4C (2%–10%) leads to an increase in the hardness as well as the wear resistance properties of the Cu–B4C composite.
Badry et al. 21 worked on the composite of Cu –graphite (8, 15, 20 wt.%) which were fabricated by using the powder metallurgical route (P/M). Pin on ring tribometer was used for the experiment. The study reveals that the Cu-C composite shows improved tribological properties as compared to pure Cu and the nature of wear was oxidative. Prabhu et al. 30 used the powder metallurgy route to fabricate the Cu-20%SiCp composite. Microstructural study reveals the oxidative wear out of the composite.
It is worth noting here that if the compaction is done at more pressure for more time and the sintering is done near phase transition temperature; void-free structure and solid mass will be obtained which will have high density and less porosity. Unfortunately, as of the author’s knowledge, there is a paucity of literature which have discussed the characterization as well as tribological properties of copper–TiC nanocomposites which have wide applications as EDM electrodes, brakes, welding electrodes, resistant coatings, cutting tooltips, wear parts, structural applications and dies, etc.6,31,32
The present study is focused on the mechanical, physical, and tribological behavior of Cu-TiC (5%, 10%, 15%, and 20% by weight) nanocomposite sintered near the phase transition temperature. In this research, Cu and the Cu-TiC nanocomposites were fabricated by P/M technique, and the physical (density, porosity), mechanical (micro-hardness, tensile testing), and tribological properties were compared.
Material and methods
Material synthesis
Cu and TiC nanopowders having an average particle size of 50 nm (Alfa Aesar, 99.9% pure) were used for the experimentation. TEM image of the nanopowder material is shown in Figure 1. From the figure it is evident that Cu and TiC particles are clearly visible and are uniformly dispersed. TEM images confirmed that metal nanoparticles are in nanorange and they are approximately spherical in shape. Powder metallurgy route was used to fabricate the Cu-xTiC nanocomposites (x (wt.%) = 5%, 10%, 15%, and 20%). Four pellets were prepared and sintered for each composition and each measurement was repeated for all the four samples of each composite. The nano Cu and TiC particles were mixed using a blender (Bionics, BST/VB-50) at 600 rpm for 1 h to obtain composites with a homogeneous distribution of nano-TiC particles into the matrix material. Hydraulic press (Jackman, KHPL-HF-HOP) was used to compact the Cu-TiC powder mixture at room temperature. Compaction was done at a pressure of 480 MPa for 30 min to obtain the cylindrically shaped pellets having a diameter and length of 10 mm. The compacted samples were sintered in an electric tube furnace (Victory Sensors, HTF-006) in three stages. For each step heating rate was kept constant at 3°C/min. In the first stage the heating was done till 600°C for degassing purposes, followed by heating till 850°C and in the third stage, heating was done till 950°C for recovery of the physical as well as the mechanical properties. There were holds for 60 min at each isothermal temperature. 5°C/min was maintained as a cooling rate. The sintering cycle is shown in Figure 2. The complete process to obtain the sintered pellets is shown in Figure 3.
TEM images of (a) Cu nano powder and (b) TiC nano powder (at scale of 200 nm).
Sintering cycle for the compacted pellets.
Procedure to obtain the pellets.
Relative density and porosity
The relative densities (ρrel) of the nano Copper and Cu-TiC nanocomposite, was calculated by using the equation (1).

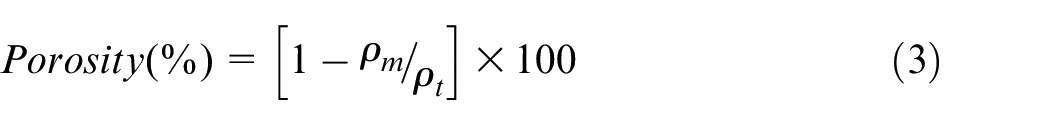
Where ρexp is the experimental or measured density and ρtheo is the theoretical density of the samples. Archimedes principle was used to measure the experimental density of the sintered samples. Theoretical density was calculated by using the equation (2) where W and ρ denote the weight fraction and density respectively. The porosity of the sintered samples was calculated by using the rule of mixture as shown in equation (3) where ρm represents measured density while ρt denotes the theoretical density. 14
Microstructural evaluation
The surface Scanning Electron Microscopy (SEM) (JSM 7900 LV SEM) was used to analyze the microstructure of pure Cu and the Cu-TiC nanocomposite. The pellets were initially grinded on disk polisher machine with use of SiC paper having grit size of 200, 400, 600, 1000, and 2000. After that the cleaning and etching of the pellets was done to obtain the clear image from the SEM.
Micro-hardness
The Vickers micro-hardness of the prepared pellets was measured by Vickers Micro Hardness tester (Mitutoyo, HM-210 B). Two kilogram load was applied and the readings were taken at 10 different locations and the average value of these was taken into consideration. The load was applied for 30 s.
Tensile testing
The Tensile test has been performed to evaluate the Tensile strength of the developed material. The test was performed on the Instron-1206 make Universal testing machine (UTM) as per the ASTM E8M-04 standard test procedure. Tensile test samples from materials were prepared by machining operation on a CNC lathe machine. The samples as per the dimensions were prepared with accurate precision.
Wear and friction testing
A pin-on-disc tribometer (Ducom, TR-101, CL-M2) was used to perform the friction and wear tests and the sliding conditions were dry. A weighing machine (Contech, CAS-304) having an accuracy of 0.0001 g was used to measure the weight of the samples before and after the tribo test. The samples fabricated from the P/M route were having a flat base and for the flat base, it is very hard to maintain the exact flat surface so that a proper contact will be there between the pin and the counter disk (Material-EN31, 58 HRC, Ra of 4.5 μm). So firstly the hemispherical shape having a 2 mm radius was made on the pins by using a CNC milling machine so that a proper contact will be taken place due to which proper wear scar will be made on the pins. Once the hemispherical pins were made then after it the pin was held in the fixture of 10 mm diameter and a proper contact was made between the pin and the disk. Before the tribo testing, acetone was used to clean the counter surface. The tribological behavior of pure Cu and the Cu-TiC nanocomposites was investigated for various normal loads, sliding distance, and sliding speeds.
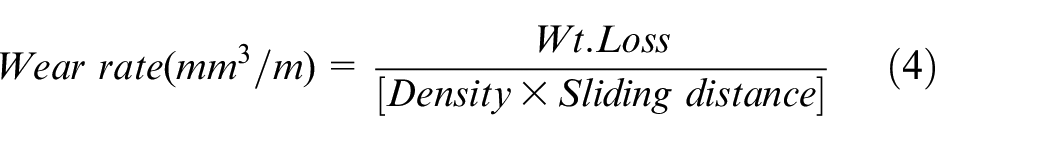
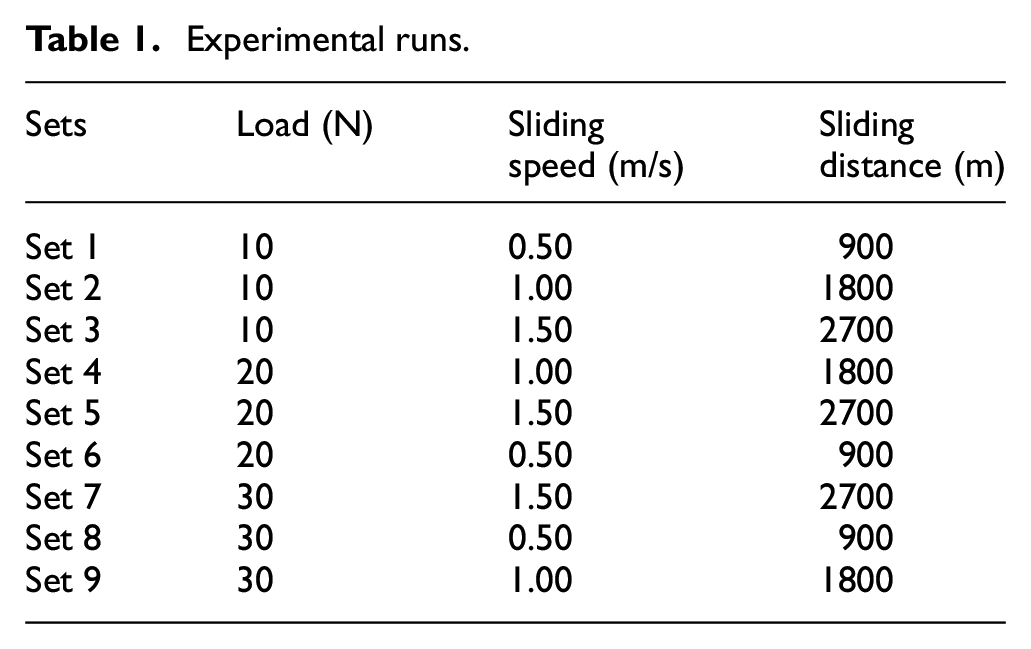
Tribological tests were performed at room temperature. L9 orthogonal array was applied for experimentation (Table 1). Sliding speed (0.5, 1.0, and 1.5 m/s), sliding distance (900, 1800, and 2700 m), and the normal load (10, 20, and 30 N) were selected as the input parameters. Friction tests were performed at room temperature (24.3°C). The frictional load which was obtained during the experiment was used to calculate the frictional coefficient. Volumetric wear rate was calculated as:
Experimental runs.
Results and discussions
Relative density and Porosity
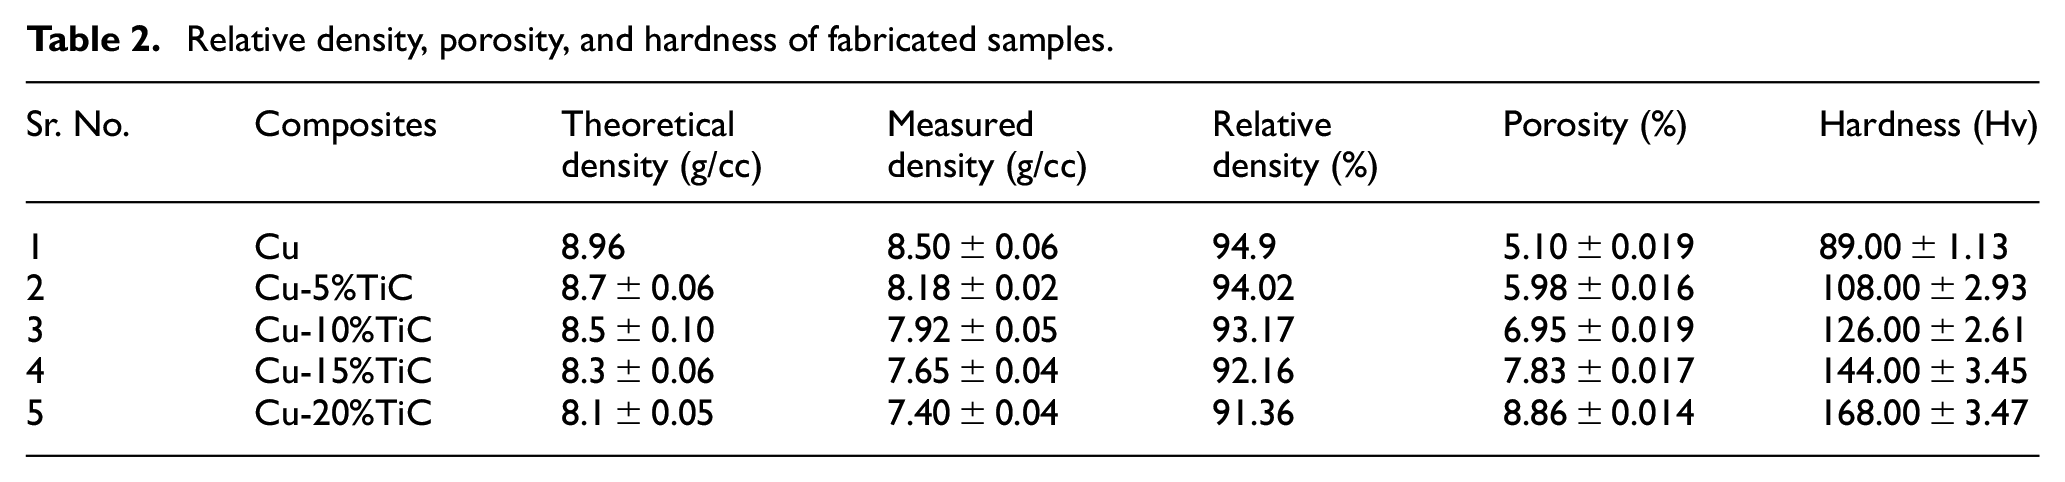
Figure 4 represents the effect of TiC content on the relative density of Cu-TiC nanocomposites. From the Figure 4, it is clear that, with an increase in the content of TiC, the relative density of the Cu–TiC nanocomposites decreases. Further, Figure 4 indicates that for the pure Cu sample, the relative density reduced from 94.9% to 91.4% with increasing nano-TiC particles to 20 (wt.%). The average values of density and porosity are shown in Table 2. From Table 2 it is obvious that the density of composites is decreasing with the increase in weight % of TiC, which is expected because TiC (4.95 g/cc) is having less density as compared to copper (8.96 g/cc). However, if we compare Table 2; then we can see that the composites are more porous than the pure metal due to the presence of heterogeneous phases and the presence of weak bonding. However, since copper can diffuse easily to the interstices between TiC particles at a low concentration which leads to higher densification, so the resultant values of porosities are found to be very less in the fabricated composites.33,34 Figure 5 also indicates that the increase in TiC content into matrix element increases the porosity of the prepared samples.
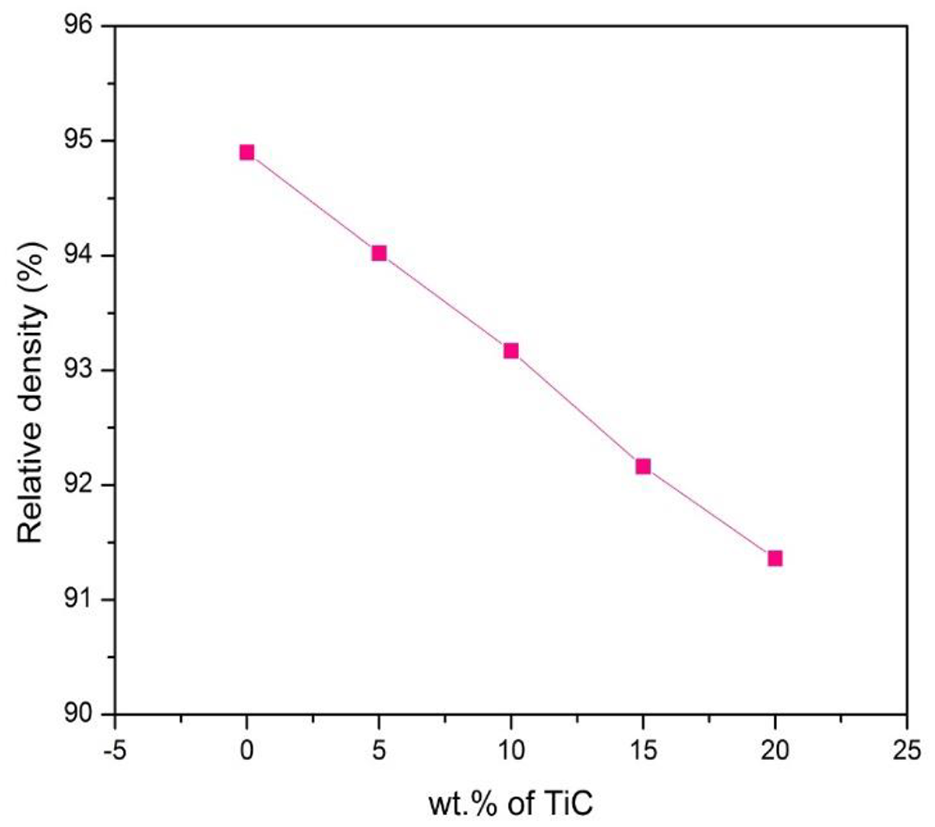
Variation of relative density with wt.% of TiC.
Relative density, porosity, and hardness of fabricated samples.
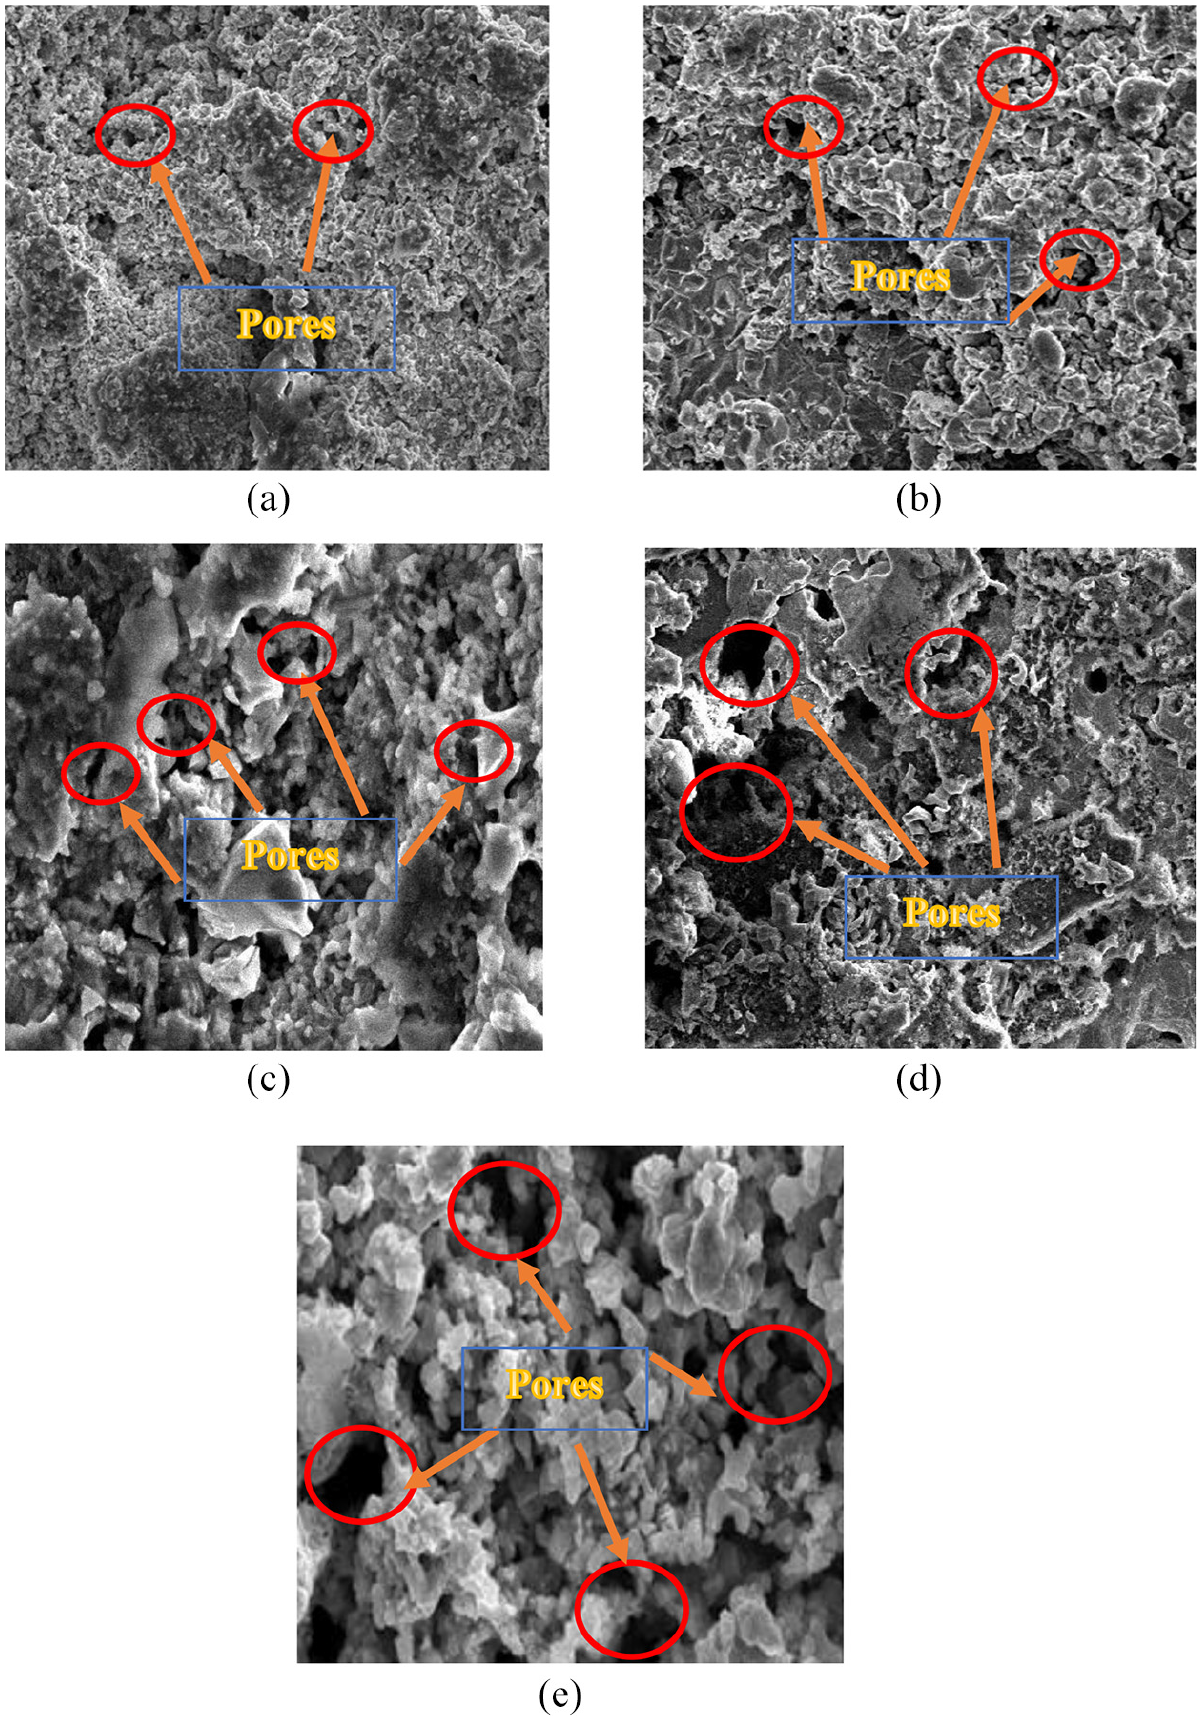
Surface morphology of sintered samples for (a) Copper 100%, (b) Cu-5%TiC, (c) Cu-10%TiC, (d) Cu-15%TiC, (e) Cu-20%TiC composites (at the scale of 100 μm).
Hardness test
Ten readings for each sample at different locations on the surface of samples were taken measured by Vickers microhardness tester and the average value is shown in Table 2. It is seen from Figure 6 that with an increase in weight % of TiC, the hardness of the composites was improved; which is in agreement with the previous work reported by different authors.35,36 This enhancement in hardness is due to the uniform dispersion of hard TiC reinforcement particles as well as the good bonding to matrix elements in the composites. 37 The existence of nanoparticles inside the matrix element also works as a load-supporting component in the nanocomposites which also helps to increase the hardness. 38 Cu-20 wt.% TiC sample was having the highest hardness (182 ± 3.478 Hv).
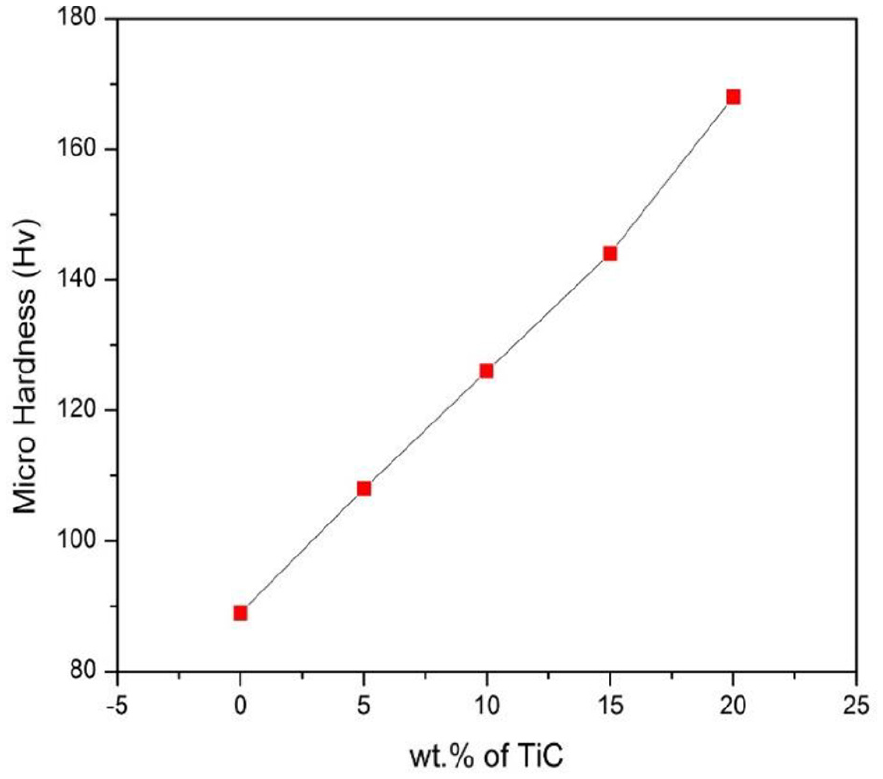
Variation of avg. micro harness with wt.% of TiC.
Tensile testing
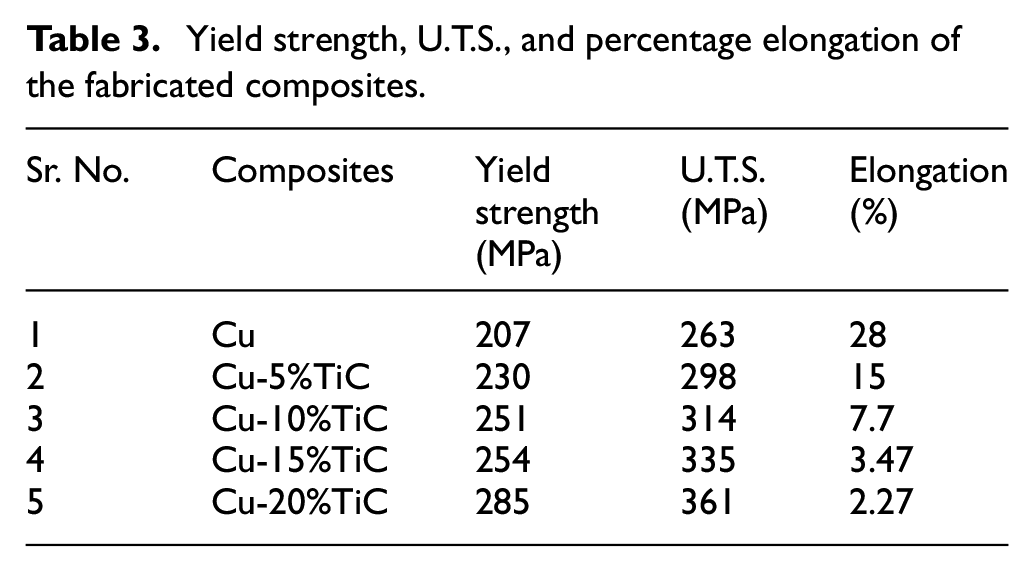
Table 3 shows the summarized values obtained from tensile testing. It was observed that the yield strength, as well as the Ultimate Tensile Strength (U.T.S), was increased with the increased content of TiC. For 20% TiC, an improvement of around 37% in yield strength and U.T.S. was observed. % elongation shows the reverse trend and was highest for 0% TiC. The lowest % elongation was obtained for Cu-20%TiC. These results can be accredited to the improved hardness, strong cohesive force between the Cu and TiC particles as well as due to the effective inhibition of dislocation movement by TiC particles.
Yield strength, U.T.S., and percentage elongation of the fabricated composites.
Friction and wear study
The wear rate expressed in mm3/m is usually based on Archard’s abrasive wear model. 30 This is applicable only in the cases where the wear mechanism is abrasive or predominantly abrasive. As we know in actual contact conditions, there is no single mechanism of wear but a complex combination of several mechanisms simultaneously in play, so, on the prediction of wear, use of wear rate should be used very carefully, because it takes into account the contact conditions. In the present study since the operating conditions are changing, we will use wear rate for the comparative study with different composite samples.
Wear rate
The wear rate of the copper and Cu-TiC nano-composites for the normal loads and sliding speeds are shown in Figure 7. From the graphs, it is clear that the pure copper sample shows the highest wear rate as compared to the different composites for all the different normal loading conditions. With the increment in normal loads, considerable plastic deformation for the pure copper has been occurred along with the formation of adhesive junction between the contacting surfaces. It was observed that the wear rate was decreasing with an increase in wt.% fraction of TiC. Due to the increased sliding speed, pull out of the TiC from the matrix take may place which can abrade the surface of the composite during the sliding conditions. However, due to the good bonding strength and uniform dispersion of TiC particles in composites, it allows only a slight increment in the wear rate. The wear resistance of composites increases with an increase in hardness of the composite due to an increase in the weight fraction of the hard TiC. Due to these harder particles, the wear resistance of the composites increases due to the reduced surface deformation of the metal matrix. During the run-in period, there is metal to metallic contact due to which the copper metal tends to deform rapidly. Due to the plowing and abrasion by the harder counter surface, the TiC particles from the matrix are exposed to the worn surface. These hard particles share the normal load which automatically reduces the load on the copper phase. Hence, Cu shows a higher wear rate and the composite Cu-20%TiC having the highest percentage of TiC exhibits the lowest wear rate as compared to all of the compositions for all the applied loading conditions. Also, Cu-20%TiC is found to be least affected by the change in normal load.
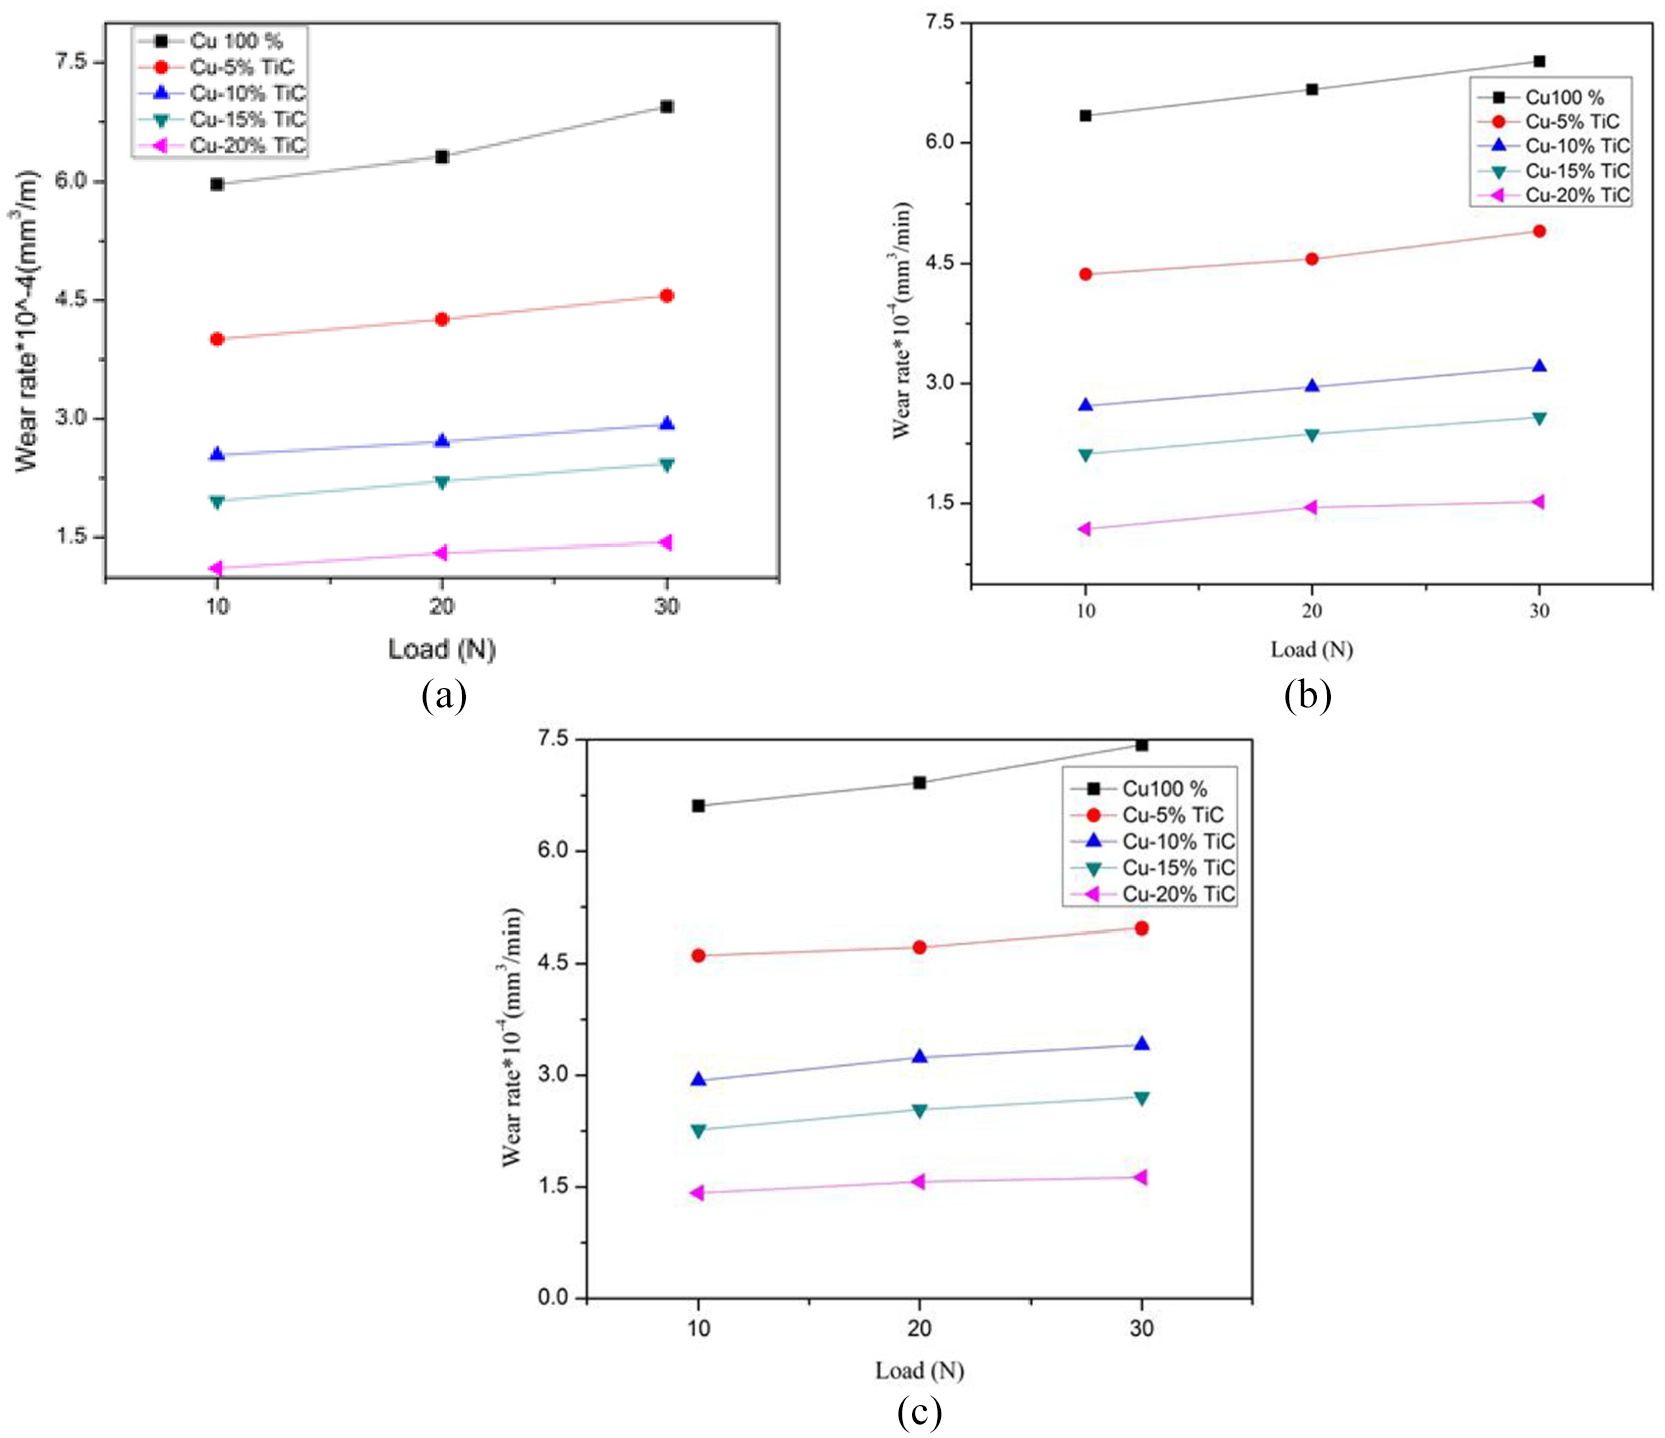
Effect of variation in normal load on wear rate for different samples at sliding speed of (a) 0.50 m/s, (b) 1.00 m/s, and (c) 1.50 m/s.
Similarly, from Figure 8 it is clear that wear rate gradually increases with the sliding distance for Cu-10% TiC. This behavior also holds good for other Cu-TiC composites as well as pure copper. This indicates that there is a lack of presence of significant tribolayer under the contact or there may be the continuous formation and ruptures of tribo layers under sliding. In the case of composites with a very low weight percentage of reinforcement, wear rate is significantly influenced by load and sliding distance which may be due to the fact that with sliding time, particles are pulled out of the soft matrix, and subsequently, the matrix is unable to resist the higher wearing out. For all loading conditions, the wear rate for Cu-15%TiC and Cu-20%TiC is nearly the same, for a particular sliding distance. As sliding distance increases, wear rate is also increased gradually with a lower rate than the other compositions. Thus, in the case of composites with a higher percentage, harder surfaces are exposed uniformly and load-bearing capacity, as well as the wear resistance of the sample, is increased or there is the possibility of forming a hard tribolayer of carbides and oxides. This, in turn, is a good indicator of achieving desired wear resistance with uniformity as well as the optimal formulation of reinforcement in the fabricated composite for the particular application with a specified load range.
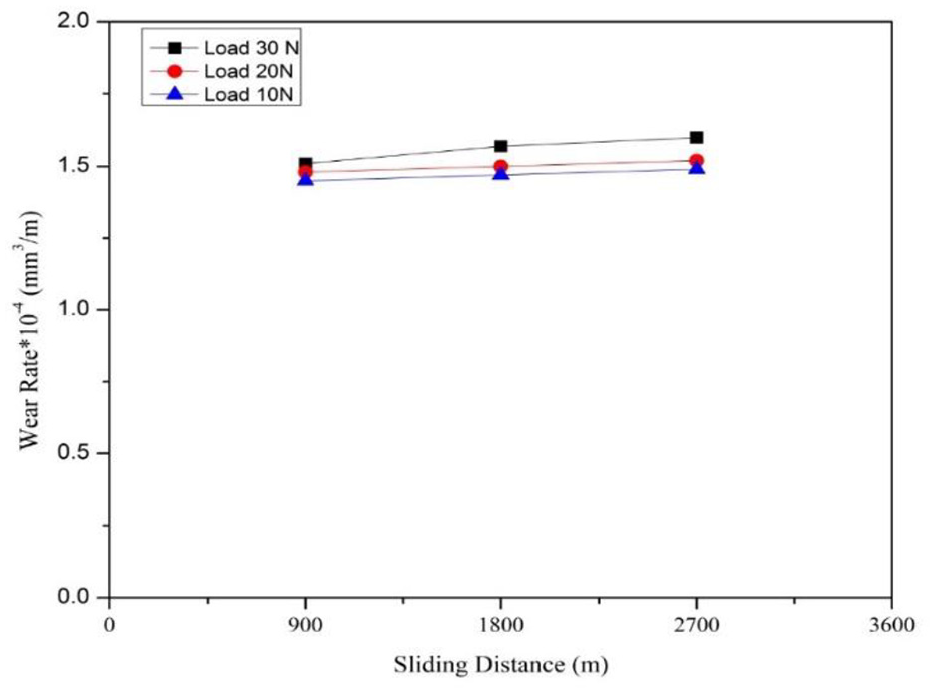
Wear rate for Cu-10%TiC composite with sliding distance at different loads.
Statistical model for wear rate
In order to check the adequacy of the experiments, statistical model was made for the wear rate for each sample. L9 orthogonal array was used to prepare the design of experiment as shown in Table 1. Figure 9 shows the main effect plot for means which is used to analyze the effect of process parameters. 39 The individual contribution of the input variables is shown in Figure 10. It is clear from the graphs that the applied load and the sliding distance are most significant parameters which affects the wear rate.
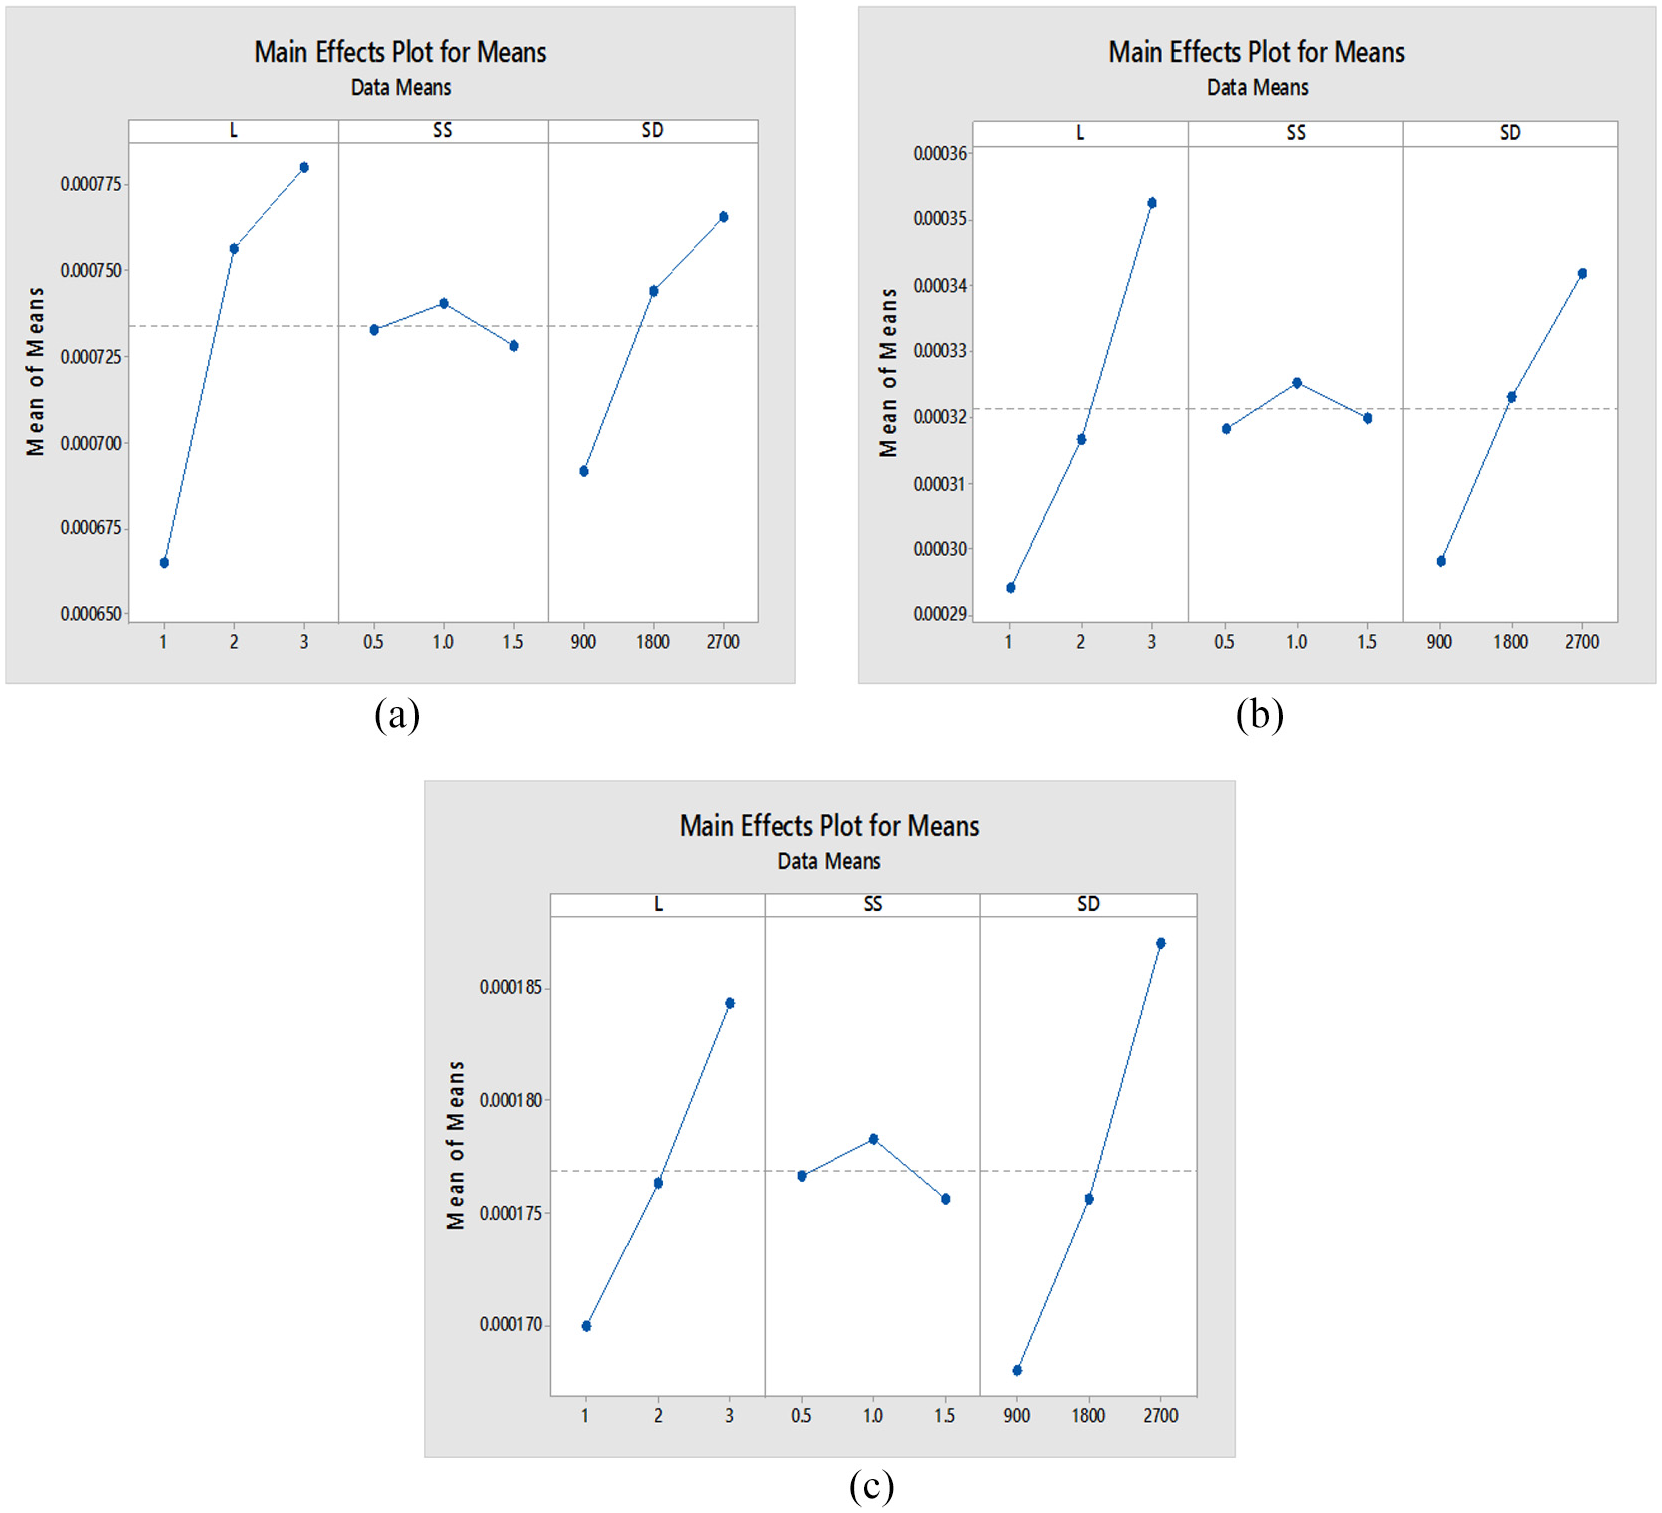
Main effects plot for (a) Cu 100%, (b) Cu-10%TiC, and (c) Cu-20%TiC.
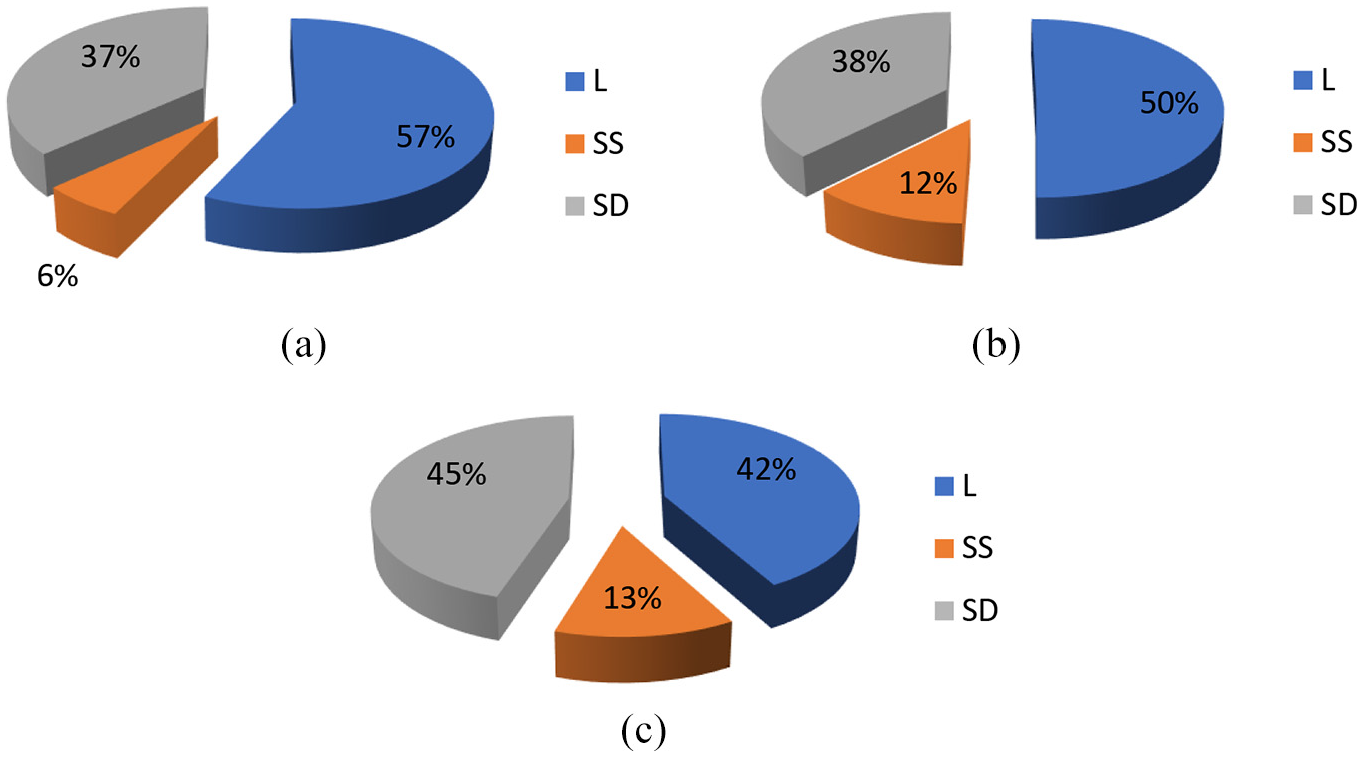
Pie chart distribution for (a) Cu 100%, (b) Cu-10%TiC, and (c) Cu-20%TiC.
Coefficient of friction
From Figure 11 it is clear that average value of the coefficient of friction increases with a normal load. It was also observed that the Cu-TiC nano-composites exhibit a lower coefficient of friction as compared to the Cu-100%. A higher frictional coefficient was exhibited by the pure copper for all the different loading conditions. As the normal load was increasing, the severity of the plastic deformation for the soft matrix was also increasing. Also at low load; frictional heat is not considerable and if a load is higher, then the frictional heating will contribute to an increase in friction. The results reveal that the sliding speed has less effect on the frictional coefficient of the composites. When the sliding speed, as well as the sliding distance, was increased, only a smaller increment for the coefficient of friction was observed. Friction response in pure copper is significantly affected by sliding speed, however, the trend of the frictional coefficient for the different compositions was remaining the same for the different sliding speeds. The frictional coefficient decreases as the wt.% of TiC increases. The coefficient of friction was lowest for the Cu-20% TiC because the nature of contact between the surfaces will be changed during the operation so that the contact between the pin surface and the counter surface will be prevented by some mechanism, due to which frictional coefficient will be reduced. 4 When the contact is established, due to the rubbing action the harder TiC particles from the soft matrix may be pulled out which induces third body rolling action at the contact surface reducing the coefficient of friction. Else there may formation of some protective layers. In other words, there are fewer plowing and adhesive components in the steel-composite interactions. This will be further investigated through the following section. That’s why for the composite Cu-20% TiC; the coefficient of friction is lowest due to the higher content of TiC as compared to the other compositions.
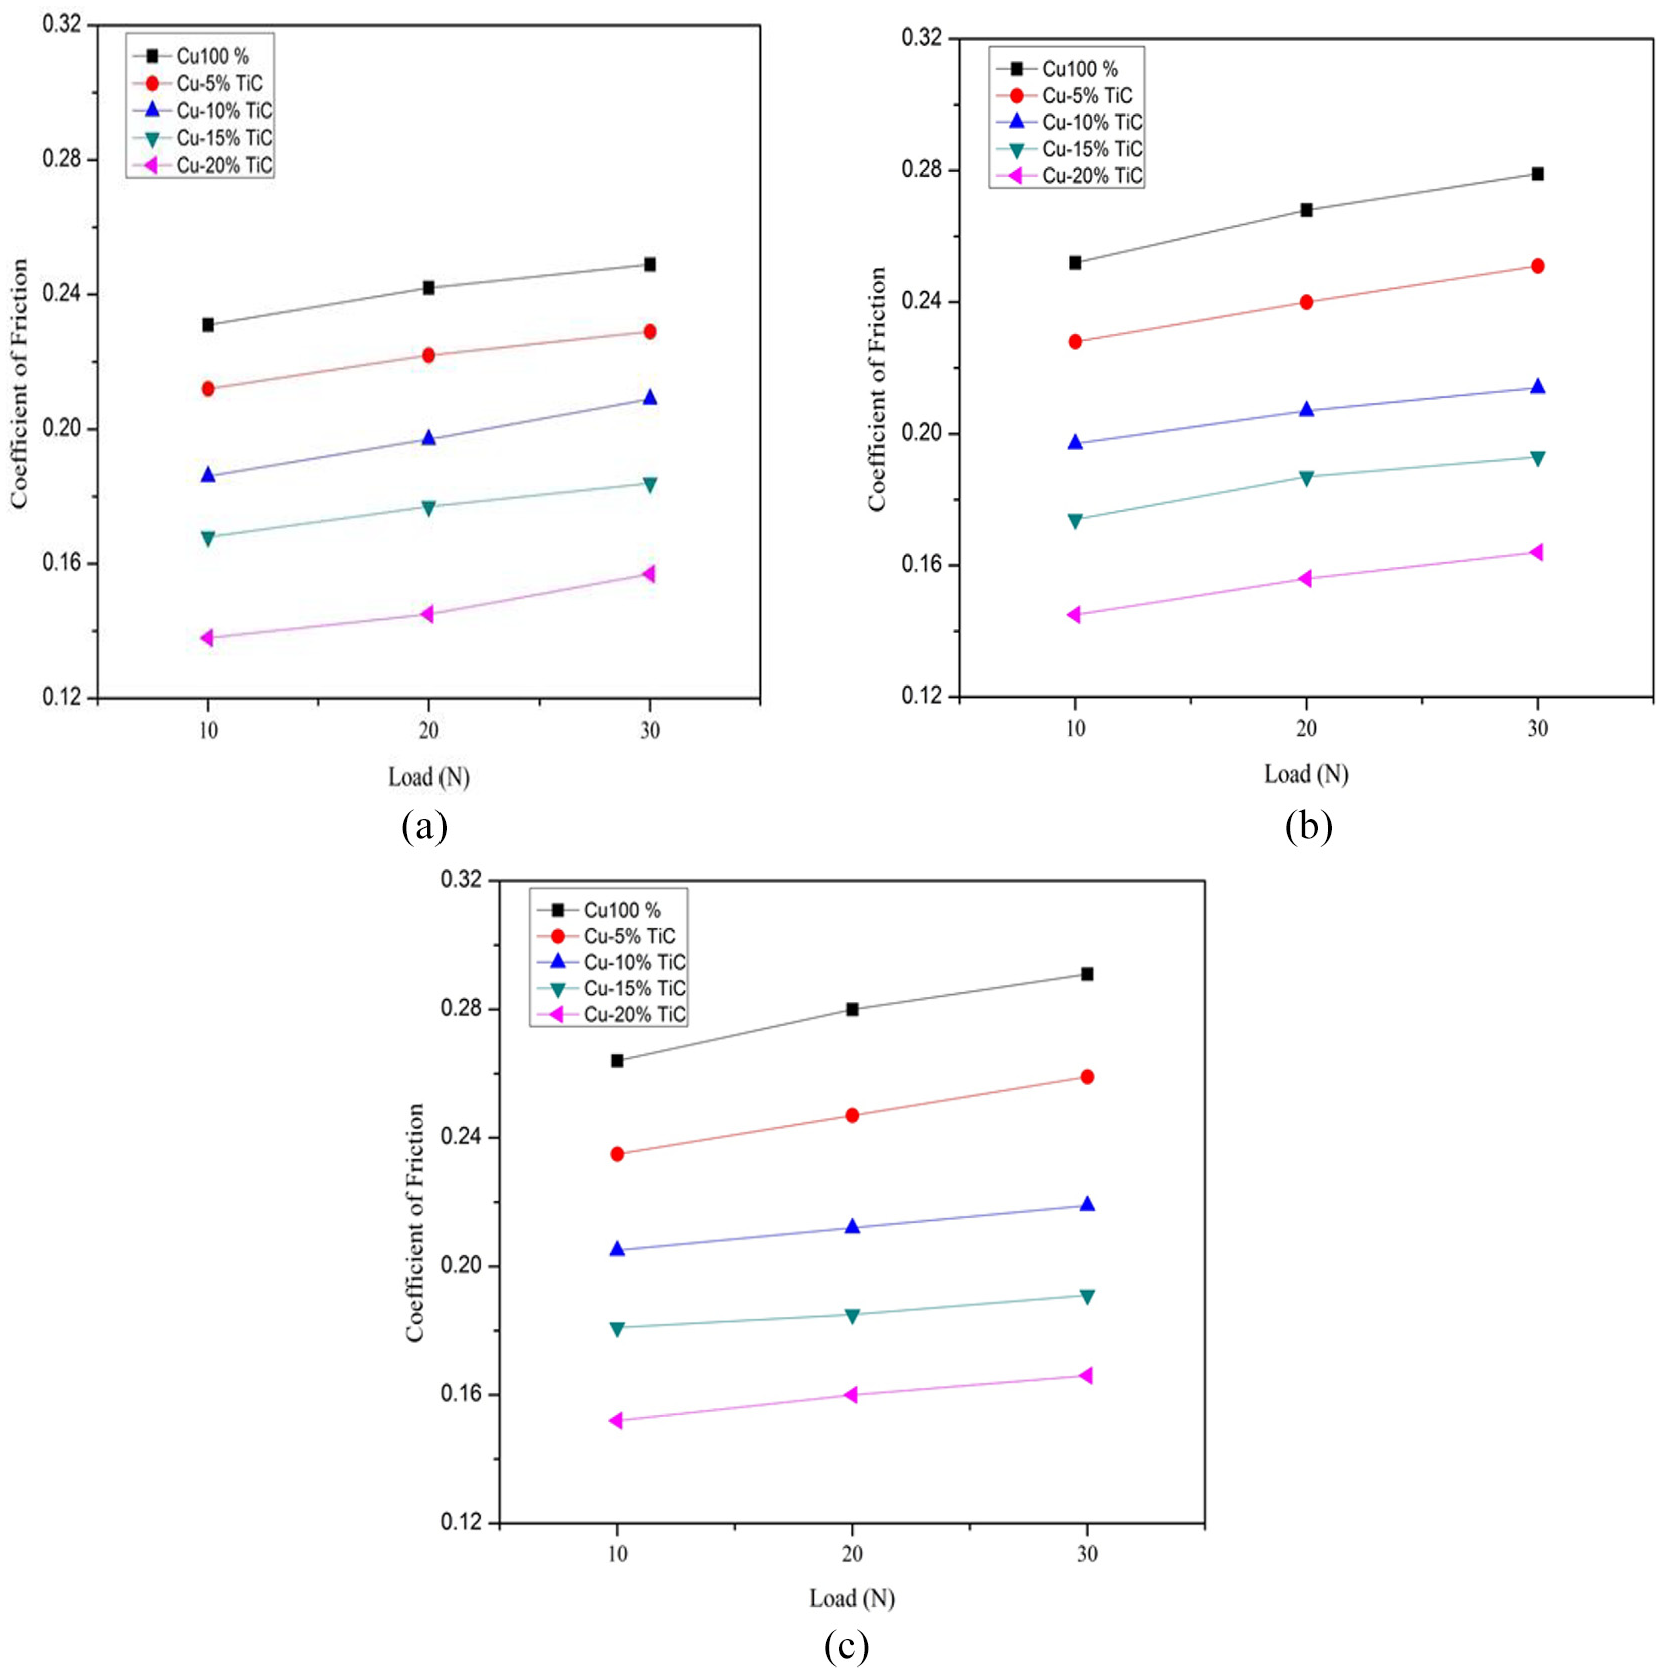
Effect of variation in normal load on coefficient of friction for different samples at sliding speed of (a) 0.50 m/s, (b) 1.00 m/s, and (c) 1.50 m/s.
Statistical model for coefficient of friction
In order to check the adequacy of the experiments, statistical model was made for the coefficient of friction for each sample. Mean effect curves were plotted to analyze the effect of the input parameters (L, SS, SD) on the coefficient of friction. Figure 12 shows the main effect plot for means. The individual contribution of the input variables is shown in Figure 13. It is clear from the graphs that the applied load and the sliding distance are most significant parameters which affects the coefficient of friction.
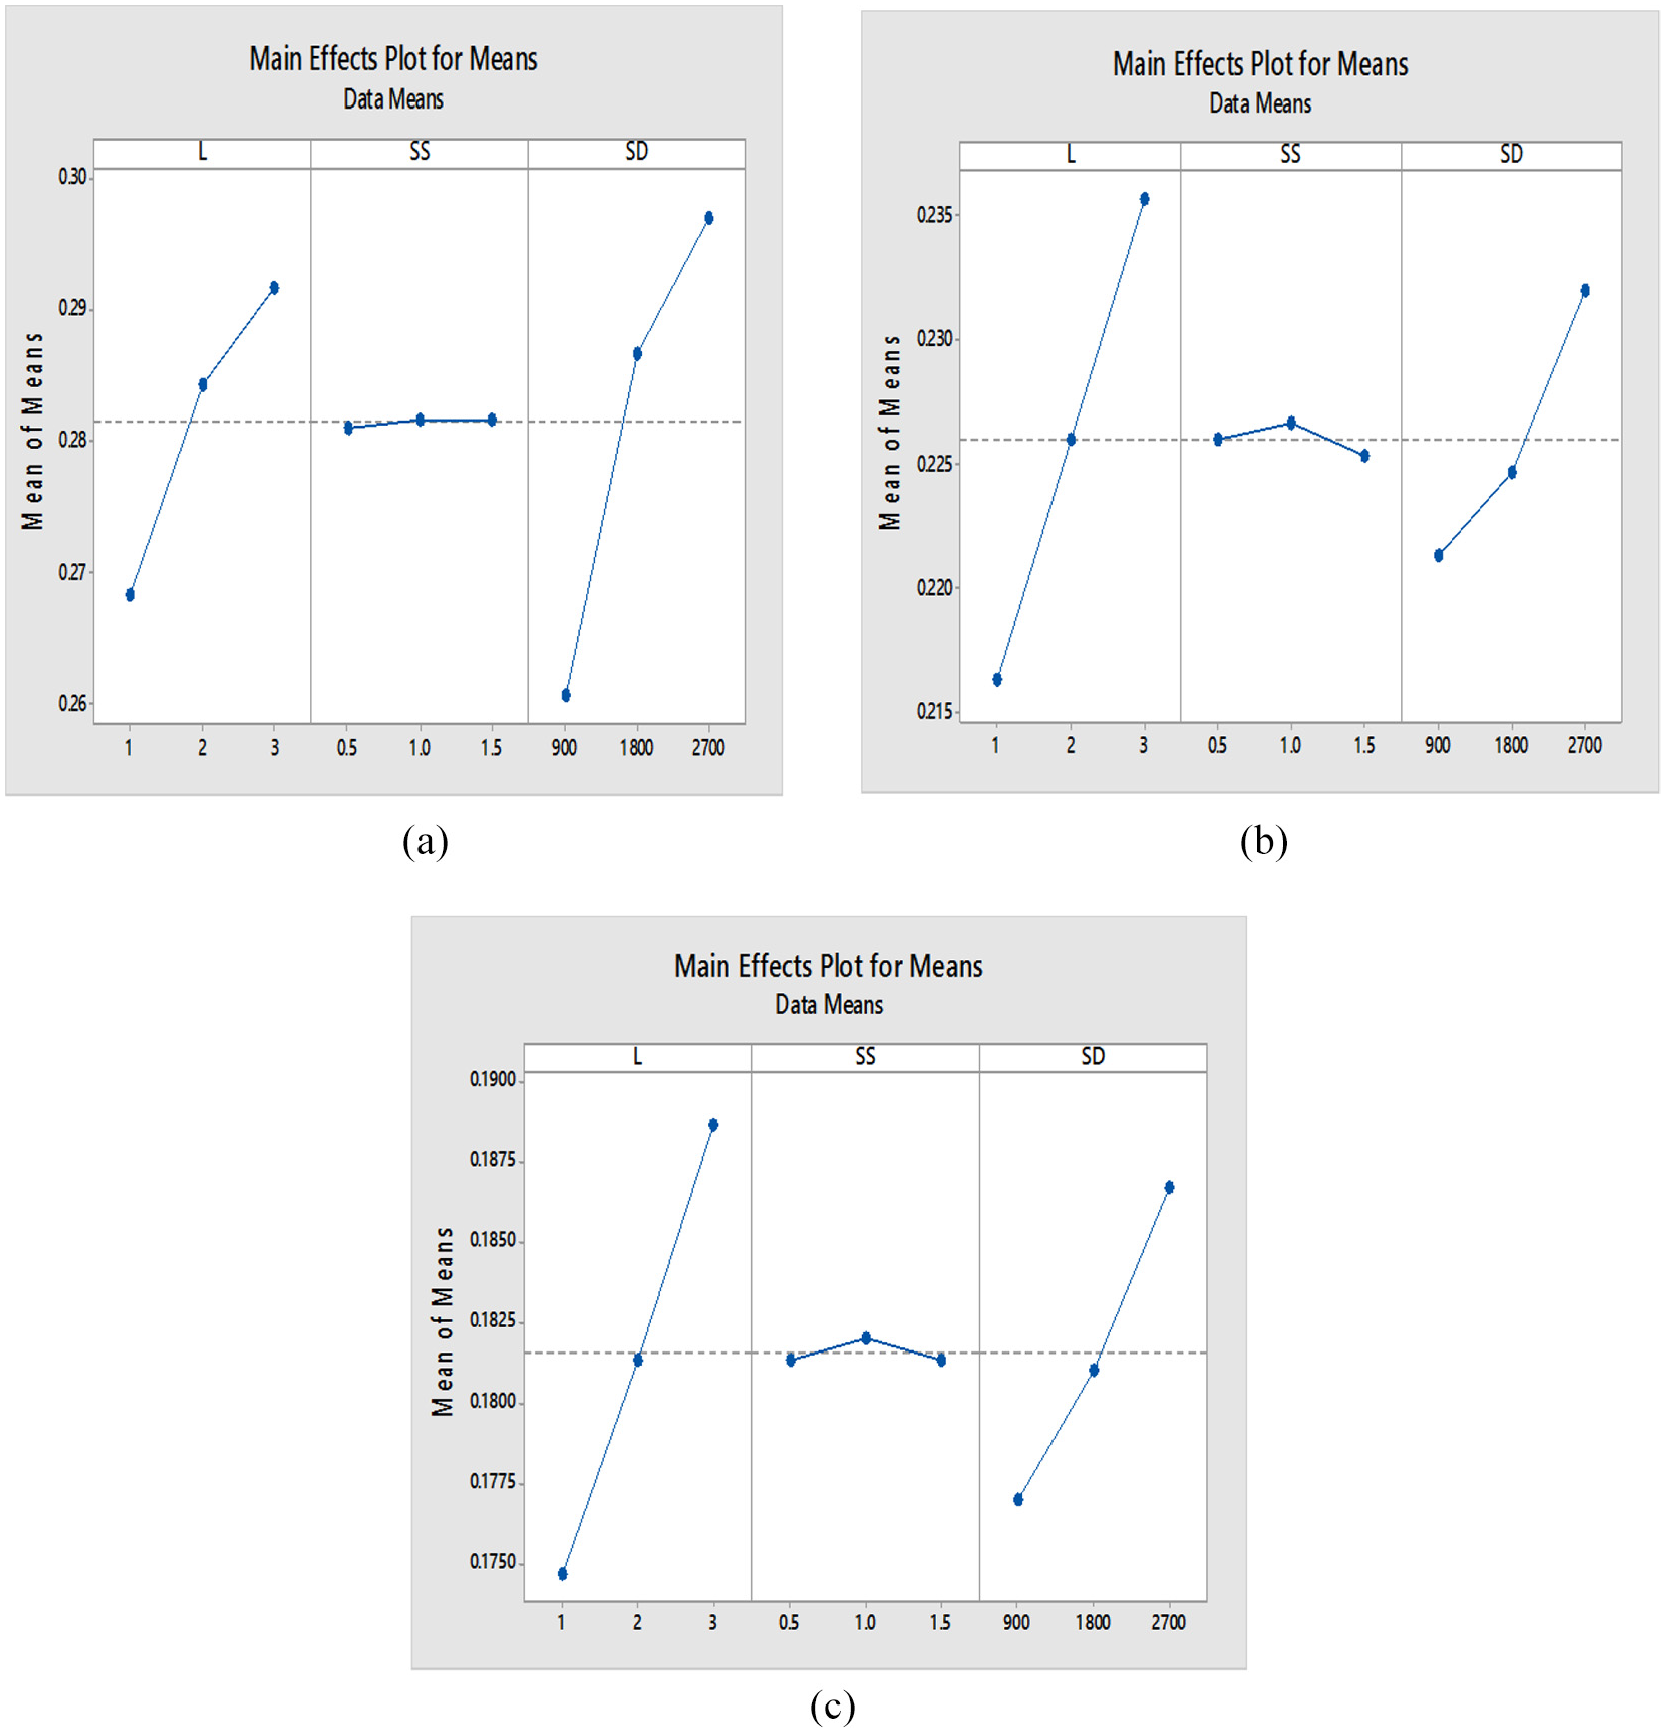
Main effects plot for (a) Cu 100%, (b) Cu-10%TiC, and (c) Cu-20%TiC.
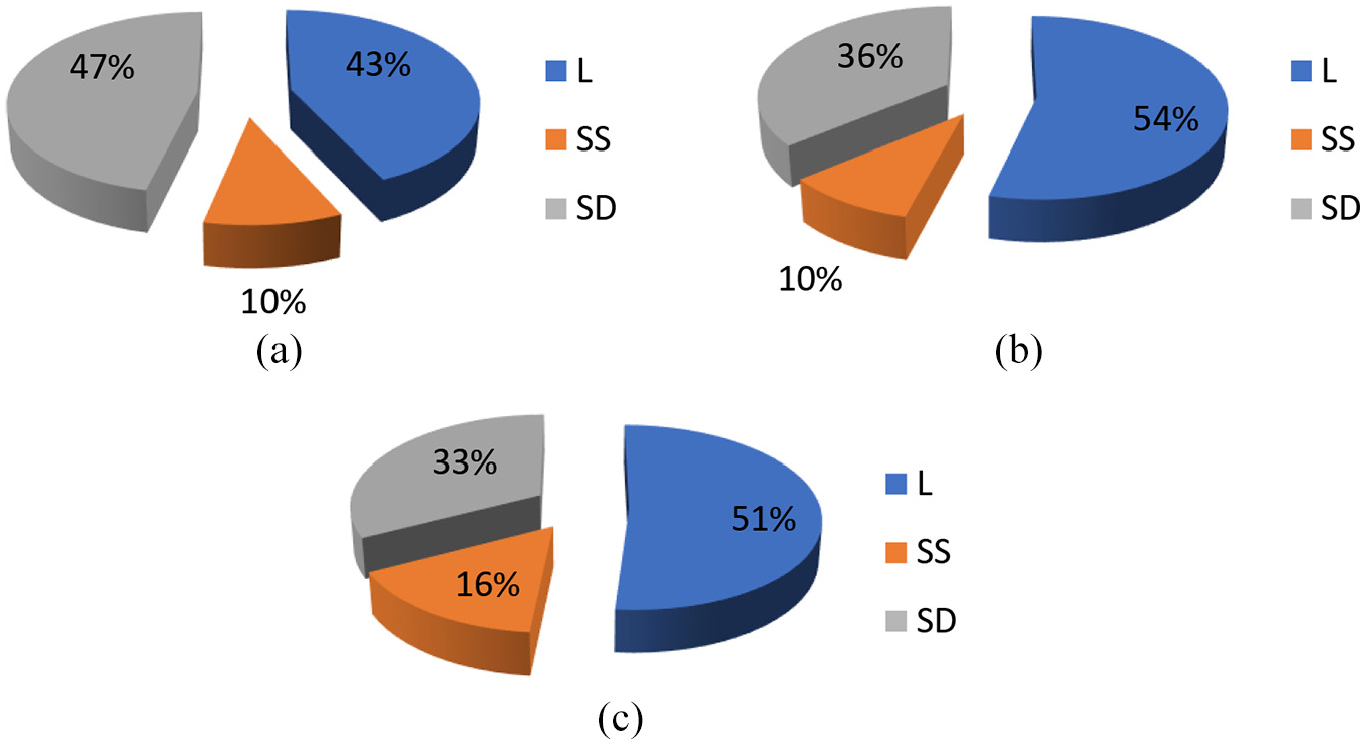
Pie chart distribution for (a) Cu 100%, (b) Cu-10%TiC, and (c) Cu-20%TiC.
Worn surface analysis of pin and disk
Worn surface analysis of pin
Pure copper
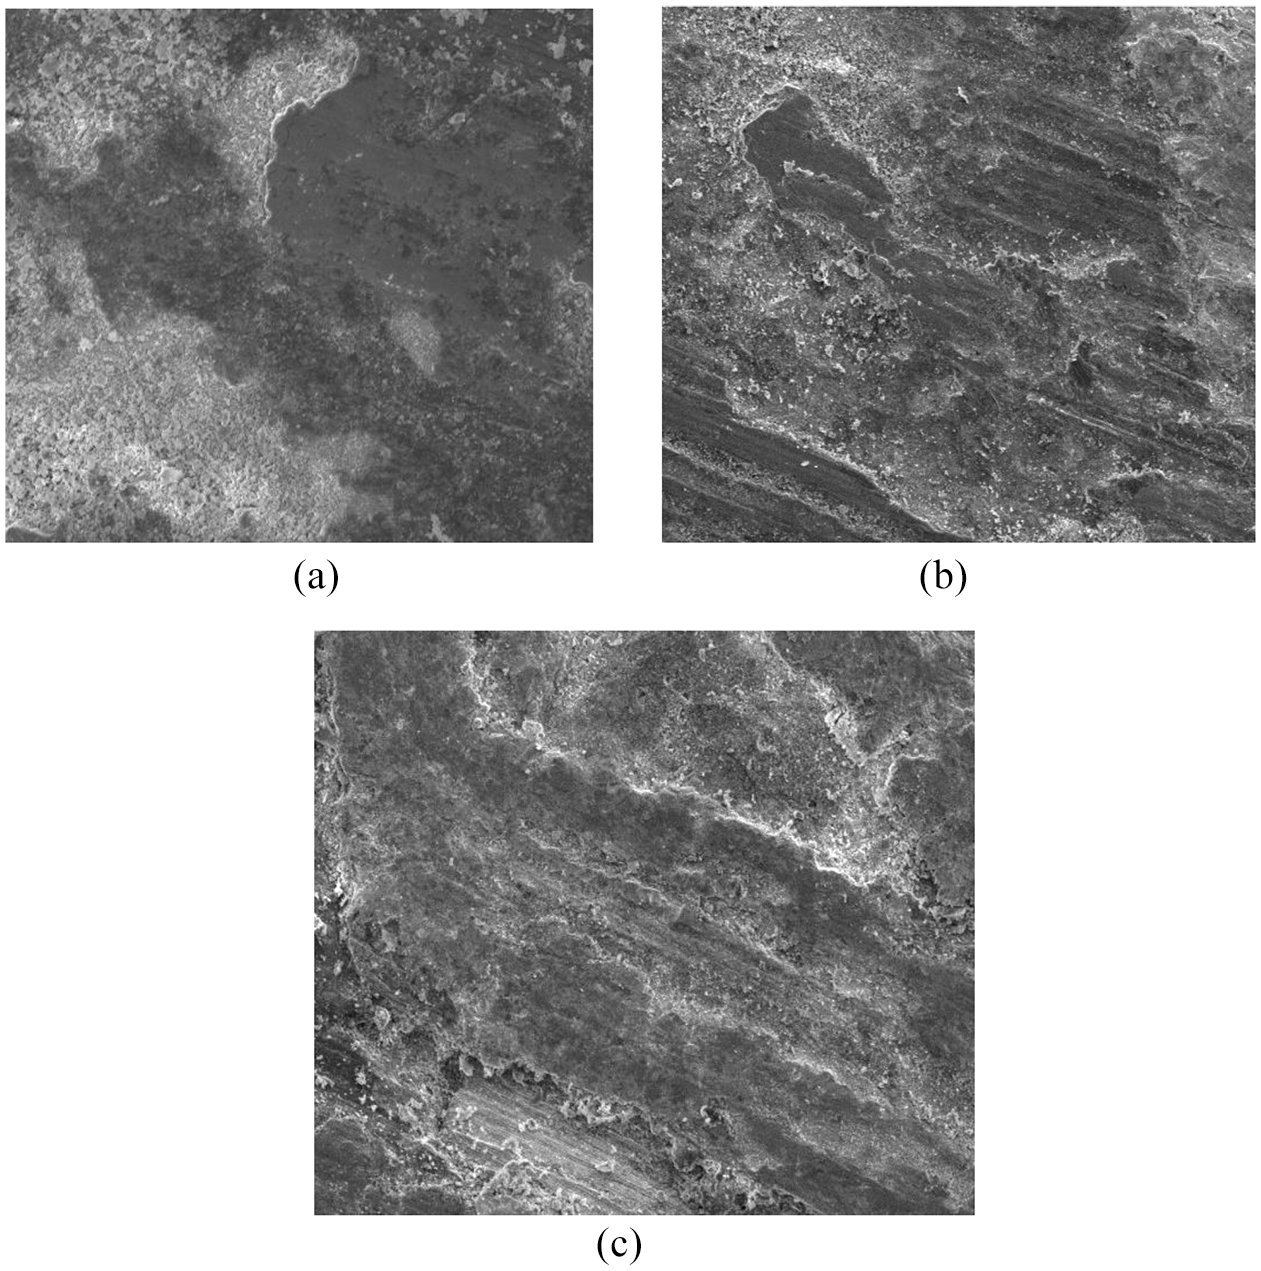
SEM micrographs of pure Cu pin is shown in Figure 14 for the applied normal load of 20 N. It is evident from the micrographs that with an increase in the sliding speed, the surface roughness was increasing which is also clear from the Figure 14. Cu pins have a lesser hardness as compared to the counter disk. When the pure copper sample is rubbed against the hardened EN31 steel disk, the asperities of the hard surface of the steel penetrates the surface of the pure copper pin, the plastic deformation takes place, and due to which high amount of material is being removed out from the pin. As evident from Figure 15, at higher speed, the presence of oxide peaks may form oxide layers such as CuO and Cu2O, which can resist the abrasive wear of Cu pin to some extent.
SEM micrographs of worn surface of pure Cu pin for sliding speed of (a) 0.5 m/s, (b) 1.0 m/s, and (c) 1.5 m/s (at scale of 100 μm).
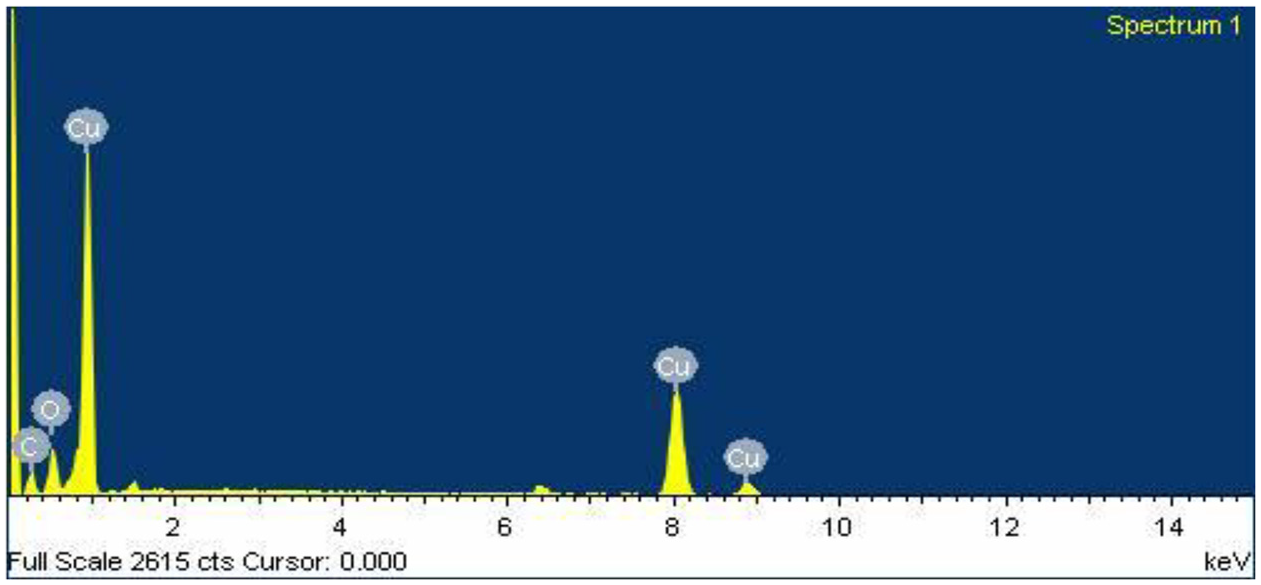
EDS of worn Cu pin.
Cu-5% TiC
SEM micrographs of Cu-5%TiC pin is shown in Figure 16 for the applied normal load of 20 N. With an increase in the sliding speed, the roughness of the surface for the pin is increasing but it is smoother than the pure Cu pin as shown in Figure 14 (as both the figures are on the same scale). This may be due to the higher hardness of TiC which ultimately provides the strength to the pin to resist the plastic deformation. Figure 17 indicates that oxide layers like CuO and Cu2O may form which indicates that the nature of wear can be oxidative.
SEM micrographs of worn surface of Cu-5%TiC pin for sliding speed of (a) 0.5 m/s, (b) 1.0 m/s, and (c) 1.5 m/s (at scale of 100 μm).
EDS of worn Cu-5% TiC composite pin.
Cu-10% TiC
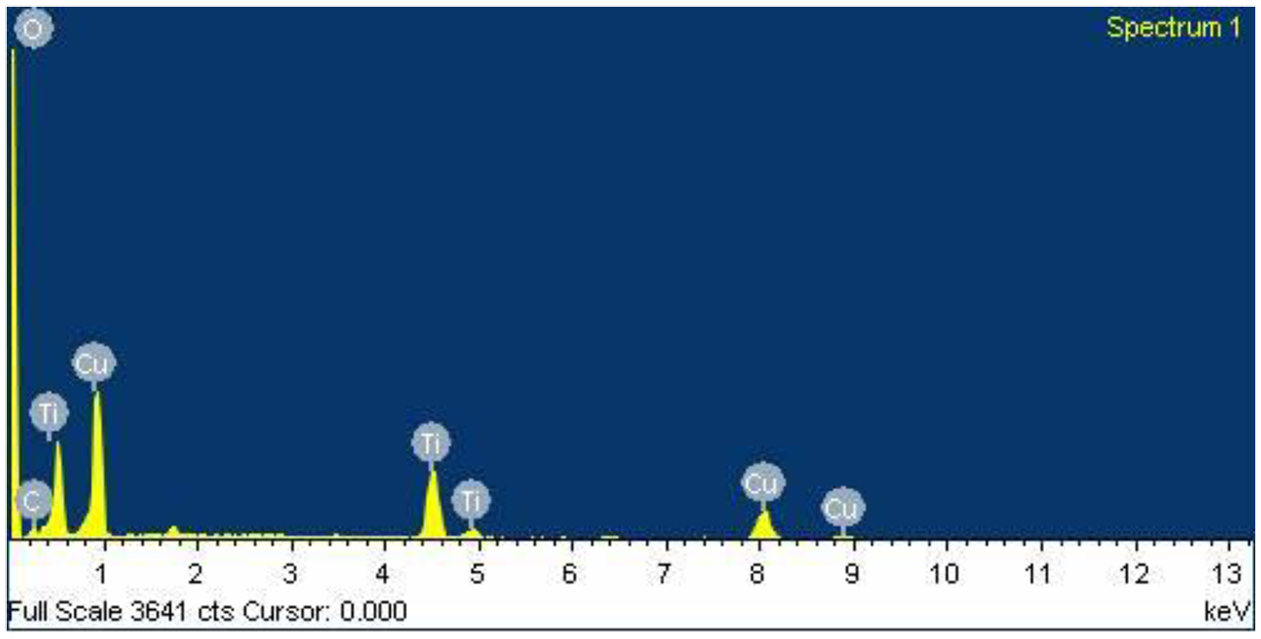
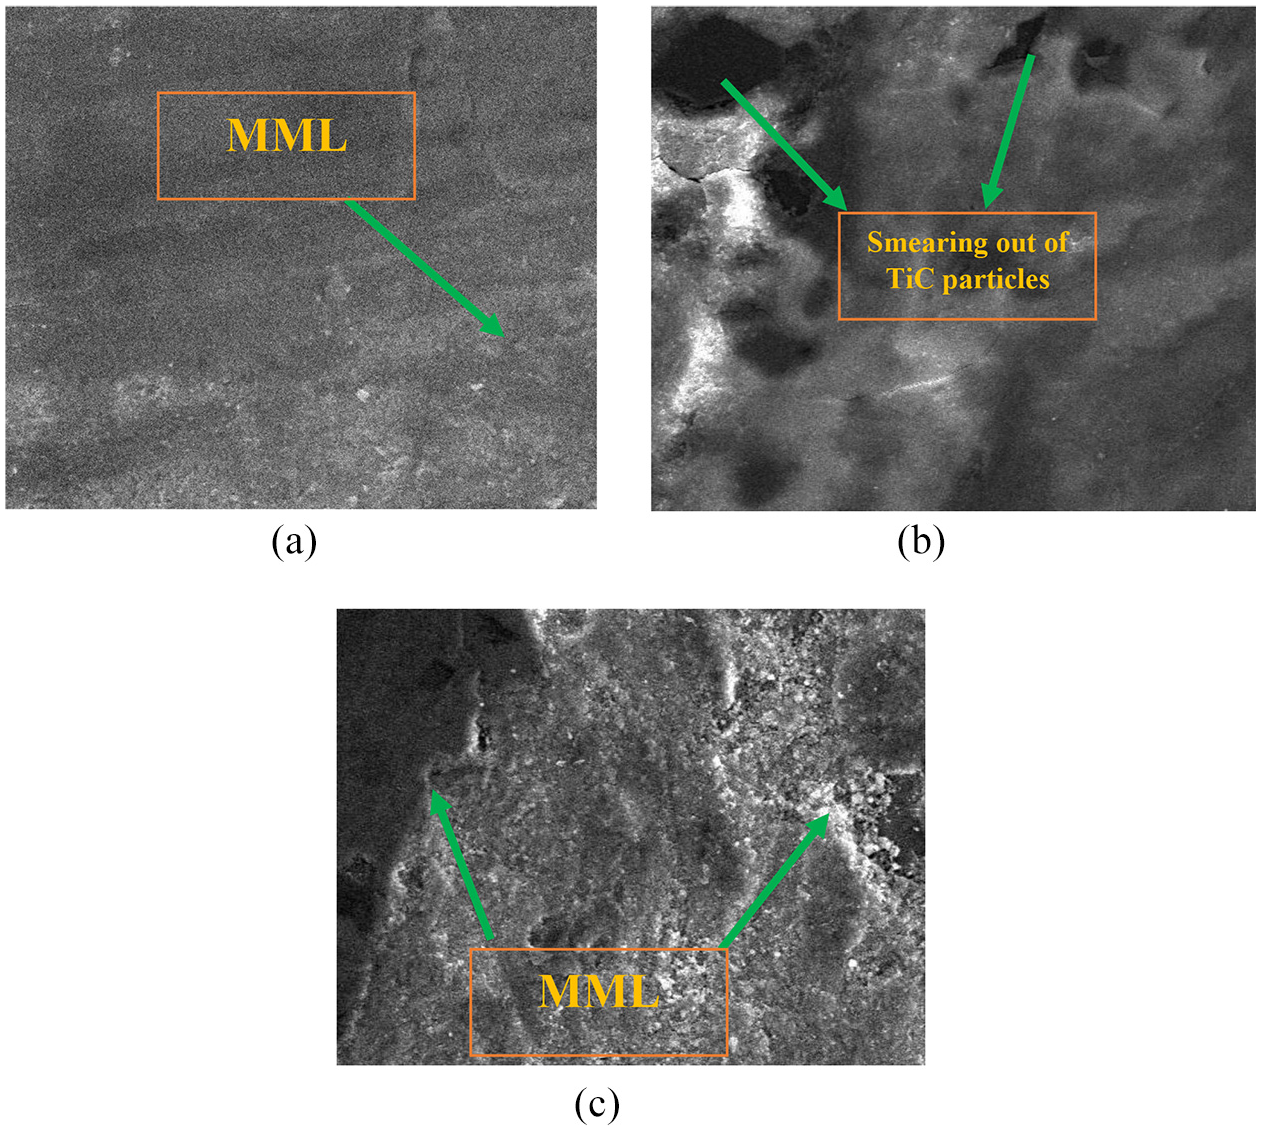
The worn surface of the Cu-10% TiC composite pin is shown in Figure 18 for different sliding speeds for the applied normal load of 20 N. The micrographs show irregular grooves due to the extensive plastic deformation of the matrix on the worn surface of the pin. Due to the inadequate hardness and bonding of reinforced particles in the matrix, dislodging of the TiC particles are easier from the matrix. Groove width on the worn surfaces of the pin was measured and it is less as compared to the pure copper due to the presence of the harder TiC particles. It is worth noting here that for the lower load (20 N), the worn surface is smoother than that of the pure copper and this may be due to the presence of a mechanically mixed layer (MML). EDS analysis (Figure 19) confirms the presence of Cu and TiC particles in the synthesized composite.
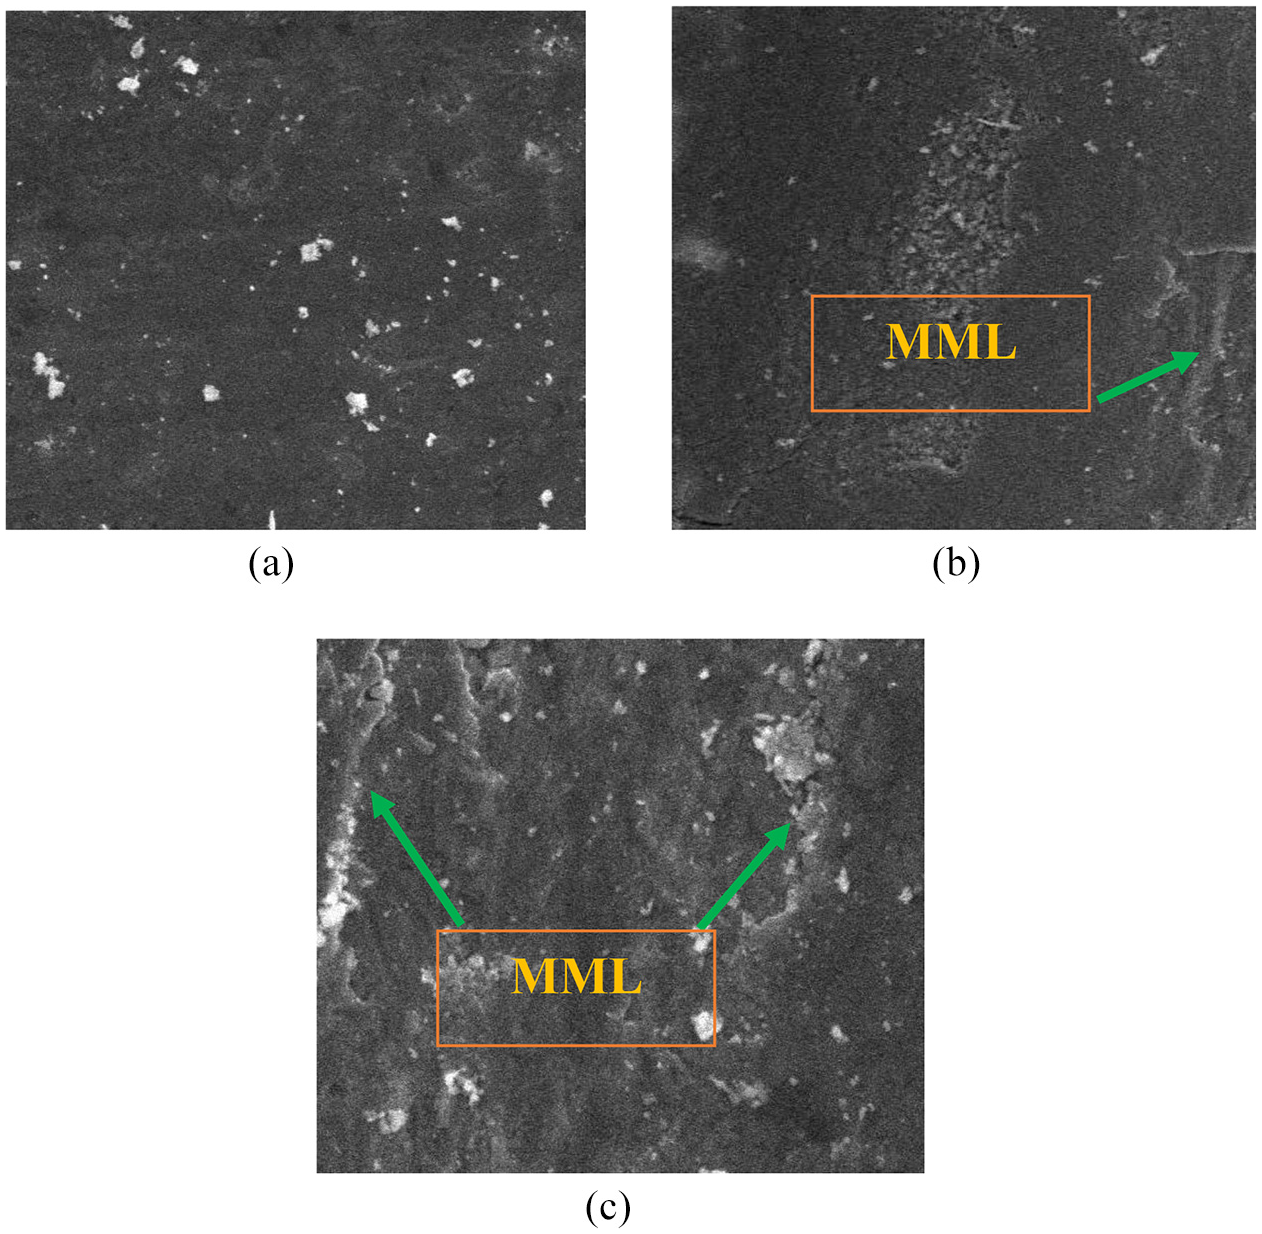
SEM micrographs of worn surface of Cu-10%TiC pin for sliding speed of (a) 0.5 m/s, (b) 1.0 m/s, and (c) 1.5 m/s (at scale of 100 μm).
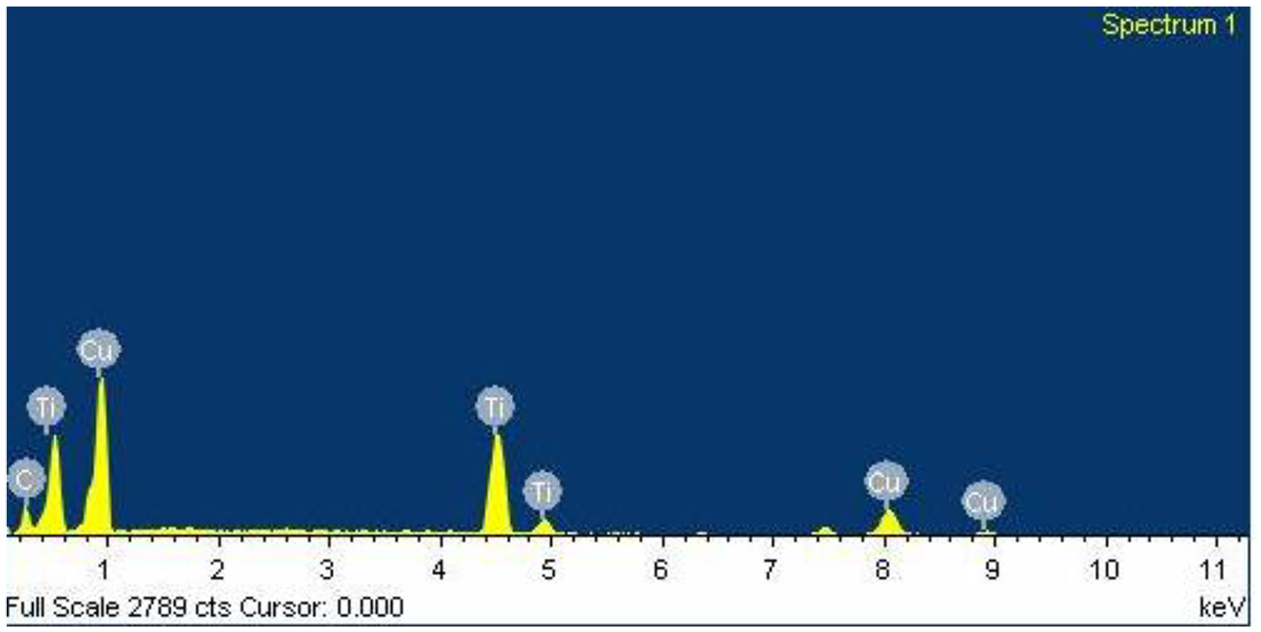
EDS of worn Cu-10% TiC composite pin.
Cu-15% TiC
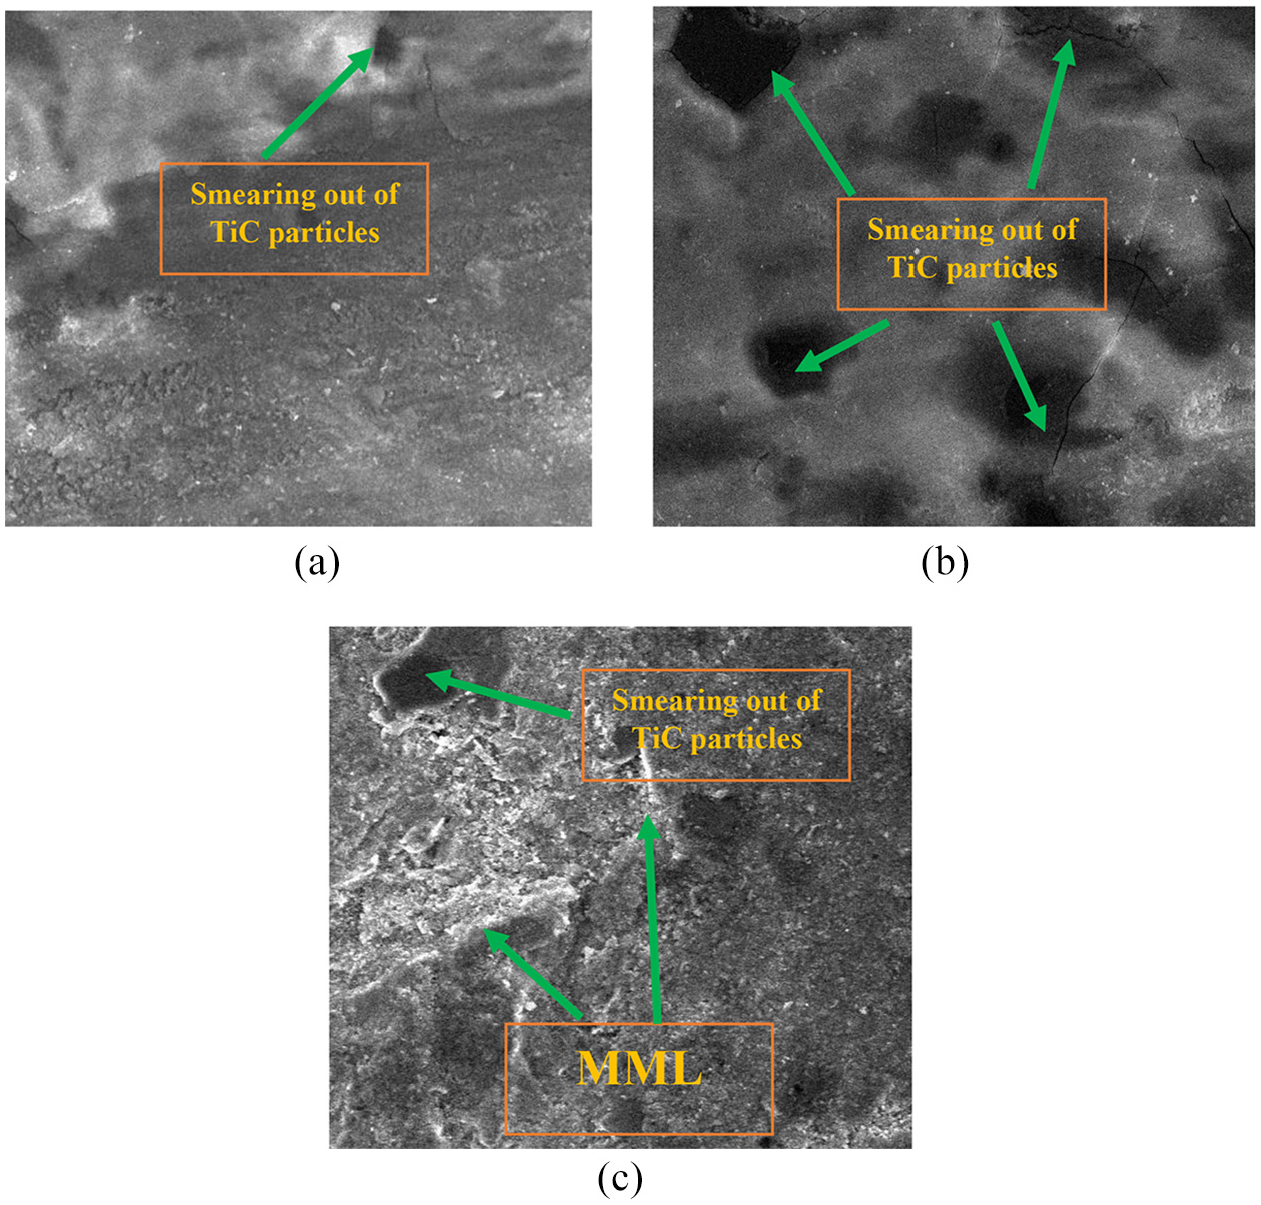
The worn surface of the Cu-15% TiC composite pin is shown in Figure 20 for different sliding speeds for the applied normal load of 20 N. As already discussed that the wear resistance of Cu-15% TiC is improved due to the presence of hard reinforcement particles in the matrix material. For large sliding distance or at high load, gradually hard particles from the composite starts to bear the load, and the wear debris particles, as well as grooves on the pin, become smaller in size (Figure 20(a)–(c)). The presence of oxide in the EDS analysis (Figure 21) signifies that the wear can be oxidative in nature. The wear out of the composite material is mainly due to the combination of plastic deformation of the matrix element, the formation of oxide layers as well as smearing out of reinforcement particles and asperities from both the surfaces, 34 which in turn may crush to very minute particles and forms MML. With increased load and sliding speed, this layer along with the protruded hard TiC particles by load sharing effect becomes very effective in reducing the sliding wear by protecting and reducing the progressive wear rate of the copper matrix to some extent. Thus, by the combination of third body rolling action at the contact surface, the presence of tribolayer, and transfer film, there is a reduction in the coefficient of friction.
SEM micrographs of worn surface of Cu-15%TiC pin for sliding speed of (a) 0.5 m/s, (b) 1.0 m/s, and (c) 1.5 m/s (at scale of 100 μm).
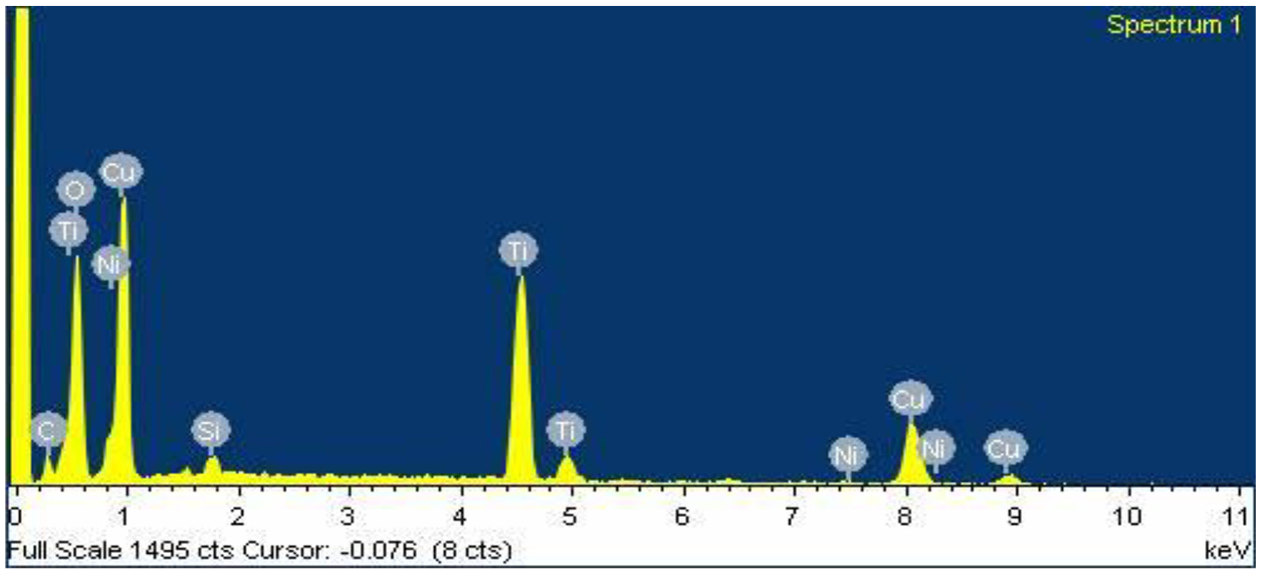
EDS of worn Cu-15% TiC composite pin.
Cu-20% TiC
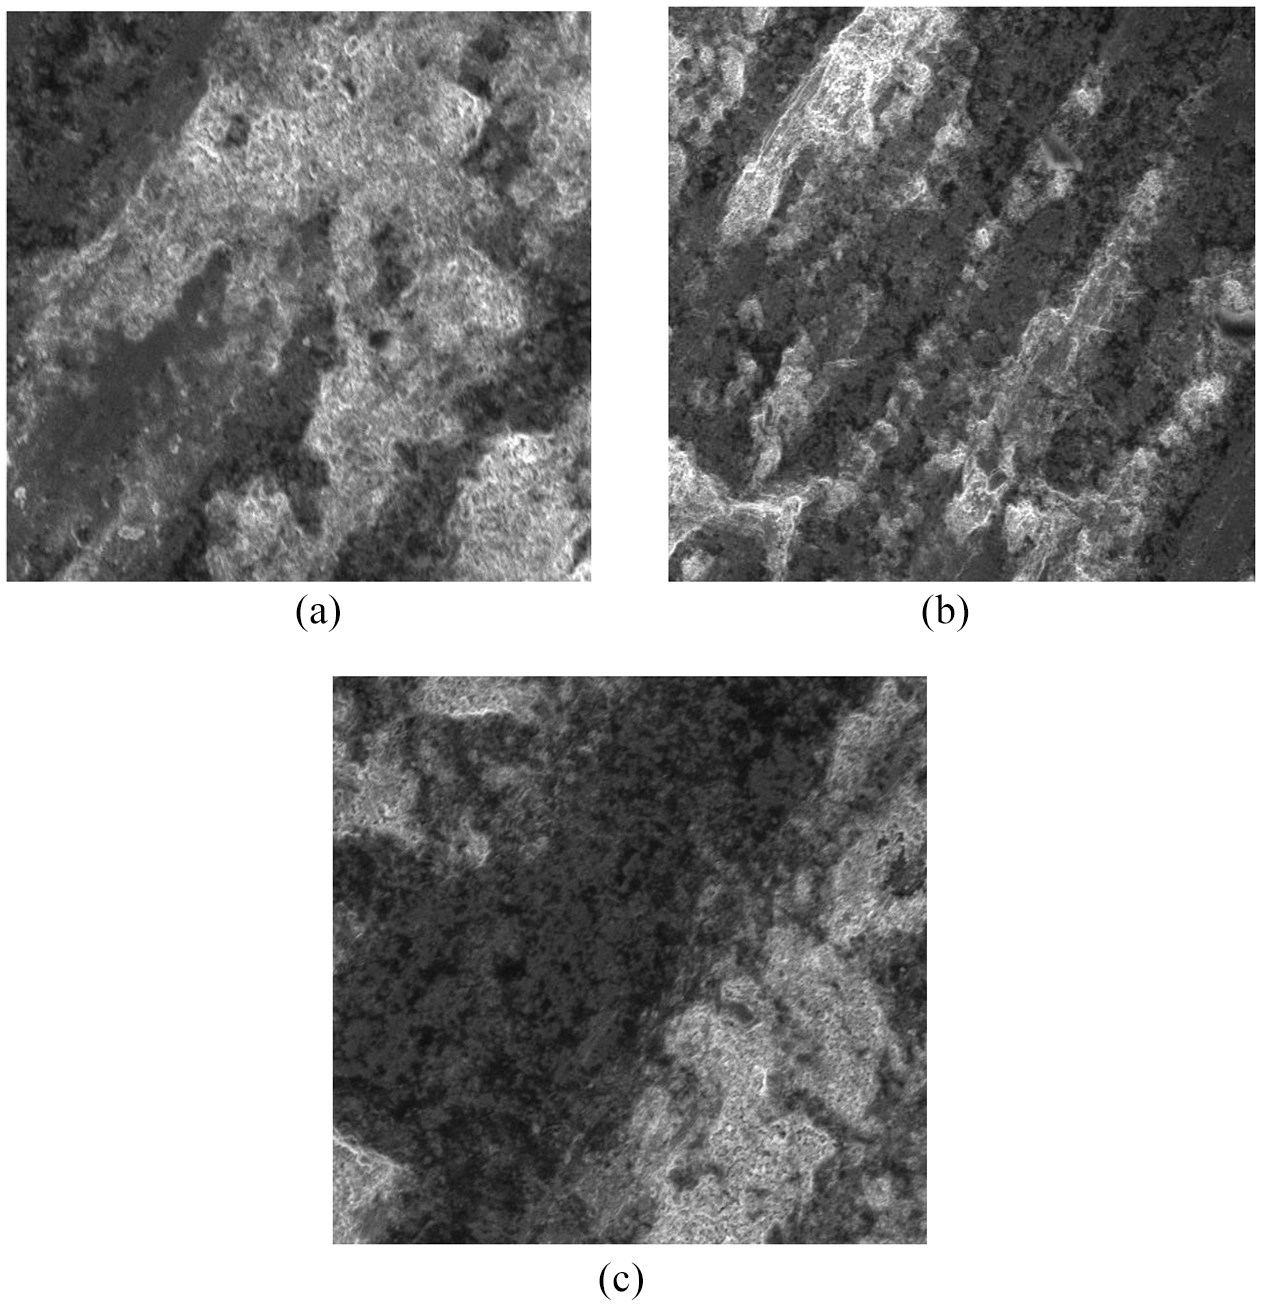
The worn surface of the Cu-20% TiC composite pin is shown in Figure 22 for different sliding speeds for the applied normal load of 20 N. Similar phenomena (as for Cu-15% TiC) was found when the reinforcement is further increased to 20%. However, now the counter-face starts to get abraded (Figure 22). Abrasion of the counter disk restricts the percentage of reinforcements with the soft matrix material to be used with the metallic surfaces. The wear mechanism of the composite material is due to the combination of plastic deformation of the matrix material and also due to the oxide layer formation which is also evident from Figure 23 (EDS spectrum).
SEM micrographs of worn surface of Cu-20%TiC pin for sliding speed of (a) 0.5 m/s, (b) 1.0 m/s, and (c) 1.5 m/s (at scale of 100 μm).
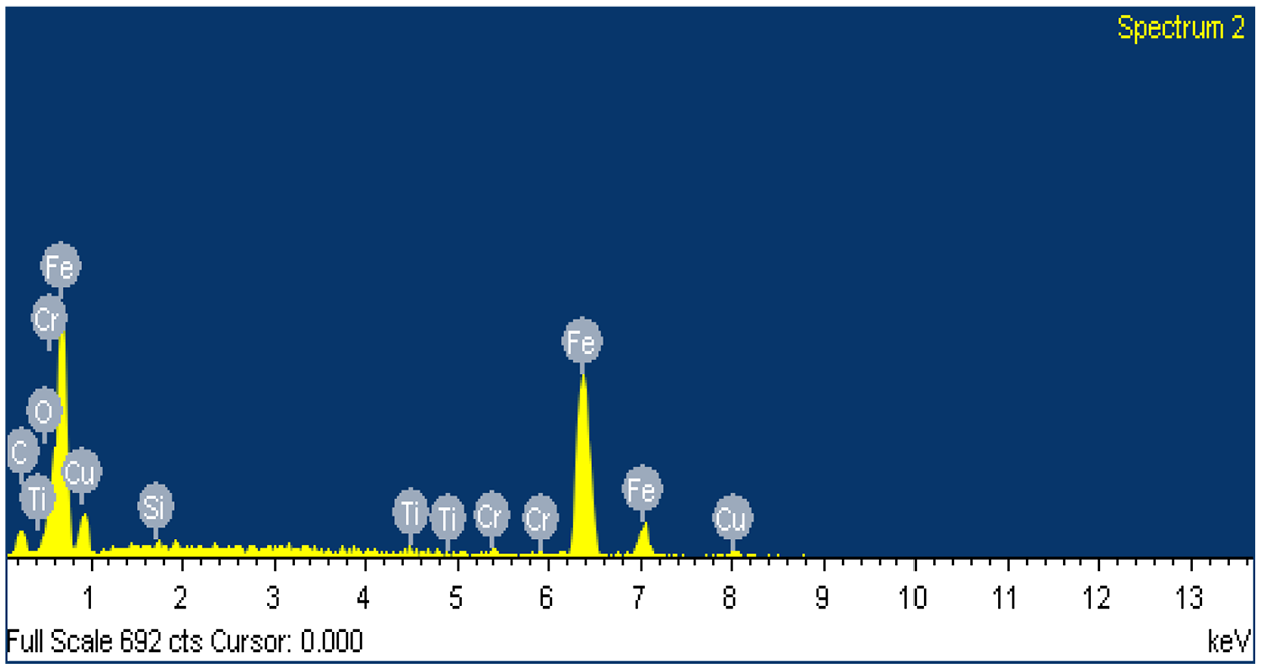
EDS of worn Cu-20% TiC composite pin.
Worn surface analysis of counter disk
Figure 24 represents the SEM micrographs of the counter disk mated with respective Cu and Cu-TiC composite pins. With the increase in the content of TiC, the counter disk starts to abrade. The presence of Cr, Fe, Si spectrum in EDS (Figure 23), also proves the removal of counter disk material due to the higher content of TiC particles in the MMC.
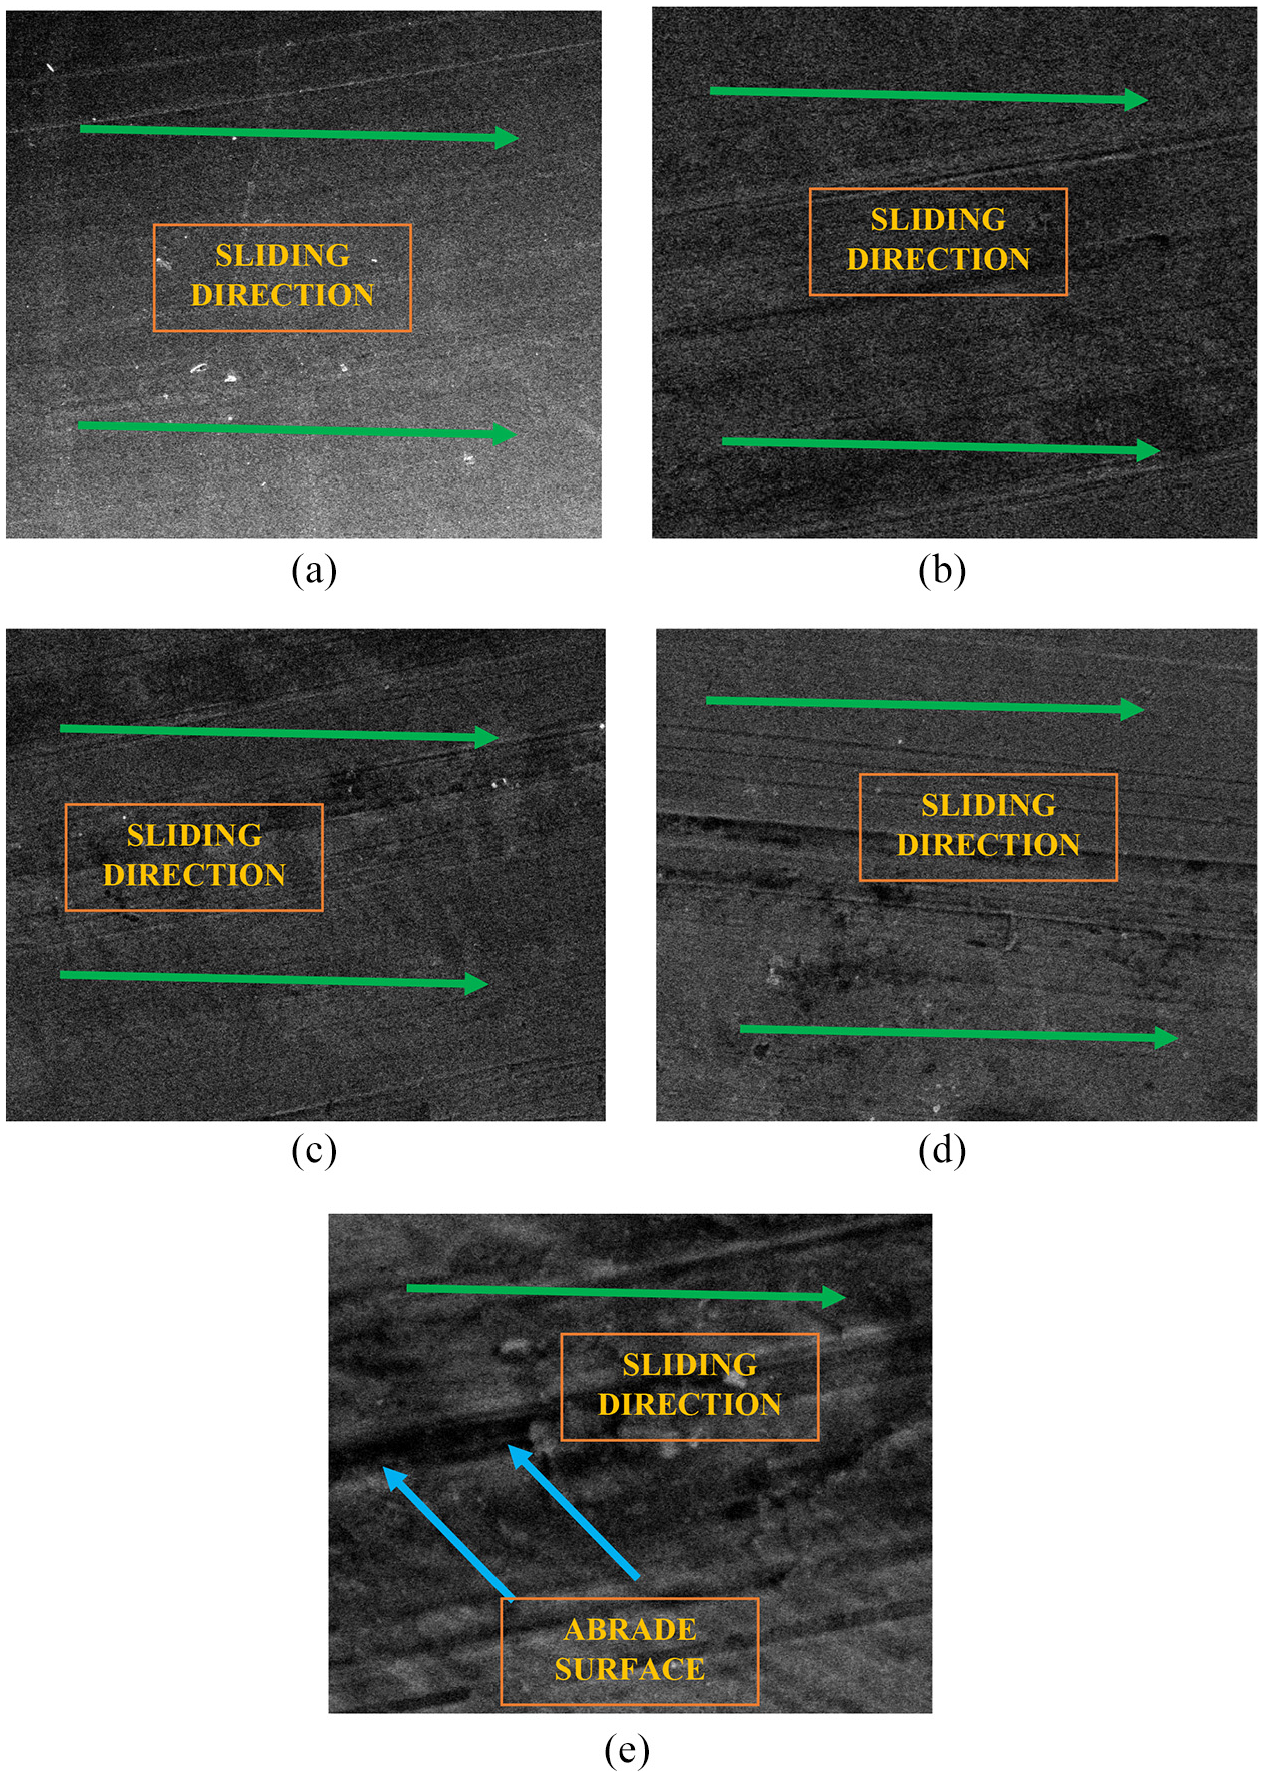
SEM macrographs of the worn surface of disc at sliding speed of 1.0 m/s with (a) Pure Cu, (b) Cu-5% TiC, (c) Cu-10% TiC, (d) Cu-15% TiC, and (e) Cu-20%TiC (at scale of 100 μm).
Conclusion
In the present research, mechanical, metallurgical and wear studies have been performed for sintered copper and Cu/TiC nano-composites fabricated by the powder metallurgy route. The results revealed that both hardness and as well as physical properties are improved by adequate reinforcement on the metal matrix. Hardness and tensile strength were higher for the reinforced copper composite and were maximum for Cu-20% TiC composite. The relative density of the samples was decreasing while porosity was increasing with increment in the wt.% of TiC. Friction and wear behaviors are characterized for different load, sliding speed, and sliding distance. It is observed from the measured data that applied load, sliding distance and composition play the important role in defining the wear and friction mechanism under the majority of the tested conditions. Statistical model was prepared to validate the experimental results which also indicates that the wear rate and coefficient of friction were significantly influenced by applied normal load and sliding distance. It was also found that the wear rate and the coefficient of friction decreased as the % of the TiC were increased in the composite. The mechanism of wear observed in the composites was abrasive in nature which is accompanied by plowing, smearing, and adhesion, depending upon the composition of sintered materials, although the mechanism of wear observed in the composites was primarily abrasive in nature. There is also the possibility of oxidative wear with plastic deformation in the case of pure copper and composites with a low concentration of reinforcement. The SEM micrograph and EDS spectra help us in explaining the underlying wear and friction mechanism and identifying the optimal process parameters. At high concentrations, besides the oxidative wear, there is also a possibility of the formation of MML which withstands high stresses and is very effective in reducing the sliding wear. However, it is also observed that there is an increase in COF with distance and speed which may be attributed to the inability to generate the steady tribolayer at contact surfaces and subsequent increase in interlocking between the counter surfaces. SEM micrographs for the counter disc reveal that the increase in % of TiC particles leads to abrade the counter surface which restricts the percentage of the reinforcement material in the soft matrix material when it is to be used with the metallic surfaces.
Footnotes
Declaration of conflicting interests
The author(s) declared no potential conflicts of interest with respect to the research, authorship, and/or publication of this article.
Funding
The author(s) received no financial support for the research, authorship, and/or publication of this article.