
Abstract
According to the difficult machinability of titanium alloy, the research shows that the surface micro-textured technology can reduce the friction force and cutting temperature in the cutter-workpiece contact area. Starting with the precise preparation of micro textures by laser processing technology, this paper takes ball-end milling cutter milling titanium alloy as the research object, studies the influence of laser processing parameters on micro-textured size parameters, and optimizes the laser processing parameters as follows: laser power P = 40 W, scanning speed V = 1700 mm/s, scanning times N = 7 times, and spot diameter D = 40 μm. The distribution of temperature field and stress field during laser processing is analyzed, and the accuracy of the influence rule of laser processing parameters on micro-textured size parameters is verified, thus realizing the purpose of accurately preparing micro textures. The interactive influence of mesoscopic geometric features on the cutting performance of ball-end milling cutter is analyzed, and the genetic algorithm is used to optimize the parameters. The results show that the main factor affecting the force-heat characteristics of the tool is the blunt edge radius, and the interaction between the blunt radius of the cutting edge and the distance from blade is obvious. The optimized mesoscopic geometric parameters are as follows: the blunt edge radius is 20 μm, and the distance from blade is 110 μm, the micro-textured diameter is 30 μm, and the micro-textured spacing is 175 μm. The research content of this paper lays a foundation for efficient cutting of titanium alloy materials.
Keywords
Introduction
When cutting titanium alloy, there will be severe friction between the tool and the workpiece, and there will be problems such as high cutting force, high temperature, and poor surface in the cutting contact area. Through the study of bionic tribology, it is found that processing the surface of the tool with small structures like pangolins and fish scales can effectively improve the cutting performance of the tool and improve the friction performance. 1 Laser processing has the advantages of high energy, simple control, and low process cost, so it is often used in the preparation of surface micro textures. Different laser process parameters have an impact on the diameter and depth of the micro textures. In addition, the micro-textured parameters and edge parameters have a greater impact on the cutting performance of the tool. Orthogonal experiments with independent parameters cannot fully reveal the law of influence. Since the blunt round parameter of the cutting edge has a certain influence on the distance from the cutting edge, the interaction between the two needs to be considered.
Su et al. 2 from Nanjing University of Aeronautics and Astronautics and others used fiber lasers to process micro textures of different shapes on the surface of polycrystalline diamond tools, and studied the influence of laser processing parameters on the morphology and quality of microgrooves. The results show that the width of the microgrooves increases with the increase of the average power and pulse frequency, while the depth decreases. The sidewall roughness of the microgrooves increases with the decrease of the scanning speed, and increases with the increase of the average power. Wang 3 used a combination of numerical simulation and orthogonal experiment to study the influence of cutting force and cutting temperature in the process of cutting titanium alloy after the micro-groove textures was placed on the tool surface. The results show that under certain conditions, the insertion of microgrooves will have a certain degree of impact on the strength of the tool; but the addition of microgrooves effectively reduces the cutting force and cutting temperature. Fang 4 quantitatively analyzed the metal cutting process based on the slip line model, and further studied the effect of the blunt edge of the tool. The results show that the increase in the radius of the blunt edge will increase the axial force during the cutting process, while the resultant cutting force is almost unchanged. At the same time, tool wear and life are greatly affected by the tool edge radius, and the cutting thickness also needs to be based on blunt radius to choose.
In summary, many scholars have analyzed the influence of different shapes of micro textures on the cutting performance of the tool and the influence of different laser process parameters on the size of the micro textures based on orthogonal experiments. However, whether the preparation parameters of the micro textures can make the processed micro textures reach the required size parameters has not been considered, and whether the insertion of the cutting edge will further improve the performance of the tool is still lacking related research. Therefore, this article aims to obtain precise micro-textured size, optimize the laser process parameters; analyze the temperature field and stress field on the surface and inside of the material during laser processing, and verify the accuracy of the law of the influence of laser process parameters on the micro-textured size parameters. An experimental platform for milling titanium alloys with cemented carbide ball-end milling cutters is built to analyze the interactive effects of mesoscopic geometric characteristic parameters on milling force and milling temperature to optimize the mesoscopic geometric parameters, further improve the cutting performance of the ball-end milling cutter, and achieve titanium Alloy high-efficiency and high-quality processing.
Research on laser processing technology of surface micro textures
Theoretical analysis of laser power for laser processing micro textures
According to the heat conduction model proposed by Carslaw and Jaeger, 5 which is a three-dimensional heat conduction model with a heat source that satisfies the classic Fourier law of heat conduction and the law of conservation of heat, the three-dimensional heat conduction model during laser processing is obtained as:
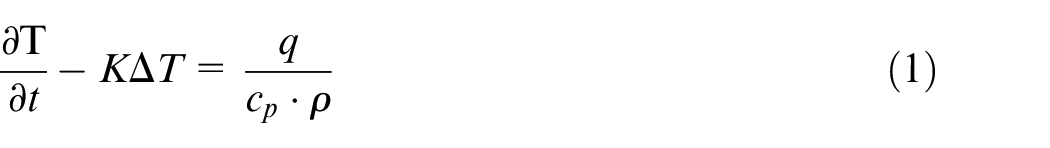
Where: q is the heat absorbed by the processed material per unit volume per unit time (J·m−3·s−1); cp is the specific heat capacity of the material (J·kg−1·°C−1); ρ is the material density (kg·m−3); K is the thermal diffusivity of the material (m3·s−1)
For a laser beam that obeys the Gaussian distribution, the distribution diagram of the laser energy along the radial direction is shown in Figure 1:
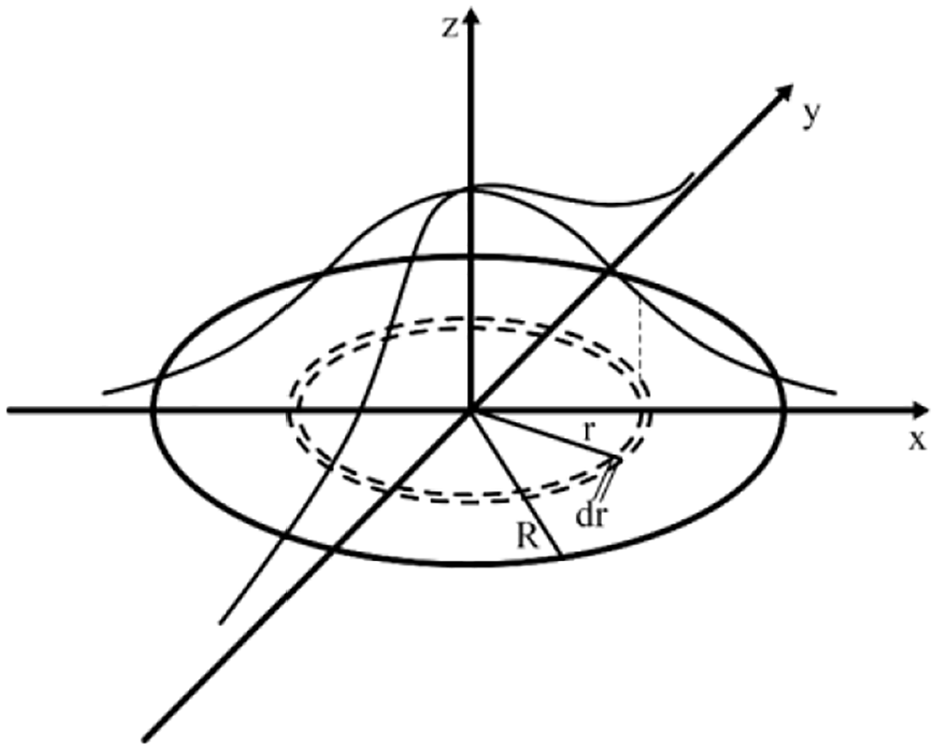
Schematic diagram of energy distribution of Gaussian laser.
The amplitude distribution of the traveling wave in the fundamental mode of the Laguerre Gaussian beam can be written as:
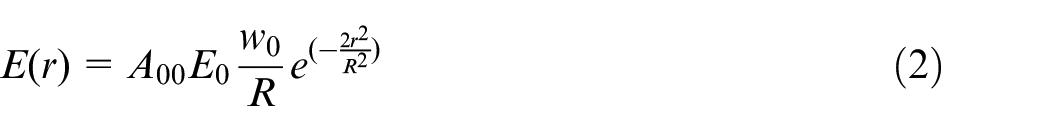
Where: A00 is the normalization constant of the fundamental mode; E0 is a constant independent of the coordinates; w0 is the beam waist radius; R is the laser spot diameter at the focal point; r is the distance from the laser spot center.
The amplitude is proportional to the power, so the power distribution formula is:
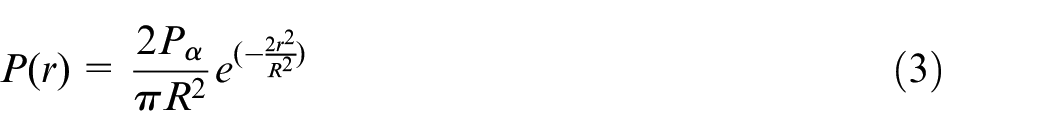
Where Pα is the total laser power.
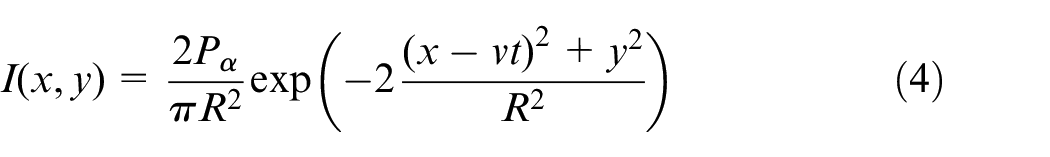
Take the form of linear movement of the laser beam spot center along the x-axis direction with the velocity v in the z = 0 plane as an example for analysis. In the (x, y) plane, the Gaussian distribution of the laser beam energy density is:
Introduce the known solution G for the heat distribution of a single point source, assuming that the point is located at the x′, y′, t′ position in the plane, and the laser heat flow at this point will be affected by the following formula at time t processing materials:
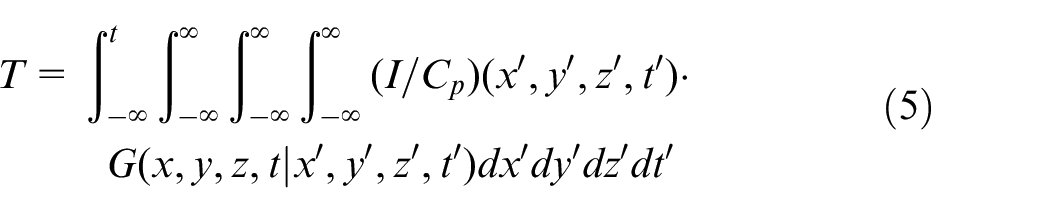
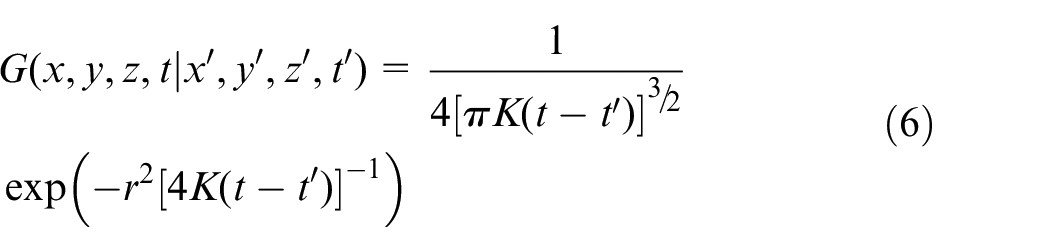
Where: the Green’s formula G for surface heat conduction is:

When the laser is at x′, y′, the temperature distribution of the laser beam is the superposition of the temperature of each position at time t′, so the equation (5) is integrated and dimensionless to obtain:

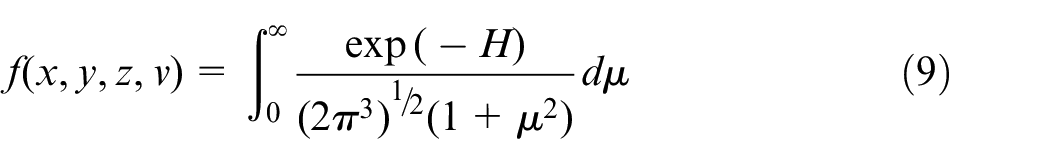
Where: the temperature distribution function equation is:
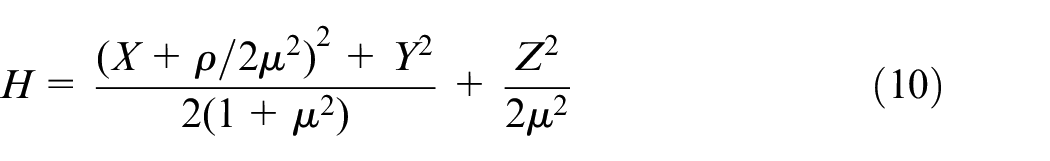
Where:
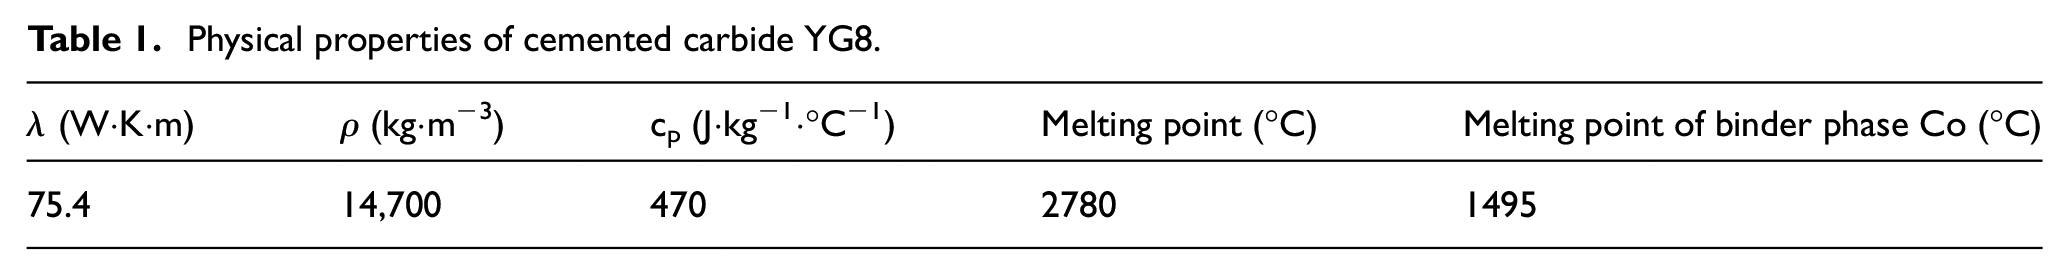
The relevant physical parameters of cemented carbide YG8 in the test are shown in Table 1:
Physical properties of cemented carbide YG8.
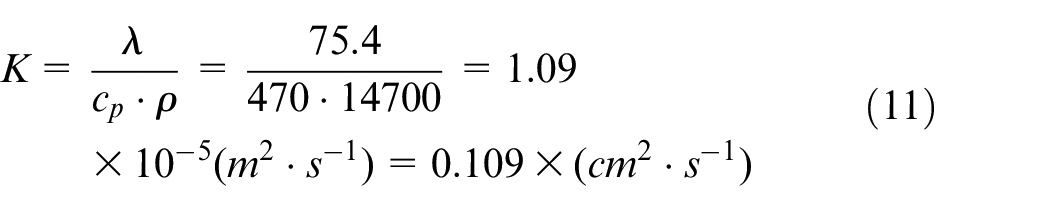
Then calculate the thermal diffusivity of YG8:
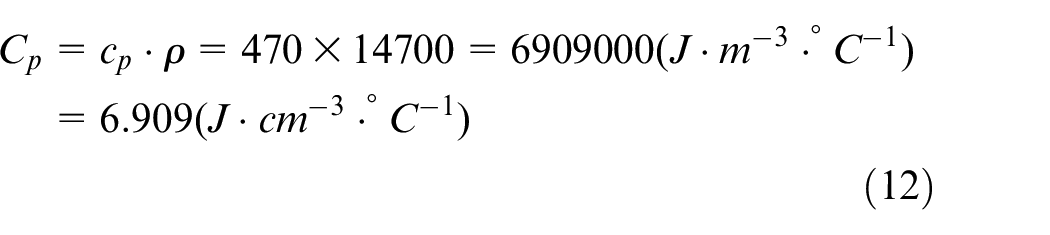
The heat required for each unit volume of the processed material to rise by 1°C is:
If you want to obtain a micro texture with a depth of 40 μm, the temperature of the material at the depth of 50 μm at the center of the spot must at least exceed the melting temperature. From the temperature distribution equation (9), we can see that when x = y = 0, z = 50 μm, v = 1700 mm/s, when R = 15 μm, the value of the temperature distribution function f is:

For YG8 material, at the position where x = y = 0 and z = 50 μm, the temperature T of the processed material should exceed the melting point of the cemented carbide material binder (Co), meet the following conditions:
The calculation can be:

The absorption power of the smallest material surface is 18.3 W.
Orthogonal experiment and result analysis of the influence of laser process parameters on micro-textured size
Cemented carbide YG8 is used as the material to prepare the micro texture. Studies have shown that the micro-pit texture has good performance, so the micro-pit texture is selected as the micro-textured selection. 6 After preparation, metallographic sandpaper is used to treat the burrs, and acetone is used for cleaning in an ultrasonic cleaning machine. The laser processing equipment-Beijing Zhengtian Fiber Laser as shown in Figure 2(a). Figure 2(b) is the structure of the micro textures under a super-depth-of-field microscope.
Fiber laser and micro textures: (a) fiber laser and (b) the structure of the micro textures.
Through the analysis and calculation in the previous section, under the condition of ensuring the micro-textured size, the theoretical minimum value of the laser power absorbed by the material surface is 18.3 W. Considering the actual situation, a single factor experiment is used to determine the selection range of laser process parameters that meet the micro-weaving configuration. Obtained: The parameter range of laser power is (30, 50 W); the parameter range of laser scanning speed is (1300, 1700 mm/s); the parameter range of laser scanning times is (6, 9); the parameter range of laser spot diameter is (30, 70 μm). According to the above-mentioned laser parameter range, design the orthogonal experiment factor level table as shown in Table 2.
Factor level table of orthogonal test.
The prepared micro textures uses 30, 40, 50, and 60 μm as processing diameters. After processing, measure and process the data accordingly. The orthogonal test results are shown in Table 3. The error value is the error between the target pit diameter and the actual pit diameter.
Orthogonal experiment and results.
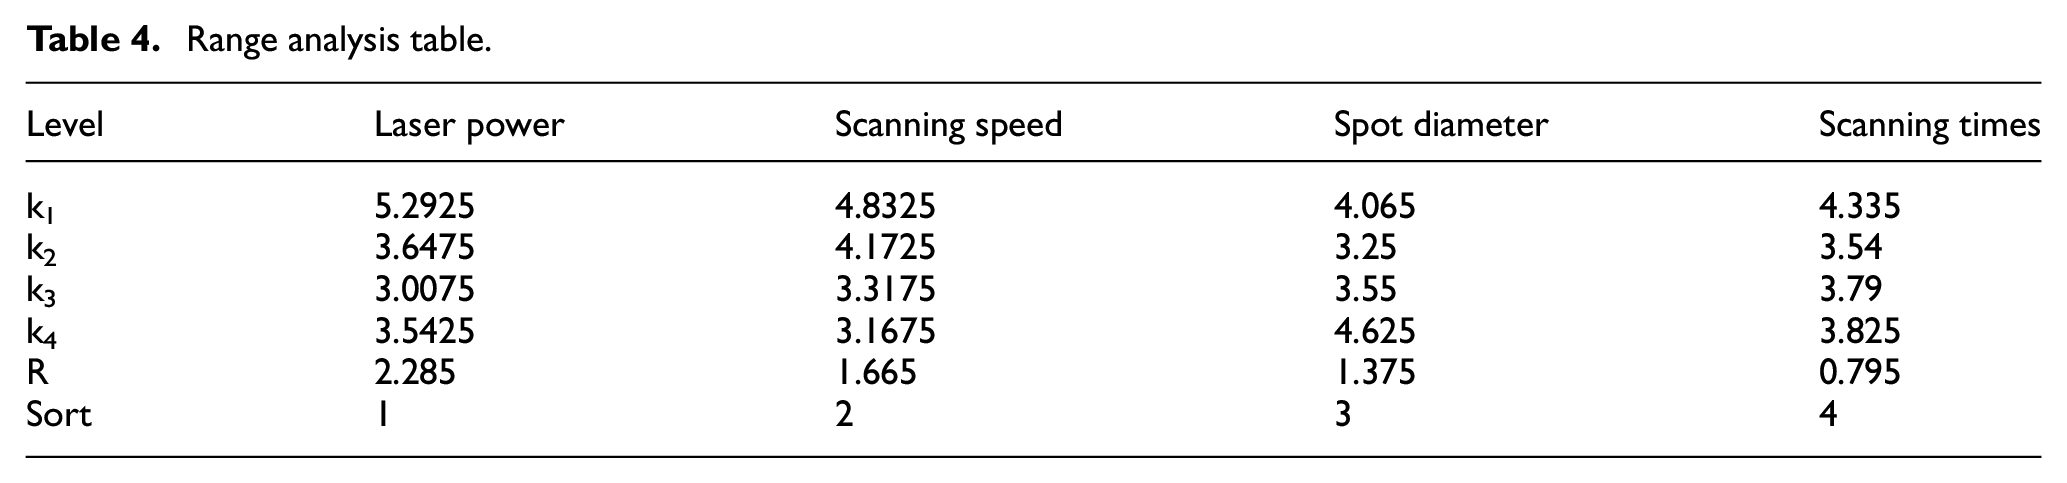
According to the range analysis table as shown in Table 4, the order of influence on the micro-textured structure is: laser power > scanning speed > spot diameter > scanning times. According to the index-factor shown in Figure 3, it can be seen that as the laser power increases, the error value first decreases and then increases due to the reflection of the laser light on the material surface. The increase of the scanning speed will reduce the error, because the decrease of the scanning speed will lead to the increase of the spot coincidence. The error first decreases and then increases with the increase of the spot diameter. As the spot diameter increases, the laser energy will decrease and the amount of ablation will decrease accordingly. The actual micro-textured diameter will be further smaller than the target diameter. Taking the minimum error as the criterion, 7 the best parameter combination is obtained: laser power P = 40 W, scanning speed V = 1700 mm/s, scanning times N = 7, spot diameter D = 40 μm.
Range analysis table.
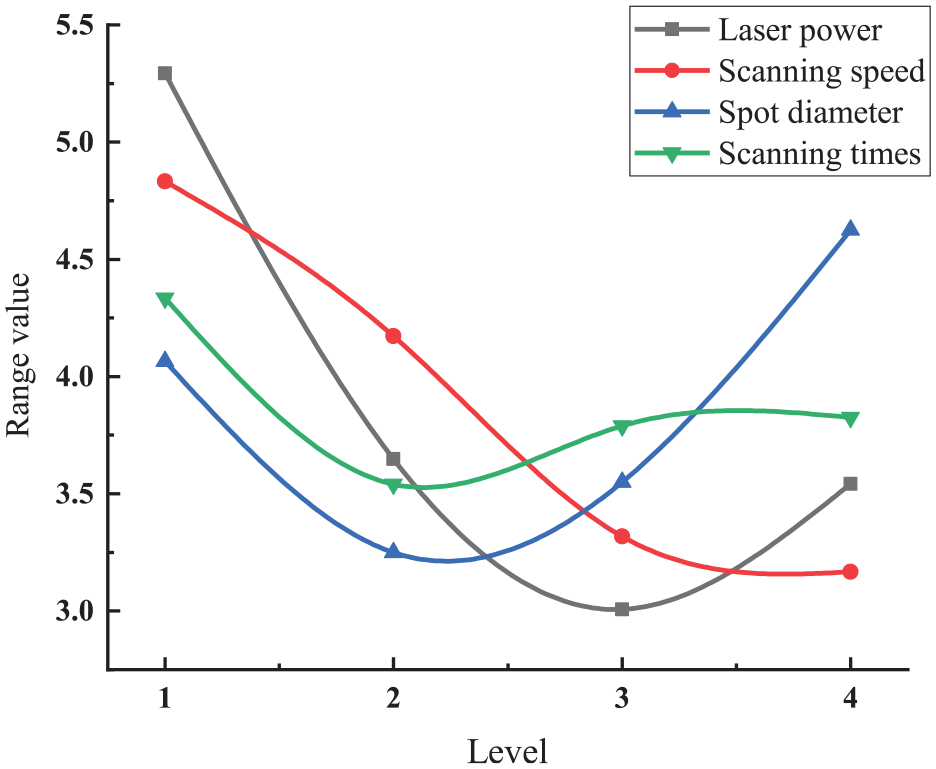
Indicator-factor chart.
Finite element simulation of laser processing technology for surface micro textures
Simulation conditions
In the DM module of Workbench, a cubic geometric model of 100 μm, width 100 μm, and thickness 80 μm is established. The simulation boundary conditions of the temperature field and stress field are set as shown in Figure 4. The simulation data results of the temperature field are used to generate cloud images. The stress field uses the Transient Thermal module for transient thermal analysis.8,9
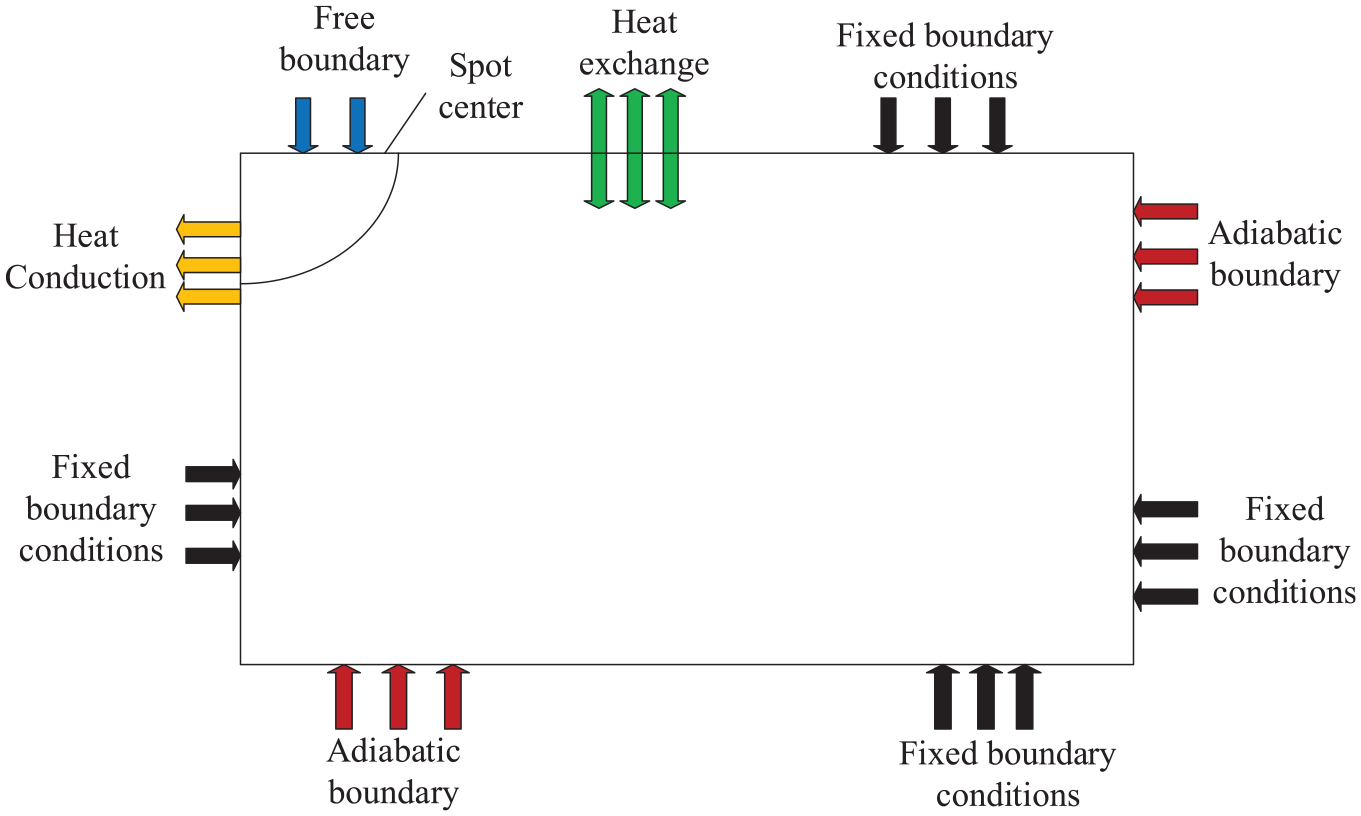
Schematic diagram of boundary condition setting.
Simulation result analysis
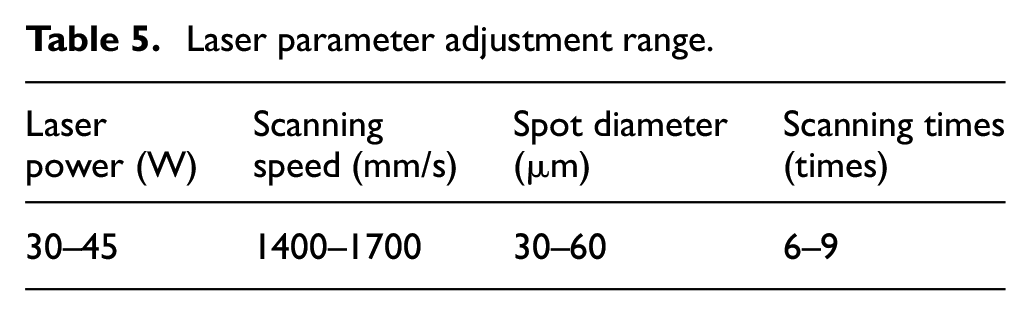
The single-factor simulation experiment is set to determine the range of laser process parameters in Table 5. In addition, set the convection coefficient to 25 and the ambient temperature to 22°C.
Laser parameter adjustment range.
The influence of laser power on equivalent stress field
Take the laser scanning speed as 1700 mm/s, the scanning times as 7 times, the laser spot diameter as 40 μm, and the laser power as 30, 35, 40, and 45 W to get the temperature field cloud picture as shown in Figure 5. Figure 6 is a broken line diagram of the relationship between erosion area and laser power in the X-Z plane. It can be seen that the erosion area increases with the increase of laser power, because when the laser power increases, the laser heat flux per unit time increases, the central area of the spot can absorb more laser energy, and the range of energy diffusion inside the material increases due to the existence of heat conduction, which leads to an increase in the area of the material to be ablated.
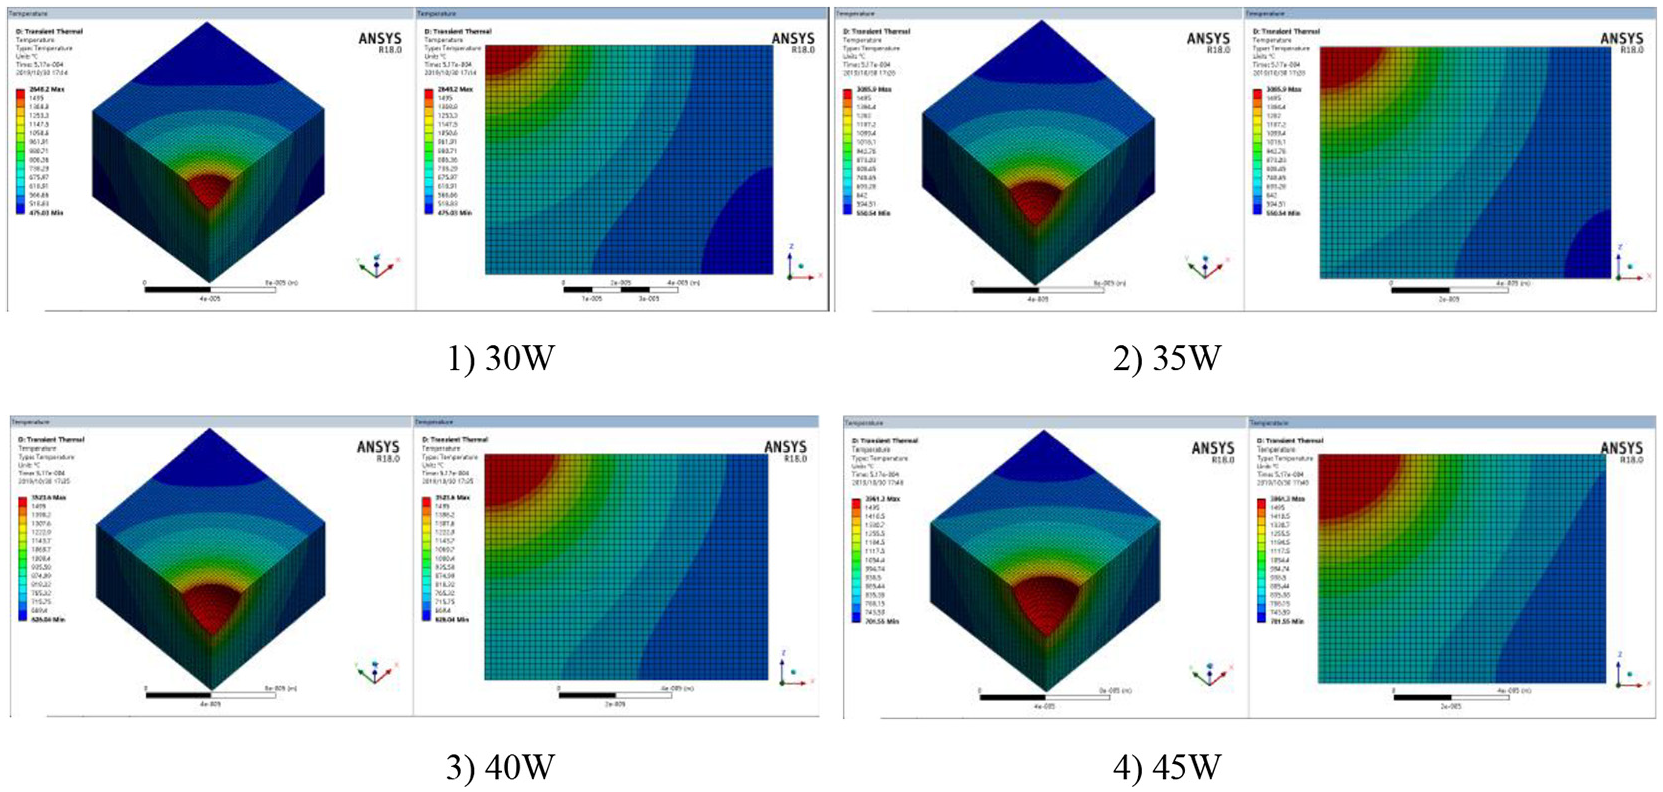
Cloud chart of temperature field.
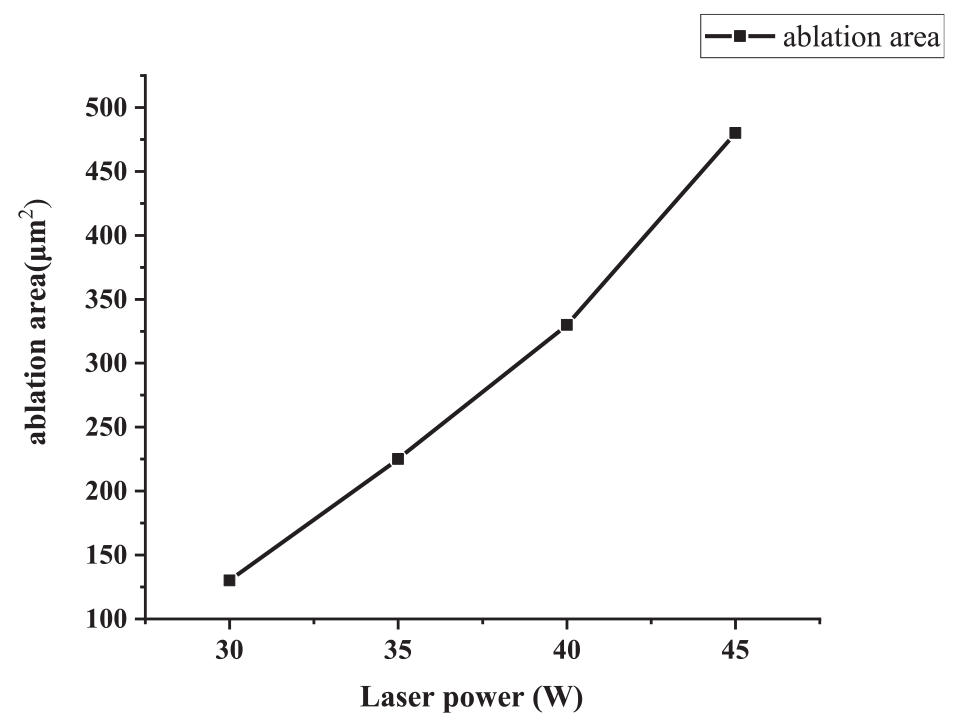
Relation curve between eroded area and laser power.
The obtained temperature field is used as the load to carry out the simulation calculation of the equivalent stress, and the stress cloud diagram is shown in Figure 7. It can be seen from the figure that as the laser power increases, the area affected by the stress of the material becomes larger. Because the increase in laser power can transmit more energy to the surface of the material, it can absorb more energy in the same time. Due to the heat conduction and stress wave inside the material, the material is affected by stress.
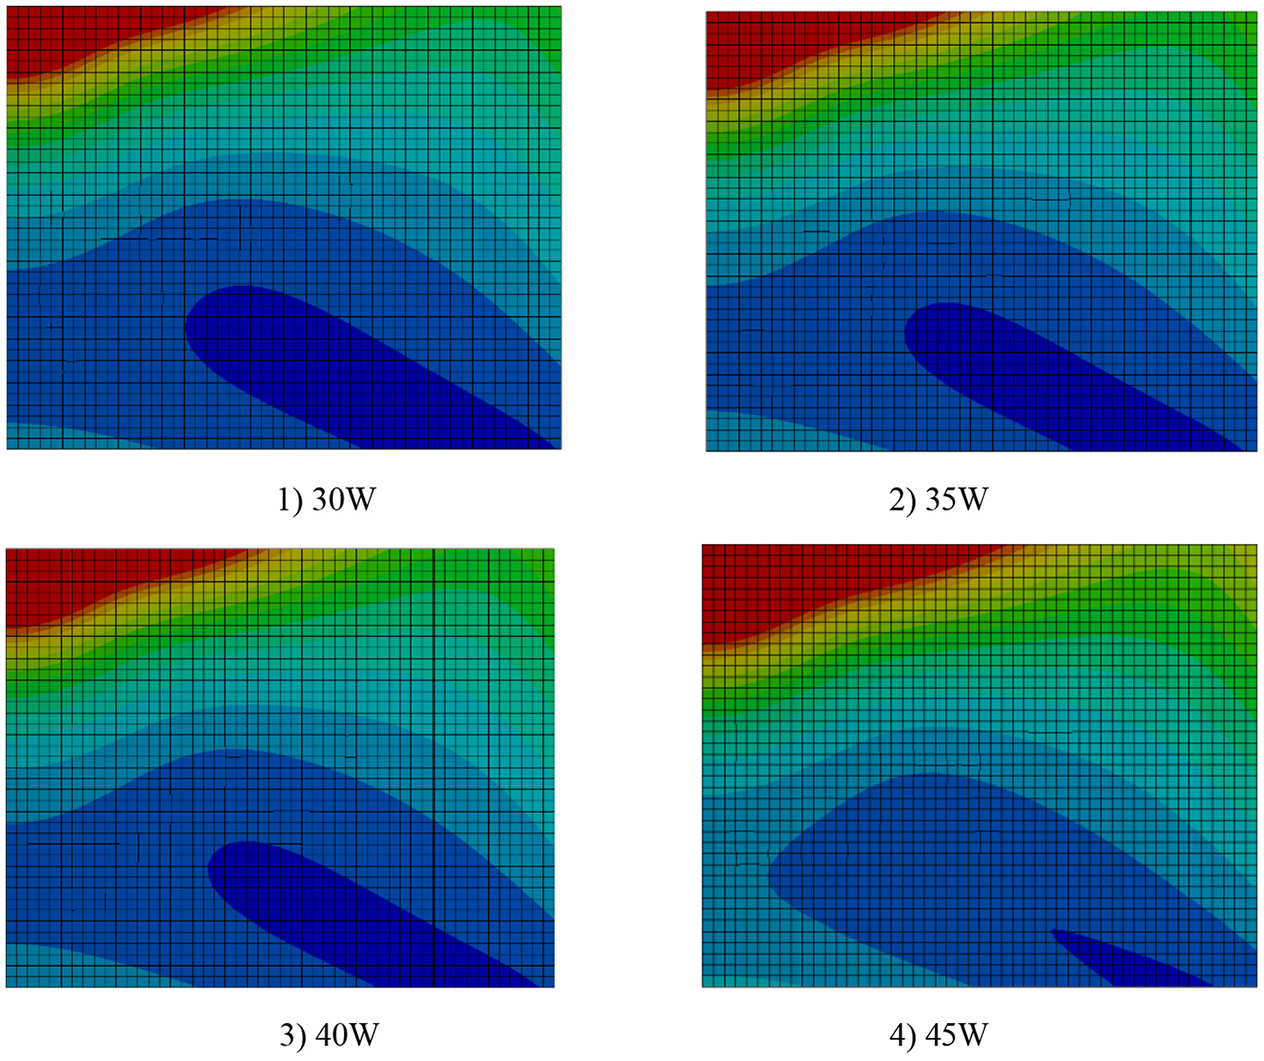
Cloud chart of stress field.
The effect of scanning speed on equivalent stress field
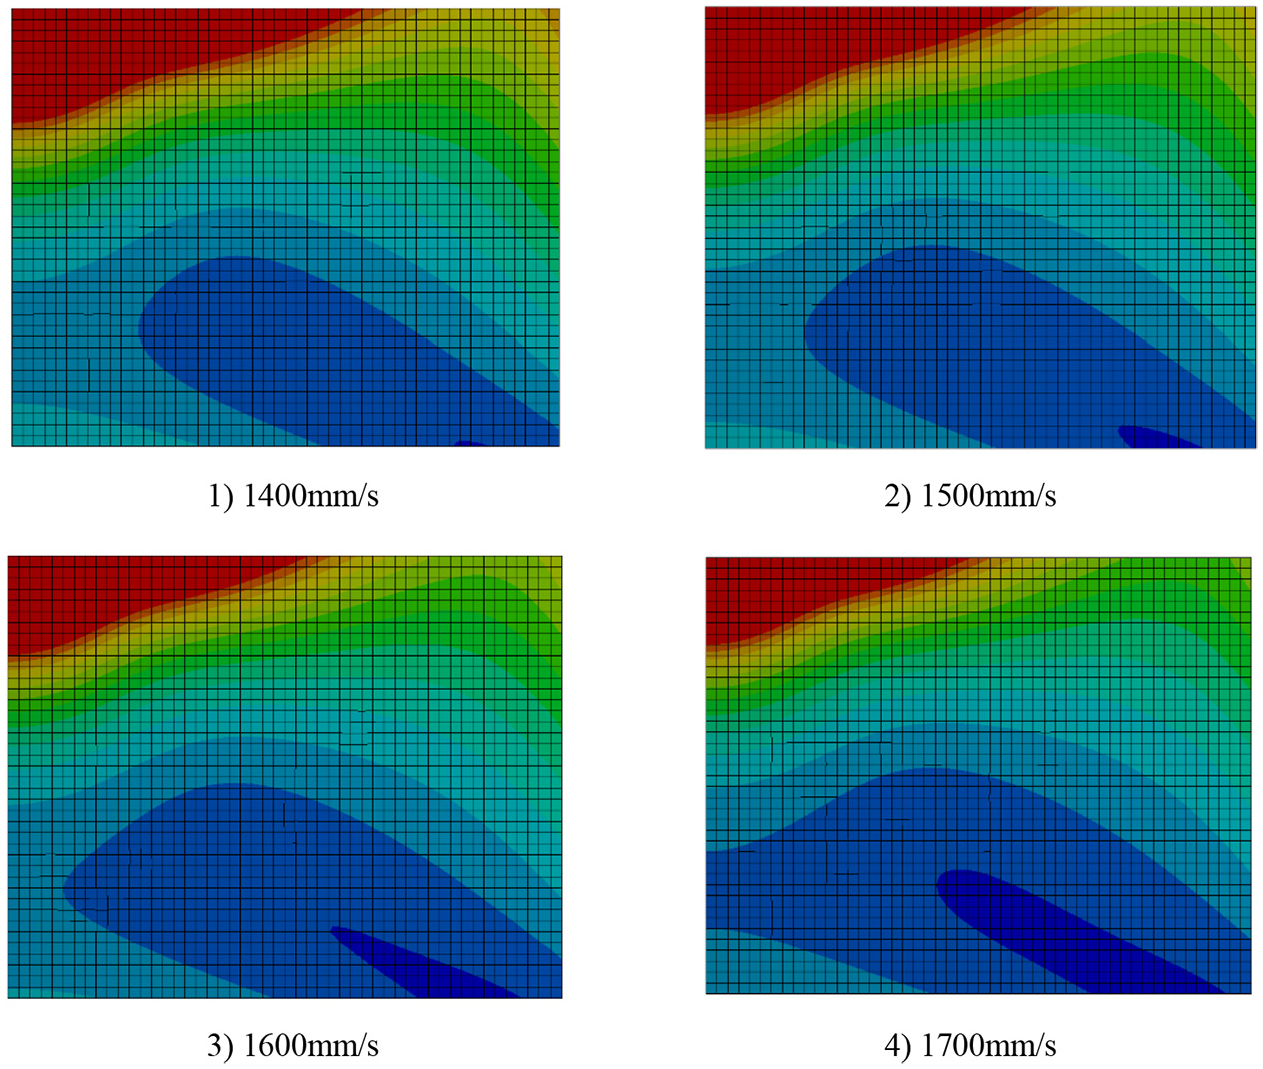
Take the laser power as 40 W, the scanning times as 7 times, the spot diameter as 40 μm, and the scanning speeds as 1400, 1500, 1600, 1700 mm/s to get the temperature field cloud picture as shown in Figure 8. Figure 9 is a broken line diagram of the relationship between the erosion area in the X-Z plane and the laser scanning speed. It can be seen that the erosion area decreases with the increase of the scanning speed, because under other conditions unchanged, the increase of the scanning speed will cause the time for the laser to act on the spot area reduced, so that the surface of the material can absorb less energy, and the temperature inside the material drops, which ultimately leads to a smaller erosion area.
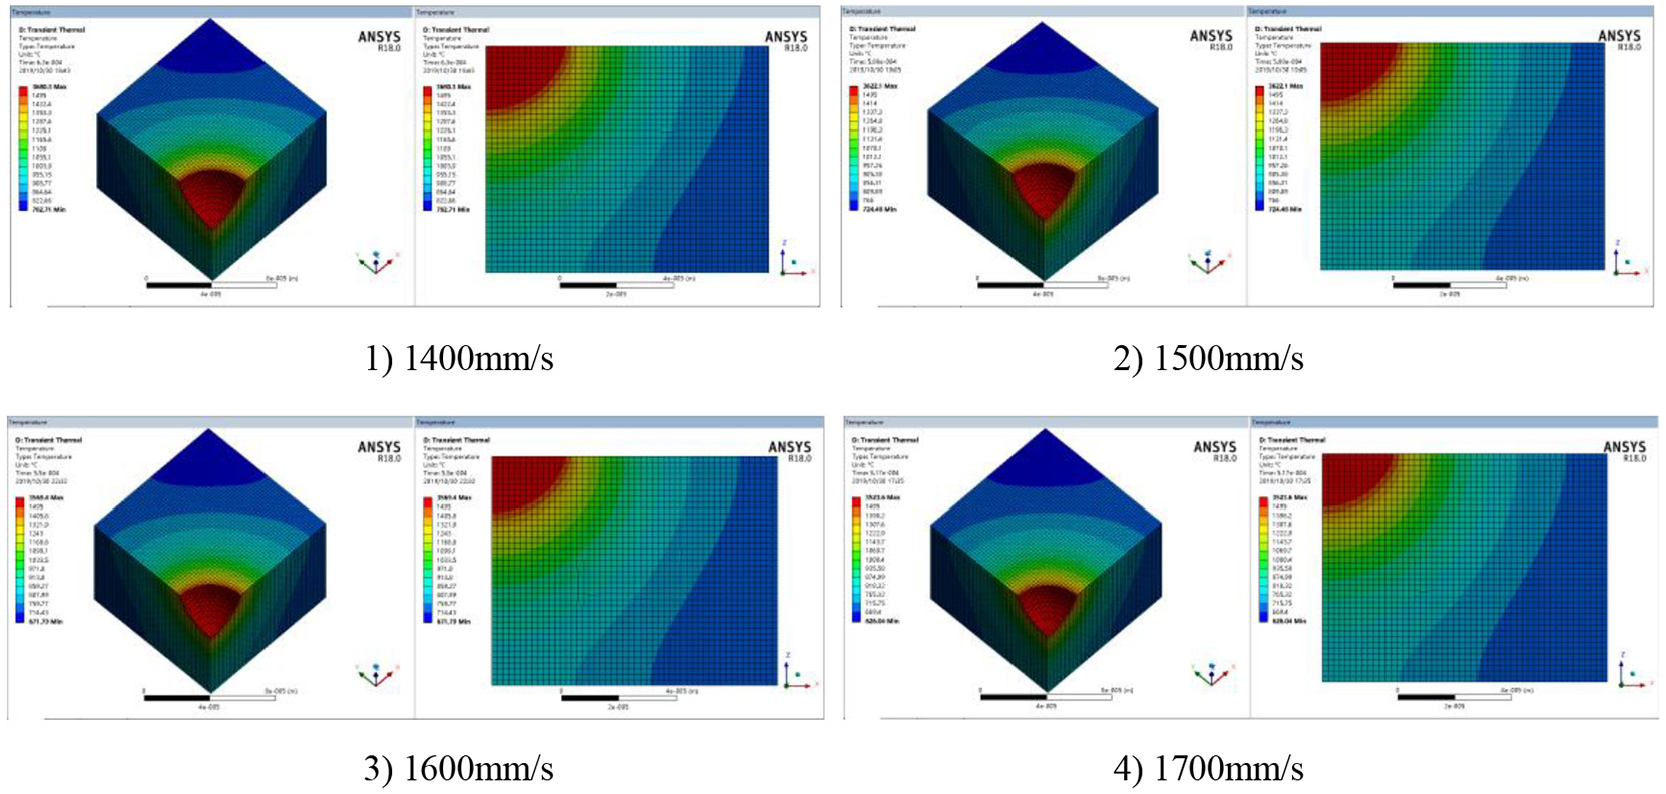
Cloud chart of temperature field.
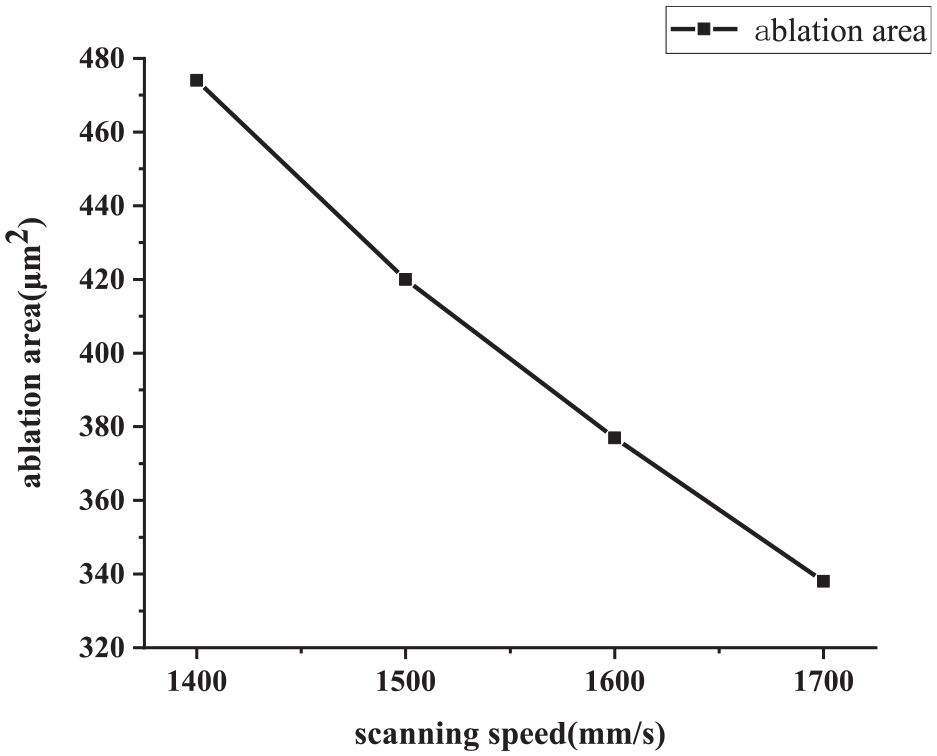
Relation curve between eroded area and laser scanning speed.
With the same operation, the stress cloud diagram is shown in Figure 10. It can be seen from the figure that as the scanning speed increases, the range of materials affected by stress decreases. Because as the scanning speed increases, the time the laser acts on a unit area becomes shorter, and the energy that the material surface can absorb decreases, resulting in a smaller stress value corresponding to the same area on the material surface and a reduction in the range of stress affected.
Cloud chart of stress field.
The effect of spot diameter on equivalent stress field
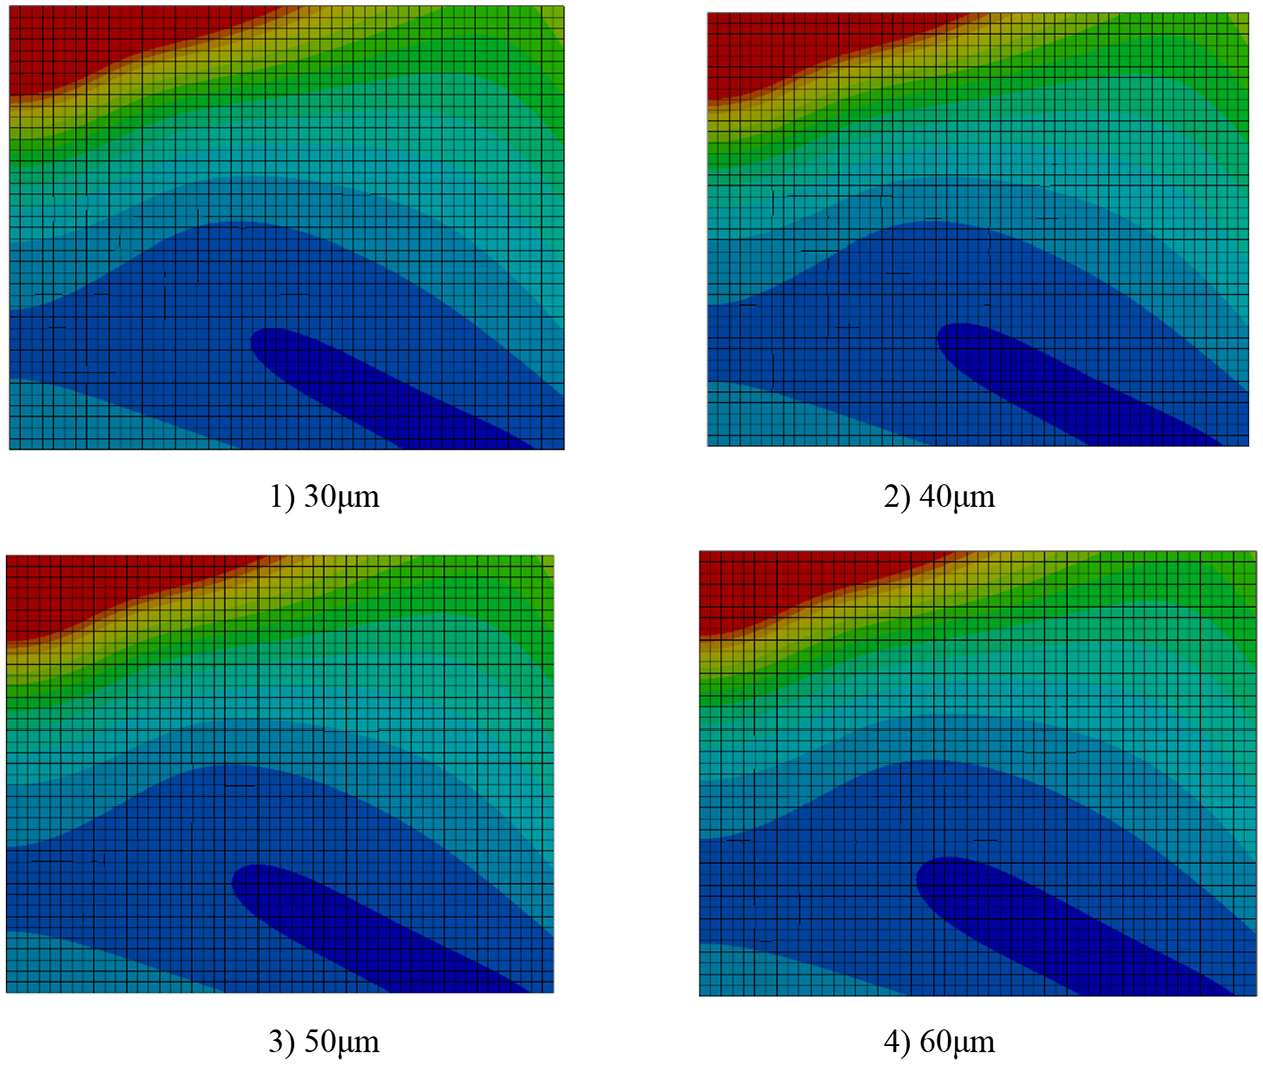
Take the laser power as 40 W, the scanning times as 7 times, the scanning speed as 1700 mm/s, and the spot diameter as 30, 40, 50, and 60 μm to get the temperature field cloud picture as shown in Figure 11. Figure 12 is a broken line graph of the relationship between the erosion area and the spot diameter in the X-Z plane. It can be seen that the erosion area decreases with the increase of the spot diameter. This is because the increase in the spot diameter will decrease under the condition of a certain laser power. The laser power distribution at the laser focus plane, that is, the surface of the material, will reduce the energy that can be absorbed by each area of the material, and the area of material erosion will then decrease.
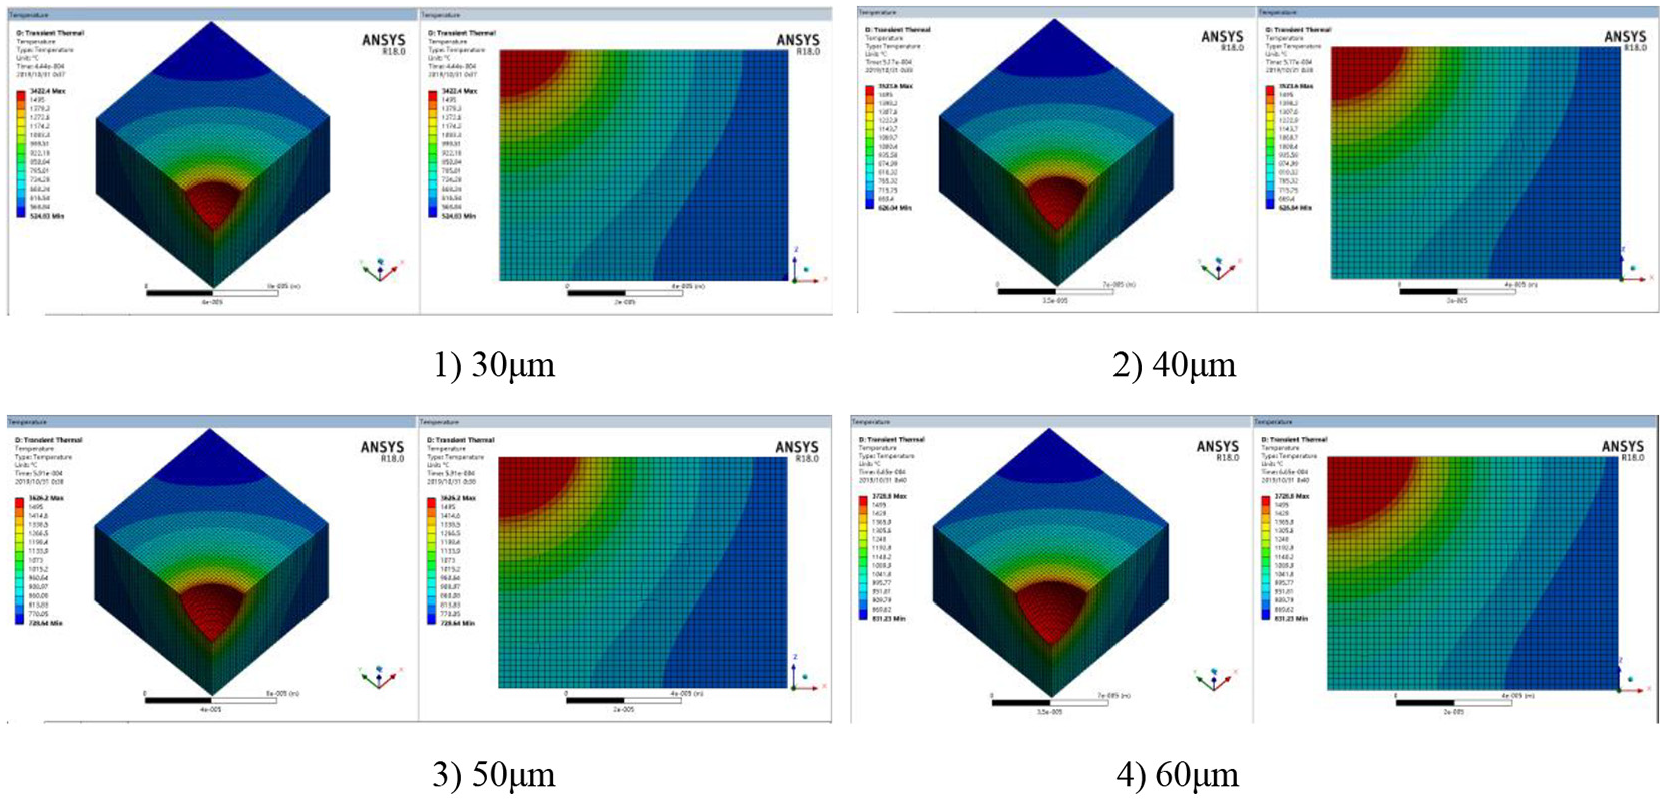
Cloud chart of temperature field.
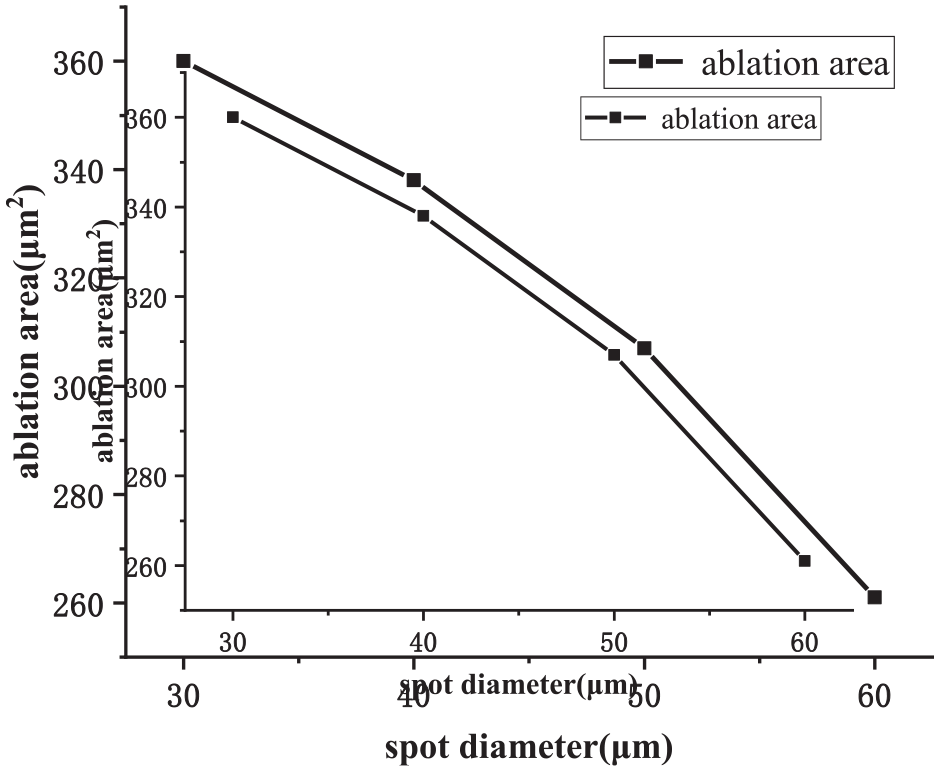
Relation curve between eroded area and diameter of laser spot.
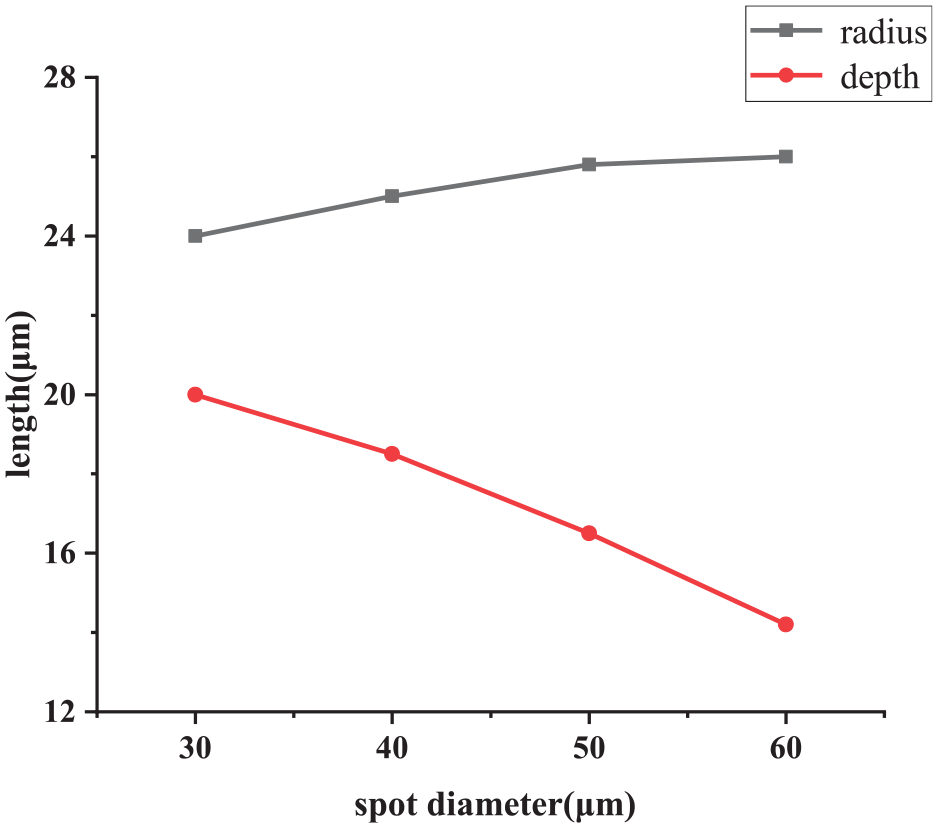
Figure 13 is a broken line graph of the relationship between the radius and depth of the erosion area and the spot diameter. It can be seen that the radius of the erosion area increases with the increase of the spot diameter, and the increase of the spot diameter results in the micro textures in the depth. Decrease in the direction, because the increase in the spot diameter leads to an increase in the energy-absorbing area, but because the increase in the spot diameter will reduce the laser energy, there is no direct energy reception in the depth direction, so the depth of the erosion area will decrease accordingly.
Relation curve between maximum and minimum temperature of material surface and diameter of laser spot.
With the same operation, the stress cloud diagram is shown in Figure 14. It can be seen from the figure that the increase of the spot diameter has little effect on the material stress range. Compared with the temperature field distribution characteristics under the same conditions, although the material surface will have a large temperature difference under different spot diameters, the difference in the range of stress on the material surface is small. Because under the same other conditions, as the spot diameter increases, the time to act on a unit area of the material surface will increase, so the stress influence range is basically the same.
Cloud chart of stress field.
The influence of scanning times on equivalent stress field
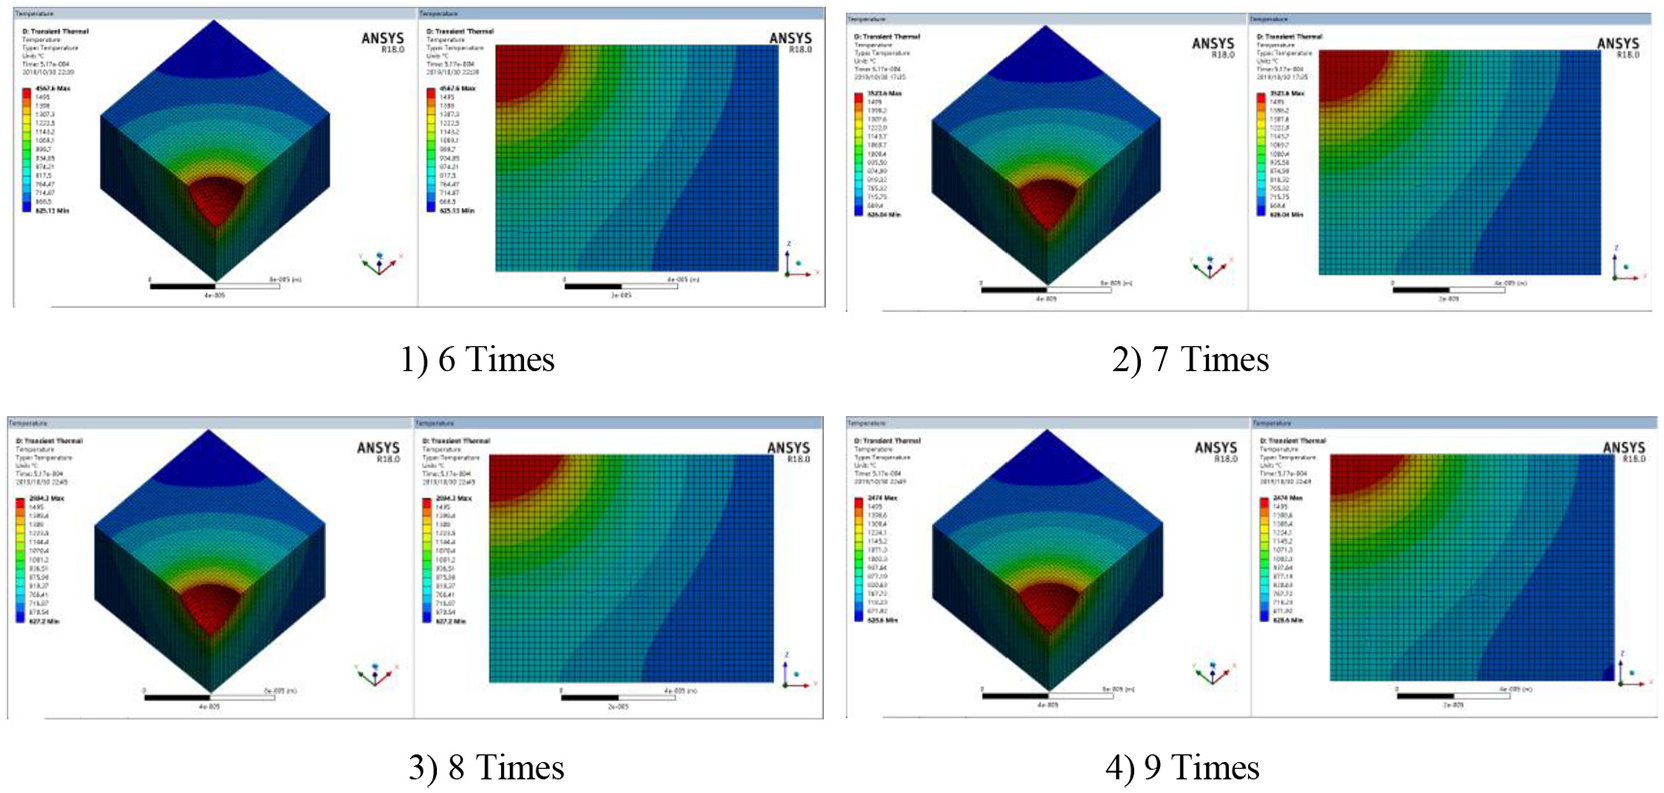
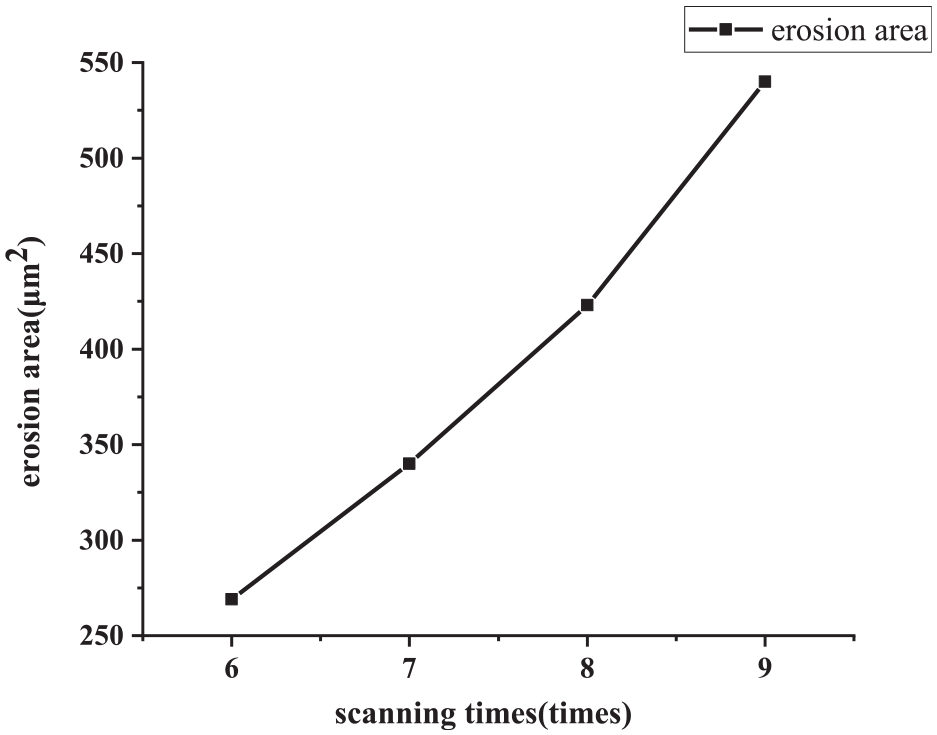
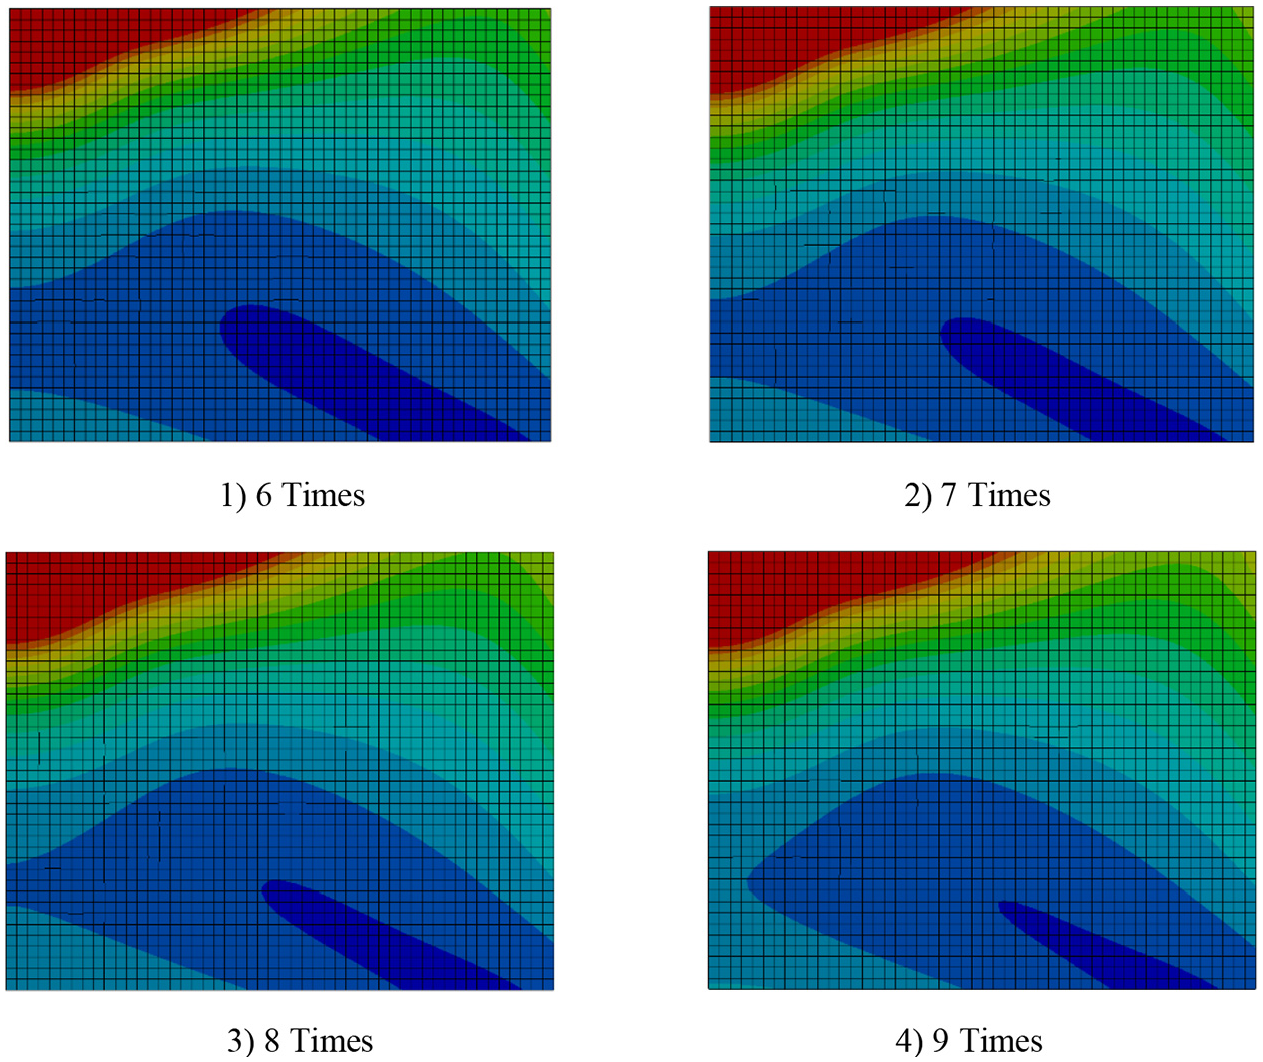
Take the laser power as 40 W, the spot diameter as 40 μm, the scanning speed as 1700 mm/s, and the scanning times as 6–9 times to get the temperature field cloud picture as shown in Figure 15. Figure 16 is a line graph of the relationship between the erosion area and the scanning times in the X-Z plane. An increase in the scanning times will result in an increase in the area of the erosion, because under other conditions the increase in the scanning times can make the surface of the material absorb more. Therefore, more heat is fully conducted inside the material, resulting in an increase in the material reaching the erosion temperature, thereby increasing the erosion area.
Cloud chart of temperature field.
Relation curve between eroded area and number of laser scans.
With the same operation, the stress cloud diagram is shown in Figure 17. It can be seen from the figure that as scanning times increases, the range of stress affected by the material becomes larger. The reason is that the scanning times increases. The increase means that the laser impacting times on the surface of the material increases, which will lead to an increase in laser energy impact, and the internal heat conduction and stress wave effect of the material will cause the material to be affected by stress.
Cloud chart of stress field.
Interaction experiment of micro-textured parameters and cutting edge parameters
Test conditions
The testing tool uses an indexable ball-end milling insert. The ball-end milling cutter and its dimensions are shown in Figure 18. Micro textures are prepared on the rake face of the ball-end mill and cleaned. The milling force is measured by a Kistler9257 dynamometer, the milling experiment site is shown in Figure 19 and the milling temperature is measured by an E12-3-K-U fast-response K-type thermocouple as shown in Figure 20.
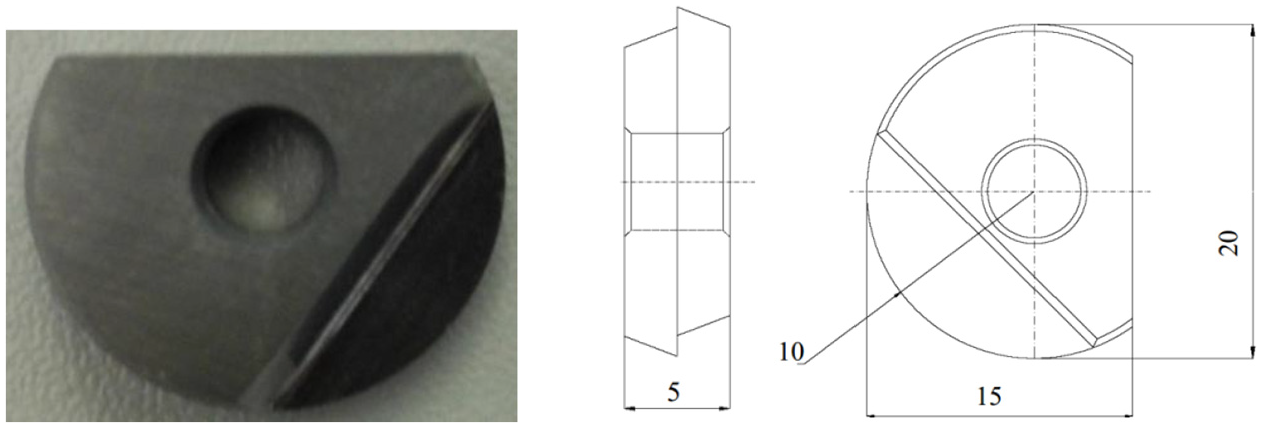
Ball end milling insert and schematic diagram of dimensions.
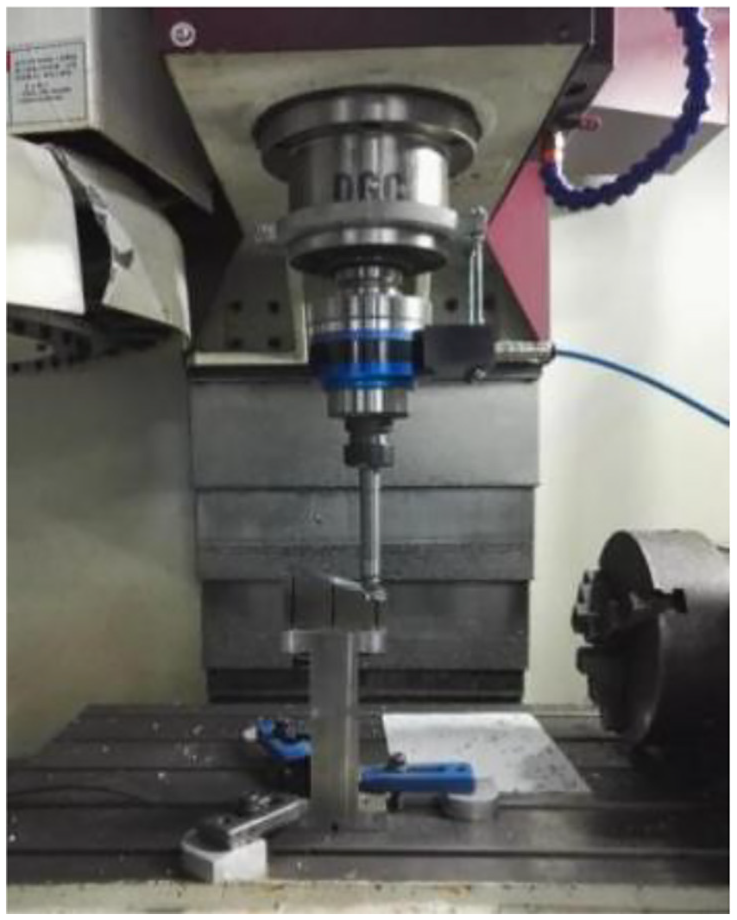
Milling experiment site.
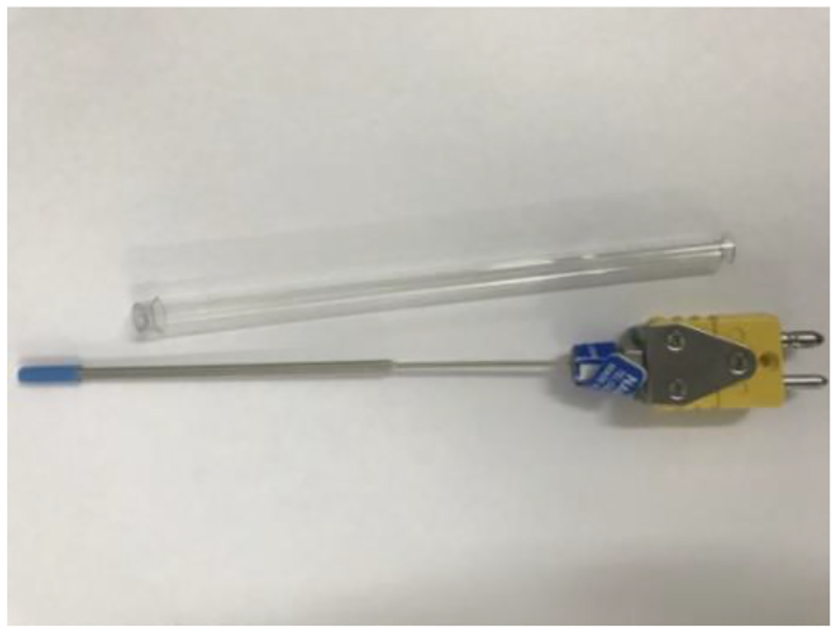
K-type thermocouple.
Cutting test design
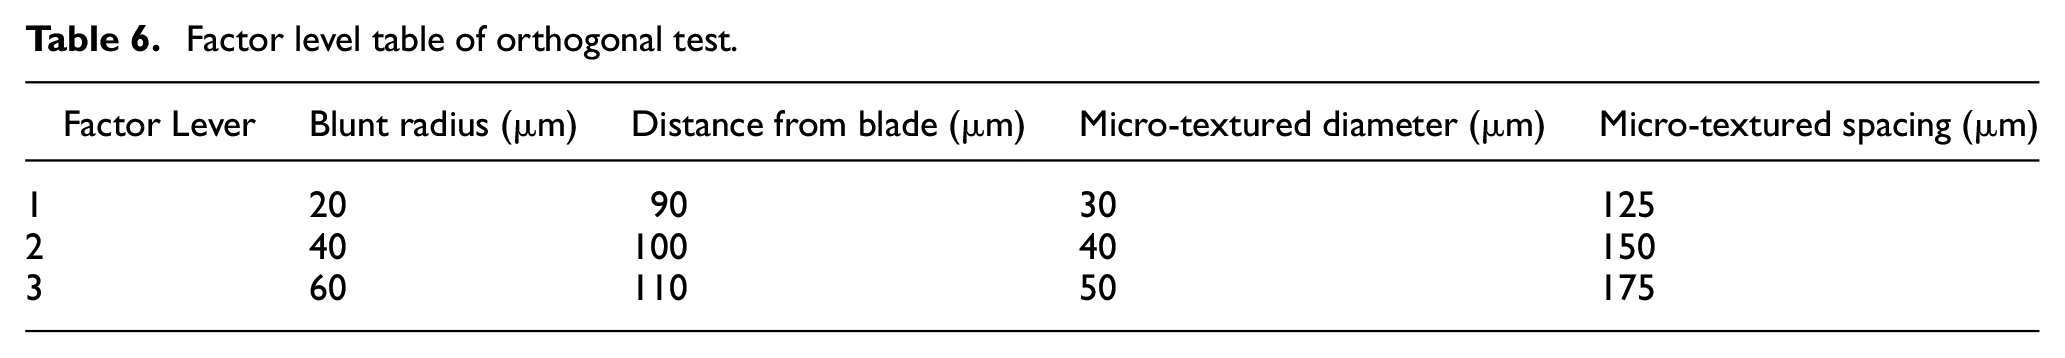
Design an orthogonal experiment with interaction. The factor level table is shown in Table 6. The cutting parameters are selected as: ap = 0.3 mm, f = 0.07 mm/z, vc = 120 m/min.
Factor level table of orthogonal test.
Analysis of interactive test results
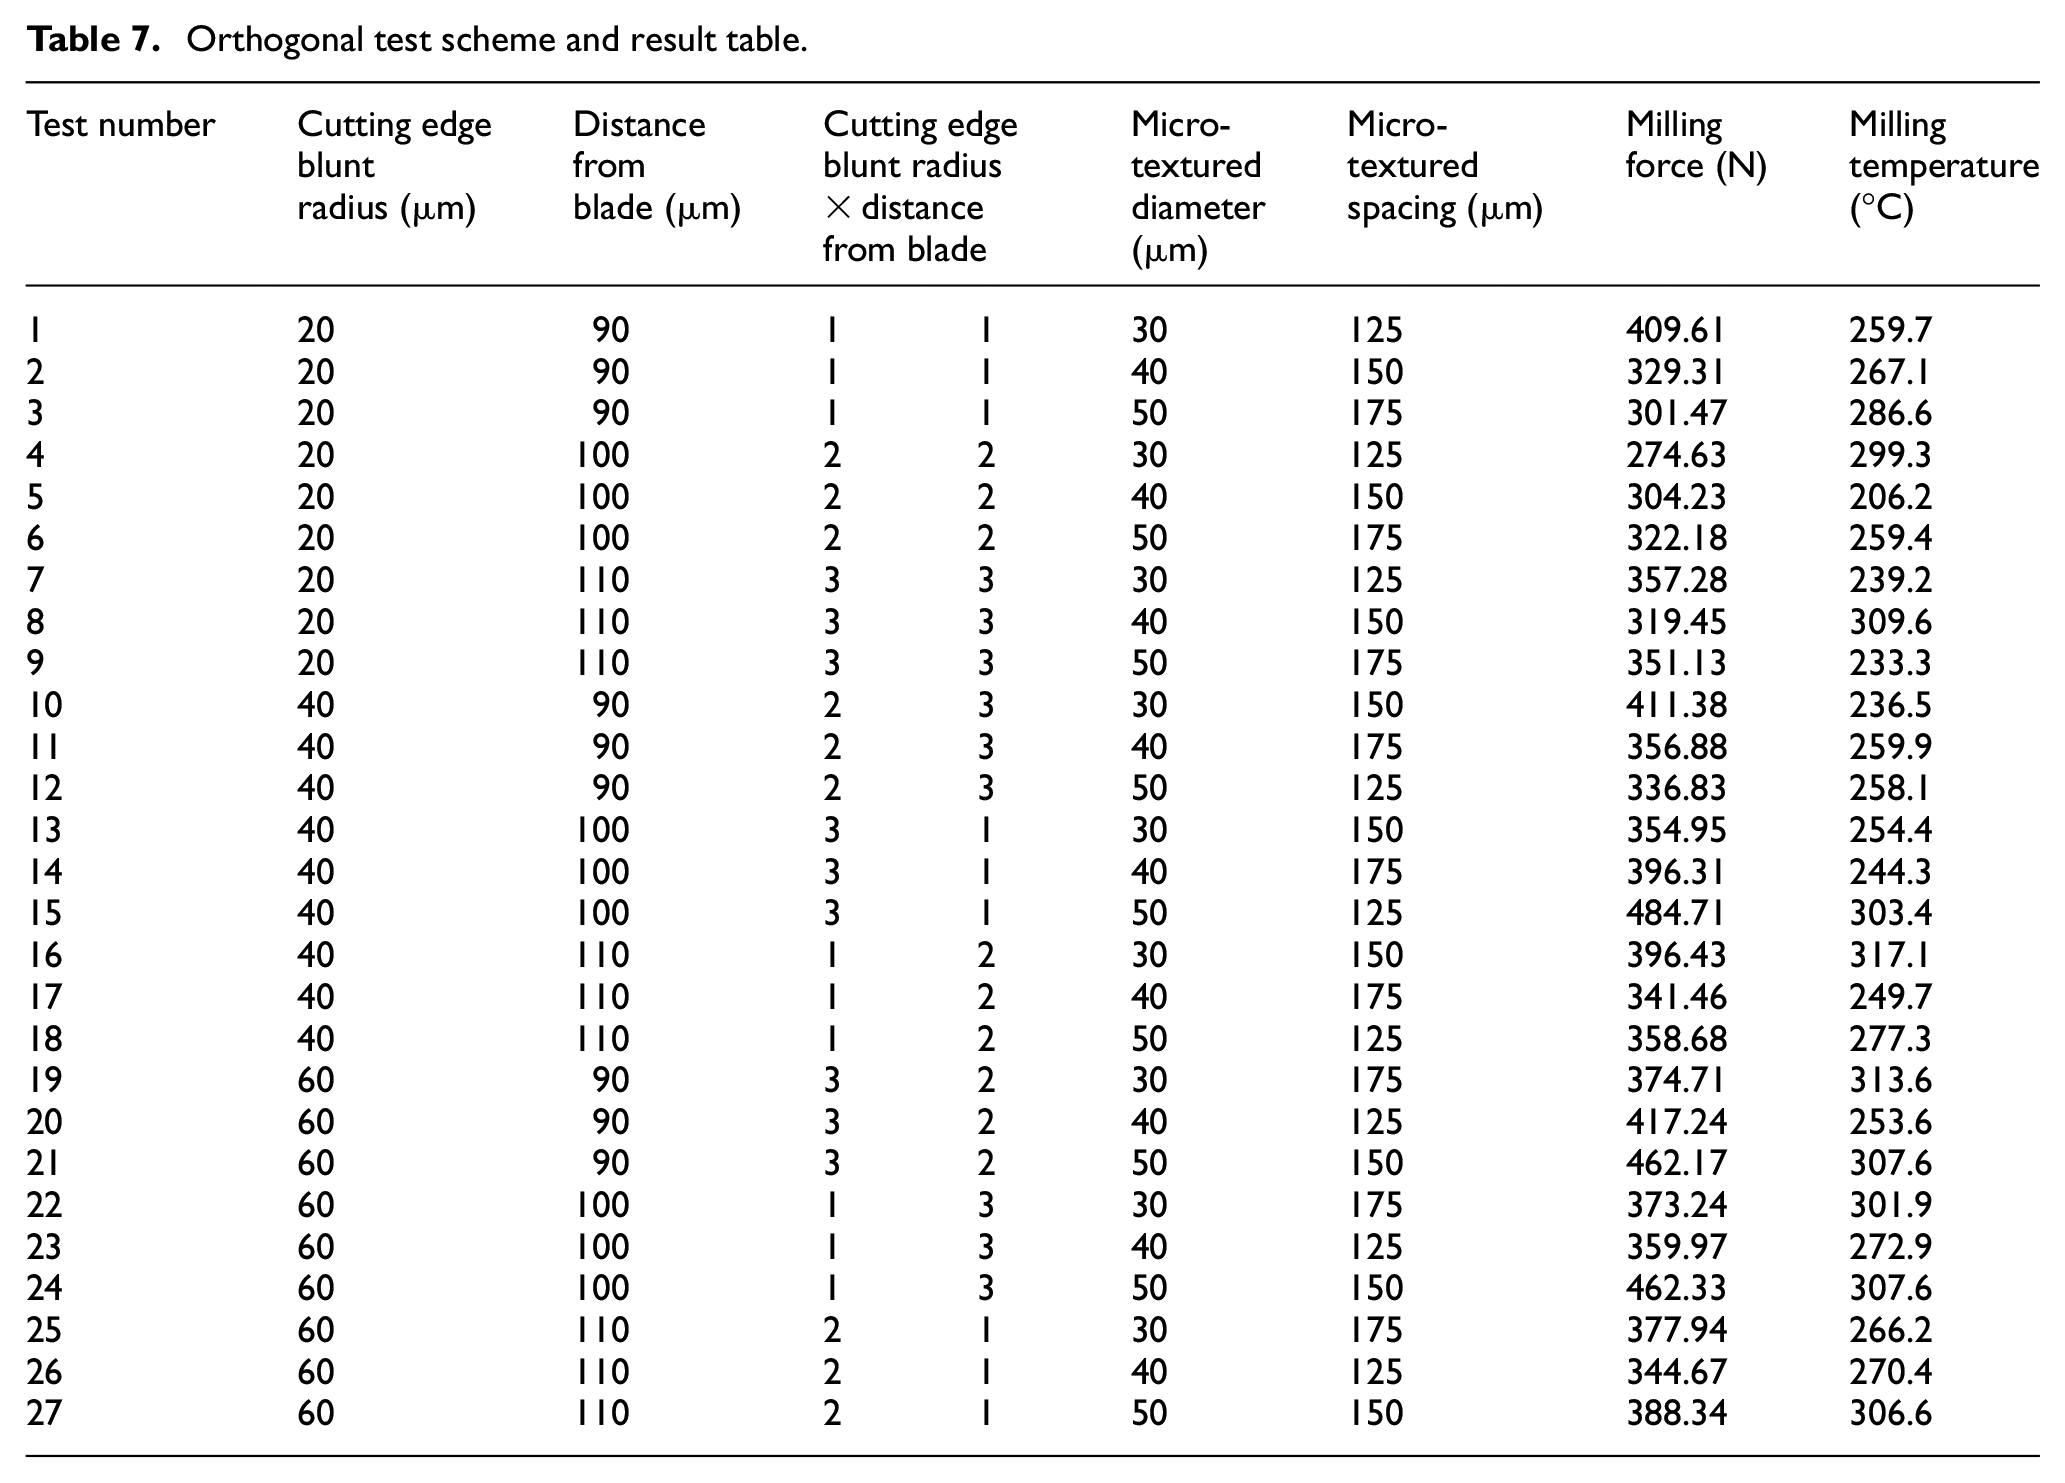
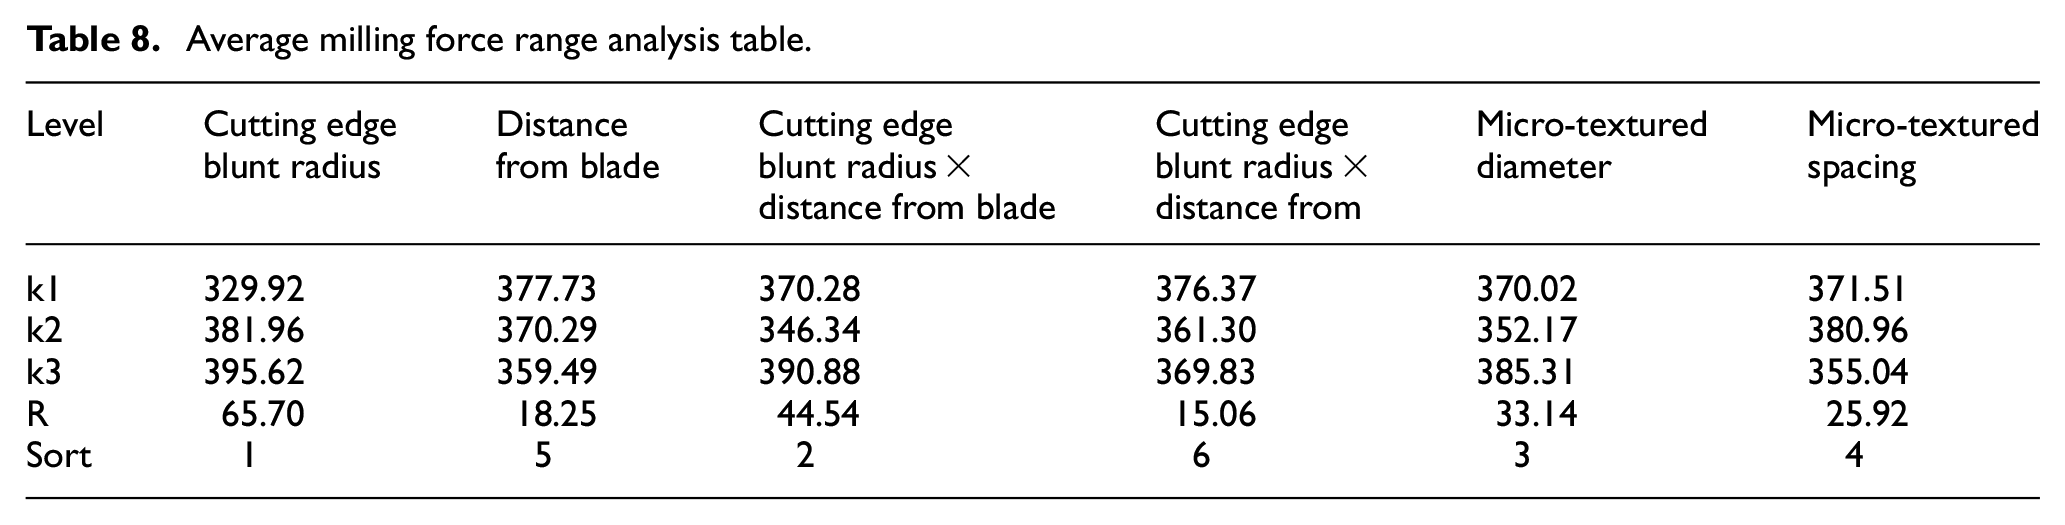
Orthogonal testing plan and the average milling force and milling temperature test results are shown in Table 7. The range analysis table is obtained as shown in Tables 8 and 9. From the table, the primary and secondary order of factors affecting the average milling force can be determined: cutting edge blunt radius > Interaction of cutting edge blunt circle radius and distance from blade > Micro-textured diameter > Micro-textured spacing > Distance from blade. The primary and secondary order of factors affecting the milling temperature is: cutting edge blunt radius > Micro-textured diameter > Interaction of cutting edge blunt circle radius and distance from blade > Micro-textured spacing > Distance from blade.
Orthogonal test scheme and result table.
Average milling force range analysis table.
Milling temperature range analysis table.
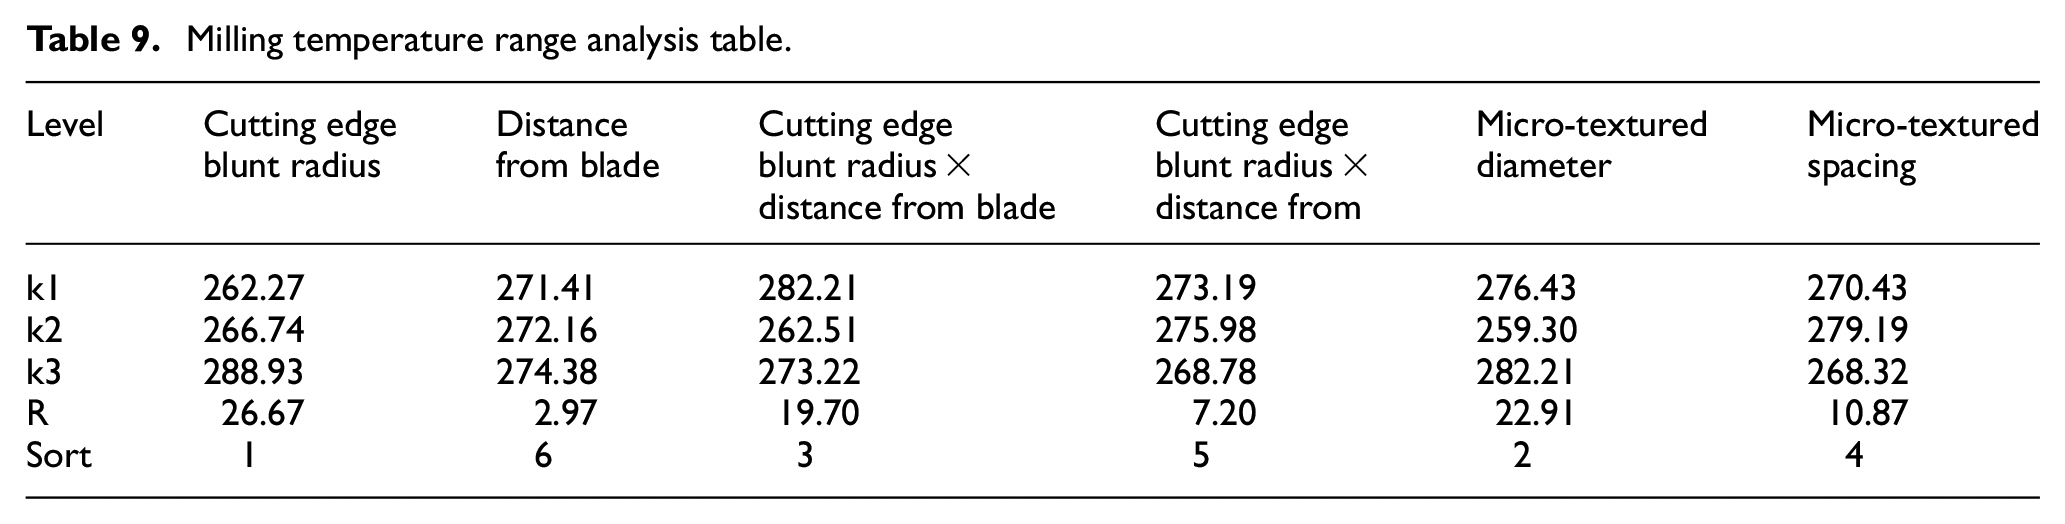
Figure 21 shows the relationship between the micro-textured parameters and blunt edge parameters obtained from the cutting test and the average milling force. It can be seen from the figure that the cutting edge blunt radius, the micro-textured spacing, and the micro-textured diameter have a greater influence on the average milling force. The increase of the cutting edge blunt radius causes the negative rake angle cutting phenomenon of the ball-end mill. The micro textures can capture abrasive particles and chips, reduce the abrasive wear of the tool, and improve the wear resistance of the tool. The change of micro-textured spacing changes the micro-textured number, which affects the surface roughness of the tool. Changes in these factors ultimately affect the average milling force.
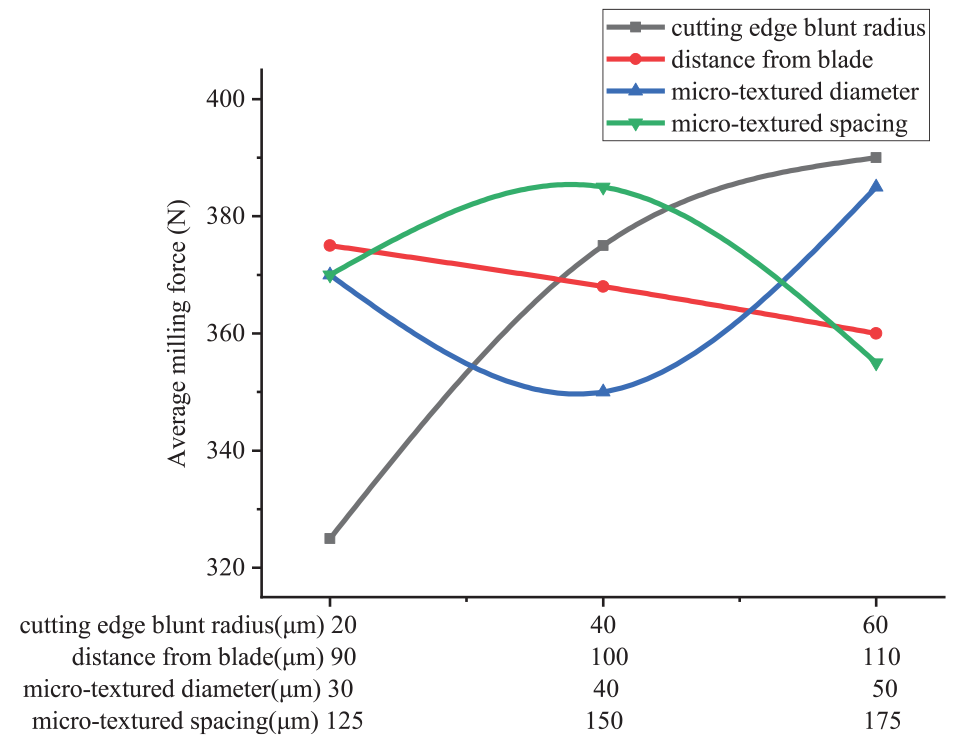
Diagram of the influence of blunt edge and micro texture parameters on milling force.
Figure 22 shows the relationship between the micro-textured parameters and blunt edge parameters obtained from the cutting test and the influence of the milling temperature. It can be seen from the figure that the cutting edge blunt radius, the micro-textured spacing and the micro-textured diameter have a greater influence on the milling temperature. The increase of the cutting edge blunt radius causes the negative rake angle cutting phenomenon of the ball-end mill, which intensifies the friction between the rake face and the chip. The tool-chip contact area and surface roughness will change with the change of the micro-textured diameter and spacing, thereby affecting the milling temperature. The changing law of the milling temperature is close to the milling force, which is because when the milling force decreases during the milling process, the heat generated decreases, and the milling temperature decreases.
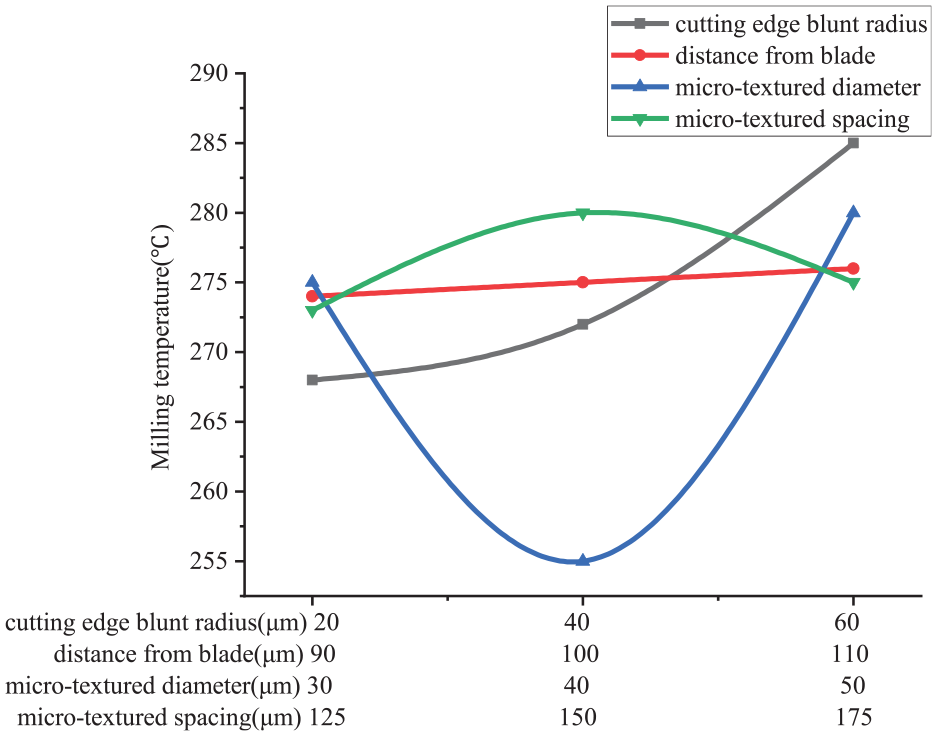
Diagram of the influence of blunt edge and micro texture parameters on milling temperature.
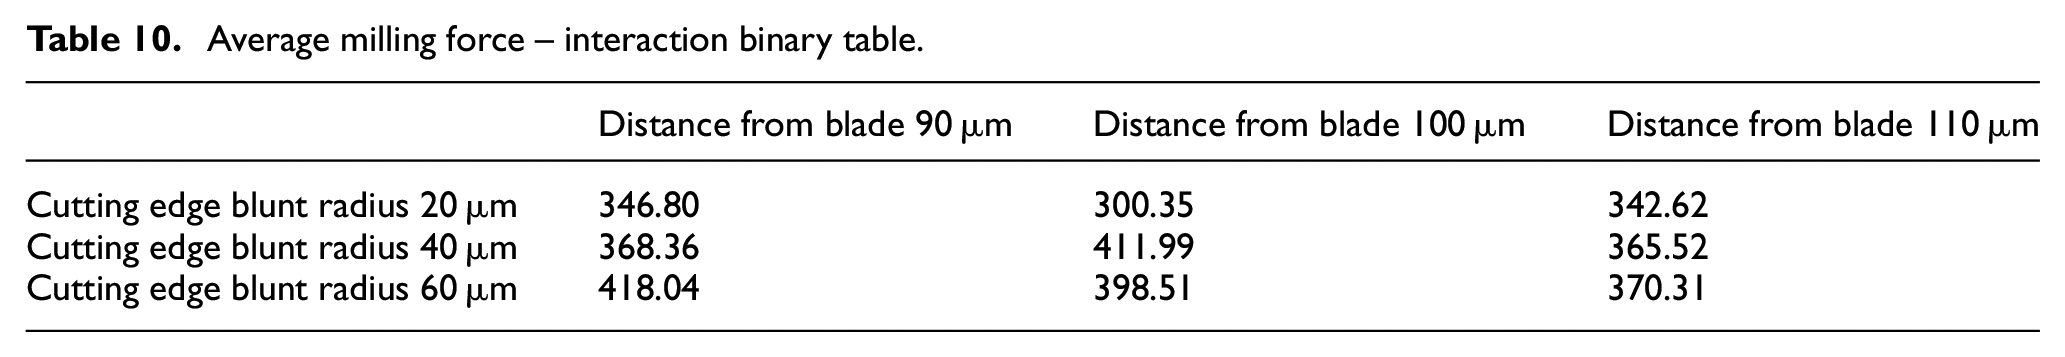
According to the interaction binary table shown in Table 10, draw a binary diagram of the influence of the interaction between the cutting edge blunt radius and the distance from blade on the average milling force as shown in Figure 23. It can be obtained that when the cutting edge blunt radius is 20 μm, the average milling force is the lowest, because the greater the cutting edge blunt radius, the more severe the tool wear, and the greater the milling force. As shown in Figure 18, the distance from blade has the weakest effect on the average milling force. When the cutting edge blunt radius interacts with the distance from blade, the distance from blade will inhibit the positive effect of the cutting edge blunt radius. This is because the distance from blade is too large and the cutting edge blunt radius is too large, which will inhibit the full play of the anti-wear and anti-friction effects of the micro-texture, resulting in an increase in the average milling force. When the distance from blade is too small and the cutting edge blunt radius is too small, the tool strength will be changed, thereby affecting the average milling force.
Average milling force – interaction binary table.
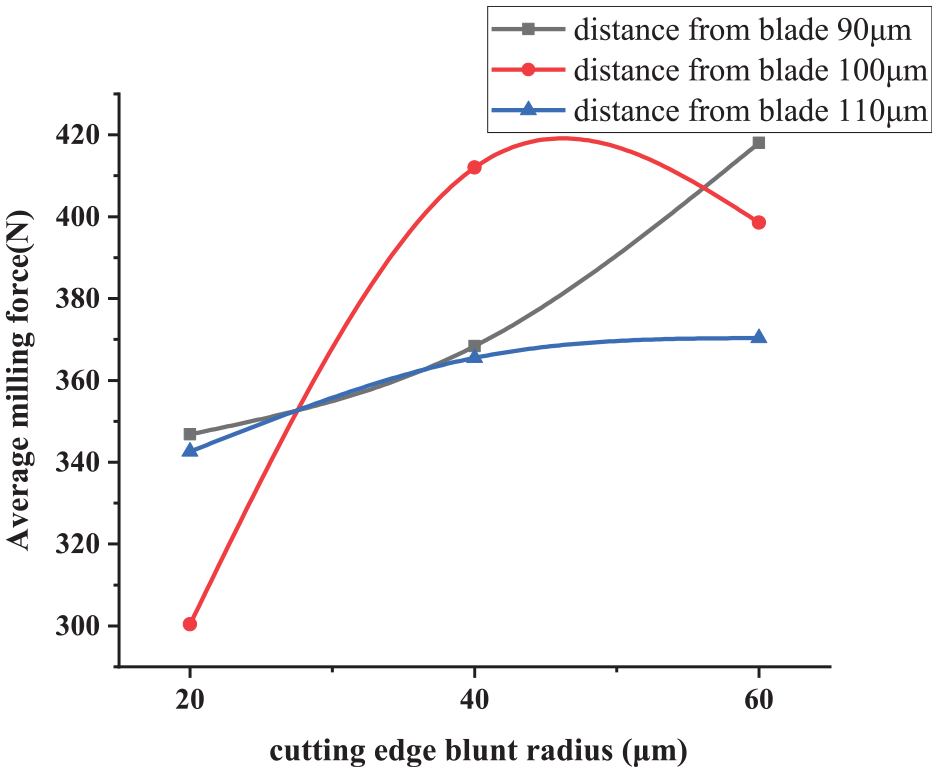
Average milling force – interaction binary diagram.
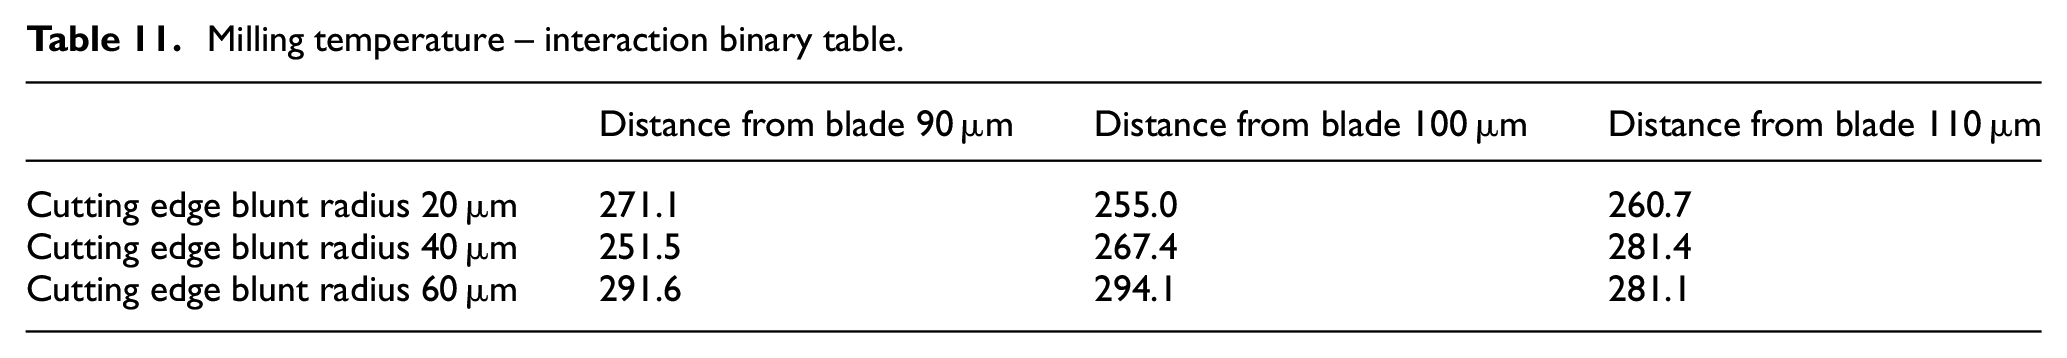
According to the interaction binary table shown in Table 11, draw a binary diagram of the influence of the cutting edge blunt radius and the distance from blade on the milling temperature. as shown in Figure 24. It can be seen that the interaction between the cutting edge blunt radius and the distance from blade has a similar effect on the milling temperature and the milling force. This is because when the milling force is reduced during the milling process, the amount of heat generated is reduced, thereby reducing the milling temperature.
Milling temperature – interaction binary table.
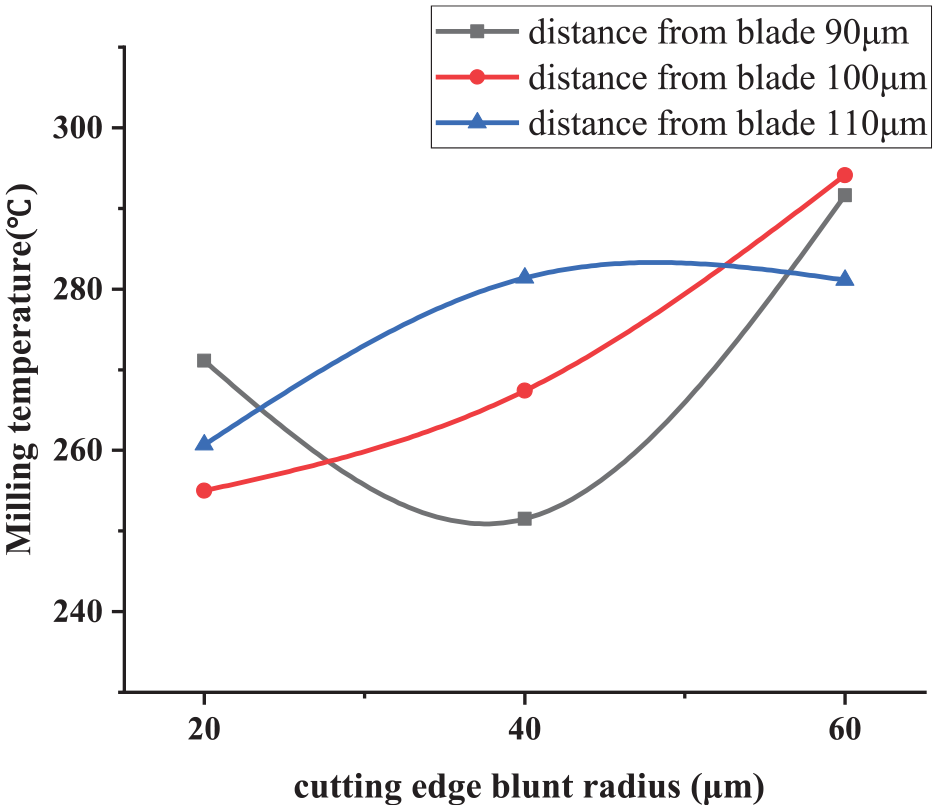
Milling temperature – interaction binary diagram.
Genetic algorithm optimization
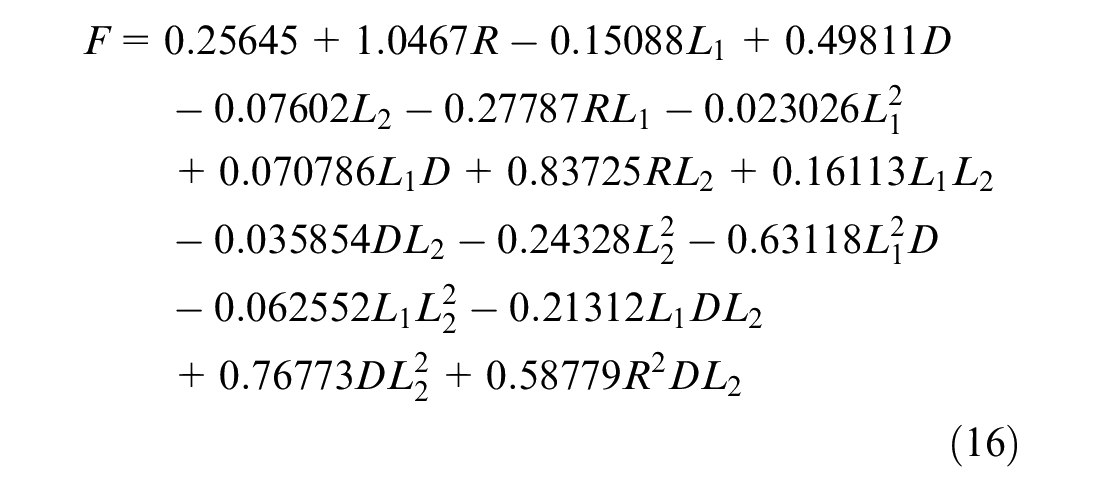
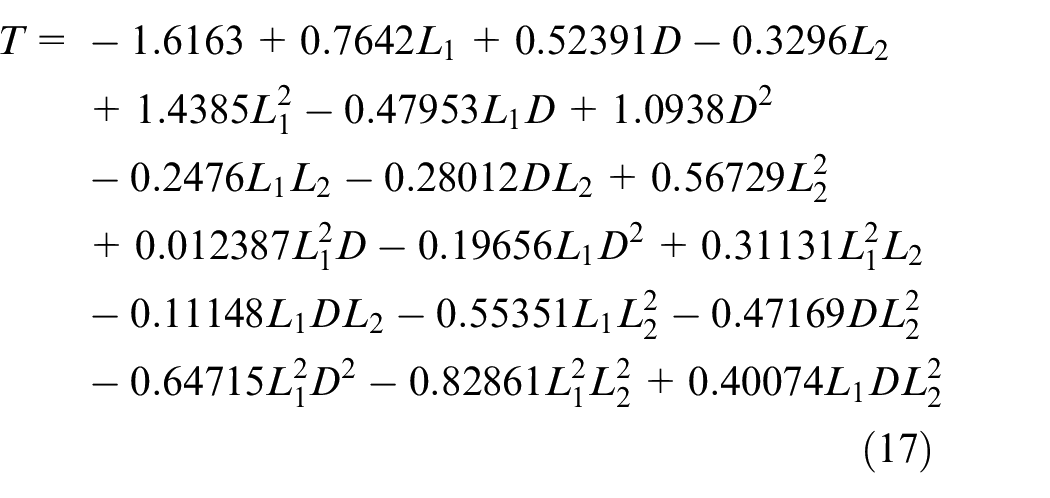
In order to obtain the prediction model of milling force and milling temperature, firstly, the relevant data is standardized, and secondly, based on the fourth-order polynomial regression model, the stepwise regression method is used to establish a cutting edge based on the blunt edge radius R and the distance from blade L1, the micro-textured diameter D and the micro-textured spacing L2, and the final milling force and milling temperature prediction model are:
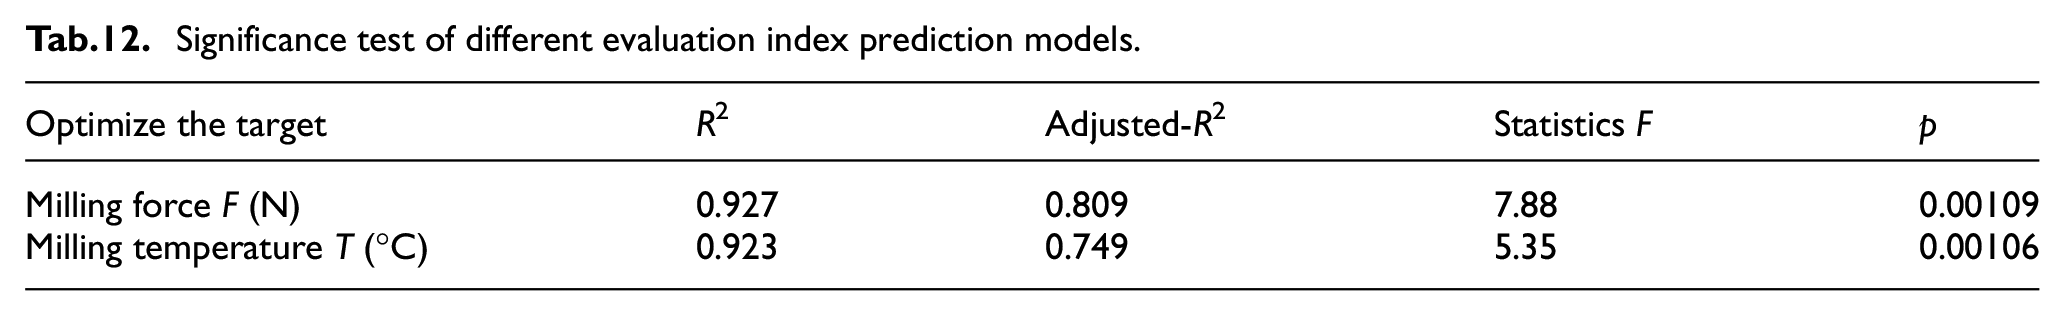
Combining the regression analysis results of MATLAB to test the validity of the predictive models under the two indicators, namely the significance test, the obtained test results are shown in Table 12. The significance test result of the prediction model needs to be combined with the statistics F and p value to determine whether the prediction model is significant. Check the table here, the number of experiments n = 27, the critical value of the test corresponding to the independent variable m = 4 is F0.95(m, n − m − 1) = F0.95(4, 22) = 2.82. When the statistic F is greater than 2.82 and the p value is less than 0.05, it indicates that the prediction model is significant. In summary, it is proved that both prediction models are significant.
Significance test of different evaluation index prediction models.
Under the Linux platform based on the VM virtual machine, C++ is used as the development language to implement the genetic algorithm and set the corresponding genetic algorithm constraints. For the constraints of the genetic algorithm, the population number nPo_Size is selected as 1000, the chromosome crossover probability fOv_Probability is selected as 0.7, the chromosome mutation probability fVa_Probability is selected as 0.001, and the termination condition is the evolutionary algebra Gen = 1000. The following four factors are selected as the characteristics of the genetic algorithm, and the range boundary of the characteristics is:
The constraint condition of the blunt edge radius is: 20 μm ≤ R ≤ 60 μm
The constraint condition of the distance from blade is: 90 μm ≤ L1 ≤ 110 μm
The constraint condition of the micro-textured diameter is: 30 μm ≤ D ≤ 50 μm
The constraint condition of the micro-textured spacing is: 125 μm ≤ L2 ≤ 175 μm
The principle of genetic algorithm is to search for the optimal combination in the solution space and find the parameter combination that can minimize the value of the objective function in the loop.10–12 The resulting parameter value are: the blunt edge radius is 20 μm, and the distance from blade is 110 μm, the micro-textured diameter is 30 μm, and the micro-textured spacing is 175 μm. The Pareto graph of genetic algorithm is shown in Figure 25.
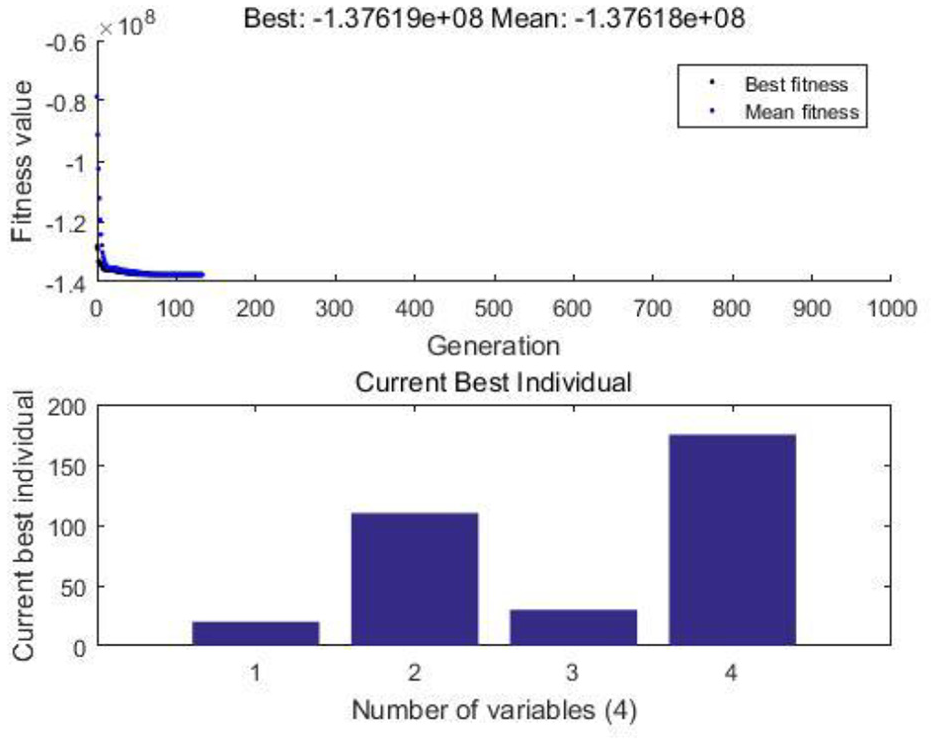
Genetic algorithm Pareto graph.
Conclusion
Based on the temperature distribution equation, the theoretical minimum power of laser processing the surface micro textures of hard alloy YG8 is 18.3 W. Based on the micro-textured processing test on the surface of the cemented carbide specimen, the laser process parameters are optimized: laser power P = 40 W, scanning speed V = 1700 mm/s, scanning times N = 7 times, spot diameter D = 40 μm; analyzing the laser processing process the temperature field and stress field on the surface and inside of the material, verifying the accuracy of the influence of the laser process parameters on the micro-textured size parameters, and providing a theoretical basis for the precise preparation of the micro textures.
A testing platform for milling titanium alloy materials with blunt edge micro-textured ball-end milling cutters is built, and the main factors affecting the cutter force-thermal characteristics is the blunt edge radius, and the interaction between the blunt edge radius and the distance from the blade is obvious. The regression prediction model of milling force and milling temperature is established, and the optimized mesoscopic geometric parameters are: the blunt edge radius is 20 μm, and the distance from blade is 110 μm, the micro-textured diameter is 30 μm, and the micro-textured spacing is 175 μm.
Footnotes
Declaration of conflicting interests
The author(s) declared no potential conflicts of interest with respect to the research, authorship, and/or publication of this article.
Funding
The author(s) disclosed receipt of the following financial support for the research, authorship and/or publication of this article: Thanks to for the support of the National Natural Science Foundation of China (51875144).