
Abstract
Reliable prediction of assembly precision is important for quality control of customized mechanical products characterized by individual customization, small batch size, and multiple varieties, resulting in insufficient samples for predicting assembly performance. A customized mechanical product assembly precision prediction method based on generative adversarial networks and feature transfer learning (GAN-FTL) is proposed in this paper. A GAN is built based on high quality data (source domain) to generate auxiliary samples with high fidelity and large sample size. A support vector machine is used to generate pseudo-tags for auxiliary samples. Features of source domain, target domain and auxiliary samples from different distributions are transferred to the same distribution to achieve multi-source fusion of measured and simulated data using FTL. Data after FTL is used to train the assembly precision prediction model. The elevator guide rail assembly is taken as the case study. T70/B and T90/B guide rail assembly are selected as the source and target domains, respectively. FTL was performed between the source and target domains, with different sample sets for comparison and compared with five different methods. Experimental results show that the prediction accuracy of the target domain is improved when the auxiliary sample size is 300, 400, and 500, and the accuracy improvement of the five methods are 15.37%, 12.17%, 9.68%, 6.29%, and 4.31%, respectively, which verified the effectiveness and usability of the proposed assembly precision prediction method based on GAN-FTL.
Keywords
Introduction
Customized mechanical products have the characteristics of small quantities and multiple varieties, and the assembly precision directly affects the performance and reliability of customized products. 1 Therefore, reliable prediction of assembly precision is essential for product quality control. Traditional product assembly precision testing requires physical prototype trial and actual assembly testing, which has the limitations of uncontrollable accuracy, delayed detection, and high cost. For this reason, many scholars have studied the prediction of product assembly precision based on digital prototypes, which is divided into three main areas: simulation analysis based on digital prototypes, tolerance analysis methods,2,3 and finite element methods.5–11 These methods can predict the assembly precision by building a numerical model of the product. Methods based on tolerance analysis include: statistical12–14 and deterministic15,16 methods.
For mass-produced products, numerical simulations are often performed by using Monte Carlo simulation (MCS) to study the assembly distribution on statistical data. For small quantities of customized products, deterministic approaches are often used to study the worst-case assembly deviations by creating a model of the assembly contact surface for the theoretical analysis of tolerance propagation. Cao et al. 13 proposed a quasi-MCS method based on good point (GP) set. Compared with MCS method, the quasi-random numbers generated by MCS method are replaced by ones generated by the GP method, with less calculation amount and higher precision. Cao et al. 14 proposed a hybrid method of vector loop and quasi-Monte Carlo method for three-dimensional assembly analysis, which was verified in a crank slider mechanical assembly. Asante presented a small displacement torsor model to modeling and analyzing the combined effect of the geometric error, locator geometric error, and clamping error on a machined feature. 17 Kamali Nejad et al. 18 proposed the model of manufactured part and the Jacobian Torsor model, and presented a combined approach for analyzing machined part tolerance, geometrical defects occurring in a multistage machining process were taken into consideration. Ding et al. 19 proposed an improved JTM for statistical variation solution by extending Jacobian matrix and updating torsor equation, which is verified in the four-stage aero-engine rotors assembly. Mazur et al. 20 introduced the polynomial chaos expansion (PCE) into tolerance analysis by using the uncertainty control of PCE. Based on process integration and design optimization tools, a multi-objective tolerance synthesis platform for assembly was developed, which can reduce the calculation time while optimizing the tolerance, and accurately estimate the yield of the flexible assembly subjected to load. Khodaygan and Movahhedy 21 proposed a method for modeling the variations of geometric features due to dimensional tolerances. The fuzzy-small degree of freedom model was introduced by combining the concepts of fuzzy theory and small degree of freedom, which was suitable for tolerance analysis of mechanical assemblies with linear and angular tolerances. Yi et al. 22 proposed a generic integrated approach of assembly tolerance analysis based on skin model shapes, which contained a calculation method of assembly deviation propagation by integrating the skin model shapes and stream-of-variation theory. Ding et al. 23 predicted the machining accuracy for five-axis peripheral milling by integrating the geometric errors of the process system. Cao et al. 24 proposed a new point-based variation propagation model for a single machining process with multi-passes and analyzed the effects of locating errors, geometric errors of machine tool, and tool deflection on workpiece deviation. Li et al. 25 developed a multi-scale simulation system to predict the overall geometrical features of the milled surface by considering the effects of locating errors, geometrical errors of the machine tool, and tool deflections on the quality of the machined surface. Zhang et al. 26 proposed a quantitative variation propagation modeling method to study the subsequent impact of initial residual stress in raw material and provided an effective pattern mapping method between bulk stress fluctuation and overall component or assembly deformation. Yu et al. 27 proposed a new method for describing the variation propagation based on the product of exponentials formula and used twist coordinates to uniformly represented the length and the angle deviations. The method is verified in a pipeline assembly. Assembly precision prediction based on finite element analysis predict the product assembly precision by simulating material physical properties and assembly conditions of the product.4–11 Shen et al. 4 used finite element model to calculate surface deformation of a supporting assembly, and proposed a Monte Carlo analysis method to investigate the optical performance of a lens under uncertainty supporting loads. Niyogi et al. 7 used computational fluid dynamics code to predict multistage orifice plate assembly performance, and the analysis confirmed that the acceptance standard of orifice plate assembly was qualified. Stricher et al. 8 analyzed the tolerance of flexible assemblies based on finite element method by establishing a finite element model of assemblies, searched for geometric defects that led to joint overload by calculating the stress caused by assembling non-ideal parts, and described the modes of shape defects. Ospina-Aldana et al. 9 proposed a predictive shimmy method based on finite element analysis modeling and laser scanning measurement. By establishing the assembly skin model, the warping deformation of the model was calculated, and the geometrical shape of the gasket needed for assembly was calculated by using the finite element deformation data. Wei et al. used finite element model to calculate the warping values at the top and bottom of the stack model.10,11
The above research on precision prediction based on digital prototype has achieved reliable prediction, but the following problems still exist: (1) the noise factor generated in the actual production process, the instability of the assembly surface quality, and the randomness of the assembly operation are not considered; (2) customized mechanical products are characterized by individualization, low reuse of assembly prediction models and data, poor portability, and time-consuming processes of modeling and simulation. Due to the above-mentioned problems, the prediction of assembly precision of mechanical products requires processing a large amount of high-dimensional nonlinear data. To address this problem, deep learning techniques28,29 have been used to construct precision prediction because of their advantages in dealing with high-dimensional nonlinear problems.
Deep learning has been applied in the mechanical design and manufacturing industry with good results, 30 such as fault diagnosis,31,32 performance prediction, 33 and design optimization. 34 Transfer learning (TL) addresses the problem of insufficient samples in machine learning by transferring knowledge between domains. 35 Pan et al. 36 proposed the transfer component analysis method and Long et al. 37 proposed the joint distribution adaptation, but were mostly used for image processing. In the mechanical field, Hasan et al. 38 proposed a CNN-based TL method for bearing fault diagnosis and conducted bearing fault diagnosis through data transfer between different working conditions. Ren et al. 39 proposed a TL framework to achieve common information transferred from a spatial model of an HDM-measured surface and generated new available surface, where only low-resolution data are available. Machine learning requires a large number of independent and identically distributed data as training samples.35,40 Customized mechanical products are mostly customized by order, with the characteristics of small batch and multiple varieties. The small effective sample size limits the application of machine learning.
Mechanical products are often similar in terms of processing methods, material properties, assembly processes, and operating conditions. This implies that there exists the feasibility of improving sample deficiencies in assembly precision prediction through transfer learning of assembly features. The assembly prediction of mechanical products faces the problem of insufficient samples. A generative adversarial network (GAN) is constructed to generate samples based on the distribution of real samples. As an emerging machine learning technology, GAN has the features of high authenticity of generated samples, strong adaptability, and unsupervised training,41–43 which can effectively expand the sample size and ensure the fidelity of generated samples, and has been successfully applied to the research of sample generation for mechanical products. Fu et al. 44 used GAN to generate aeroengine condition monitoring data and increase the volume of usable data to increase reliability of aeroengines. Wang et al. 45 developed a novel fault diagnosis method which combined conditional GAN and stacked auto-encoders to generate fault samples. Lei et al. 46 proposed a deep convolutional GAN to reconstruct lost data for structural health monitoring. Motivated by the above study, we constructed a GAN to generate training samples based on the studied problem in order to expand the sample size. By combining the advantages of GAN and TL, an assembly precision prediction method based on GAN-FTL is proposed in this paper. The problem of predicting the assembly precision of customized products is taken as the target domain problem. Source domain samples have high-quality data and the problem is similar to the target domain problem. A GAN is constructed based on the source domain to generate simulation data with high fidelity and large sample size as auxiliary samples for precision prediction, and a weak support vector machine (SVM) classifier is used to generate pseudo-tags for the auxiliary samples. The sample features of the source domain, target domain, and auxiliary samples under different distributions are transferred to the same distribution by FTL, and the multi-source fusion of measurement data and simulation data is achieved.
The guide rail assembly of the KLK2 elevator is taken as a case study to verify the effectiveness and usability of the proposed method, and five methods are used for comparison (decision tree (DT), 47 k-nearest neighbor (kNN), 48 logistic regression (LR), 49 SVM, 50 and linear discriminant (LD) 51 models). Meanwhile, FTL between source and target domain are carried out with 100, 200, 300, 400, 500, and 1000 groups of samples for horizontal comparison. Experimental results show that the GAN-FTL based assembly precision prediction method can effectively improve the prediction accuracy and can be used to verify the tolerance design of customized mechanical products.
The remainder of this paper is organized as follows: Section 2 describes the proposed framework based on generative adversarial networks and fake labels. Section 3 provides a detailed description of the assembly precision prediction method based on feature transfer learning we proposed. Section 4 demonstrates this method by a case study of elevator guide steel assembly. Conclusions are summarized in Section 5.
Sample augment based on generative adversarial networks
In actual assembly, functional elements (FEs) are parameters of processing features (points, lines, surfaces, etc.) and are the key factors of assembly. Functional requirements (FR) are indicators of assembly performance.
The target domain problem
Input features of the elevator rail assembly task.
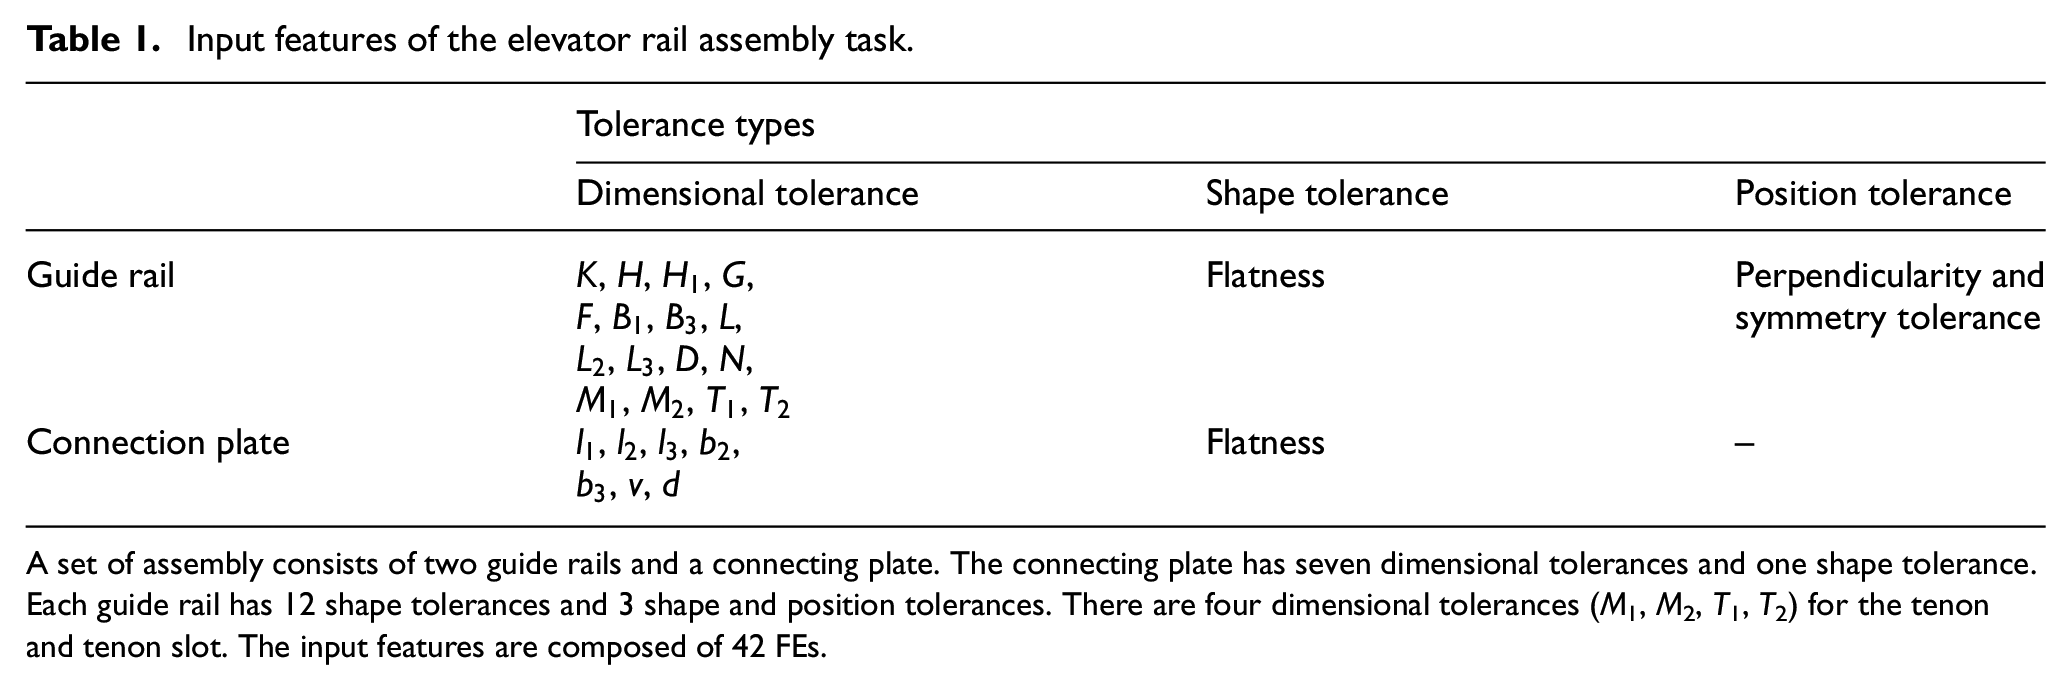
A set of assembly consists of two guide rails and a connecting plate. The connecting plate has seven dimensional tolerances and one shape tolerance. Each guide rail has 12 shape tolerances and 3 shape and position tolerances. There are four dimensional tolerances (M1, M2, T1, T2) for the tenon and tenon slot. The input features are composed of 42 FEs.
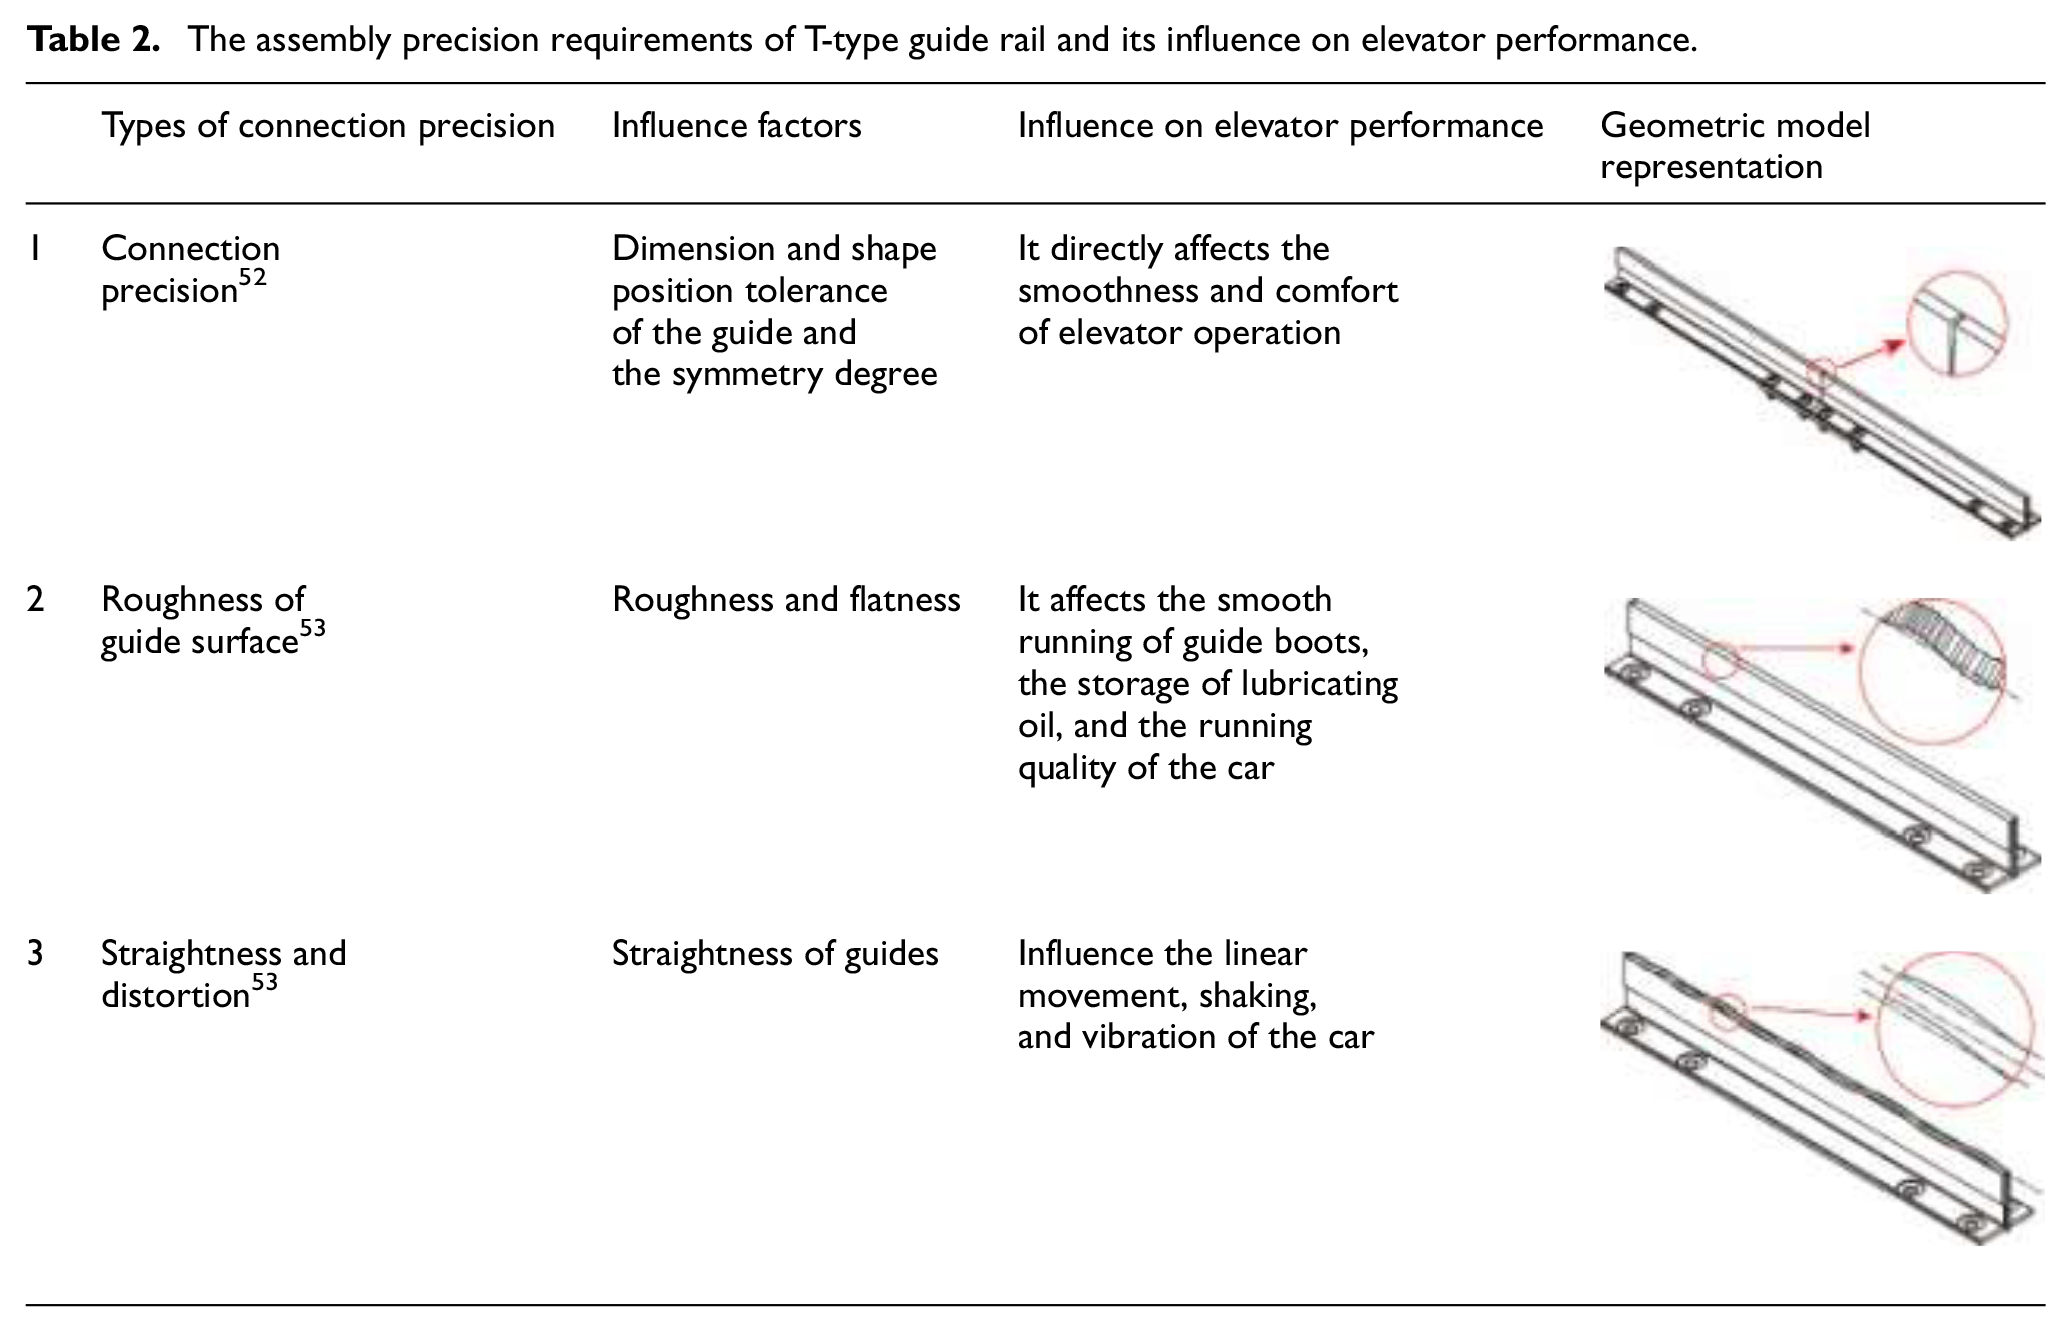
The assembly precision requirements of T-type guide rail and its influence on elevator performance.
Sample augment process based on GAN-FTL
In this study, the prediction of assembly precision of T90/B elevator guide rail is the target problem. The target domain
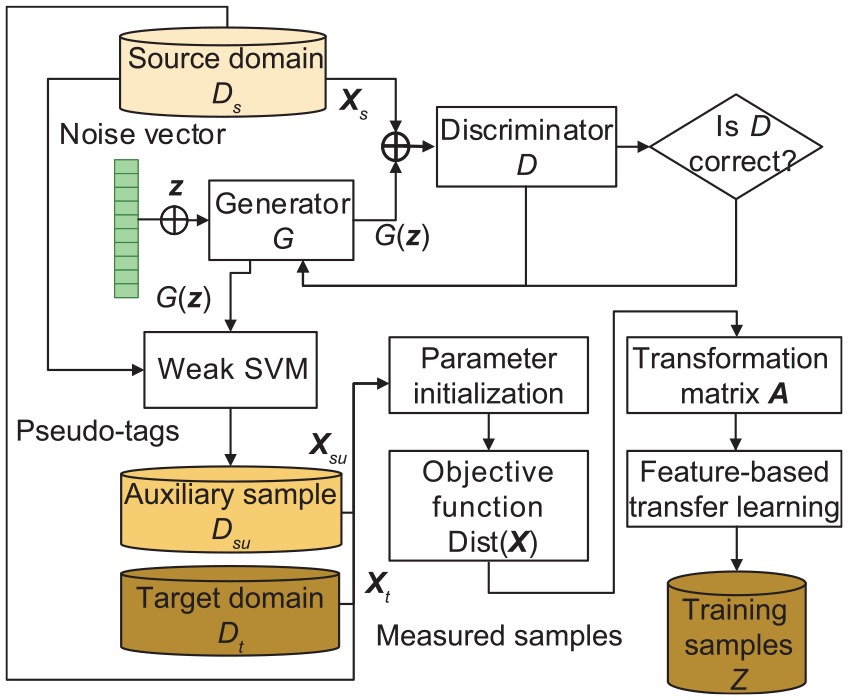
In order to solve the problem of low prediction accuracy due to insufficient samples, a sample enhancement framework based on GAN-FTL (Figure 1) is proposed in this paper by combining the advantages of GAN and TL. The proposed method can realize the generation of high-fidelity simulation samples and the feature transfer between different fidelity samples.
Sample augment based on GAN-FTL.
First, define the target domain problem and construct the target domain data. The input features
Second, the GAN is built to generate auxiliary samples and trained using high-quality source domain data. The GAN consists of the generator and discriminator. The input to the generator is a noise vector that generates simulation samples. A weak SVM classifier is built and trained using the source domain samples with labels. And construct pseudo-tags for the generated samples, to this point, the auxiliary sample
Then, the maximum mean discrepancy (MMD) is used as the metric to construct the objective function of FTL by considering the differences in the marginal and conditional distributions of each classified sample. Find the transformation matrix
An auxiliary samples generating method based on GAN and pseudo-tag
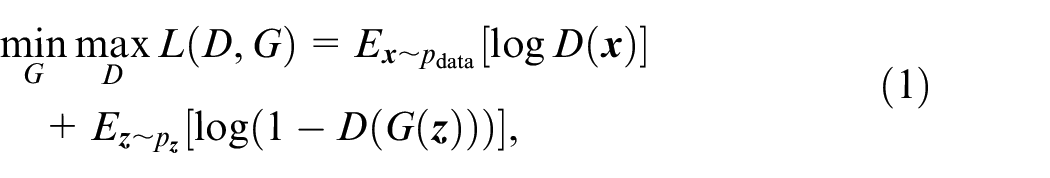
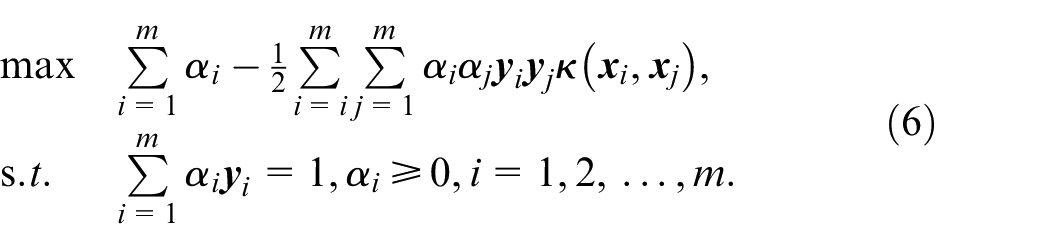
In this section, a GAN-based auxiliary sample generation method is proposed. G and D with similar and symmetric network structures are constructed, where the input of G is a noise vector, and D is trained with generated and source domain samples. The goal of GAN is to optimize the model according to the maximum minimum objective function (equation (1)). Training G and D until dynamic equilibrium is reached (D cannot distinguish between actual and generated samples). Then, an auxiliary sample
Generation of auxiliary samples
The GAN is built from two neural networks, the generator G and the discriminator D. G and D are trained simultaneously in a GAN. The pre-defined random noise vector
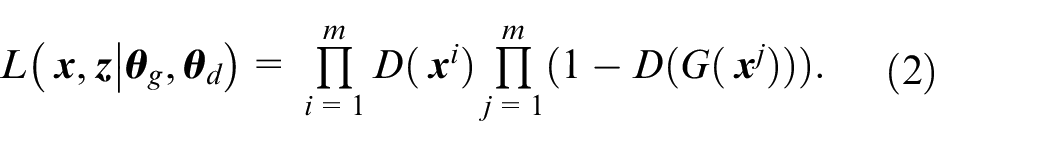
The task of G is to generate samples that are closer to the real ones; the task of D is to distinguish more accurately between real and fake samples. The minimum maximization objective function of GAN is expressed as:
where
As for D, when the input is a real sample and it should be classified as positive by D, that is,
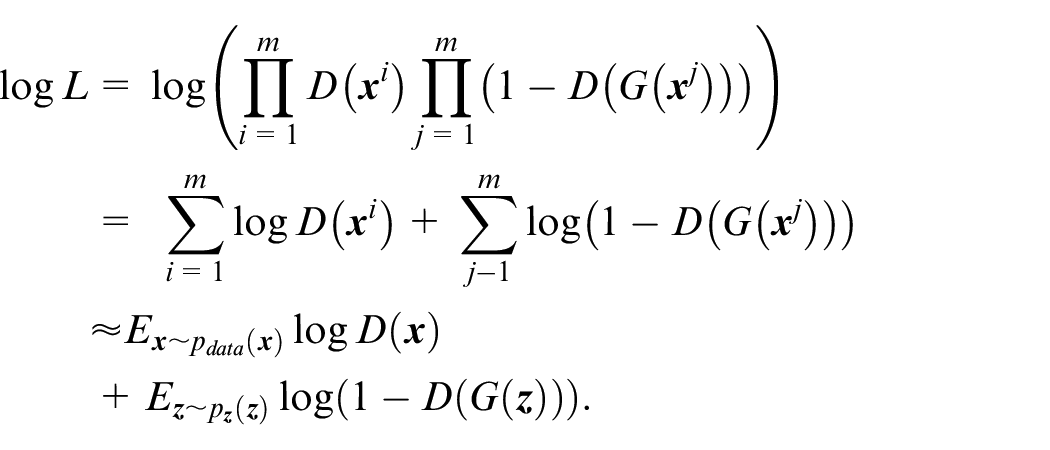
The logarithmic likelihood of equation (2) can be expressed as:
The optimization function of D is:
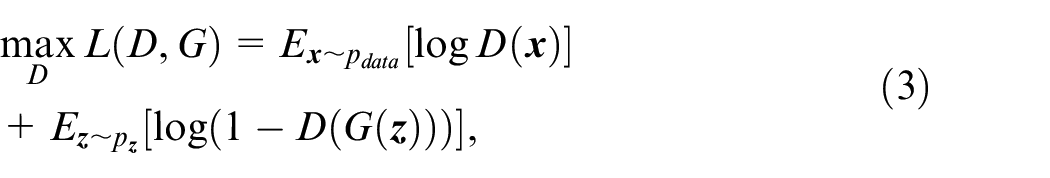
where
Pseudo-tags for auxiliary samples
The traditional GAN is a kind of unsupervised learning. The auxiliary samples

where
where
where
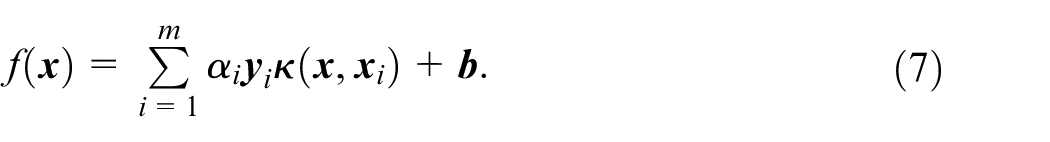
Using the proposed classifier, pseudo-labels
After that, auxiliary samples
Prediction of assembly precision of customized mechanical products based on feature transfer
Transfer of assembly features
Source domain samples
There are marginal and conditional distribution differences between the source and target domain samples due to differences in the actual product design parameters and production factors, that is,
MMD is a parameter that measures the difference in data distribution between domains, 37 as follows:
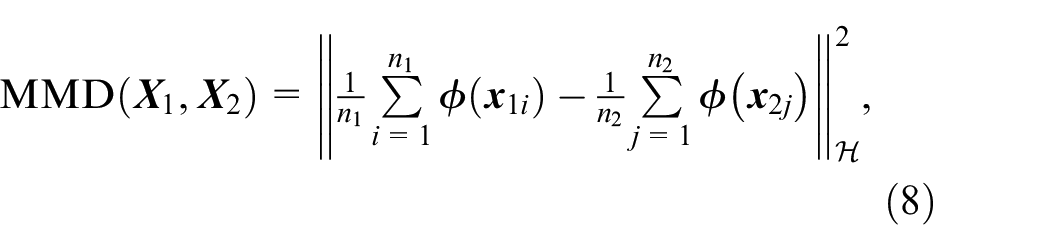
where
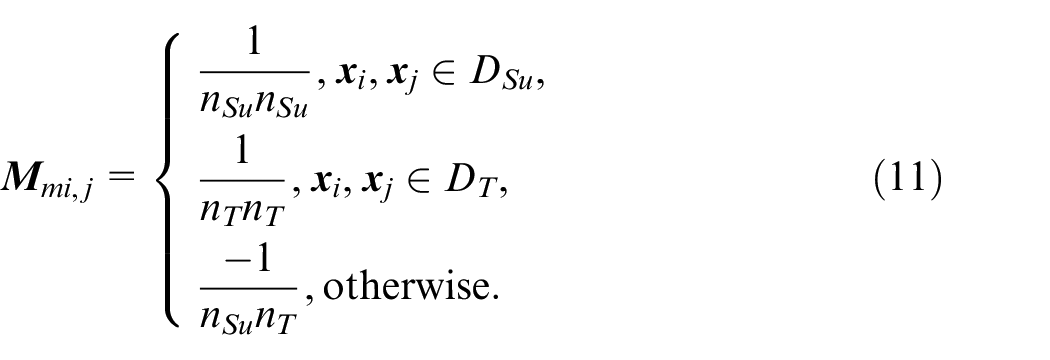
Marginal distribution
The MMD of discrepancy between marginal probability
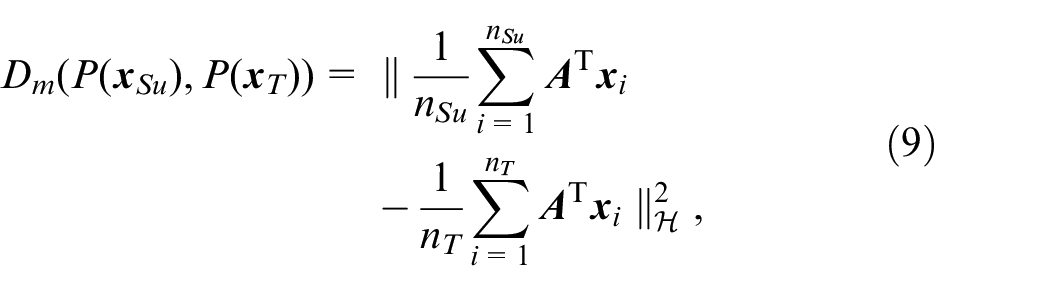
where

where
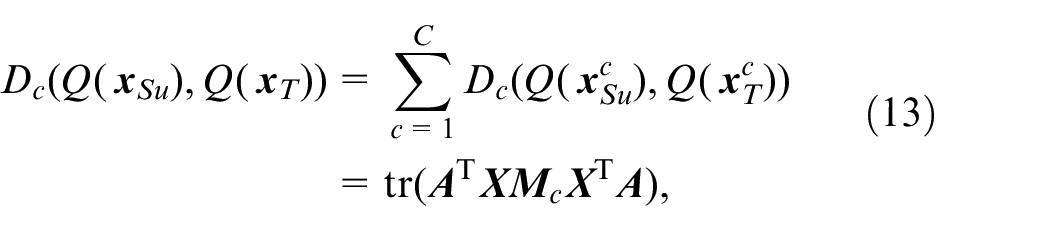
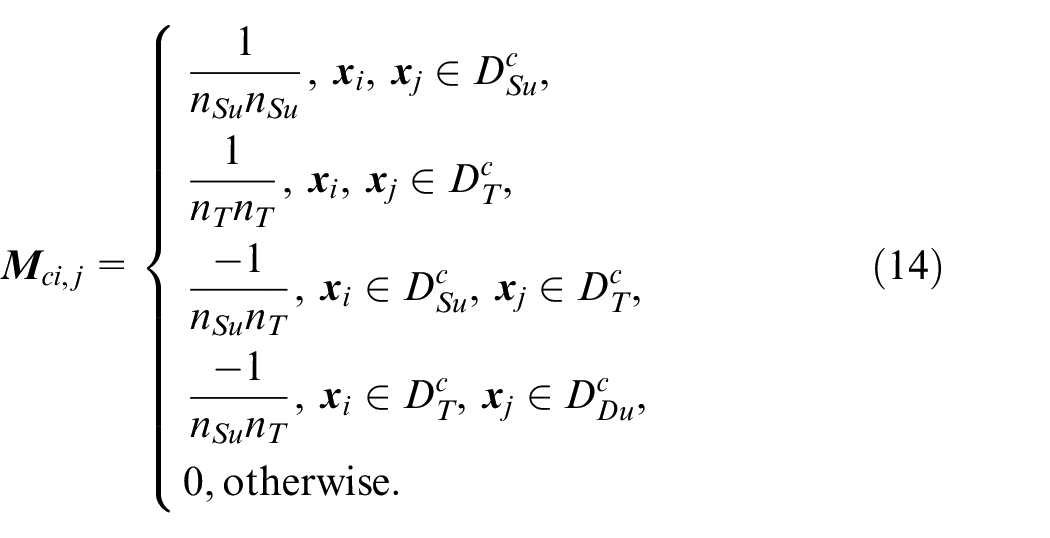
Conditional distribution
Because the expressions
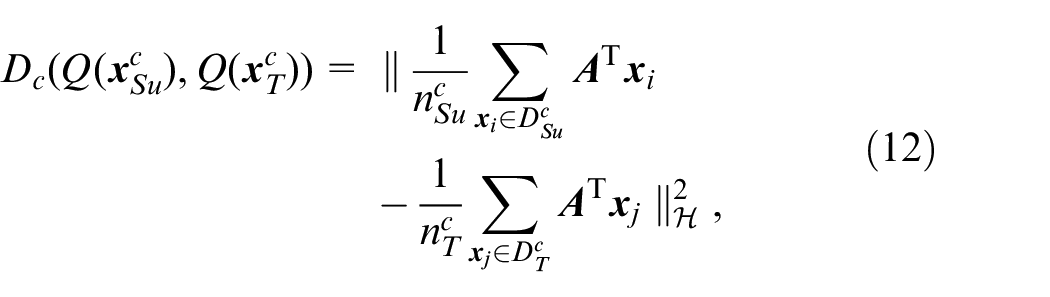
where
where
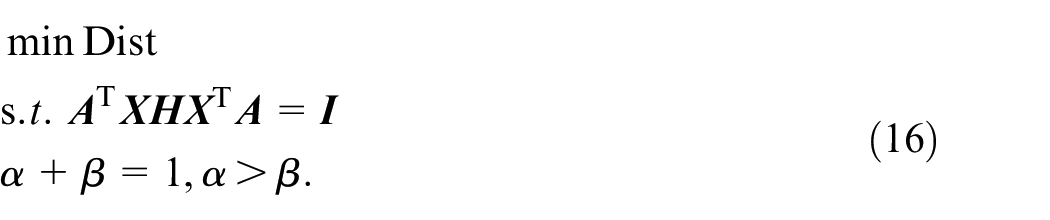
Optimization target
After considering the differences in the marginal and conditional distributions of each classification in
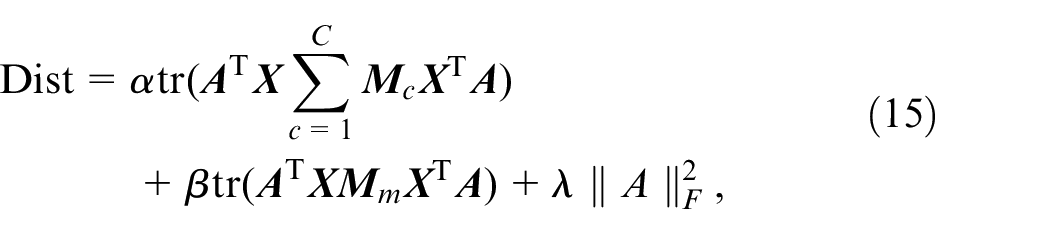
where
For the mechanical assembly problem, there is a similar relationship between the source and target domain, so conditional distribution adaptation needs to take a larger proportion, which means
Let
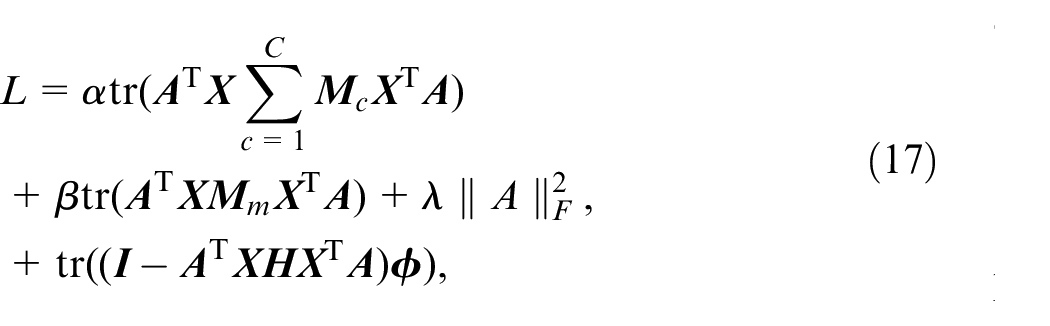
where
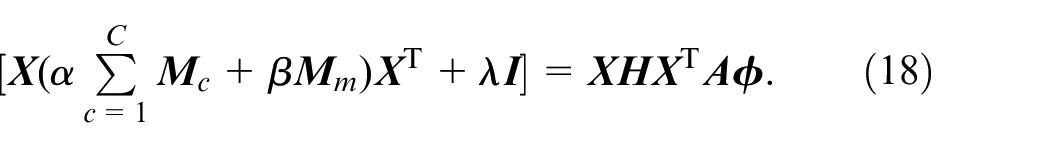
Solving equation (18), the transformation matrix
Prediction method of assembly precision based on feature transfer
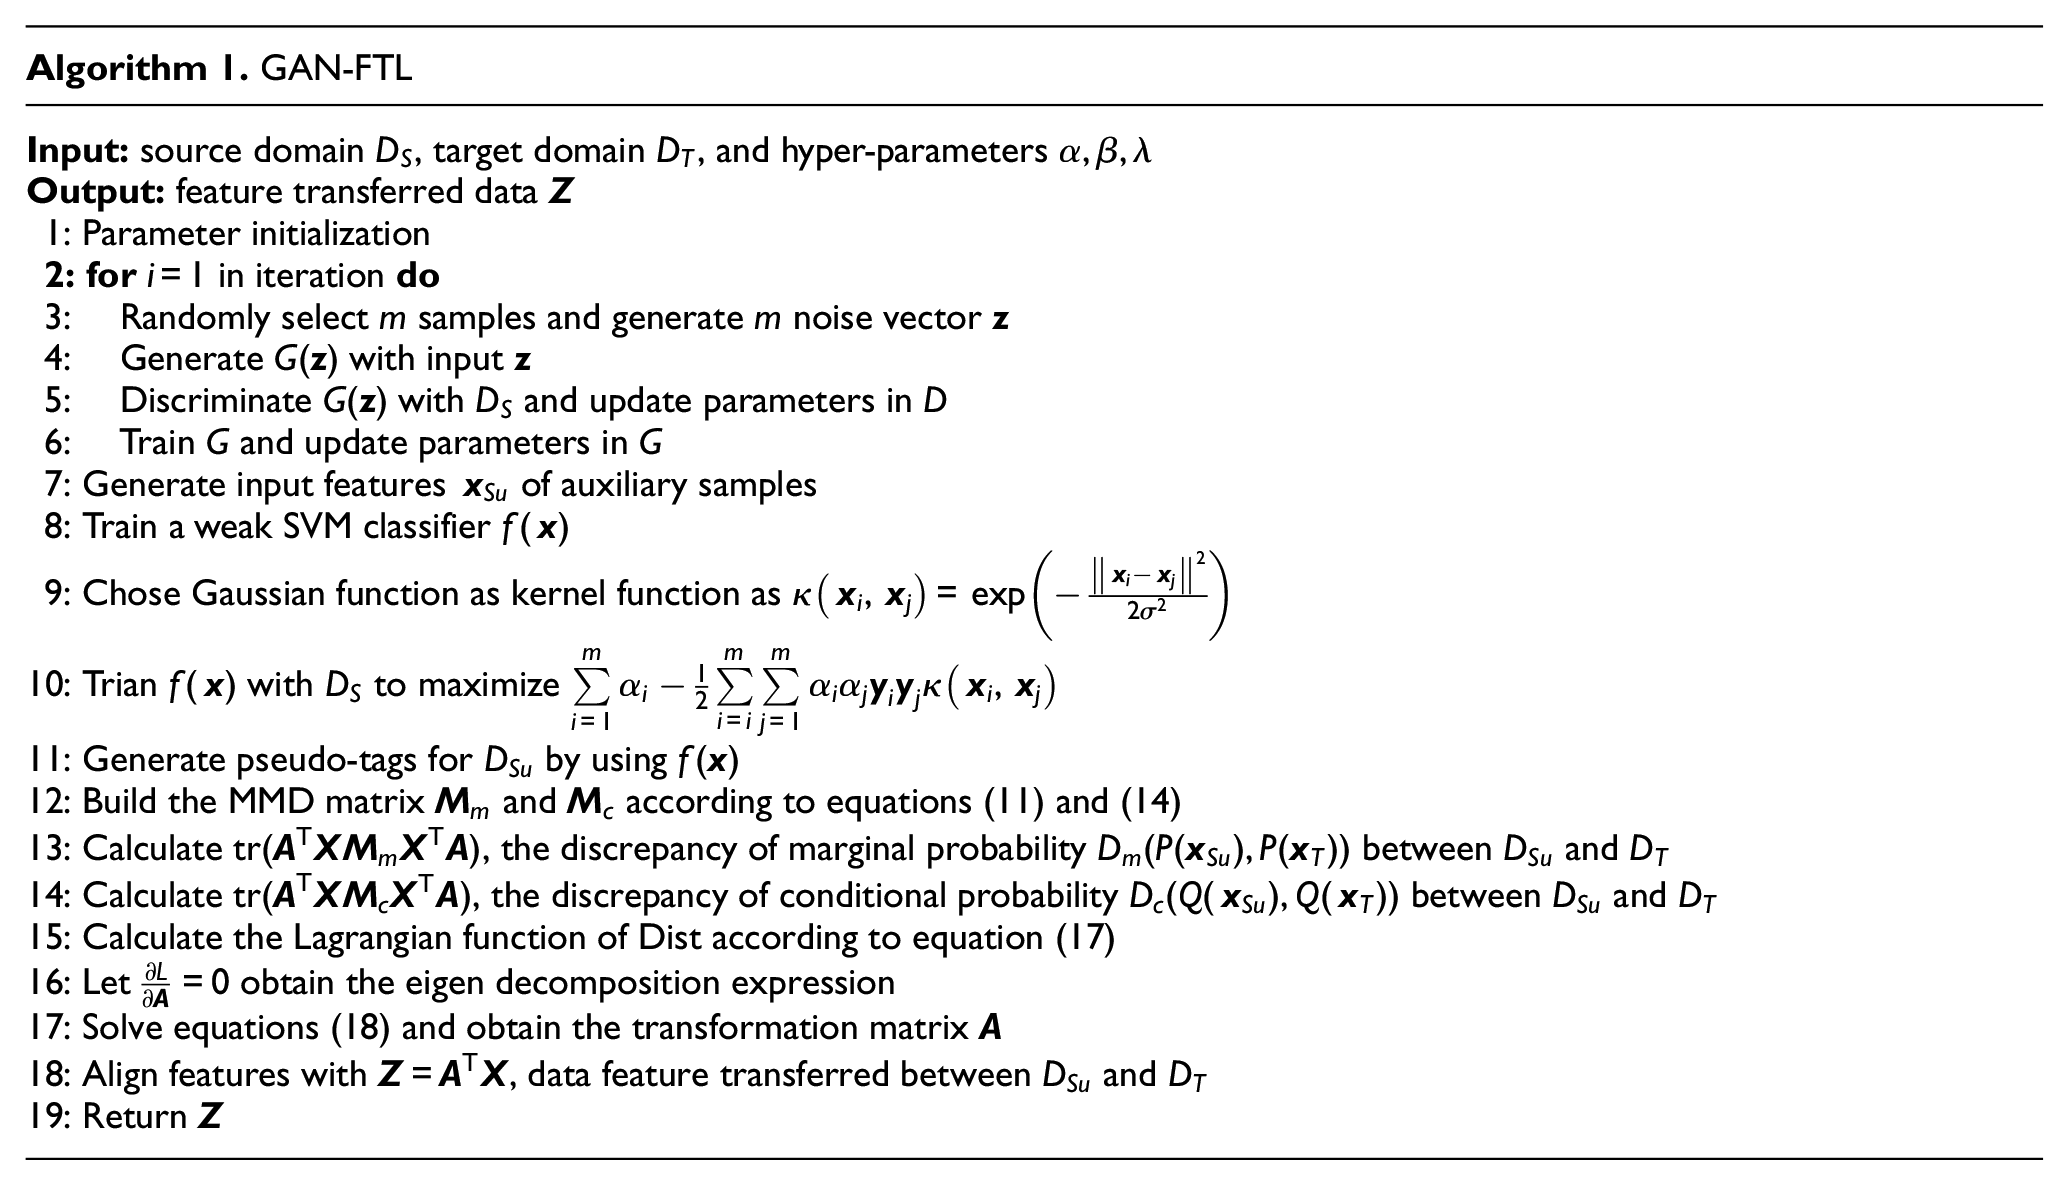
The flow of the GAN-FTL is shown in Algorithm 1. Choose the source domain data
Case study
Assembly of guide rail in KLK2 type elevator
The elevator guide rails provide guidance and support for the car and weight device. The installation precision of the guide rail directly affects the vibration performance of the elevator during operation. To enhance the elevator assembly performance, it is necessary to predict the assembly precision of the guide rail, which in turn improves the assembly tolerance design of the guide rail and provides guidance for actual installation. The guide system of elevator is composed of guide rails, connecting plates, and support frames. The T-rail relies on tenon and tenon groove assisted assembly and is connected by bolts (Figure 2(b)).
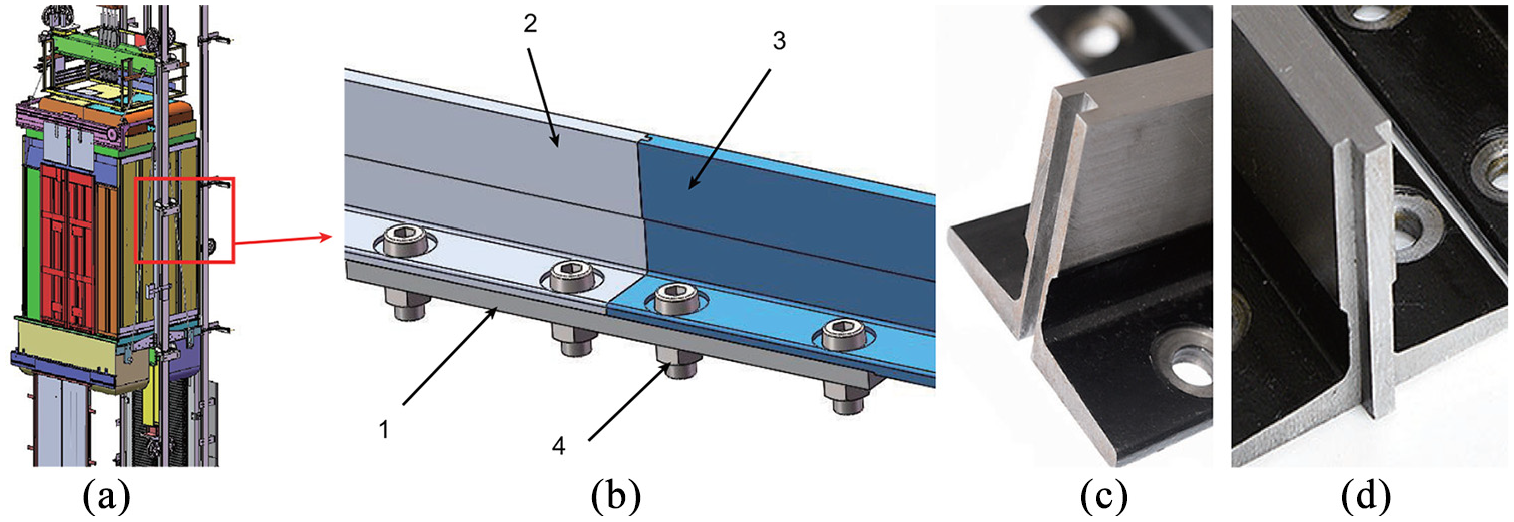
(a) Model of guide rail in elevator car model, (b) model of guide rail in elevator car model: 1. guide rail connection plate, 2 and 3. guide rail, 4. bolts and nuts. Tenon (c) and tenon slot (d) of T-type guide rail structure.
Source and target domain (
and
)
The target domain problem is the assembly of T90/B guide rail in elevator. The target domain samples are data of T90-1/B guides with 100 groups of labeled samples. The target domain sample consists of 100 groups of labeled data, including 42 dimensional inputs (dimensions and tolerance requirements for each FEs). T70/B guide rail and T90/B guide rail are different size series products of the same type, with similar application scenarios, the same types of tolerance requirements, and the same assembly rules. So choose T70 rail data as source domain data. The source domain samples are 200 groups of labeled samples.
Input features
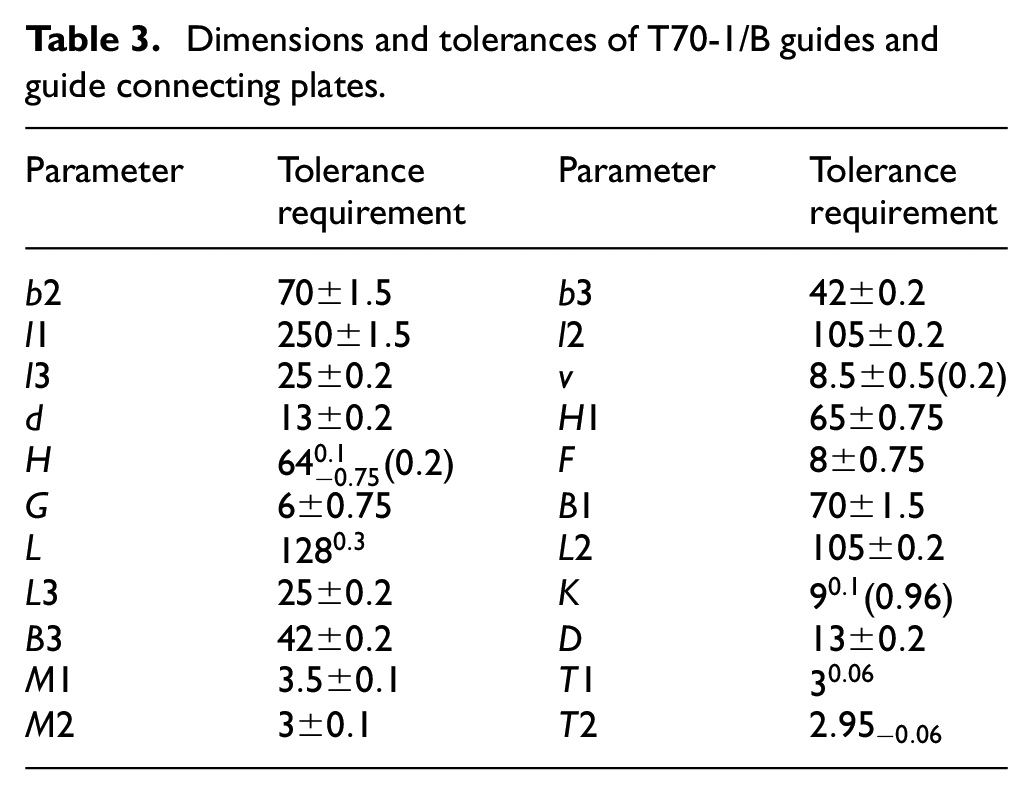
The tolerance requirements of the guide rail are shown in Figure 3(a) and (b). As listed in Table 1, the input features are 42-dimensional vectors. The specific parameters of
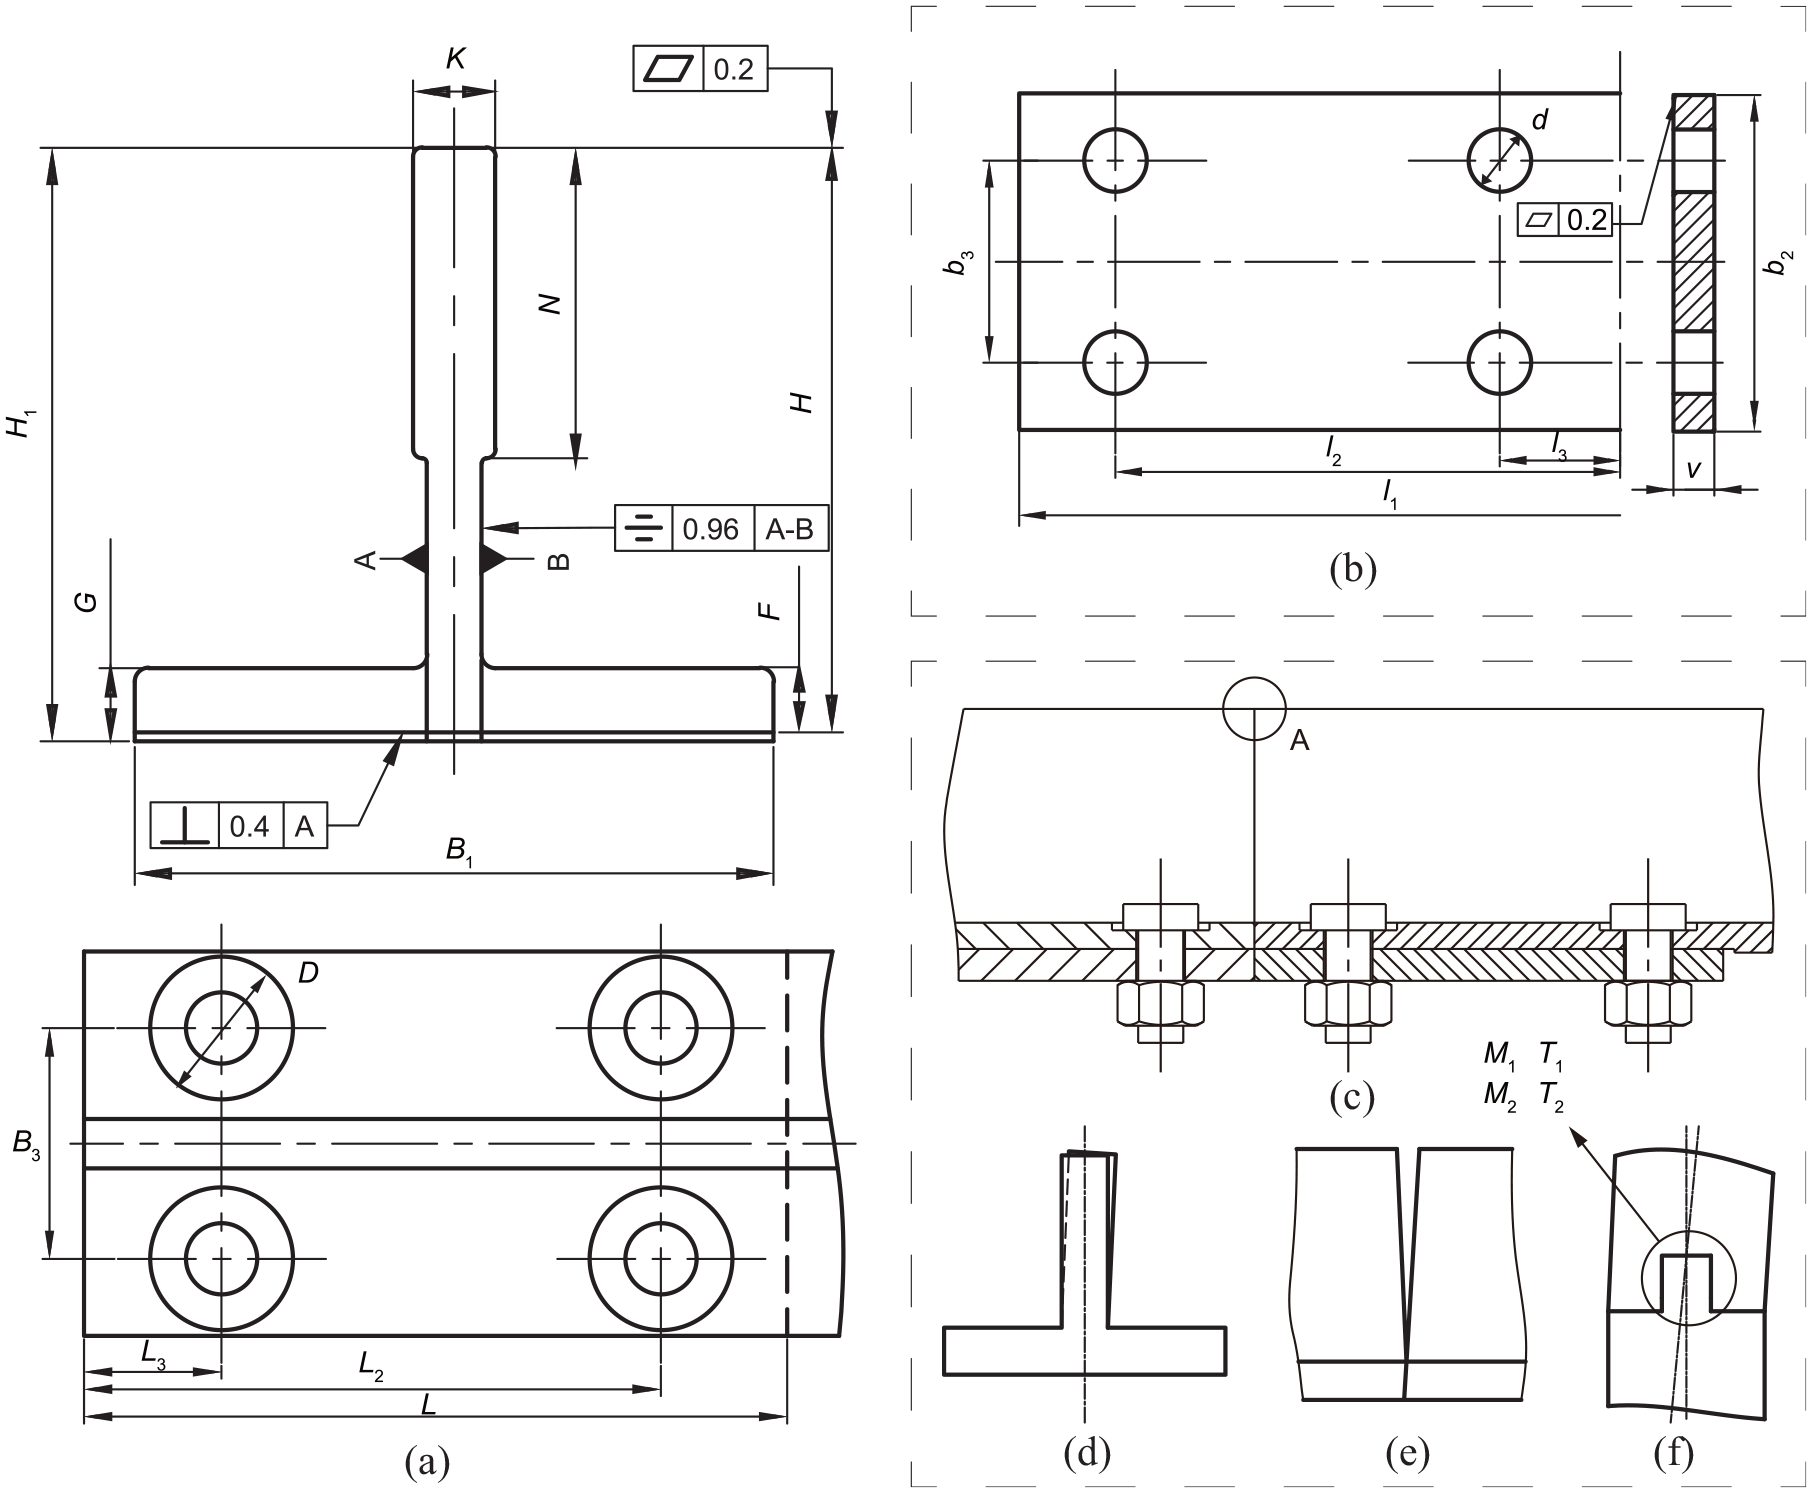
Dimensional drawing: (a) T-type guide rail, (b) guide rail connecting plate, (c) type of assembly error, (d) parallel error, (e) clearance, and (f) straightness error.
Dimensions and tolerances of T70-1/B guides and guide connecting plates.
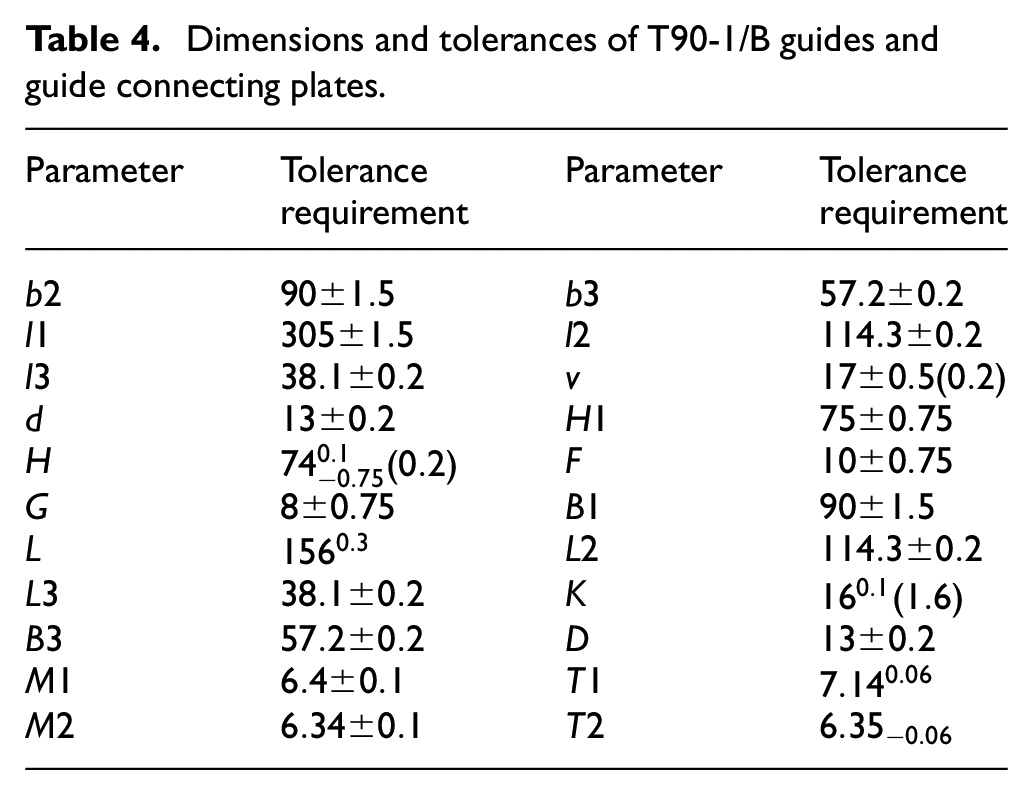
Dimensions and tolerances of T90-1/B guides and guide connecting plates.
Output feature
Parallelism error, assembly gap, straightness error, irregularity, and other assembly problems often occur in the installation of guide rails (Figure 3(c)–(f)). Common types of guide rail installation failure are list in Table 2.52–55 The output feature is the presence or absence of the accuracy error shown in Table 2, label “0” means the qualified assembly and “1” indicates the type of assembly failure occurred.
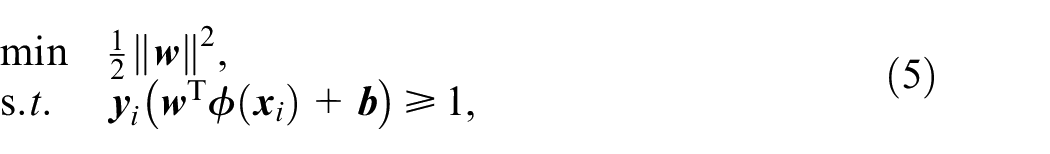
Experiment design
Generation of auxiliary samples based on GAN
A GAN was constructed based on the auxiliary sample generation method proposed in Section 2.2. The GAN was trained with source domain samples to generate auxiliary samples, where
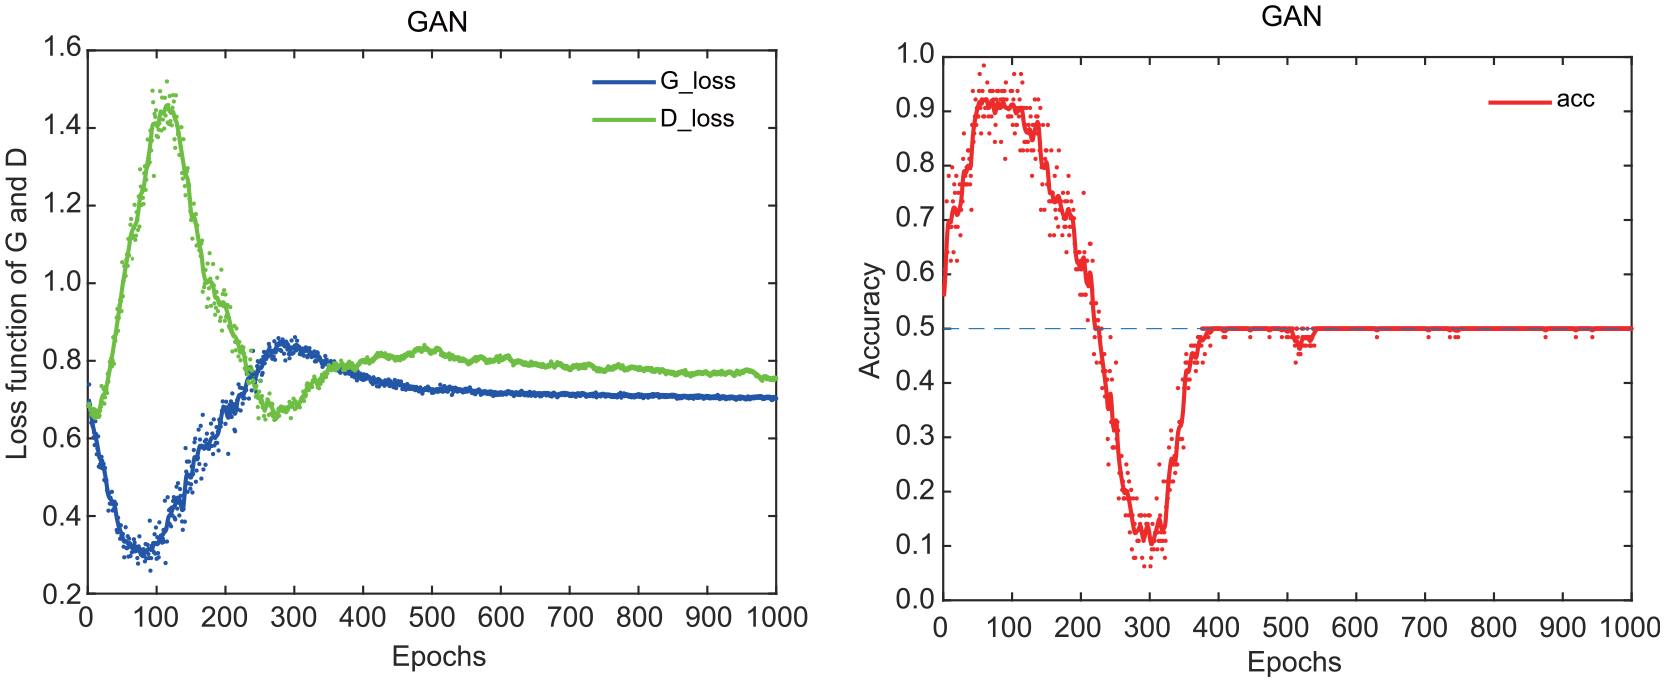
The training results of GAN.
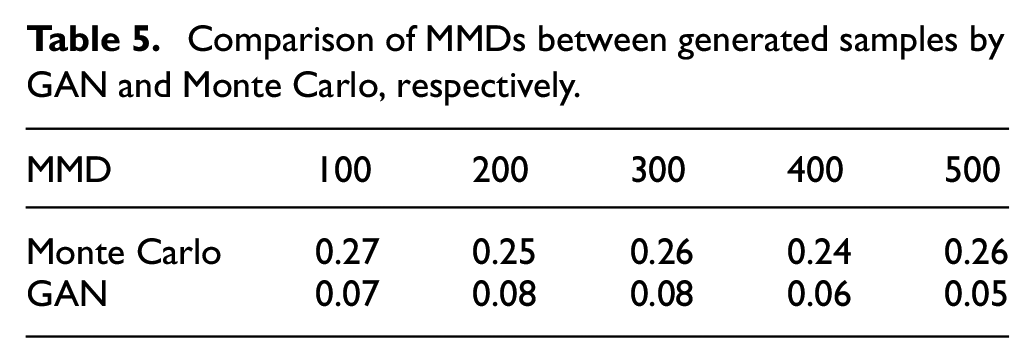
Five hundred auxiliary samples were generated with the trained GAN network. Also 500 sets of comparison samples were generated using Monte Carlo method according to the parameters in Table 3 to compare with GAN. The MMD distances between the two sets of generated samples and the source domain samples were calculated, and the results were shown in Table 5. From Table 5, it can be seen that the GAN generated auxiliary samples have smaller MMD values with the source domain samples, which means the probability distributions are more similar.
Comparison of MMDs between generated samples by GAN and Monte Carlo, respectively.
Numerical case based on FTL
FTL between domains
First, to verify the validity of FTL, two sets of one-dimensional random numbers with different probability distributions were generated. As shown in Figure 5(a), Gaussian-distributed random data with different means and variances are used as source and target domain data (
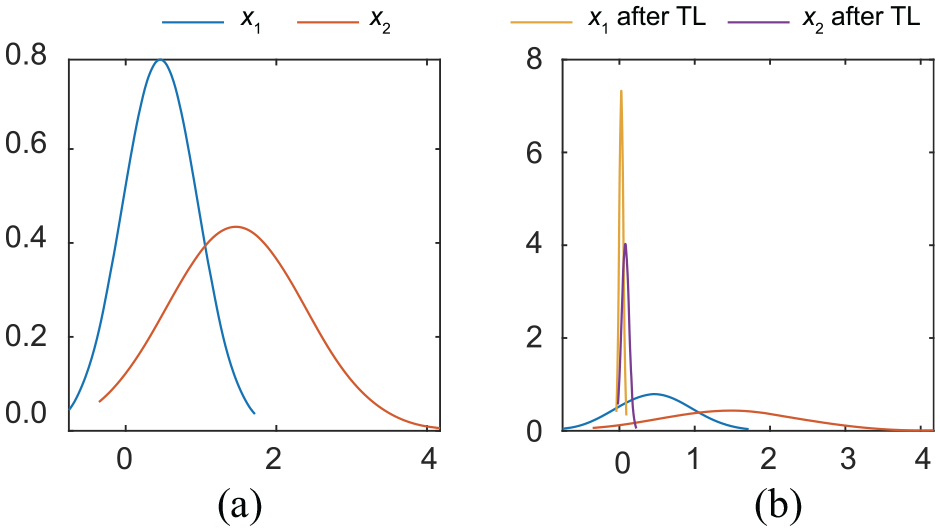
Comparison of metrics: (a) before FTL and (b) after FTL.
Comparison of metrics before and after FTL.
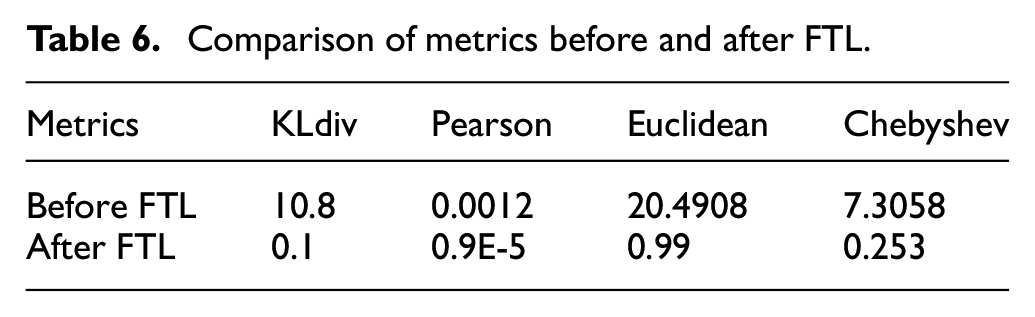
For the guide data (
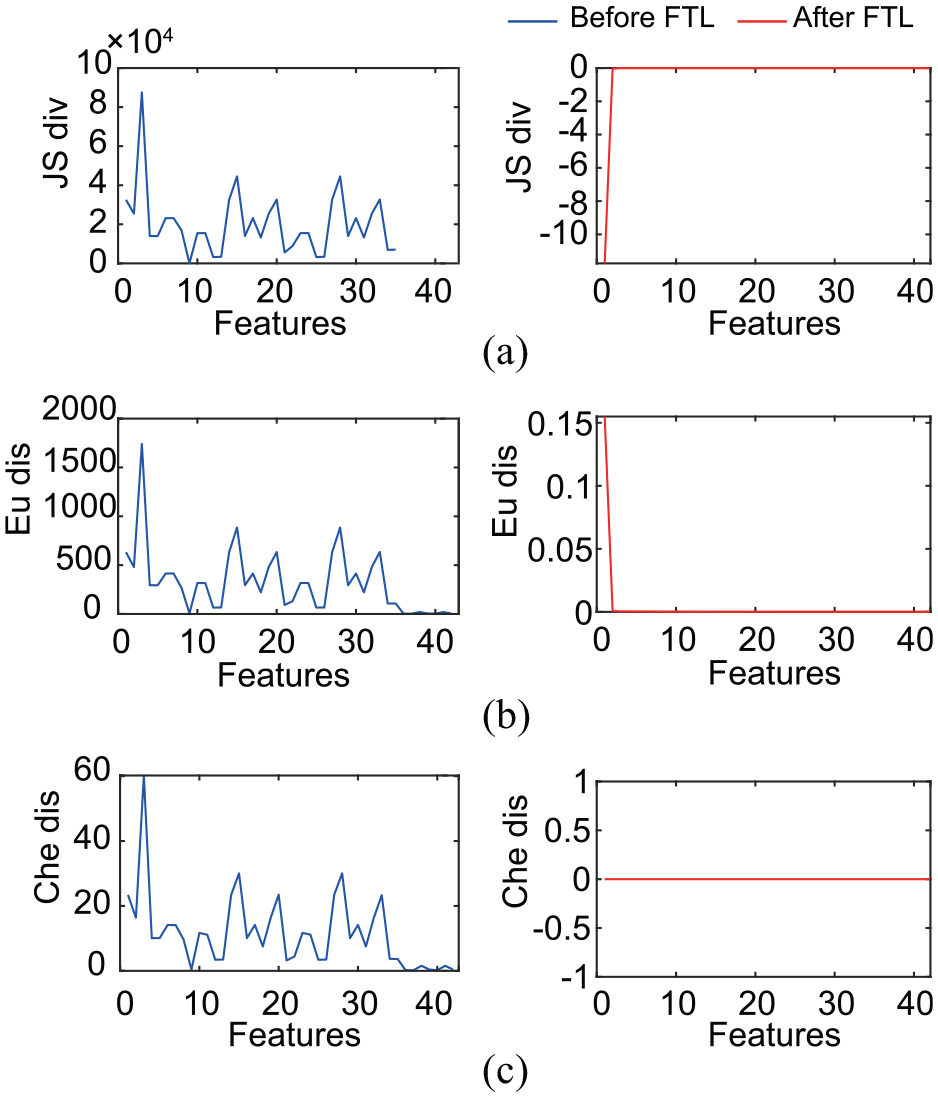
Metrics of data transfer: (a) J-S divergence, (b) Euclidean distance, and (c) Chebyshev distance.
Comparison of prediction tests after GAN-FTL
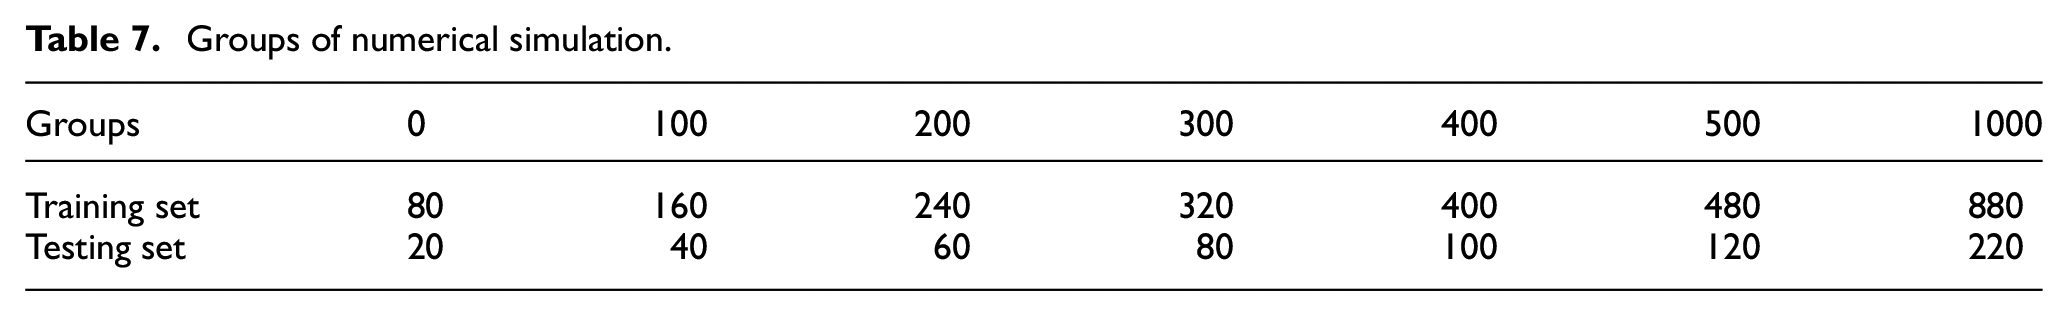
The GAN-FTL method is proposed to improve the insufficient samples and enable the fusion of data from different distributions to improve the prediction accuracy. The guide rail assembly of the elevator is the case study of this paper. Five methods (DT, kNN, LR, SVM, and LD) were used to predict the assembly accuracy and compared using the proposed GAN-FTL method with and without the FTL method (in Table 7, group = 0 indicates that GAN-FTL is not used, and group ≠0 indicates that GAN-FTL is used). Six sets of different numbers of auxiliary samples (
Groups of numerical simulation.
Results
The comparison and relative errors of the experimental results are shown in Tables 8 and 9 and Figure 7.
Prediction accuracy (%).

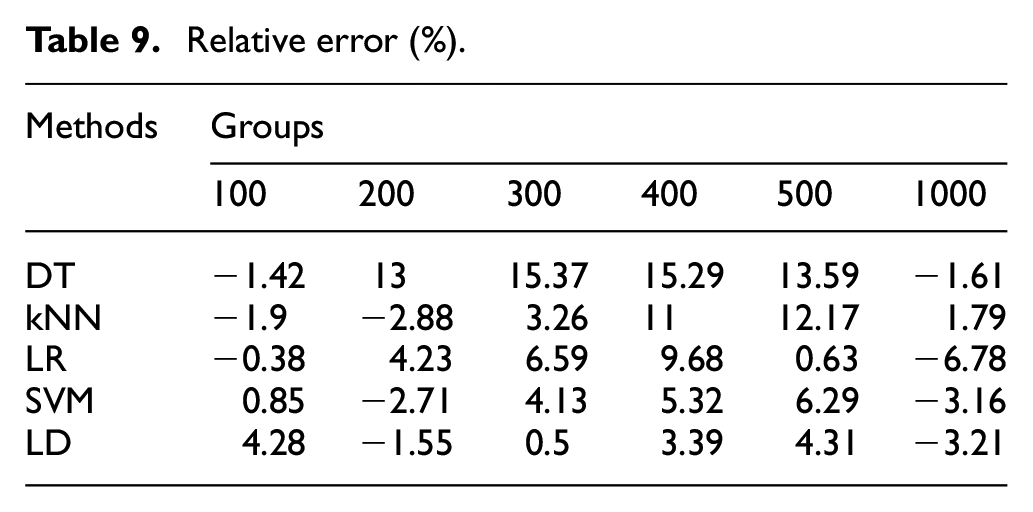
Relative error (%).
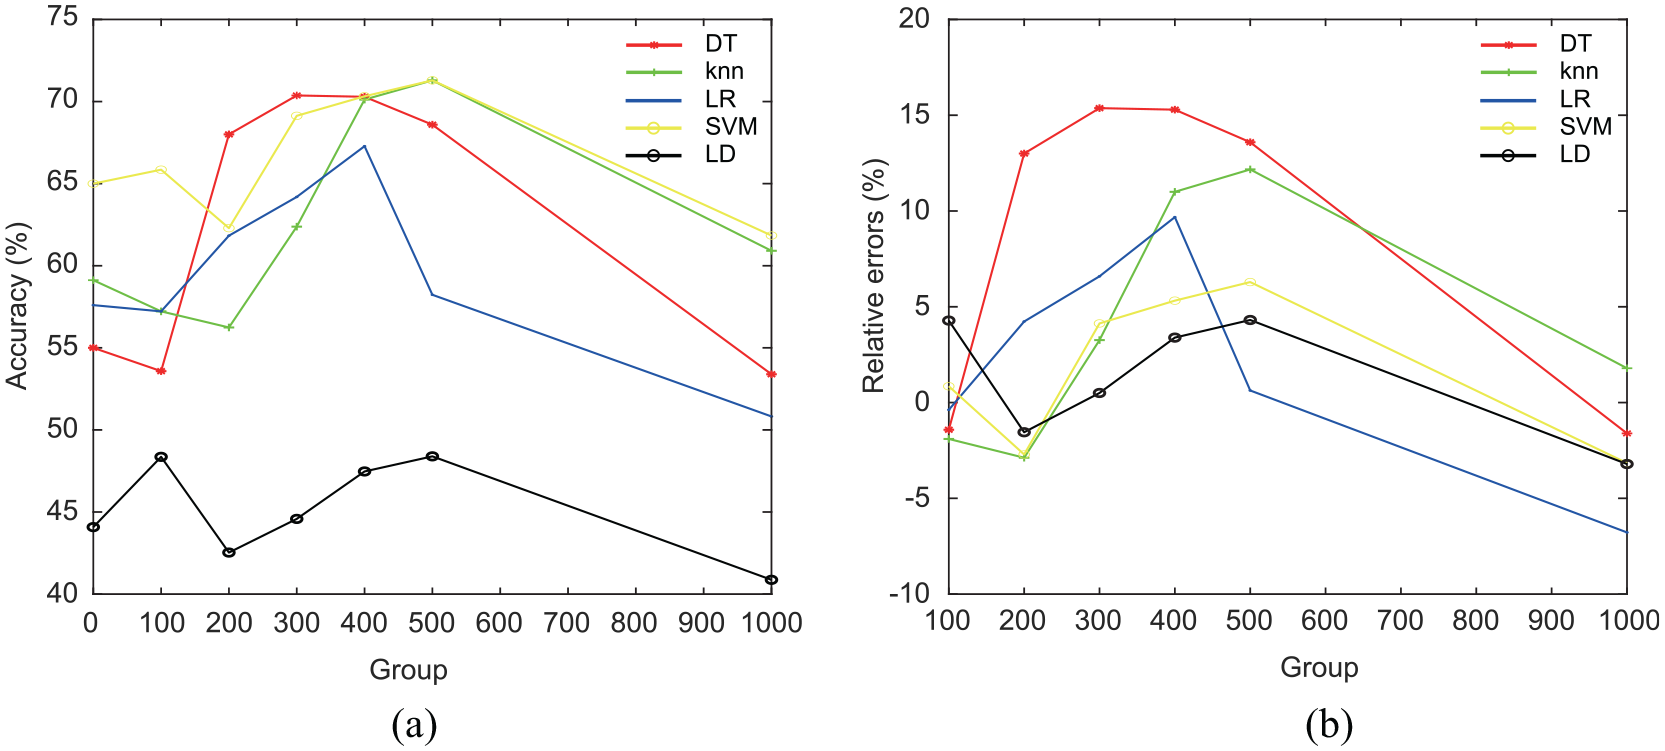
Comparison of experimental results: (a) prediction accuracy and (b) relative error.
As shown in Figure 7, compared with prediction using only target domain samples (no GAN-FTL method, auxiliary samples are 0, i.e. group = 0), the prediction accuracy was improved in most cases using the proposed GAN-FTL method. When the transfer sample size group = 300, 400, and 500, the prediction accuracies of DT, kNN, LR, SVM, and LD algorithms were effectively improved with maximum increases of 15.37%, 12.17%, 9.68%, 6.29%, and 4.31%, respectively. For the tree-based classification algorithm DT, the prediction accuracy is only 55% without using GAN-FTL. The transfer of auxiliary samples increases the size of the training data, making it possible to train a better tree structure, which improves the accuracy by at least 13%. For kNN, the inclusion of auxiliary samples increased the number and fidelity of samples near the prediction points, obtaining higher prediction accuracy in three cases (maximum increase of 12.17%). However, when there are too many auxiliary samples, the contribution of auxiliary samples to the clustering points dominated and negative migration occurred. As for the typical classification algorithms LR and SVM, better accuracy was achieved in the comparison experiments. However, when the transferred sample size was small (group = 100 and 200), under-fitting occurred due to insufficient samples. When the group is large (group=1000), too many auxiliary samples lead to over-fitting (negative transfer). As for the LD algorithm, the highest improvement in prediction accuracy of the GAN-FTL method was only 4.31%. The linear model handled the high-dimensional nonlinear problem poorly, and the overall prediction accuracy was less than 50%. The above comparison results showed that the GAN-FTL method can effectively improve the accuracy of assembly precision prediction for small sample problems. Meanwhile the effectiveness of FTL was influenced by the sample size that generated by GAN.
Conclusion
Customized mechanical products have the characteristics of individualization, small batch size and multiple varieties, which lead to insufficient data for assembly accuracy prediction. In order to improve the above problem, an assembly precision prediction method based on GAN and FTL is proposed in this paper, which achieves the sample size expansion for small sample problems. The technical features of this method are as follows:
A GAN-based auxiliary sample generation method was proposed. The GAN was constructed using high-quality measured source domain data to generate high-quality and large sample size simulation data as auxiliary samples for FTL. A weak SVM classifier was constructed to generate pseudo-tags of auxiliary samples for supervised learning to expand the sample size.
A FTL method was proposed to achieve data fusion, and MMD is used as the criterion to evaluate the probability discrepancy. Differences in the marginal and conditional distributions of each classification in the auxiliary and target samples were comprehensively considered. The data fusion of multi-source data with different fidelity was obtained by data transfer between measurement data (source and target domains) and simulation data, and the small sample size was expanded by the FTL method.
The proposed method was validated by the prediction of rail assembly accuracy in elevators, with T70/B and T90/B elevator rails as the source and target domains, respectively. Five methods (DT, kNN, LR, SVM, and LD models) and multiple migration volume cases (group = 0, 100, 200, 300, 400, 500, 1000) were used for comparison respectively. Experimental results showed that the DT, KNN, LR, SVM, and LD algorithms can effectively improve the prediction accuracy when the number of transfer samples are 300, 400, and 500, with the maximum improvement of 15.37%, 12.17%, 9.68%, 6.29%, and 4.31%, respectively. The above conclusions demonstrated the effectiveness of the GAN-FTL-based assembly precision prediction method.
Footnotes
Declaration of conflicting interests
The author(s) declared no potential conflicts of interest with respect to the research, authorship, and/or publication of this article.
Funding
The author(s) disclosed receipt of the following financial support for the research, authorship, and/or publication of this article: This research was supported by the National Key R&D Program of China (No. 2018YFB1700700), National Natural Science Foundation of China (No. 51875516), and Jiangsu Province Science and Technology Achievement Transforming Fund Project (No. BA2018083).