
Abstract
Acceptance sampling is a statistical procedure for accepting or rejecting production lots according to the result of a sample inspection. Formalizing the concept of assisted acceptance sampling, this article suggests the use of consolidated tools for reducing the risk of human errors in acceptance sampling activities. To this purpose, the application of augmented reality techniques may represent a profitable and sustainable solution. An augmented reality–based prototype system is described in detail and tested by an experimental plan. The major original contributions of this work are (a) introducing the new paradigm of assisted acceptance sampling and (b) developing a preliminary application in an industrial-like environment. This application is a first step towards the realization of a complete assisted acceptance sampling system.
Keywords
Introduction and literature review
Quality inspection procedures are generally used for checking the compliance with specification of incoming lots of products. When the lot size is very large and inspections are expensive or destructive, acceptance sampling (AS) is generally preferred to 100% inspection. AS uses statistical sampling to decide whether to accept or reject a production lot. This widespread and deep-rooted practice is regulated by several standards. 1 As derivatives of MIL-STD-105E 2 and ANSI/ASQ Z1.4, 3 ISO 2859 and ISO 3951 standards 4 address the important role that AS plays when dealing with the product flow, with an emphasis on the producer’s process. 5
AS generally requires the random selection of a sample of product units from a lot which should be representative of the lot itself (see Figure 1). Then, the lot is sentenced according to the result of the sample inspection: if the sample defectiveness is tolerable, then the whole lot is accepted; otherwise, it is rejected. 5
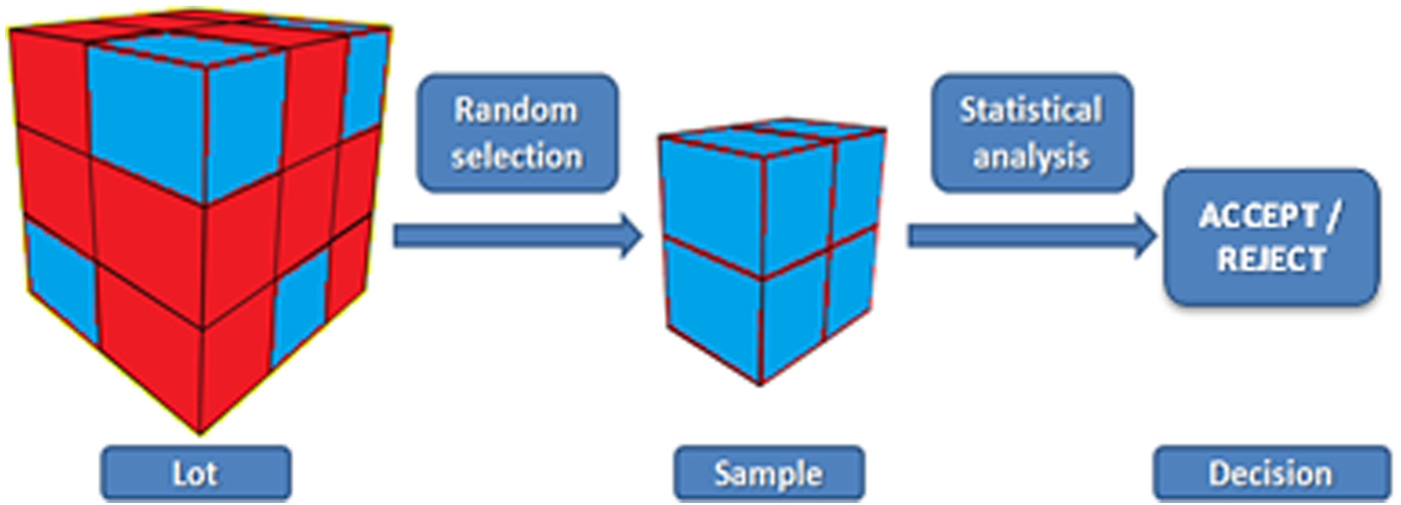
Schematic representation of the AS process.
To date, the human factor still has a crucial role in the AS, which often involves specialized operators dedicated to the inspection activities. In this context, distraction, fatigue, superficiality and lack of operator’s training are among the possible causes of errors that might compromise the effectiveness of AS.
Being able to superimpose virtual objects and cues upon the real world and in real time, augmented reality (AR) potentially constitutes a useful tool to assist operators in the random sampling process.
There are many examples of ad hoc AR systems designed for assisting operators in their specific tasks. Limiting the focus on manufacturing technologies, AR is applied to prototype visualization,6–9 assistance in maintenance and repairing activities,10–12 training,13,14 guidance during product assembly 11 and robot path planning.15,16
This article introduces the concept of assisted acceptance sampling (AAS), suggesting the use of AR techniques for supporting quality inspectors in the AS activities. This can significantly decrease the time for training operators, also reducing the risk of human error in the selection of the sample while ensuring the compliance with the requirement of sampling randomness. In detail, the article describes a prototype implementation based on AR techniques which is able to recognize and track production lots in industrial environments. The ability to recognize and track production lots and simultaneously display them on a portable device is a first and fundamental step for any subsequent development of additional support features. As a preliminary implementation, the goal of the prototype is limited to support the user in the univocal identification of the item to sample in order to ensure the hypothesis of random sampling which is a fundamental assumption of AS. The prototype is tested through an experimental screening of the major factors affecting its performance.
This article is not aimed at developing new AR techniques or procedures, but rather extending the use of the available ones for typical AS operations. Moreover, the preliminary prototype application represents a first step towards the realization of a complete AAS system.
The remainder of this article is organized into five sections. Section ‘The concept of AAS: problem introduction’ discusses the problem of implementing an AR system for a lot-by-lot AS, while section ‘Prototype implementation’ describes the prototype developed in an industrial-like environment, at the industrial metrology and quality laboratories of Department of Management and Production Engineering (DIGEP) – Politecnico di Torino. Section ‘Application example’ provides an application example of AAS based on the aforementioned prototype. Section ‘Factor screening’ contains a screening analysis of the major factors affecting the performance of the AR system. Finally, the concluding section highlights the main implications, limitations and original contributions of this work.
The concept of AAS: problem introduction
Even for companies with a high level of automation, AS activities are difficult to automate since they are strongly affected by sensitivity, experience and training of operators. While automatic sampling and inspection systems have been developed and adopted in some specific contexts,17–19 manual approaches are still very common, with a crucial role played by operators. Unfortunately, the presence of an operator may also cause some errors stemming from distraction, fatigue, superficiality, lack of training and so on.
In AS, a typical situation is that of inspecting a lot of items arranged on a pallet (see Figure 2). The operator has to disassemble the lot, open the packages to be inspected and eventually reconstruct the lot after the inspection. For large-sized lots or lots with a large number of items, these operations can be quite complex. Figure 3 depicts the typical activities and issues in AS activities.
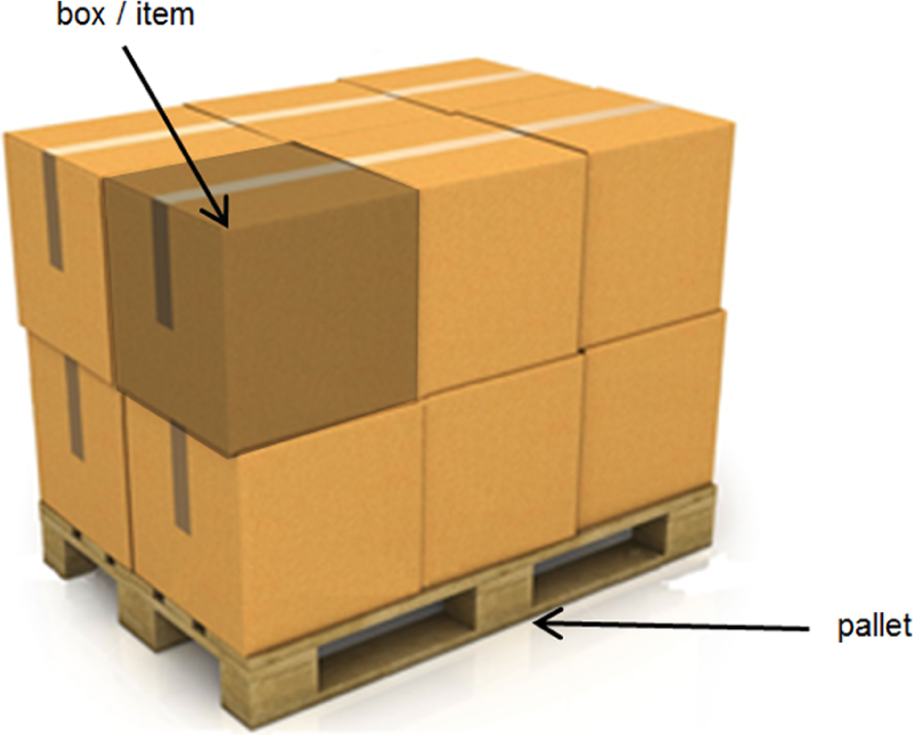
Lot-pallet configuration.
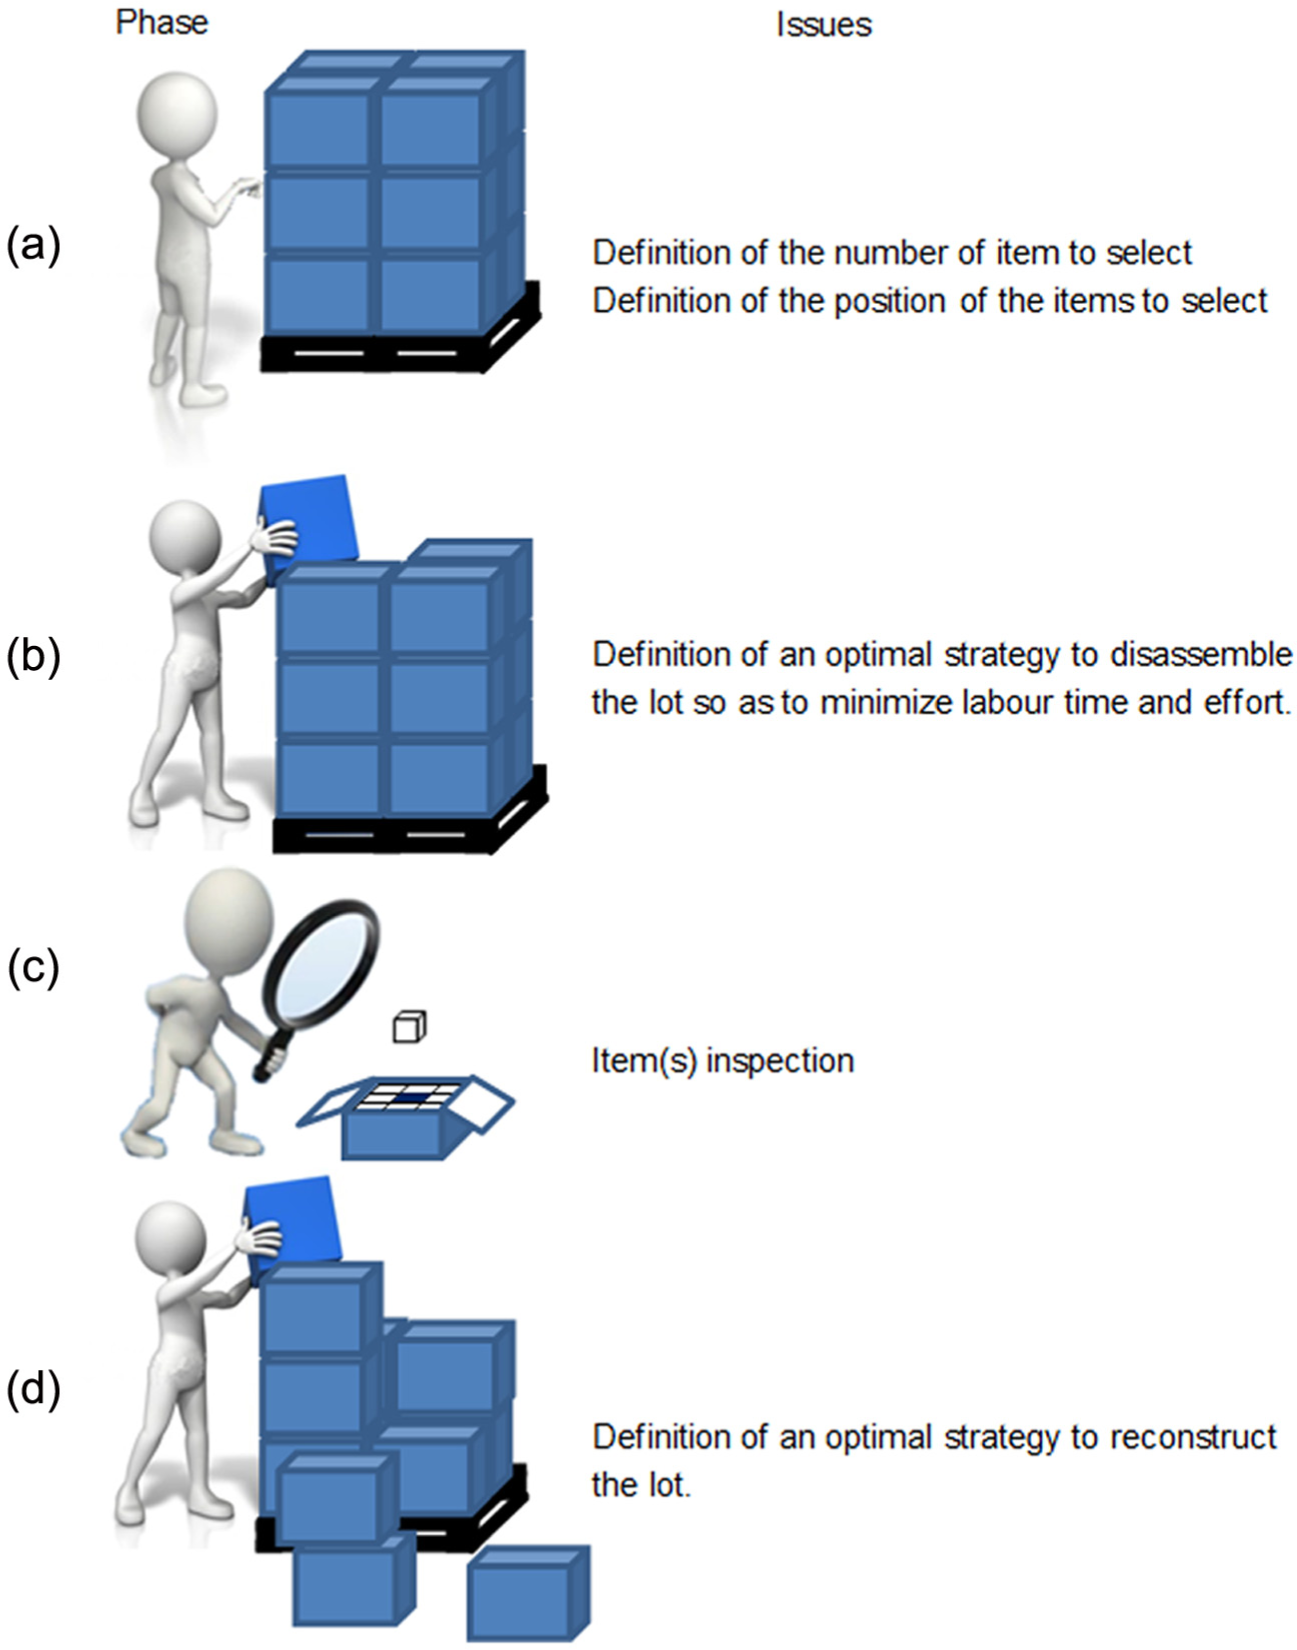
Typical phases and issues of non-AAS: (a) item selection, (b) lot disassembly, (c) item(s) inspection and (d) lot reconstruction.
AAS is aimed at overcoming the limitations of the classical AS. In an AAS context, the operator is guided in his specific tasks providing real-time information, such as, for example, the number and the location of the items to inspect and/or the optimal strategy to pick them. To date, specific tags (and readers) – such as radio-frequency identification (RFID) tags or bar codes – have been used to identify, locate and track lots in warehouses or throughout production lines. Although this technology is mature and widely adopted, alone it is not able to fully assist AS procedures due to its intrinsic limitations.20–22
AR techniques can be seen as a complementary tool to enhance AS systems, enriching the operator’s perception of the reality with additional information for guiding the sampling activities (see Figure 4). However, to be effective, they have to be minimally invasive, preferably inexpensive and not requiring particular hardware infrastructures.
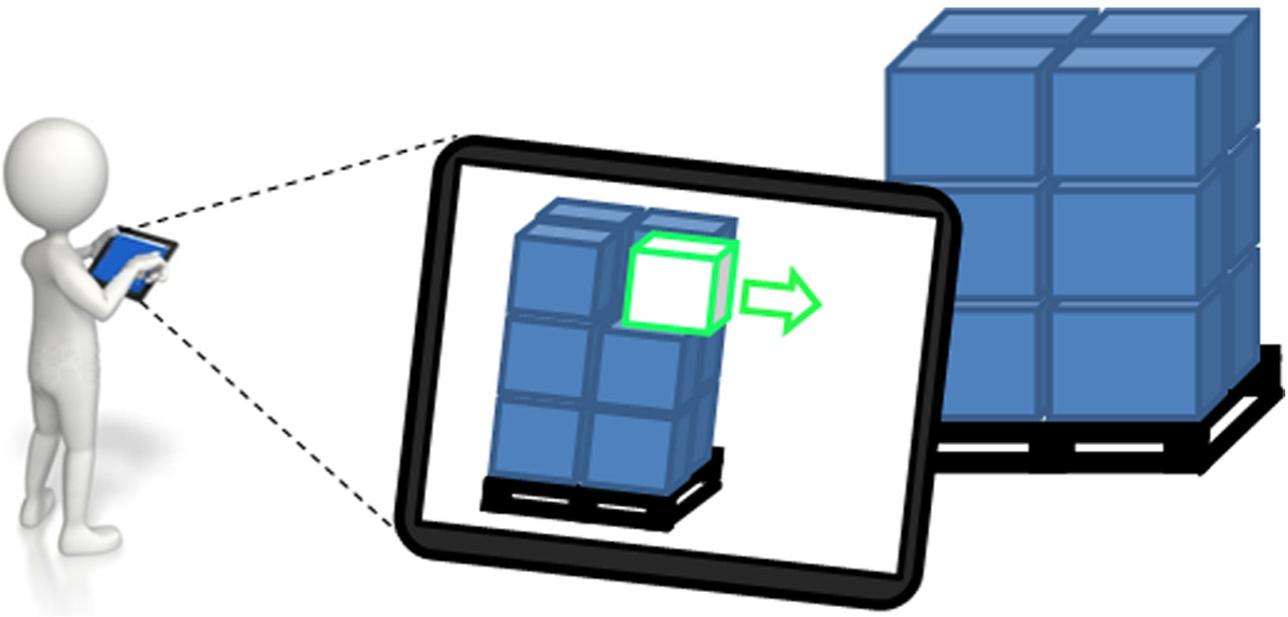
Schematization of the paradigm of AAS.
In the following sections, we describe the design and implementation of a first prototype developed according to the requirements of a specific application. Despite this specificity, the following discussion is deliberately general so as to apply to a generic context.
In detail, the prototype tries to solve the problem of tracking a generic lot-pallet, locating and identifying single the items, also guiding the operator in AS process selection.
Prototype implementation
As schematized in Figure 5, the prototype was designed as composed by two elements:
An image processing unit embedding an image acquisition device (i.e. a standard low-cost camera);
A pallet equipped with some markers, to be recognized by the image processing unit.
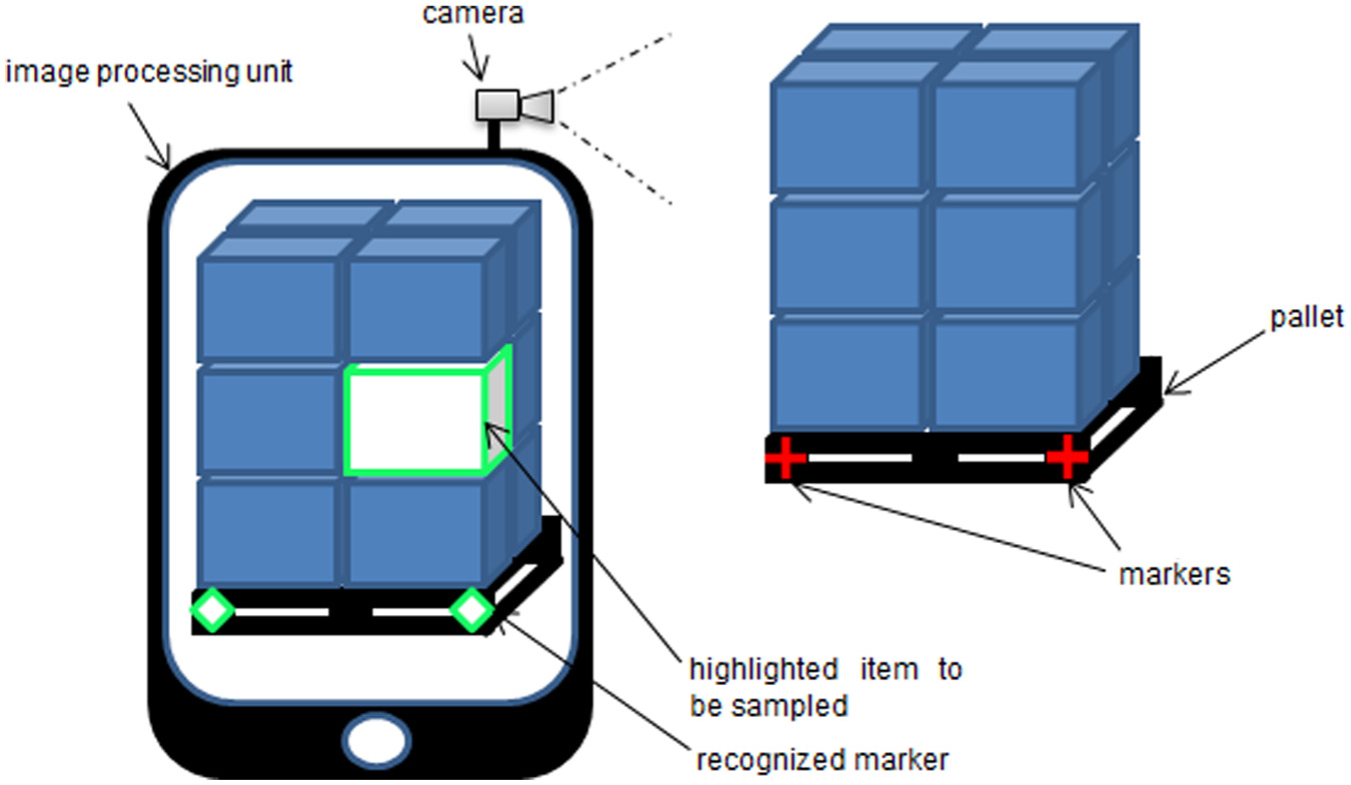
Scheme of the prototype architecture.
The idea was to realize a prototype able to manage the camera streaming so as to recognize a generic production lot, highlighting the items to be sampled.
C++ language was used as programming platform due to its large variety of graphical and image processing libraries. In detail, current implementation uses ARToolkit and OpenGL libraries.23,24 A tablet with an Intel® i3 processor and 4GB RAM was used as a preliminary processing unit. Two different cameras were used to test prototype performance (see section ‘Factor screening’).
A simple selection algorithm able to suggest the boxes to sample was implemented. To make the implementation more efficient and robust, a set of markers placed on the base of the pallet was used (see Figure 6). Being different from each other, markers make it possible to identify each side of the lot-pallet univocally. The choice of using artificial markers is not a relevant constraint in this kind of application: markers are simple labels which do not obstruct the normal functionality of pallets (e.g. when handled by a forklift, pallet jack and front loader). Markers were simply glued onto the pallet in a simple and fast way.
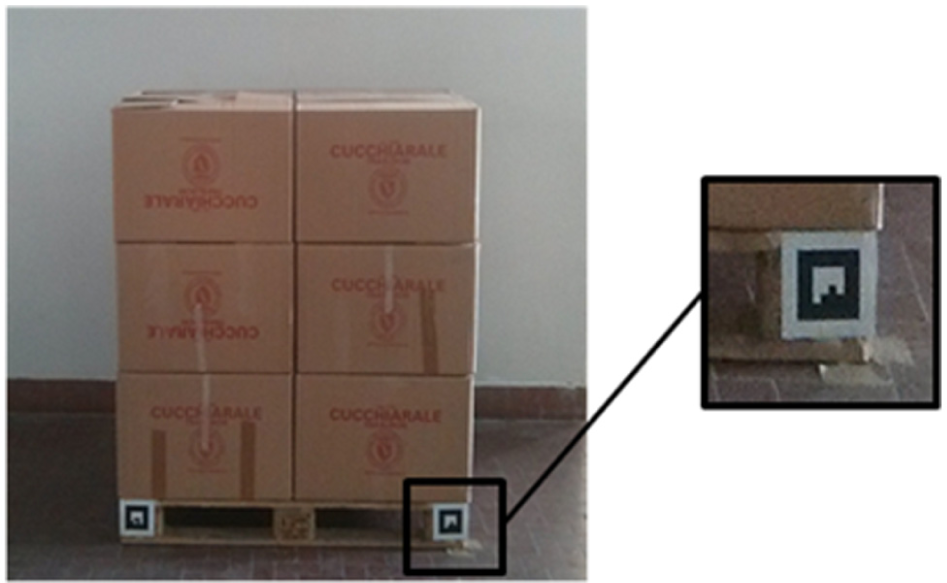
Image of a lot with the detail of a marker.
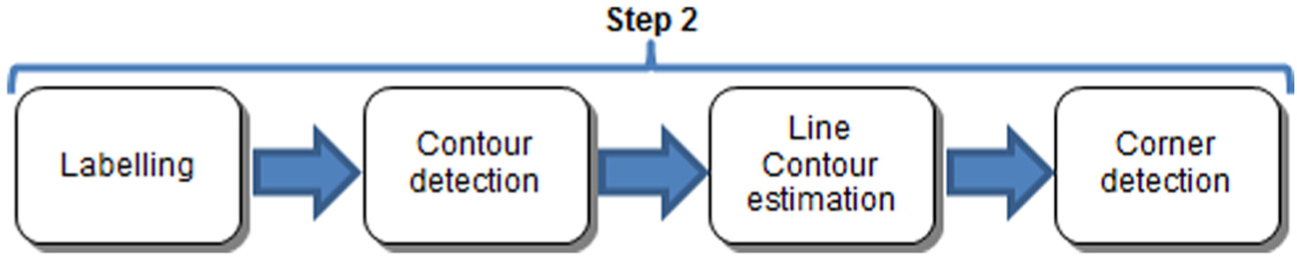
Figure 7 synthetically shows the main steps of the implemented algorithm. Their logic is explained in the following sections by means of some graphical examples. Particular attention is paid to the third step (i.e. transformation matrix estimation), which constitutes the core activity of the whole implementation.
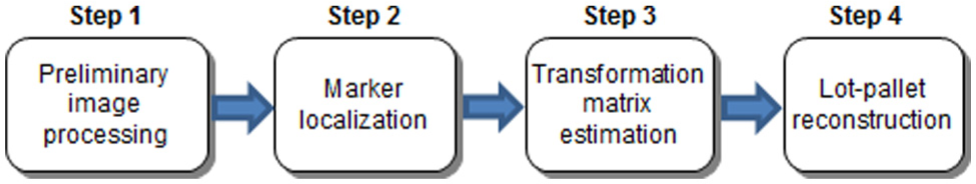
Schematic flow chart of the preliminary tested procedure.
Step 1 – preliminary image processing
This phase is aimed at capturing a frame/image from the camera and performing some preliminary image processing, that is, the image is converted to black and white, improving the contrast for easing the subsequent processing phases. The optimal threshold value for the black and white conversion is automatically estimated by the analysis of the image features. 25 Figure 8 shows an example of black and white conversion.
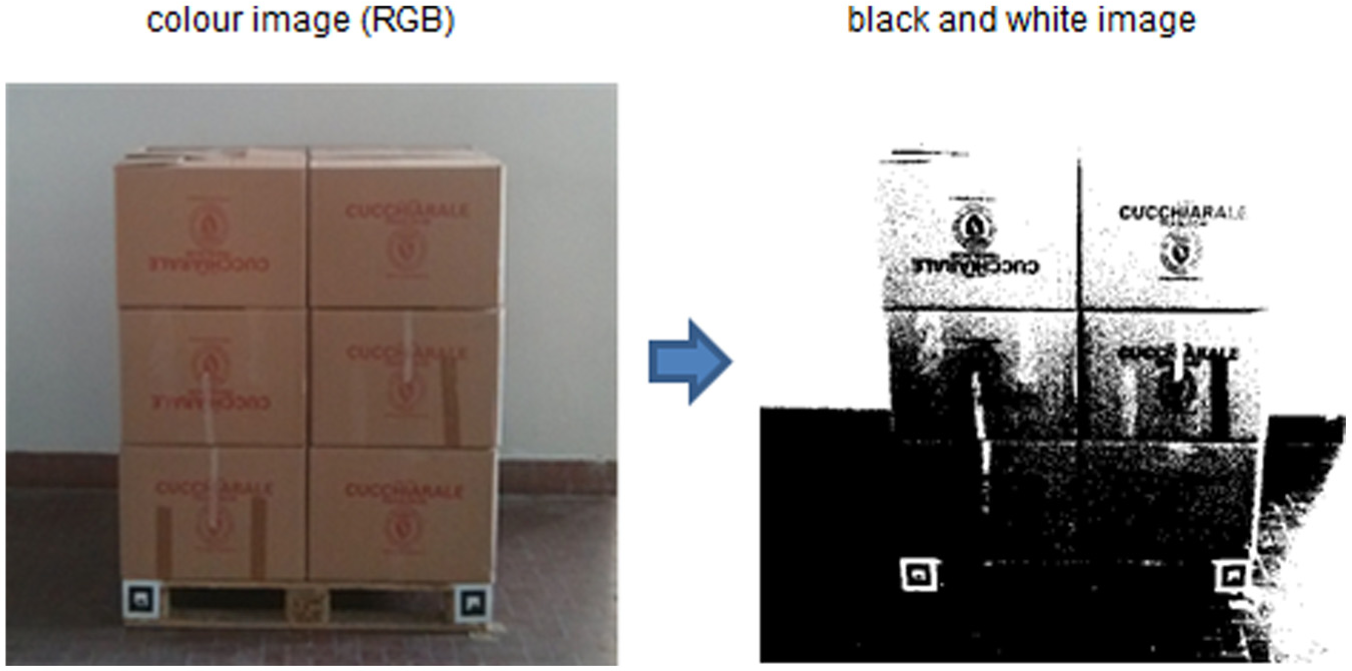
Step 1 – example of preliminary image processing.
Step 2 – marker localization
The purpose of this step is to identify the position of the markers in the captured frame. This phase can be in turn divided into further steps, as described by Figure 9.
Step 2 – flow chart of the marker localization phase.
At this stage, the black and white image is processed for identifying and extracting the so-called ‘connected component’, that is, the regions of the image that are characterized by connected boundaries.26,27 The approach here selected is that proposed by Samet et al. 28 which proved to be robust and efficient.
After identifying the connected boundaries in the analysed frame, the regions for which the outline contour can be fitted by four line segments are extracted. Rectilinear segments are intersected in order to identify the corner of each marker in the frame. Figure 10 briefly summarizes these steps.
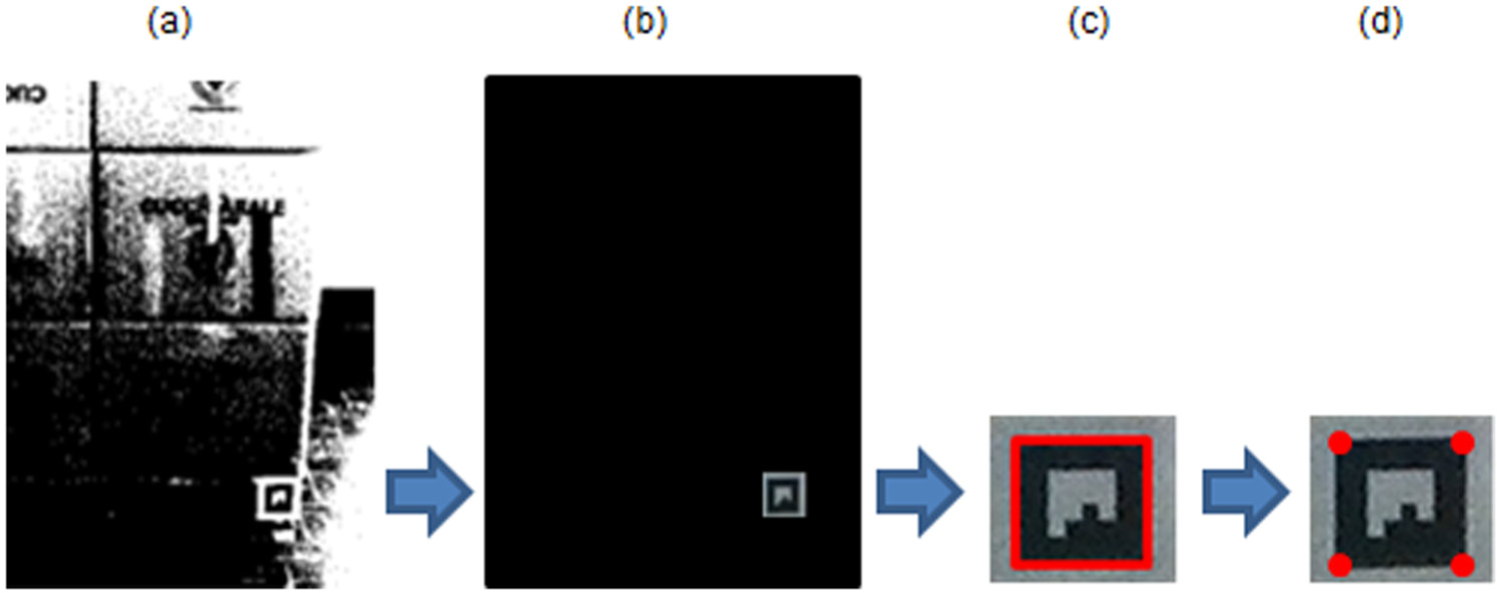
Step 2 – schematic representation of the target segmentation phase: (a) the original black and white images, (b) the extracted connected component, (c) the outline contour of the connected component and (d) the result of the intersection of rectilinear segments.
The final output of this phase is the set of two-dimensional (2D) homogeneous coordinates
Step 3 – transformation matrix estimation
The purpose of this step is to determine the relative position of the image acquisition device with respect to the lot-pallet. This step requires the a priori knowledge of (a) the relative positions of the markers on the pallet and (b) the technical specifications of the camera.
On one hand, the position of the marker on the pallet can be defined by a preliminary measurement procedure that defined a local reference system on the pallet (hereafter referred to as marker reference system), for each marker establishes the coordinates of its four corners.
On the other hand, the technical specifications of the camera are summarized by its internal parameters contained in the projection matrix
From the geometric point of view and focusing only on one marker, the problem is schematized in Figure 11, where Q is the generic corner of a marker, Q′ its projection on the camera screen and F the focal point of the camera. The aim of this phase is to estimate the transformation matrix
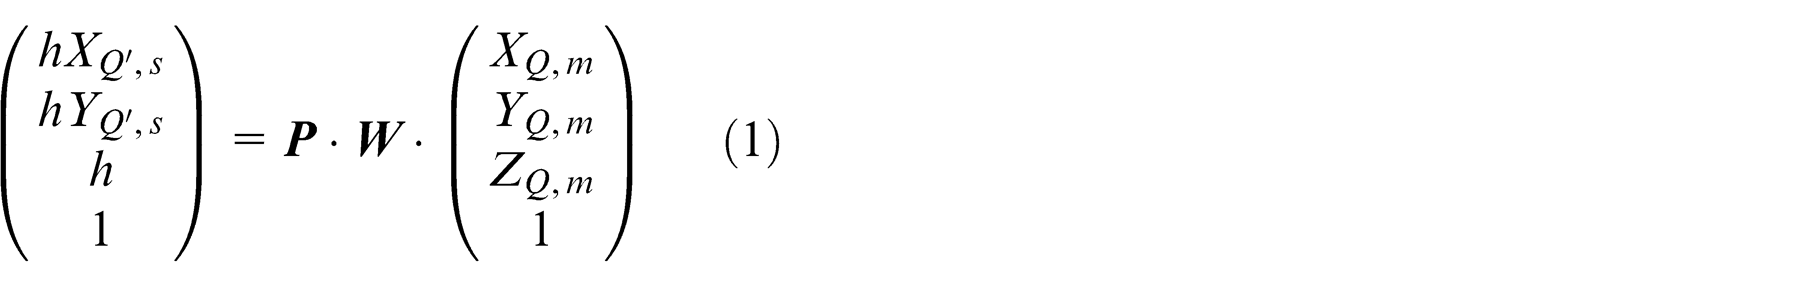
where
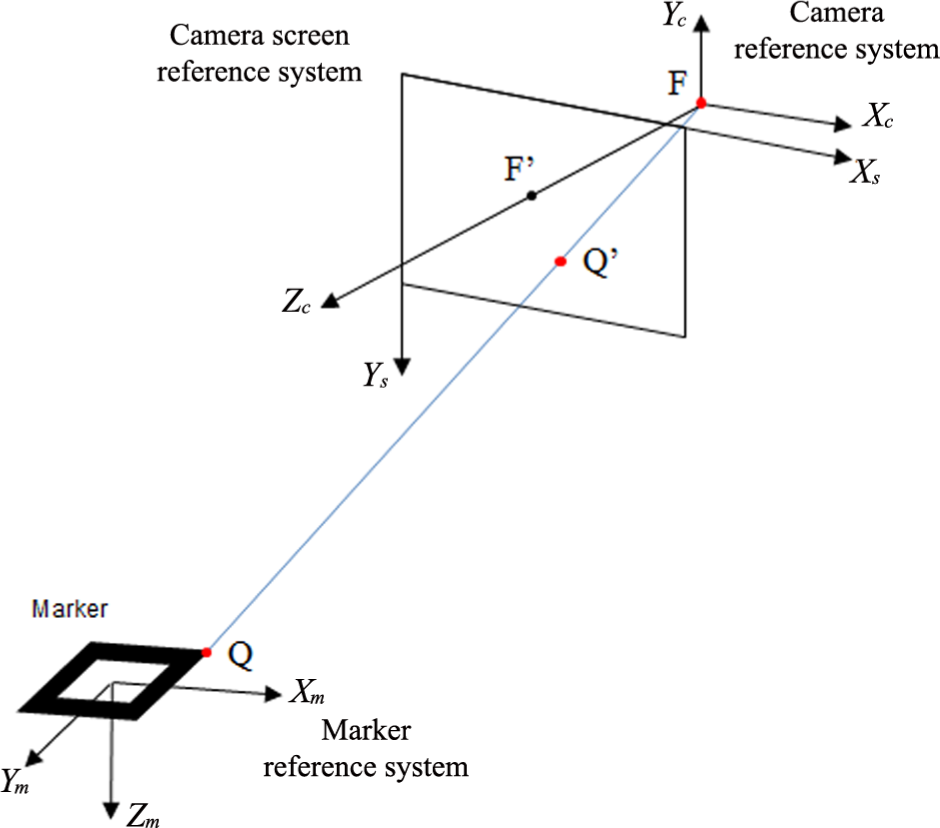
Step 3 – schematization of coordinate reference systems. F and Q are, respectively, the focal point of the camera and a generic corner of the marker. F′ and Q′ are the projections of F and Q on the camera view plane.
For a more comprehensive description of this step, refer to Appendix 1.
Step 4 – lot-pallet reconstruction
In this stage, the shape of the lot-pallet is reconstructed basing on a priori known information. In a preliminary set-up phase, the coordinates of the lot corners are defined with respect to the markers’ reference system. Say
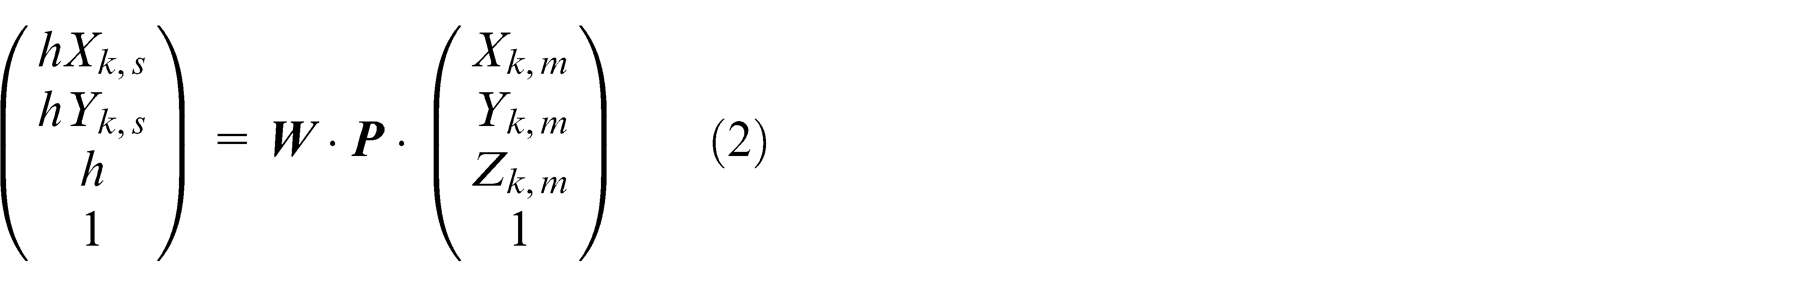
Equation (2) allows to determine the camera screen position of all the corners. A virtual representation of lot edges can be superimposed over the real image by simply plotting all the lines connecting corners. Figure 12 shows an example of lot reconstruction.
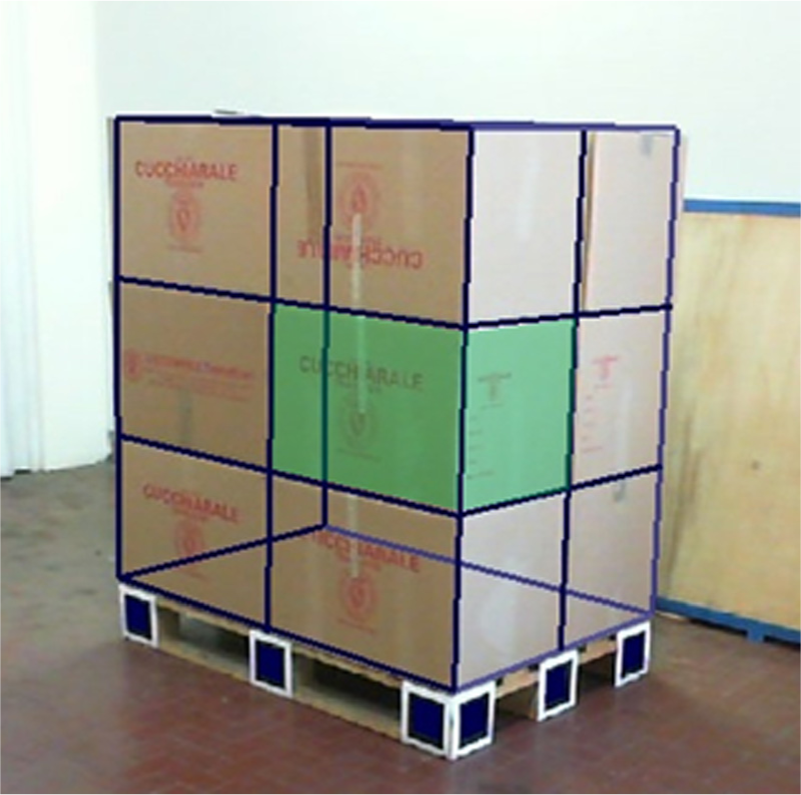
Step 5 – example of lot reconstruction.
The items composing the sample are highlighted in the graphical output in order to ease their identification and sampling.
Application example
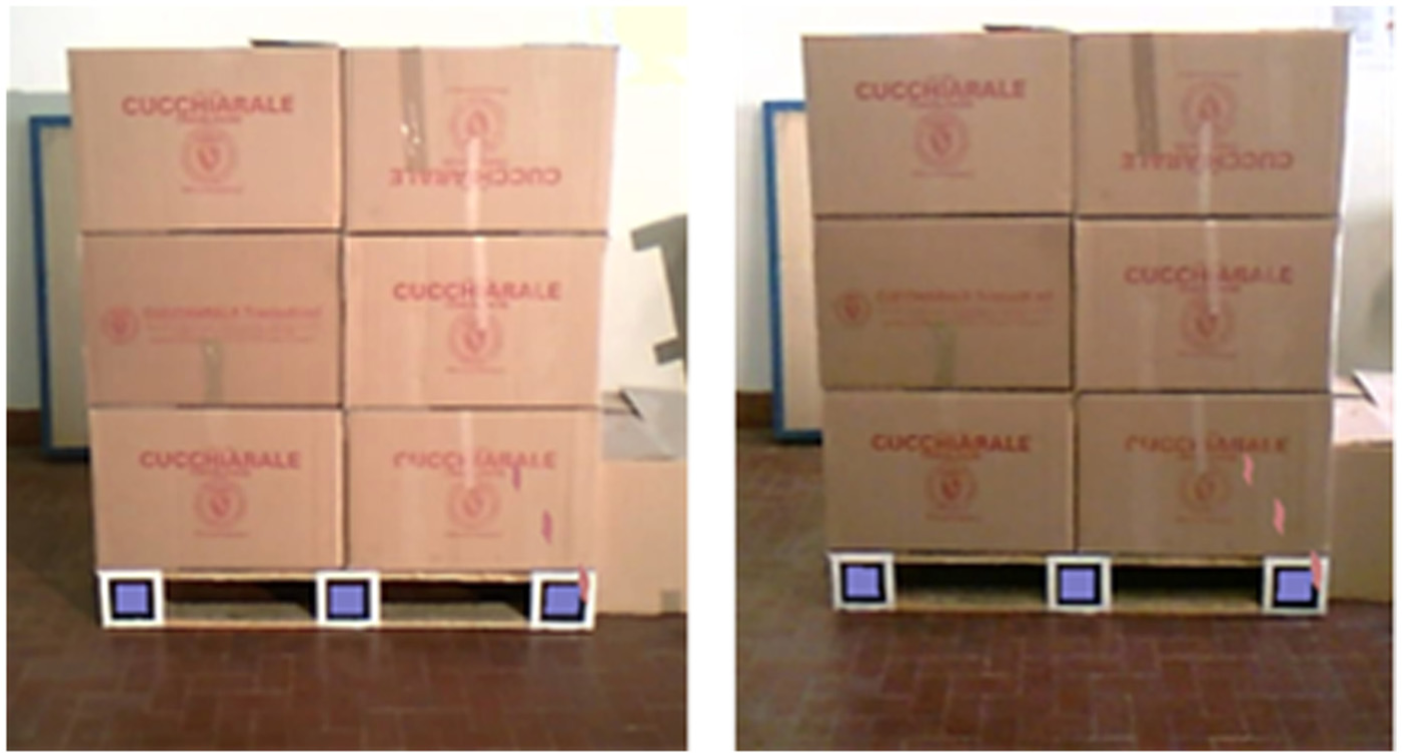
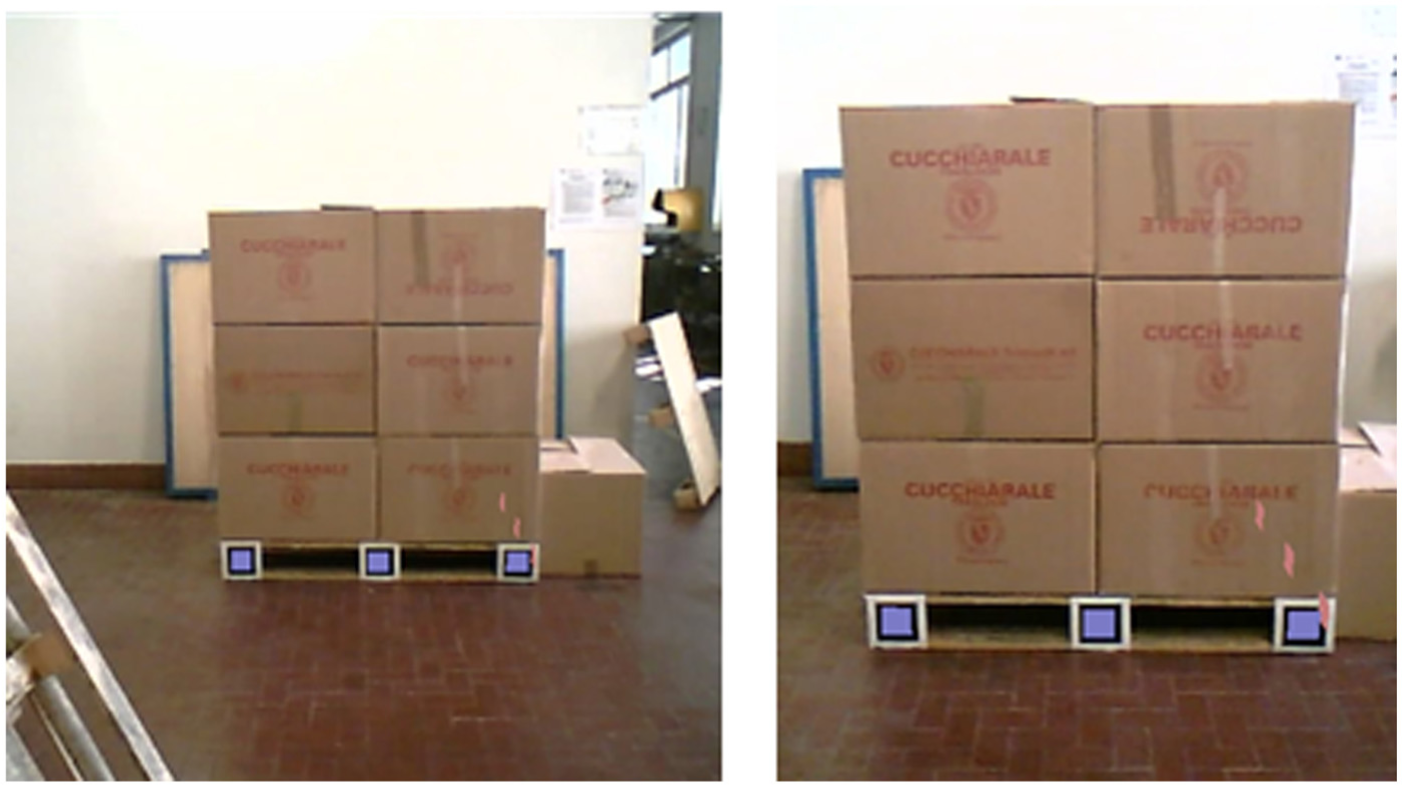
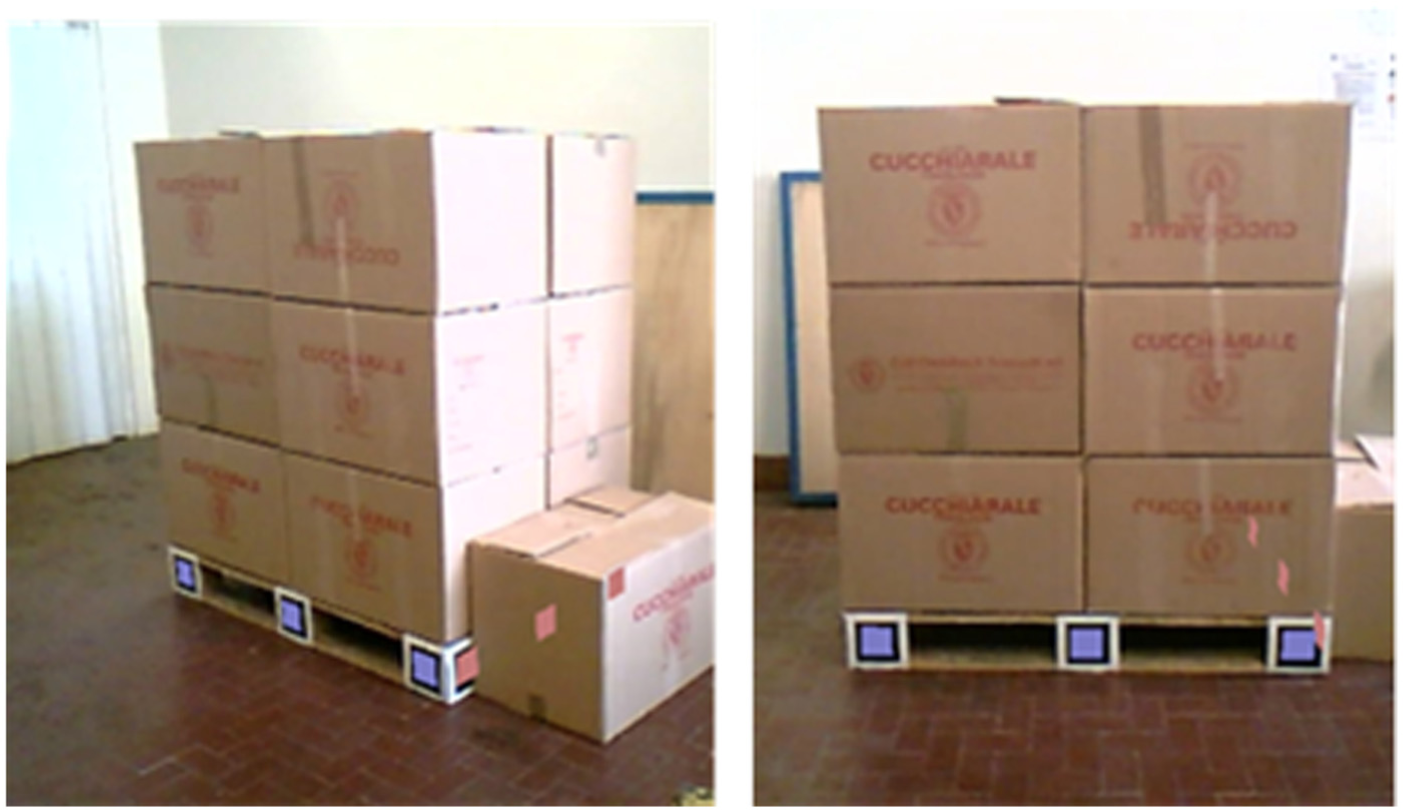
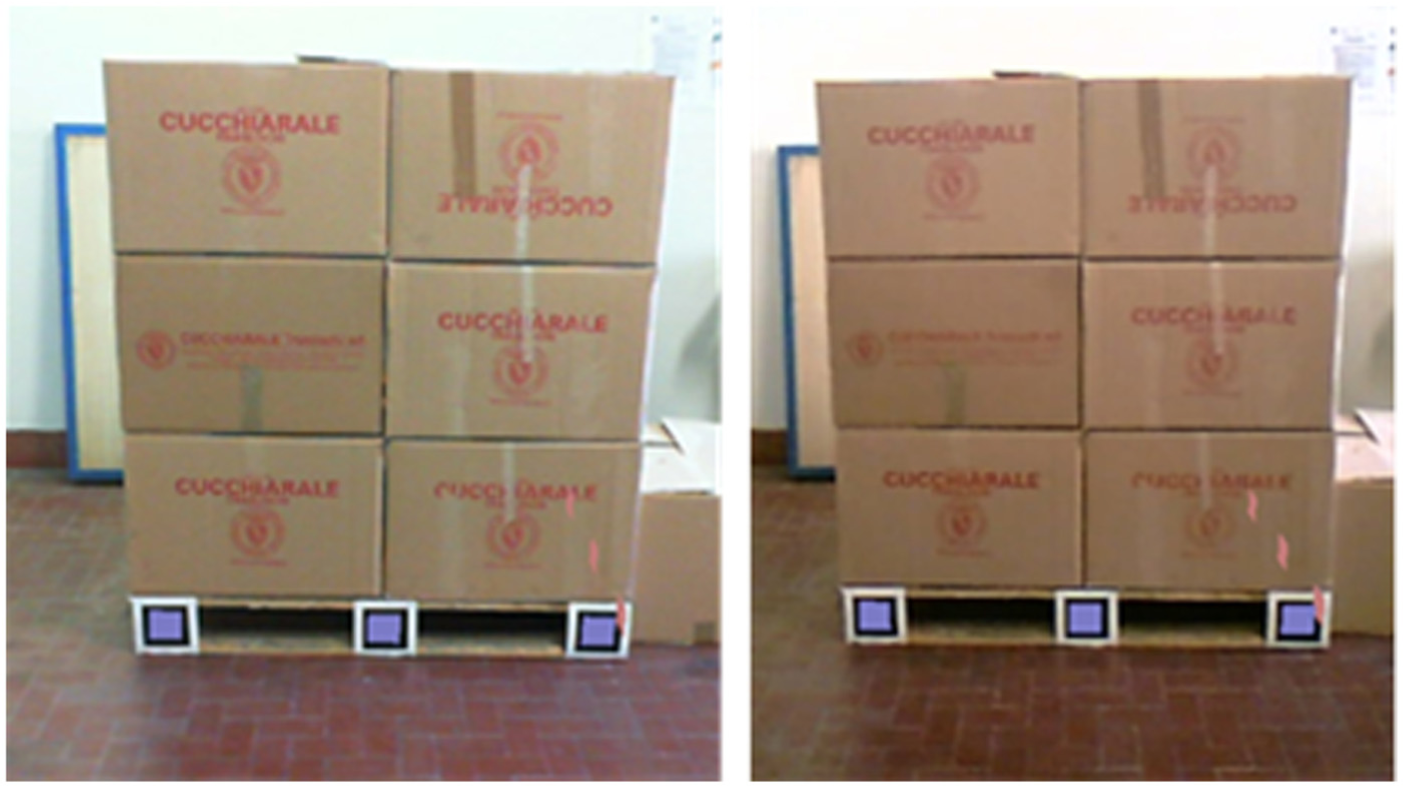
This section illustrates a few screenshots captured by the prototype, moving the camera around the lot-pallet. In this example, 12 markers (3 for each square of the pallet) were used to reconstruct a lot composed by 2 × 2 × 3 boxes. Markers highlighted in blue have been recognized by the system, while white-crossed markers not (see Figure 13(c)).
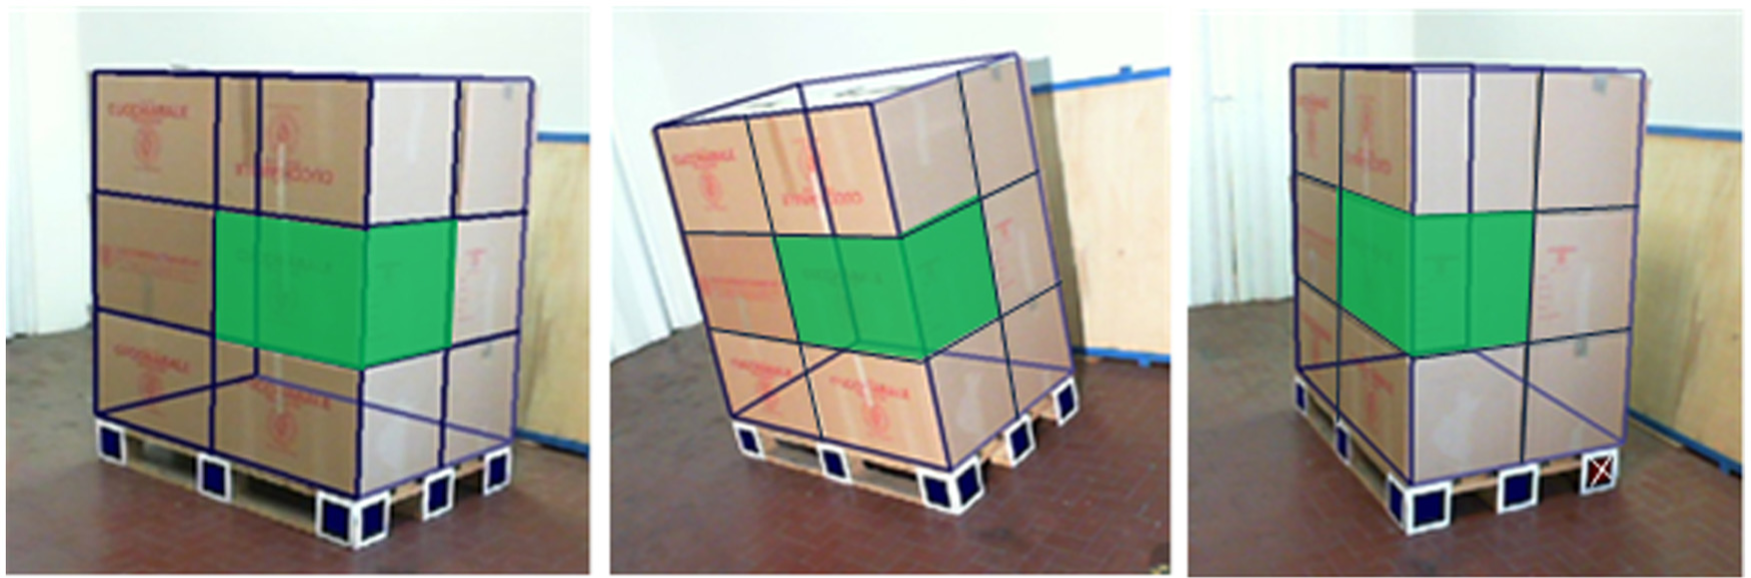
Qualitative example of system operation. White-crossed squares represent markers that are not recognized by the system.
As Figure 13 shows, the prototype appears rather robust, even if lot reconstruction is not always perfect (see for instance the upper right corner of the lot in Figure 13(b)). The accuracy of lot reconstruction is likely to be affected by several factors relating to the technology used, the environmental conditions as well as the algorithmic approach.
In order to provide a quantitative evidence of the prototype performance, next section provides some preliminary experimental results.
Factor screening
Being based on image processing, the prototype performance can be affected by a large number of different factors.
In order to establish which of these factors are particularly significant, this section proposes a screening of five macro factors that were classified as potentially important for the system. The macro factors analysed may be further decomposed into other single factors. In detail, they are as follows:
Number of recognized markers. To reconstruct the lot-pallet, the prototype requires the recognition of at least one marker. However, with the increase in the number of markers, it is reasonable to expect a better reconstruction (see Figure 14).
Light. Lighting conditions can be crucial. An optimal lighting can improve the quality of the image so as to facilitate its processing (Figure 15).
Distance. The distance between the image acquisition device and the lot compared to the size of the marker may influence the accuracy of the lot reconstruction (Figure 16).
Angle. The angle between the camera and the lot (and thus markers) may complicate the recognition of the markers (Figure 17).
Camera type. Resolution, shutter time, quality of the lens, intrinsic parameters of the camera are all parameters influencing the quality of the image, and as a consequence the performance of the system (Figure 18).
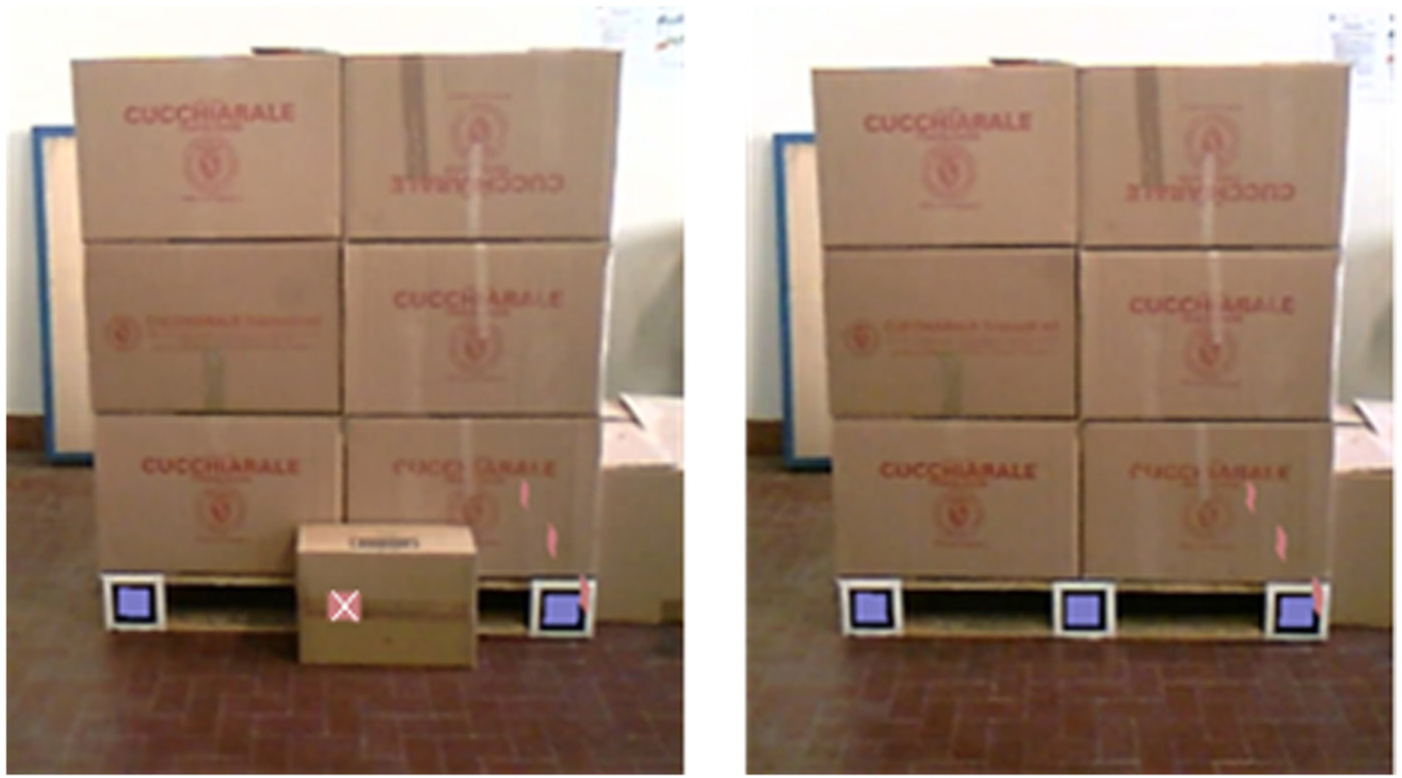
Example of images captured by the prototype with two and three recognized markers.
Example of images captured by the prototype in different light conditions.
Example of images captured by the prototype at different distances from the lot.
Example of images captured by the prototype at different angles.
Example of images captured by two different acquisition devices.
Factors screening
To test the aforementioned factors, five factors complete factorial plan with two levels for each factor (i.e. 25 factorial design) and three replications were designed. In the experiments, the prototype was used to reconstruct a lot consisting of 2 × 2 × 3 boxes as the one exemplified in Figure 13. The dimensions of each box are 60 × 40 × 40 cm, while that of the pallet are 120 × 80 × 15 cm.
Factors were varied in a total of 25 ×3 = 96 combinations and the test sequence was randomized using the random number generator provided by Minitab®. For each of the 96 combinations, we recorded the image captured by the camera and the resulting coordinates of the corners (
The considered response variable was the error in the reconstruction of the lot, intended as the maximum pixel distance (

As a first application, the real lot corners were defined manually. Although this operation may introduce an error, its magnitude is considered negligible compared to that in the lot reconstruction.
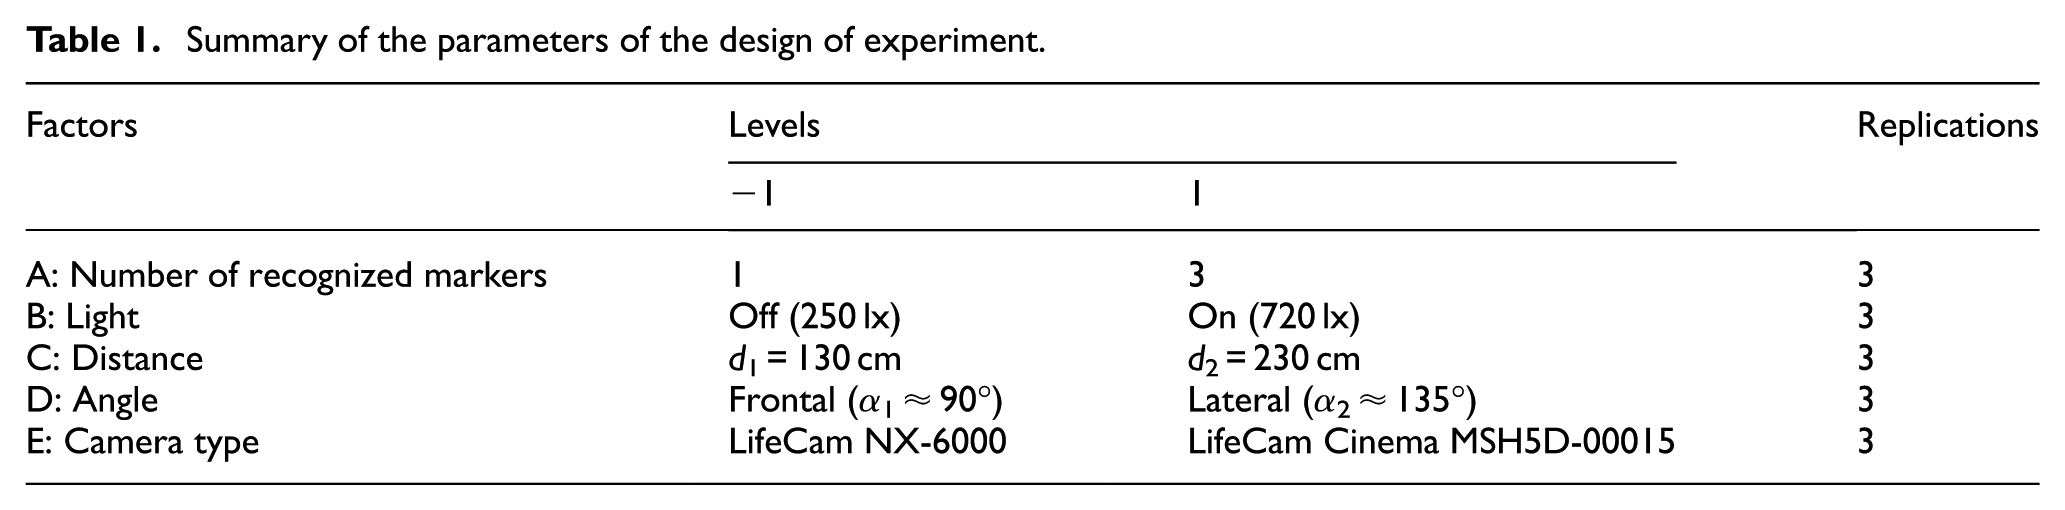
Each of the five factors was changed according to two levels. A detailed description is reported in the following:
Number of recognized markers. The prototype ideally can work when one marker is recognized. However, preliminary tests showed that more robust results in terms of lot reconstruction can be obtained with two or more markers. For this reason, one and three recognized markers were chosen, respectively, as ‘−1’ and ‘1’ level for this factor.
Light. The experiments were done in an indoor warehouse illuminated with artificial lights. A 1000-W halogen lamp was used. Two different configurations of illumination have been tested, respectively, with the halogen lamp turned off and on. These two conditions of illumination correspond to approximately 250 and 720 lx in the area in which the pallet is placed.
Distance. This factor is intended as the distance between the camera and closest marker, the two levels are d1 ≈ 130 cm and d2 ≈ 230 cm. Considering that we used square markers of side lm = 15 cm, they correspond to a ratio d1/lm ≈ 8.7 and d2/lm ≈ 15.3, respectively.
Angle. Two angulations between camera and pallet were analysed: a frontal and a lateral position corresponding to angles of about 90° and 135°, respectively, between camera axis and the closest pallet side.
Camera type. Two different cameras were tested. For both of them, the resolution was limited to 800 × 600 pixels in order to facilitate the real-time use of the prototype. The first one is the Microsoft LifeCam NX-6000 model 1082, while the second is the Microsoft LifeCam Cinema MSH5D-00015.
Table 1 summarizes the parameters of the configuration of the experimental design.
Summary of the parameters of the design of experiment.
Results analysis
The response variable is modelled as
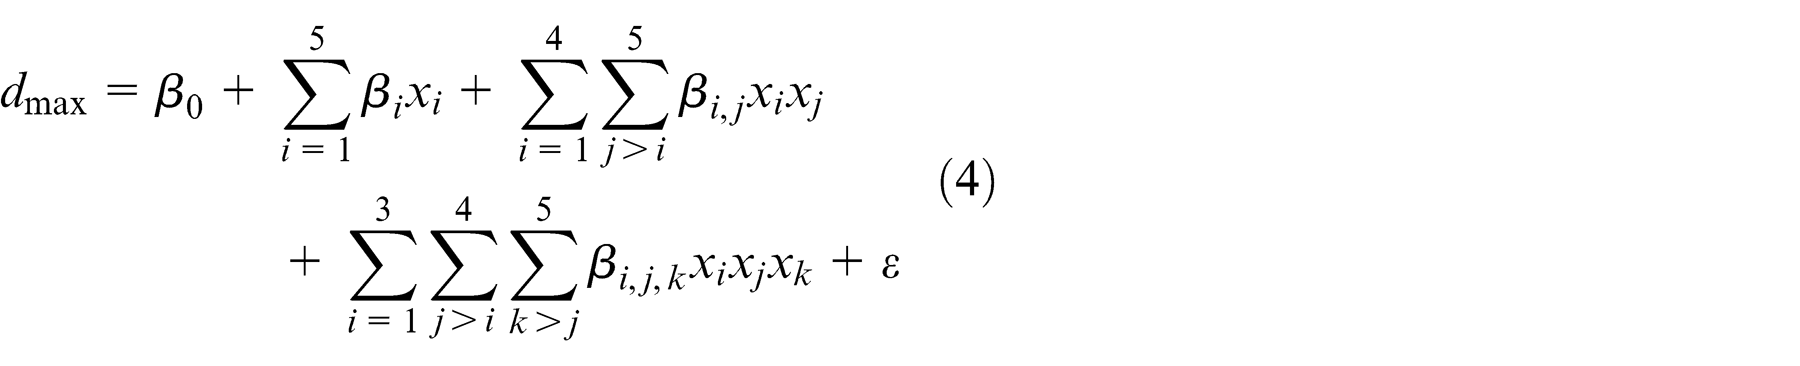
where xi with
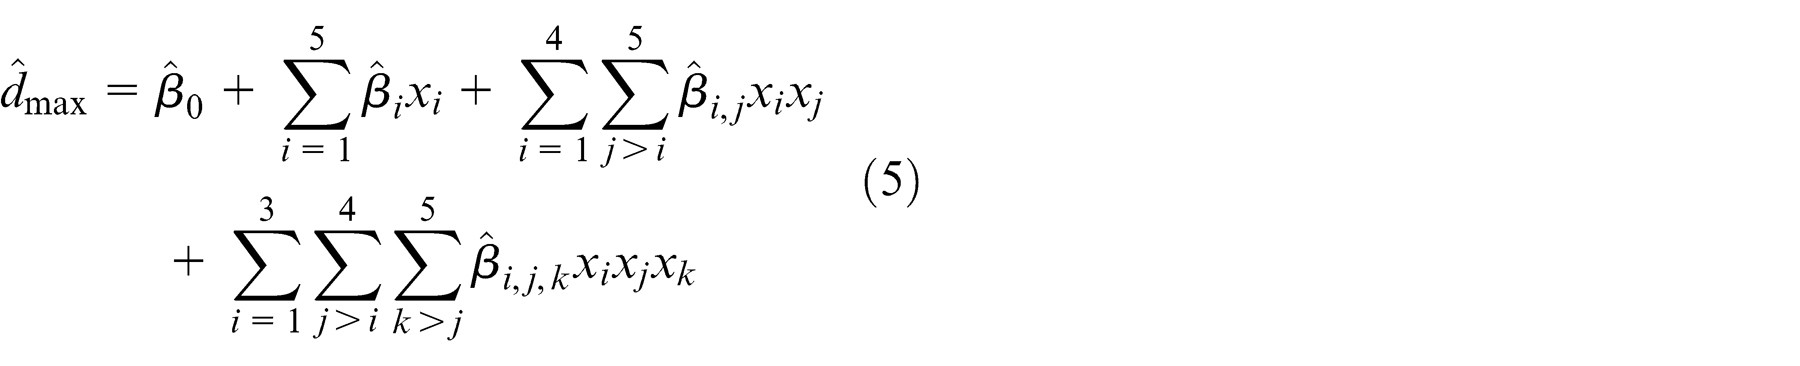
According to this notation residuals are given by

Considering the analysed combinations, a total of 96 residuals are generated. Table 2 details the output of the factorial fit of
Factorial fit:
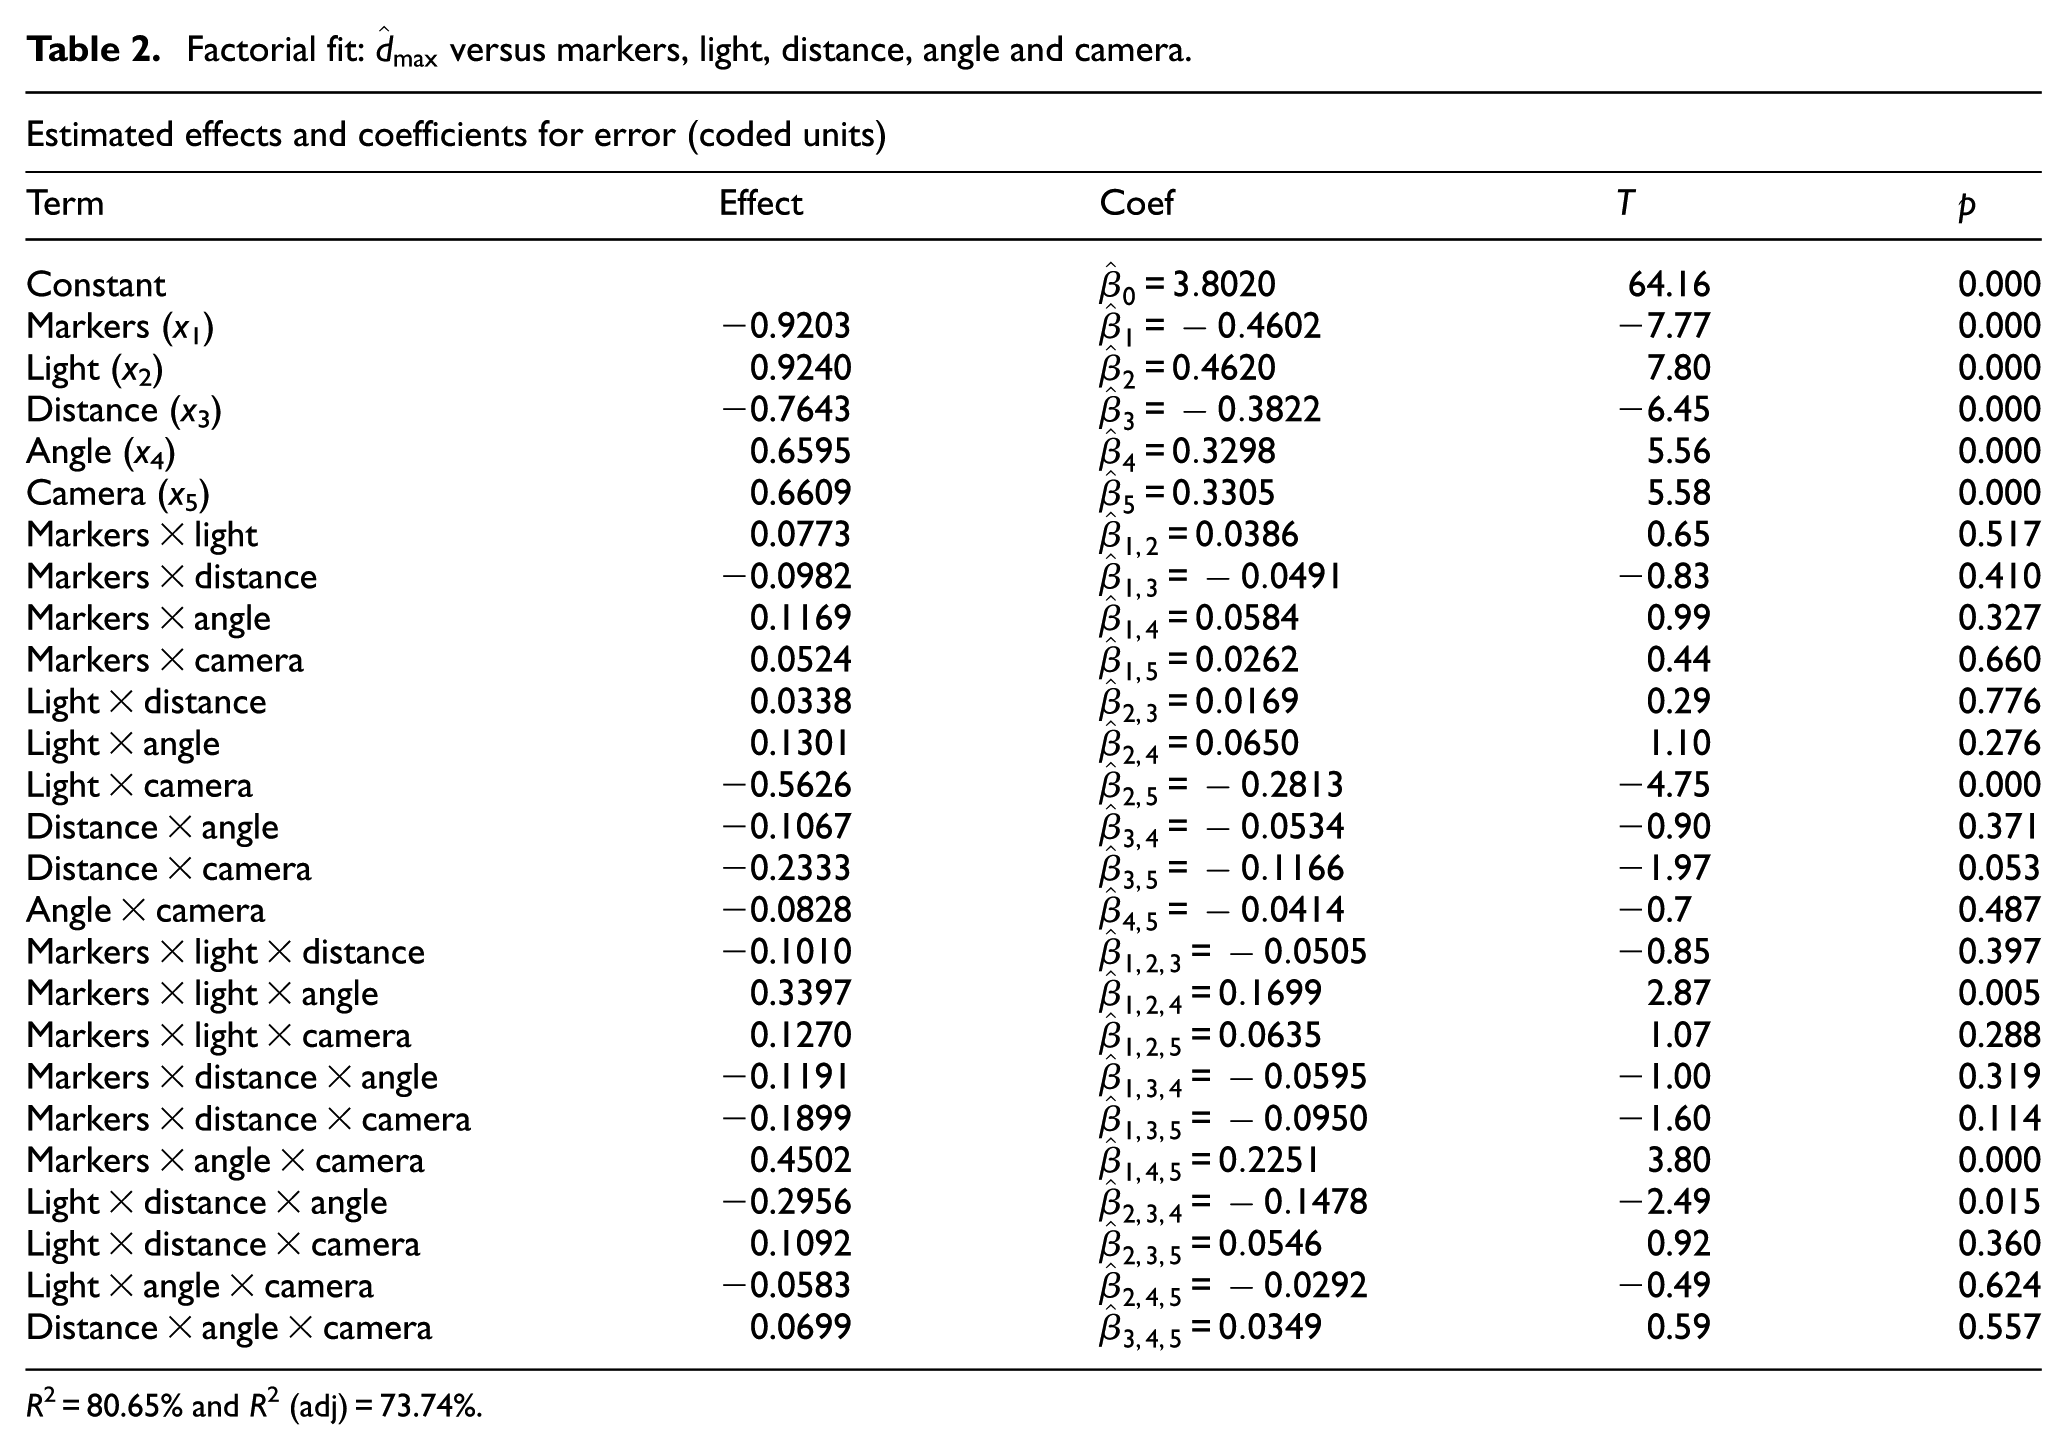
R 2 = 80.65% and R2 (adj) = 73.74%.
The high value of R2 (>80%) indicates the goodness of fit of the model. This consideration is also supported by the value of the adjusted R2 (∼74%) which gives the percentage of variation explained by only those factors (and interactions) that really affect
Also, the analysis in Figure 19(a) shows the normal distribution of the residuals which is further confirmed by an Anderson–Darling test. The homogeneity of residual distribution was tested with respect to all the analysed factors. As an example, Figure 19(c) reports a plot of
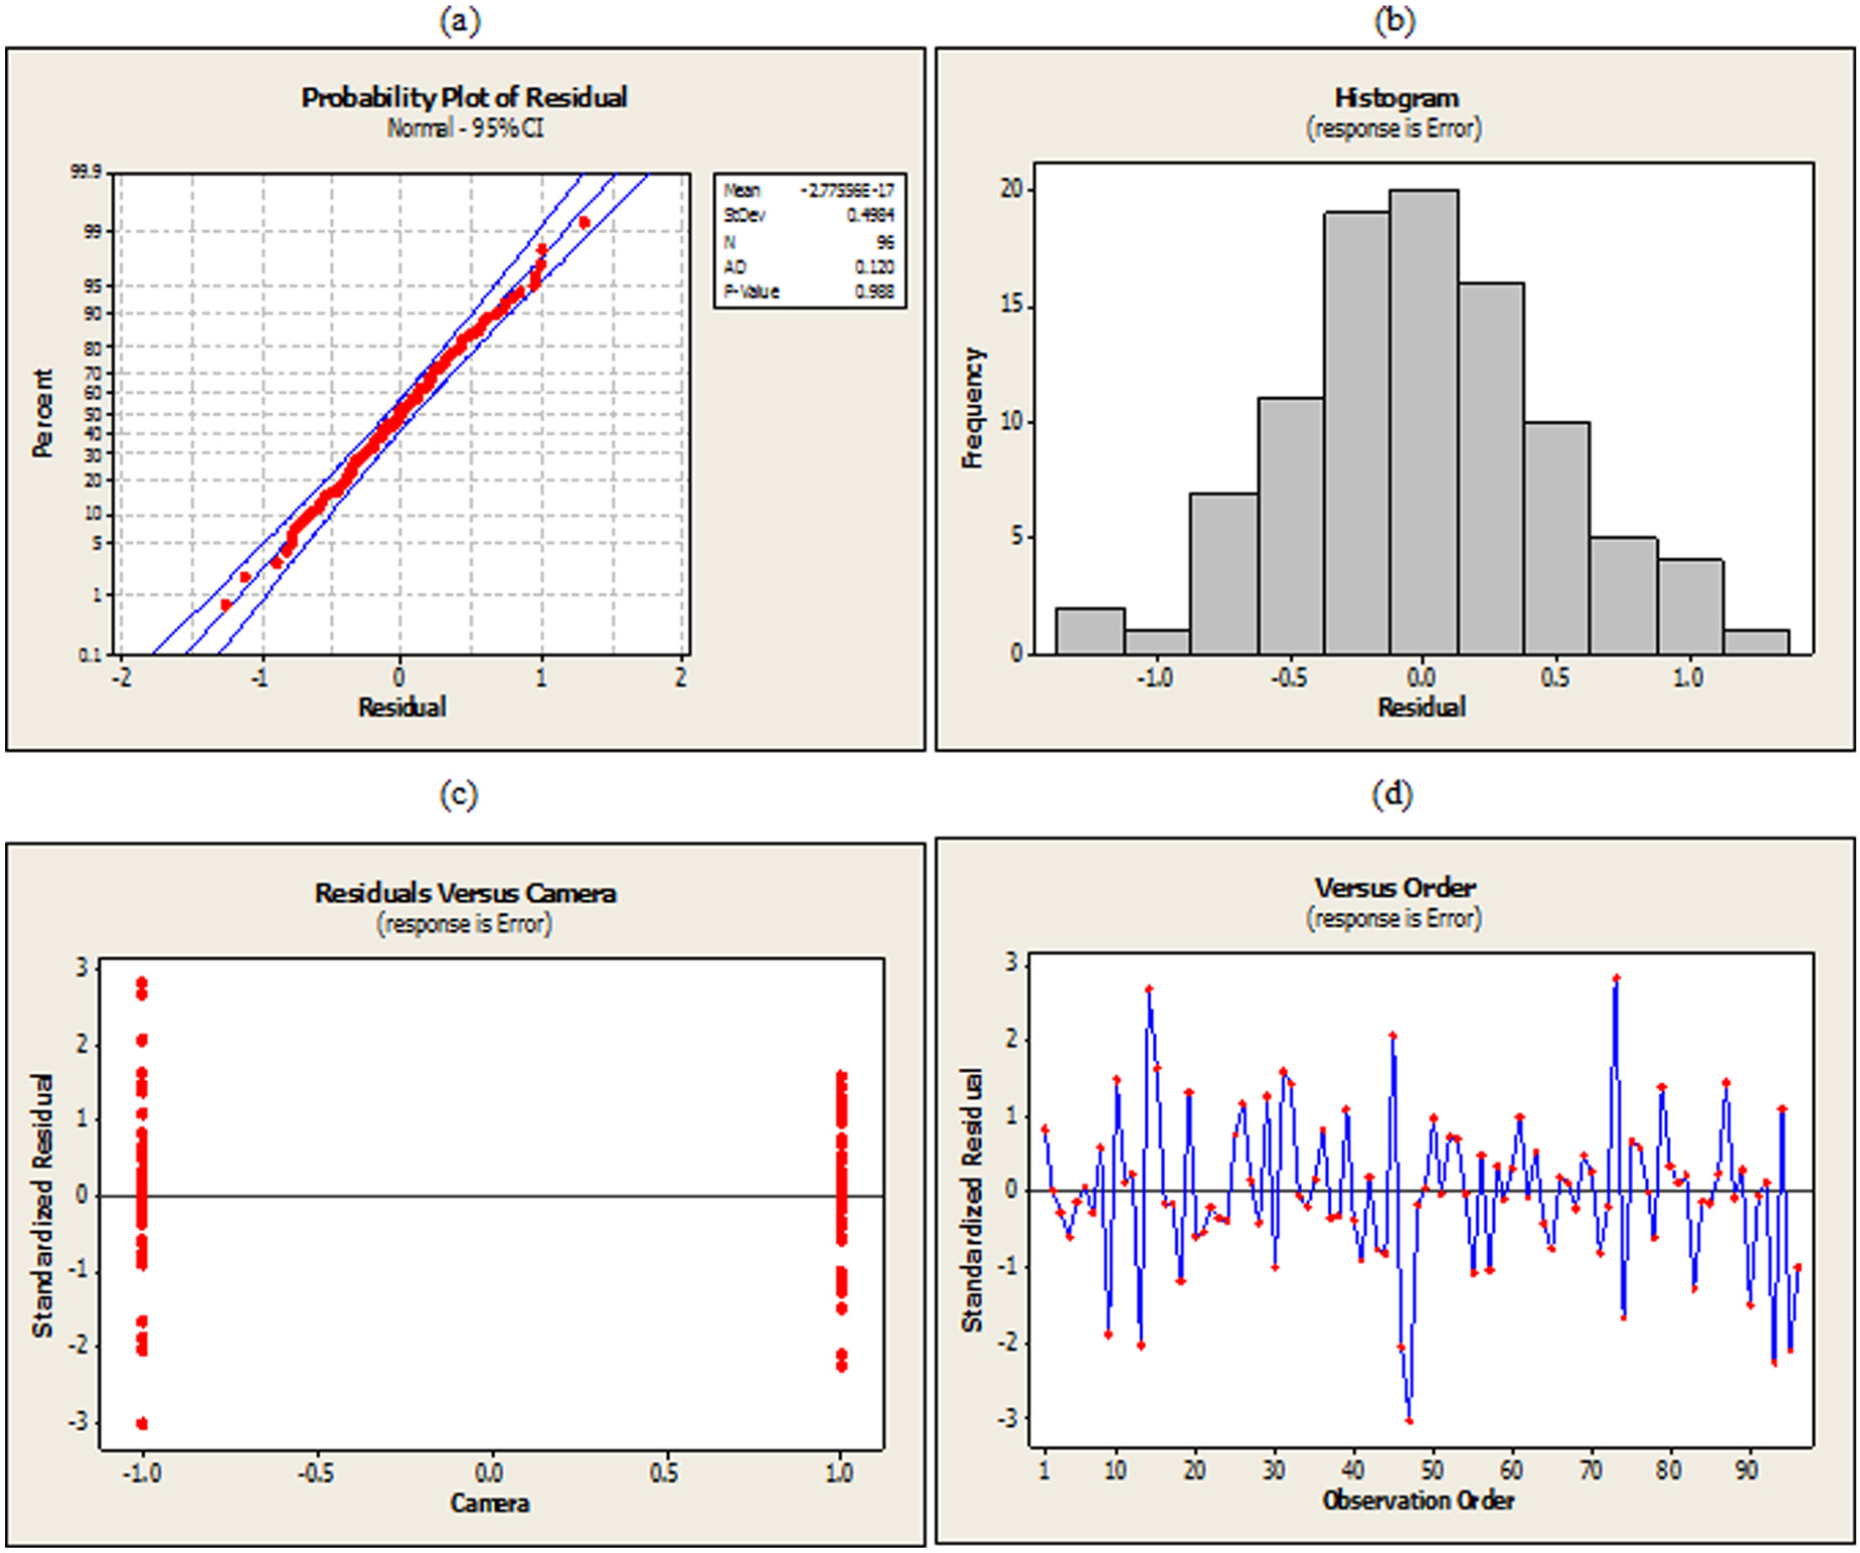
Residual analysis: (a) normal probability plot, (b) histogram of residuals, (c) residual versus camera and (d) residual versus order plot. Residual are expressed in pixels.
The factorial fit shows which factors and interactions are significant. These results are further confirmed by the main effects plot and the interaction plot for the response variable (see Figure 20).
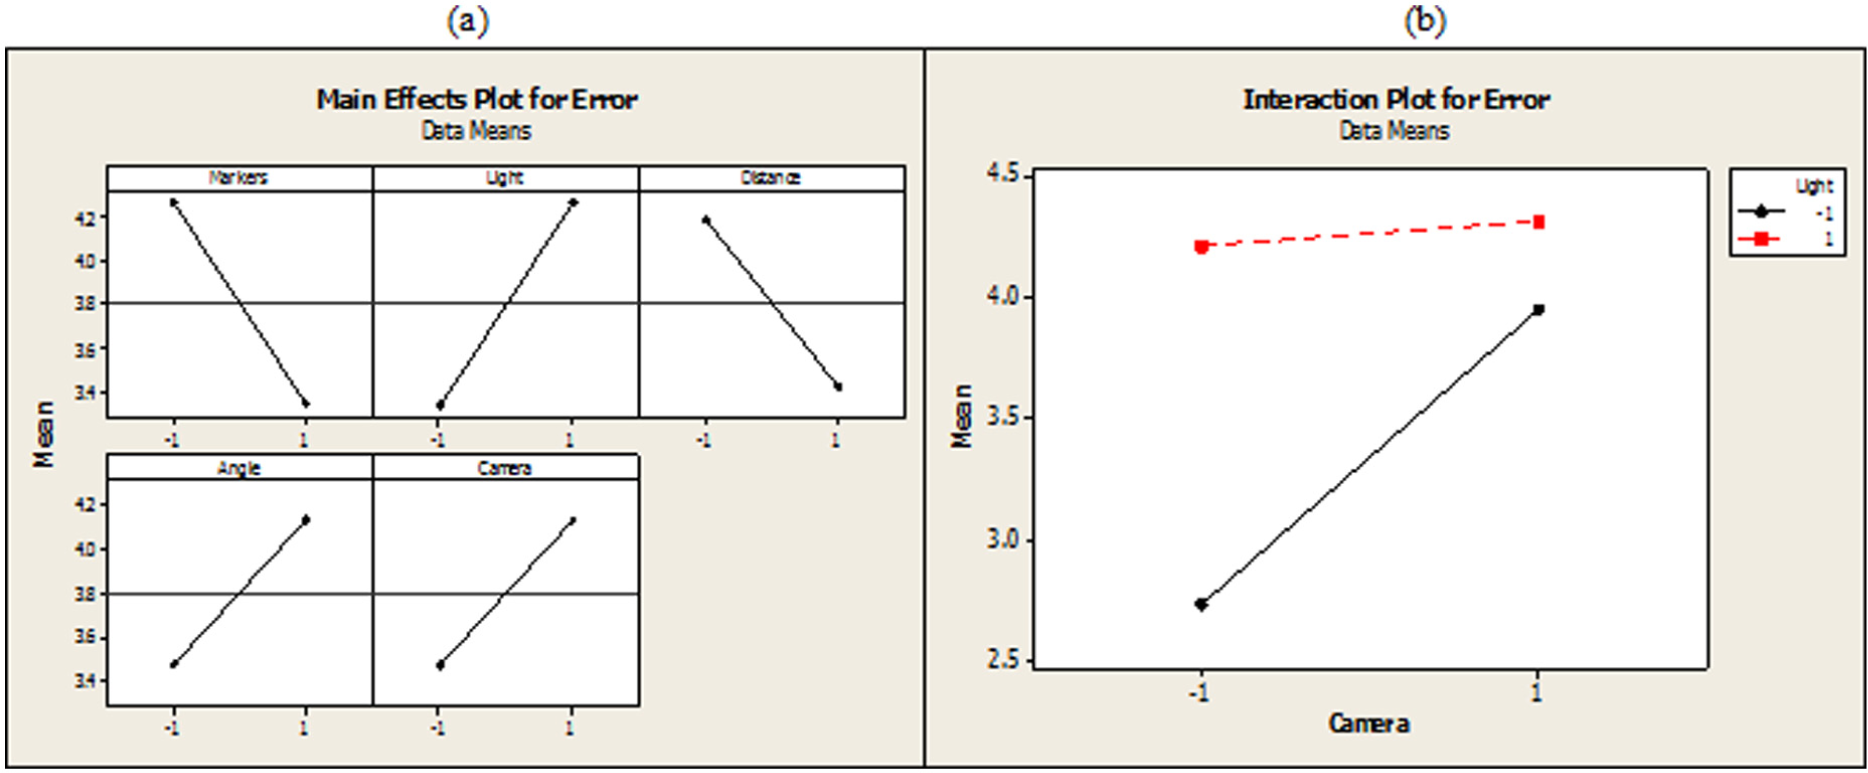
(a) Main effect plot for the mean of the design of experiment response variable and (b) interaction plot for the mean of the response variable versus camera and light factors.
In order of importance, light is the most significant factor. Surprisingly, excessive lighting of the scene can significantly worsen the performance of the prototype. This is probably due to the fact that the recognition of a marker is done by isolating a sub-image based on the white frame surrounding each marker (see section ‘Step 2 – marker localization’). Increasing the lighting may generate an overexposed image with many ‘white’ parts which may complicate the recognition of the markers. In this case, it would probably be reasonable to expect an optimal value of illumination beyond which the prototype performance worsens.
As expected, the increase in the number of markers improves the performance of the prototype. Obviously, the recognition of a single marker allows the reconstruction of the lot with a lower accuracy with respect to the reconstruction obtained by the recognition of three markers.
Another important factor is distance. In general, the increase in the distance between camera and pallet results in a reduction in the reconstruction error. This is because the difference between the virtual reconstruction of the lot and the real lot is more evident when the camera is closer to the lot, and the error, in terms of pixels, is larger. Even in this case, the behaviour of the response variable is probably not linear: while increasing the distance may have a positive effect, on the other hand, it is also reasonable to expect a degradation of performance from large distances, when the markers on the pallet are not easily recognizable.
Another factor that has a significant effect is the camera type. The quality of the components and the different firmware settings of the analysed devices have a significant effect on the prototype. In this case, the second camera is the best.
The angle causes an increase in the error for images from angled perspectives. It must be noted that in these tests it was decided to use only markers on one side of the pallet. In normal use, when the camera is angled with respect to the lot-pallet, the prototype is able to see up to six markers. In order to keep under control the number of recognized markers, nine of the markers on the pallet (i.e. all markers apart from those on one side) were hidden.
Figure 20(b) shows the interaction plot for the response variable versus camera and light factors. The interaction between light and camera is noteworthy. This can be explained by the camera settings which causing different reactions to light exposure.
Three-way interactions marker–angle–camera and marker–light–angle are less important but significant. It is hard to give a practical explanation of the significance of such interactions: as for the marker–angle–camera interaction, we can think that the different types of camera – which have different lenses and settings – can react differently to shots of different markers more or less angled; considering the marker–light–angle interaction, one can imagine that depending on the angle and the marker, there are lighting conditions that allow a better reconstruction of the lot.
Being a screening, this analysis is far from being exhaustive. In particular, the behaviour of some factors, such as light or camera type, has still to be deepened. However, we remark that the maximum reconstruction error is in the order of a few pixels, that is, a tolerable value for practical applications.
Conclusion
This article introduced the concept of AAS, which entails conceiving and developing real-time tools for driving the AS operators in manual sampling operations while reducing the risk of errors due to distraction, fatigue and lack of training.
Preliminary results, concerning the implementation of a prototype, able to recognize and track a lot arranged on a pallet labelled with special markers, were presented. An experimental screening showed that the most significant factors affecting the performance of the prototype are lighting conditions, the number of markers used, the position with respect to the pallet and the type of camera used.
The good performance of the prototype implementation corroborates the fact that the proposed tool, if properly used by AS operators, may lead to remove human errors concerning the non-random selection of the sample units. A rigorous quantification of this kind of improvement, in real industrial environments, is left to further analysis.
In its current state, the main limitations of the prototype can be summarized as follows:
The system is able to recognize and track a generic lot, but a procedure for guiding lot disassembly and re-assembly remains yet to be fully developed.
To date, the prototype is only able to handle images in which at least one marker of the pallet is recognizable.
To be truly applicable, future developments of the prototype need to address and overcome these issues. Efforts in this direction would allow the application of innovative ways of performing lot-by-lot sampling in industrial environments, opening the possibility of reaching new levels of operational efficiency.
Footnotes
Appendix 1
Appendix 2
Declaration of Conflicting Interests
The author(s) declared no potential conflicts of interest with respect to the research, authorship and/or publication of this article.
Funding
The author(s) received no financial support for the research, authorship and/or publication of this article.