
Abstract
Metal foams have drawn an increasing interest especially in applications where weight and energy absorption are critical. Despite the extensive studies available on their characterization and enhanced fabrication techniques, limited work was found on the possibility of producing a porous composite foam. The objective of this article is to investigate two new synthesis techniques for manufacturing metal matrix composite foam that is, powder metallurgy and melt infiltration. Both techniques are studied using Sodium Chloride (NaCl) as a space holder in an aluminum-based metal matrix and graphene nanoparticles as reinforcements. The effect of the quantity added of both the space holder and graphene is studied using designed experiments. Although powder metallurgy provided lower baseline hardness, experimentation results suggest the superiority of the process over melt infiltration in terms of porosity and hardness. Results suggest that baseline aluminum hardness can be increased by up to 21.5% using powder metallurgy and 15% using melt infiltration. In terms of porosity, powder metallurgy porosity increased baseline more than ten folds while melt infiltration only doubled the baseline porosity. Moreover, it is easier to control the macroscopic shape, density, and distribution of the pores using powder metallurgy. It is also easier to disperse the reinforcement homogenously. Results will support several industries such as military, automotive, medical, and aerospace in developing this innovative material with superior properties and coping with their need for advanced applications.
Keywords
Introduction
Porous metal foam possesses a unique combination of properties including low density, high specific and bending strength, excellent damping capacity, outstanding energy, and sound absorption capabilities. 1 Due to these distinctive characteristics, the porous metal foam has a wide range of advanced applications such as automotive exhaust mufflers and crash absorbers, 2 ballistic armors, biomedical prosthesis, and vibration dampers in heat exchangers. 3 Despite the wide range of applications, the performance of existing foams has not been as promising. Currently, existing porous metal foams exhibit strong variation in their cell structure, localization of deformation at large cells, heterogeneity, and anisotropy that negatively affects their mechanical and functional properties. To gain full advantage of these lightweight materials, it is essential to control the macroscopic shape, distribution, density, and wall strength of the pore structure.
Another promising material that has gained researchers’ interest in recent years is reinforced metal matrix composites (MMCs). MMCs constitute a metallic matrix, generally, a lightweight metal alloy reinforced with ceramic whiskers, fibers, or particles. MMCs exhibit distinct improved properties such as good wear resistance, high specific strength, stiffness, high operating temperature, tailor-ability, and good heat conductivity compared to unreinforced metals. 4 MMC can also be customized to give the desired properties in the final product. There are several ways to produce aluminum matrix composites including powder metallurgy (PM), 5 squeeze casting, 6 melt infiltration (MI), 7 and stir casting.8,9 The most inexpensive are those manufactured via molten metal routes giving near net shape such as MI.
Although the literature is rich in research on MMC, research in terms of enhancing the performance of reinforced metal matrix composite foam (MMCF) is limited. In MMCF, hollow spheres of one type of metal are surrounded by a solid matrix of another metal. For example, Yang et al. 10 studied the effect of reinforcing the aluminum composite foam with carbon nanotubes (CNTs) which resulted in a significant enhancement in the compression and energy absorption capacity relative to pure aluminum foam. Although there are many advantages for MMCs, their high manufacturing cost has been identified as the main obstacle hindering their mass production. To reduce this cost, several problems including environmental degradation of either phase due to exposure to air/moisture, poor wetting of the reinforcement by the matrix, oxidation of the matrix, and homogenizing the distribution of reinforcement material needs to be addressed. 11 These obstacles negatively adverse the functionality of the composite resulting in structural defects like porosity, particle clustering, oxide inclusions, and interfacial reactions. A deep understanding of all process parameters would allow producing materials to be made with a predefined profile of mechanical and physical properties.
In this research, two synthesis techniques to produce aluminum matrix foam from single-phase aluminum and graphite particle reinforcements were experimentally investigated and compared, namely MI and PM. The two methods were compared based on the physical and mechanical properties of the samples produced. The effect of PM and MI process parameters and their interactions on the MMCF mechanical properties was investigated using designed experiments. The remainder of this article is organized as follows. Section II provides a summary of the surveyed relevant literature. Section III describes the materials and method used while section IV provides results and discussion. Finally, Section V concludes the paper.
Literature review
Metal foams can be classified as open-celled and closed-cell, depending on the connectivity of the cells. An open-celled porous metal consists of interconnected pores whereas closed-cell porous metal is made of sealed pores that are surrounded by thin metallic cell walls. 12 Porous materials can be made either from a pure metal such as nickel, 13 aluminum,14,15 magnesium, 16 copper, 17 or from alloys such as Ni-Al and Ni–Cr–Al, 18 Cr–Si–Ni-Mo, 19 and Cu-alloy. 20 Production methods for metal foams can be classified as a gas injection in liquid metals, PM process, 21 liquid metallurgy using foaming agents, 22 investment casting of molten metal on a leachable preform, 12 and binding agent and foaming agent. 23 The use of PM provides several advantages including finer and fully isotropic microstructure with homogenous distribution,24–26 inexpensive mass production,27,28 low defects due to porosity, 25 high material, and low energy utilization. 24 For example, Somani et al. 29 fabricated different Cu-SiC MMC compositions using PM that resulted in an increase of hardness and tensile strength by 48% and 24% respectively by adding 20% of SiC. Moreover, experiments indicated that SiC reinforcement enhances the wear resistance capacity and reduces the coefficient of friction in the Cu-SiC composite. The main disadvantages of PM are the risk of particle alignment along the extrusion axis, 25 the need for high temperature for sintering, 30 and the machinability of hard and porous material. 31
Another promising and inexpensive process for porous MMC is MI, which is mainly used for highly dense composites production. 32 The main advantages of MI are shape and size flexibility with a fully dense matrix32,33 and the ability to produce a eutectic composite microstructure. 33 Major disadvantages of MI are the need for special care during the solidification process to ensure void-free shrinkage, 33 low wetting angle, large surface tension, and a large capillary radius for easy infiltration. 32 MI has a few restrictions in terms of material choice. For example, the matrix thermal expansion coefficient has to be less than the reinforcement one. 32 MI also requires special precautions to ensure that rapid reactions between the carbon fiber and the matrix during the processing do not take place. 34
Irrespective of which manufacturing process is used, the foam characteristics depend on the process parameters involved. Several researchers varied some of the parameters to investigate their influence on the foam characteristics. Unfortunately, very few researchers, if any, considered utilizing experimental design and statistical tools to correlate process parameters to the final characteristics/properties of the foam. For example, Alinejad and Zakeri 35 developed a novel single-step manufacturing process to fabricate functionally graded porous aluminum foams. Pure aluminum and NaCl were ball-milled then mixed and pressed into a hot press mold. NaCl was removed from hot-pressed samples by soaking samples in boiling water for 2 h. Kobashi et al. 36 synthesized an open cellular porous TiAl by adding NaCl to the Ti and Al powders then compacting the mix at 200 MPa. Other researchers produced open-cell aluminum foams by infiltration of liquid aluminum into a NaCl particle bed. 37 Navacerrada et al. 38 also highlighted the importance of cell diameter to optimize the physical properties of open-cell aluminum foams manufactured by MI.
Despite the above literature, there is still a lack of understanding of the mechanisms of MMC metal foaming. Knowledge is still speculative, and some points remain unclear. A detailed understanding of key process parameters would allow designed composite foam materials to be made with a predefined profile of mechanical and physical properties. Both PM and MI techniques could be tailored to achieve a cost-effective manufacturing process of MMCF with desired properties.
Materials and methods
In this study, the effect of PM and MI techniques on the produced MMCF mechanical properties will be investigated using experimental design to recommend an optimal process. Following is a detailed description of the materials used and techniques followed to produce the composite foam.
Materials
The composite prepared and tested is composed of an aluminum matrix, graphene (Gr) nanoparticles as the dispersed phase, and NaCl as a space holder used to create pores. Aluminum was selected as a matrix material as it is the most common metal matrix composite. 14 Aluminum MMCs have excellent thermal conductivity, high shear strength, high-temperature operation, good magnetic and electric field shielding effectiveness, and the ability to be formed and treated on conventional equipment. The matrix raw material is either in powder form in the case of PM or as a cylindrical ingot, in the case of MI. Graphene was selected as reinforcement material for both processes. Graphene is a carbonaceous material with a two-dimensional structure. It was chosen because of its excellent mechanical, electrical, and thermal properties. 39
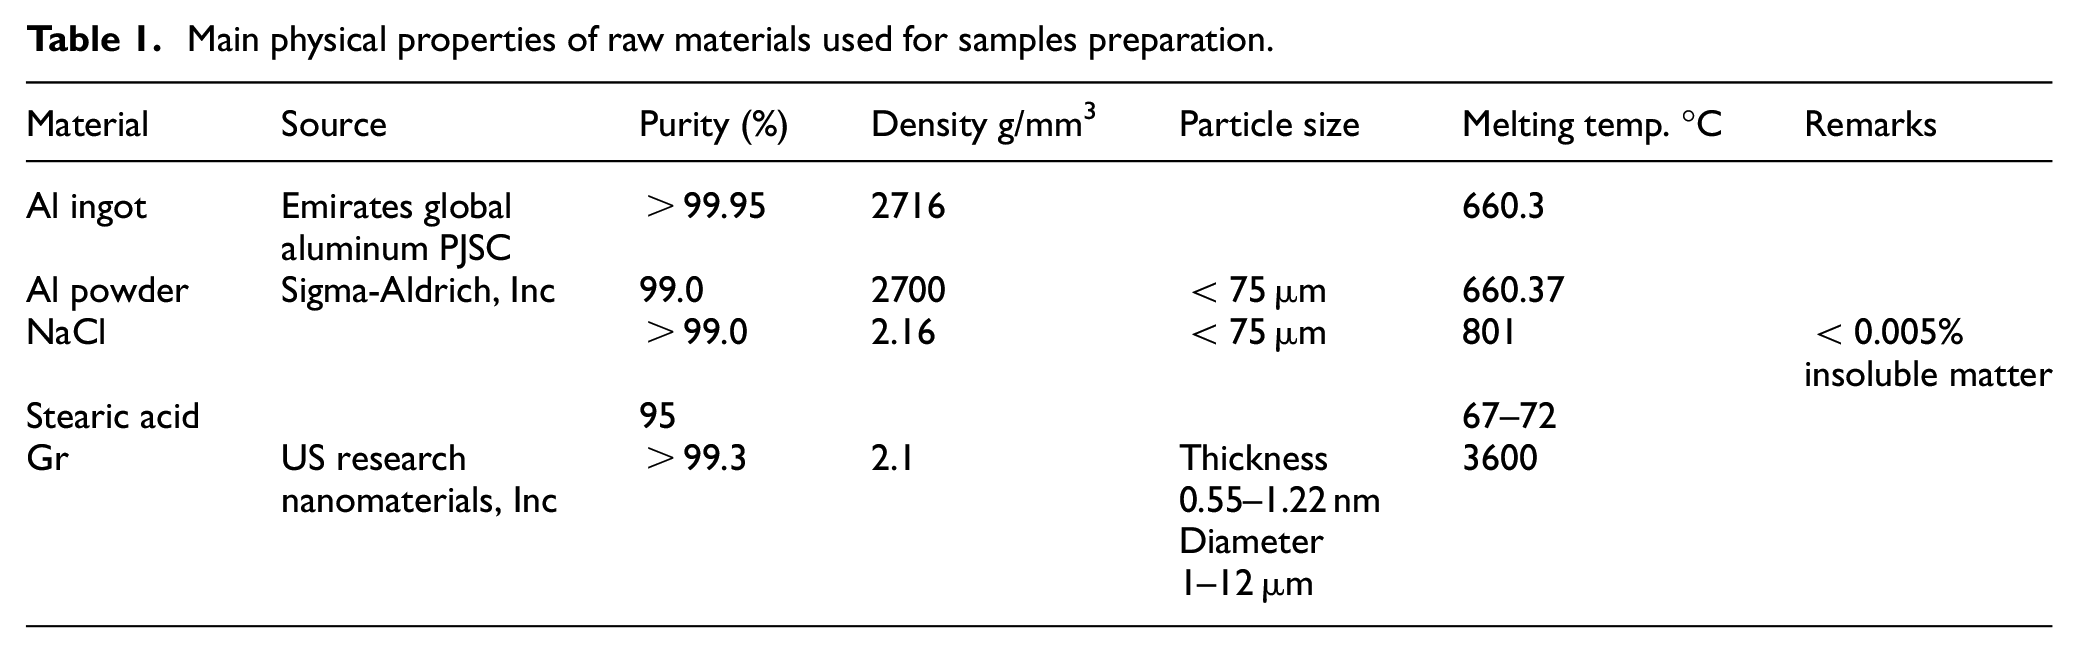
As for the space holder, three candidate materials were compared: Sodium Chloride (NaCl), Potassium Chloride (KCl), and Poly (methyl methacrylate) (PMMA). PMMA was eliminated as it will burn upon infiltration of hot liquid aluminum in the MI process, therefore hinders its ability to serve as a space holder till. NaCl and KCl offer similar properties in terms of high solubility in water and high melting temperature. However, NaCl is relatively inert to the aluminum and has a favorable density of 2.1 g/m3 compared to the aluminum density of 2.7 g/m3. As a result, NaCl was used due to its favorable properties and low cost. Table 1 summarizes the main properties of the raw materials used for both PM processes. An aluminum ingot was used for MI casting while aluminum powder was utilized for the PM process. Stearic acid was used only in the PM process as a binder as it helps in stacking during the compaction step. It is reagent grade in powder form with 95% purity and has a minimum congealing temperature of 54°C. Finally, graphene has a 2D structure with a large specific surface area of 500–1200 m2/g, a thickness range of 0.55–1.2 nm, and a diameter range of 1–12 µm.
Main physical properties of raw materials used for samples preparation.
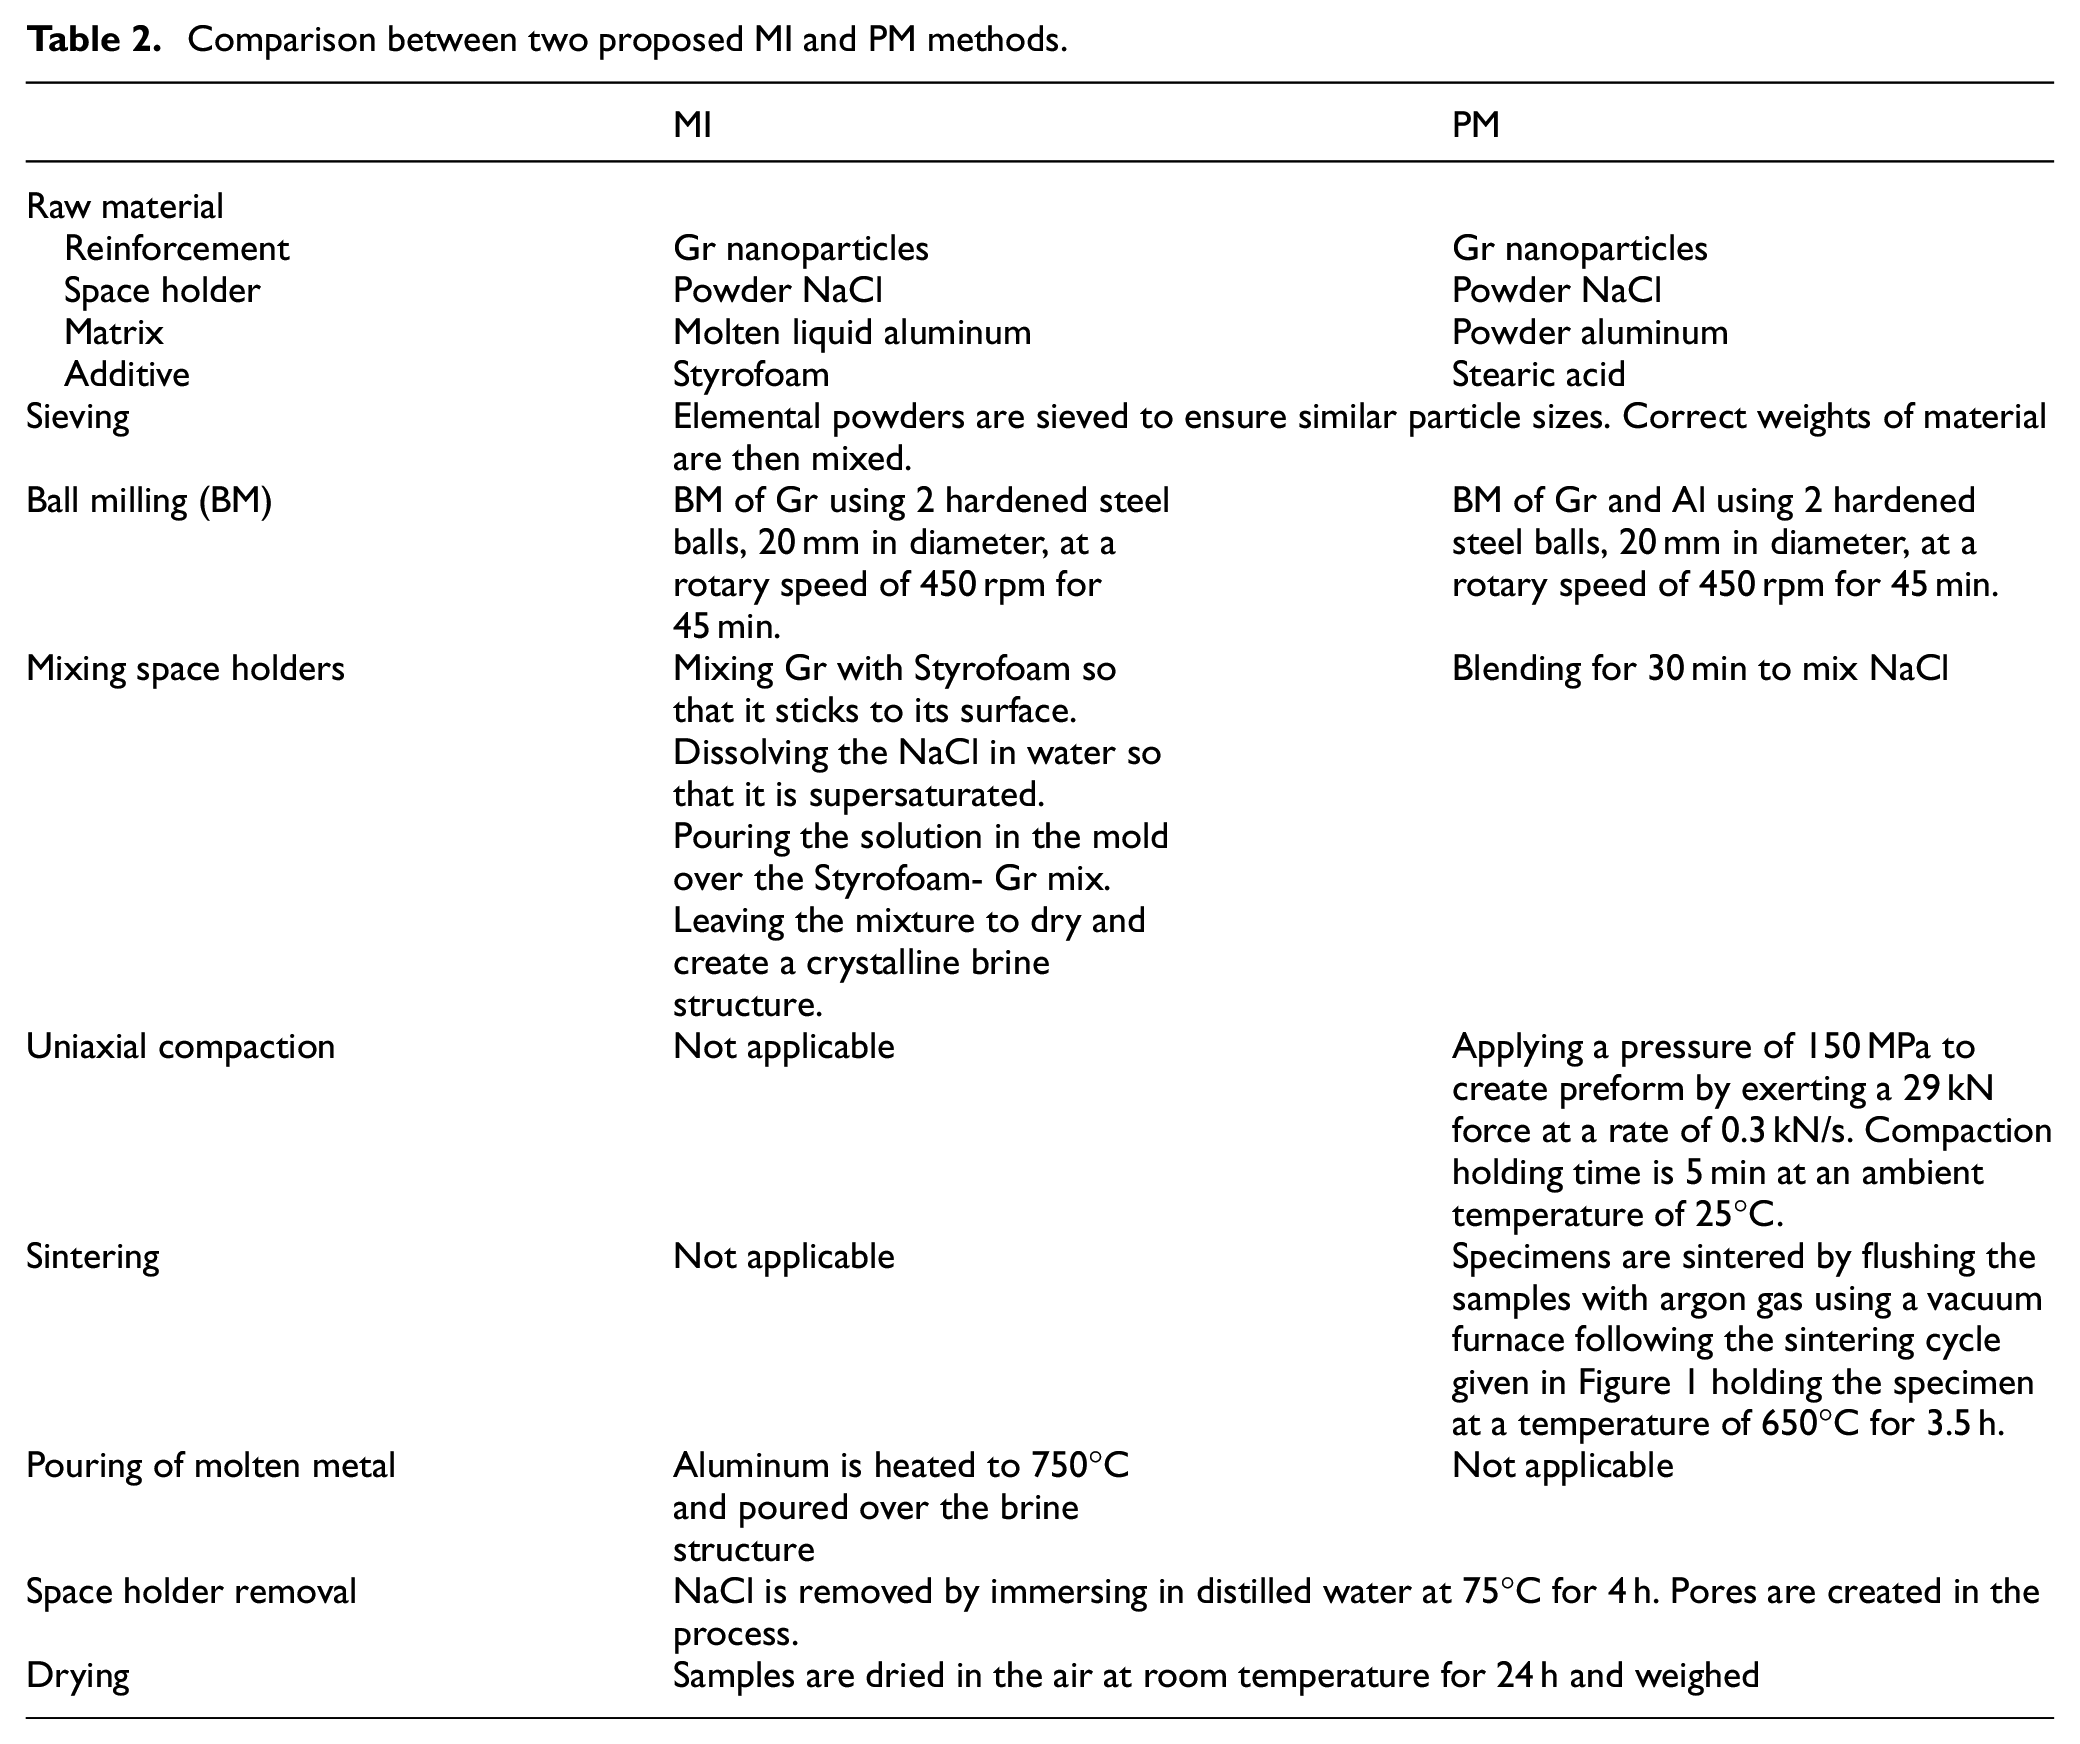
Based on the surveyed literature, the reinforcement and space holder percentage have a major effect on the final properties of the composite. As a result, both percentages were selected as the design variables in the experiments while keeping the rest of the process parameters constant. Table 2 highlights the main differences between the two processes while providing process parameters values for each major step. Ball milling time, compaction pressure, and stearic acid percentage settings were selected based on initial screening experiments focused on maximizing the average hardness and porosity of the composite. These screening results were also supported by data from literature.40,41
Comparison between two proposed MI and PM methods.
Sample preparation procedure
Powder metallurgy
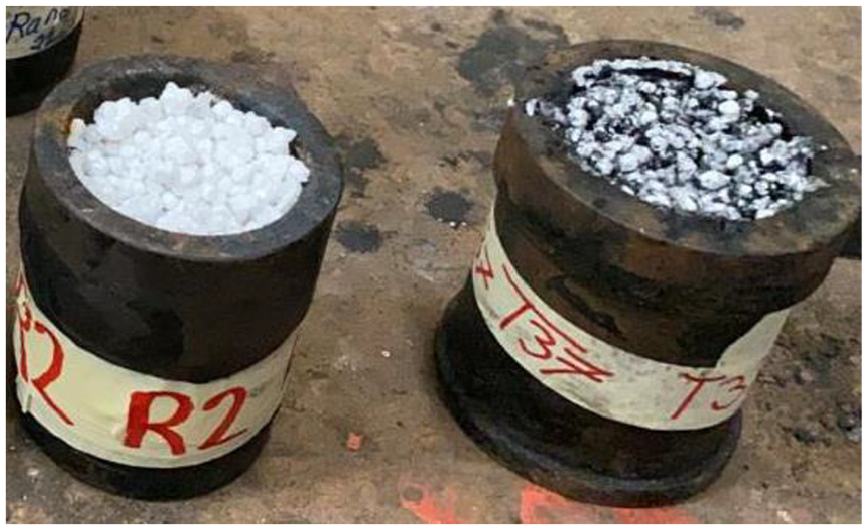
The PM samples were prepared based on the main steps and process parameters outlined in Table 2. The equipment used in the study are illustrated in Figure 1. First, the correct amount of raw material was weighted using a scale, then transferred to milling jars and placed in a Fritsch Industries ball milling machine (model number 06.200/04026) to start the milling and mixing operation (Figure 1(a)). Next, the specimen was compacted to create a preform using a 25 mm diameter die using Wykeham Farrance International compaction machine (model number 55642) (Figure 1(b)), and a punch (Figure 1(c)). The sample shown in Figure 1(d) was then sintered using Kejia (KJ-M1200-31.5) high-temperature vacuum furnace (Figure 1(f) following the sintering cycle given in Figure 2. Argon was flushed into the chamber to push the oxygen out and minimize powder oxidation. Next, a heater was used for the dissolution process (Figure 1(e)). Samples were weighed before and after the dissolution. Finally, the specimens were left to dry for 24 h before measuring the weight again.
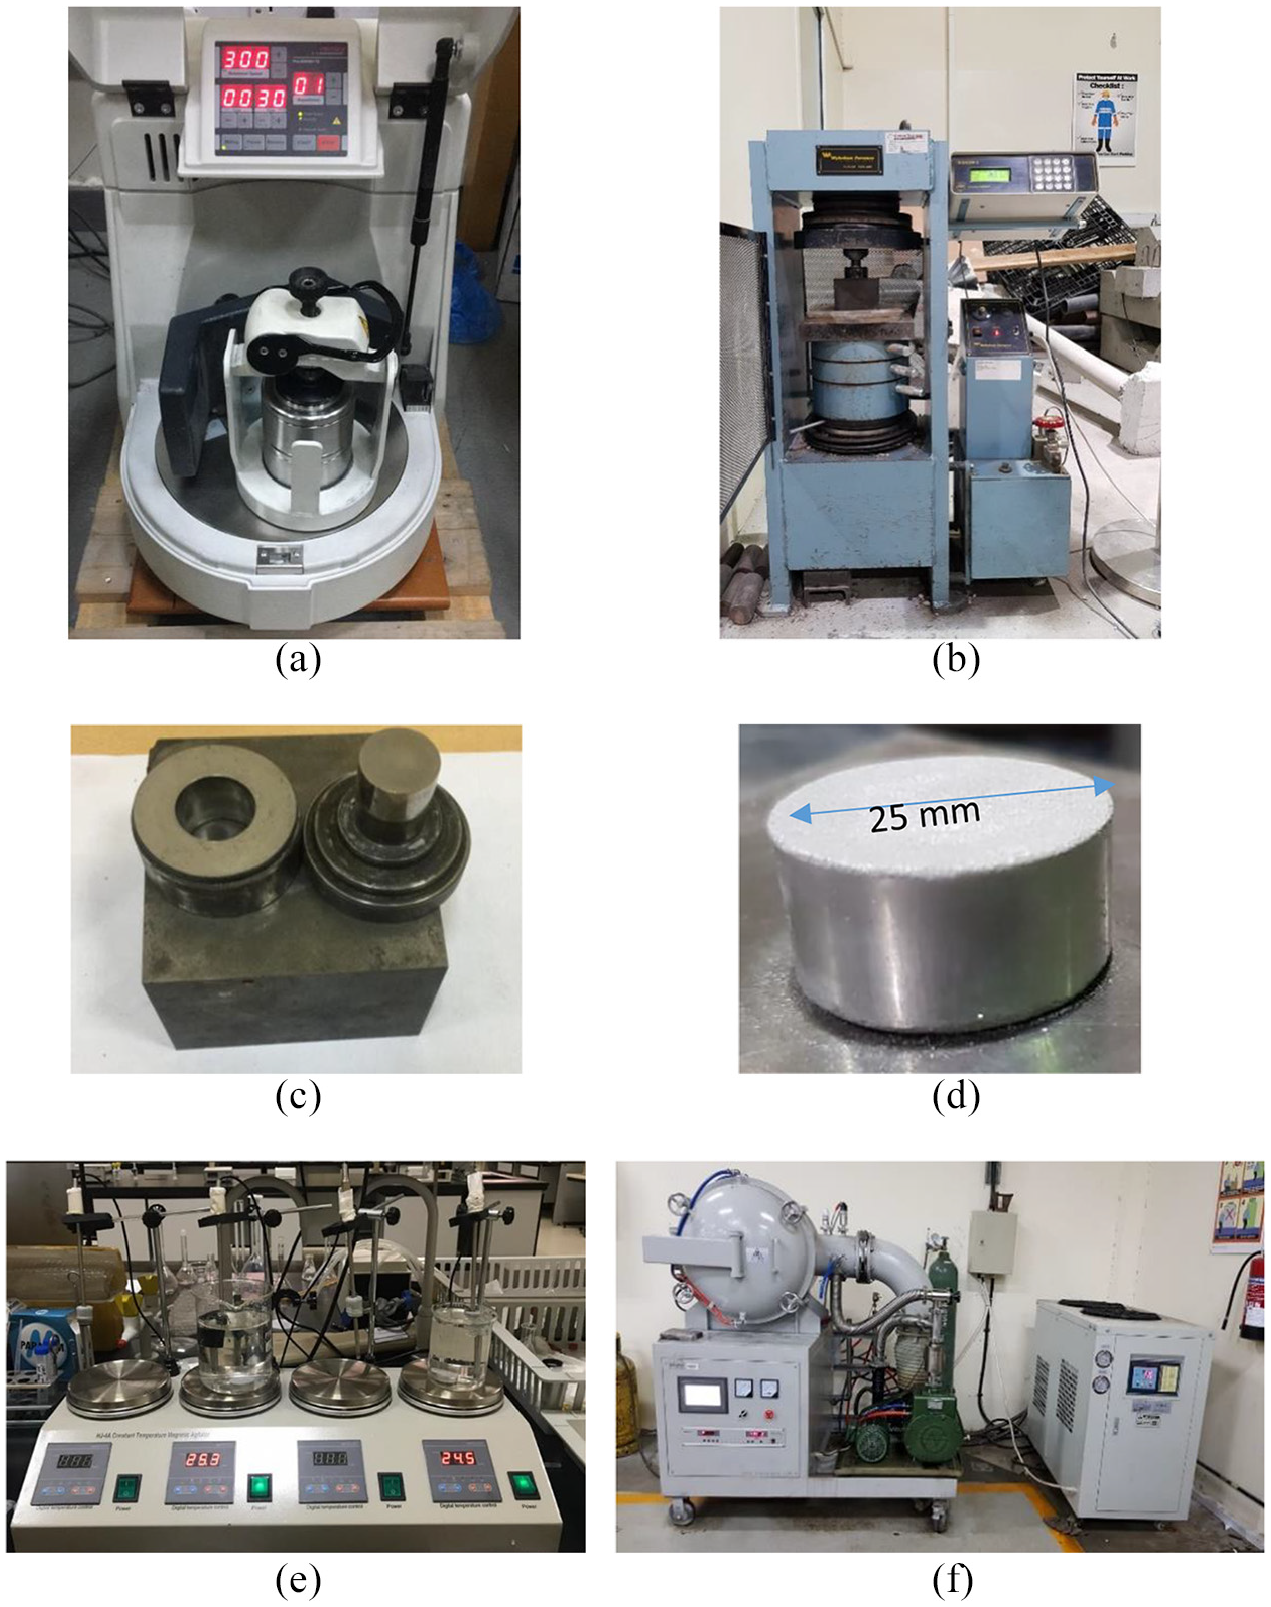
Equipment used in PM processing: (a) ball milling machine, (b) compaction machine, (c) die and punch, (d) performed sample, (e) heater, (f) vacum furnace.
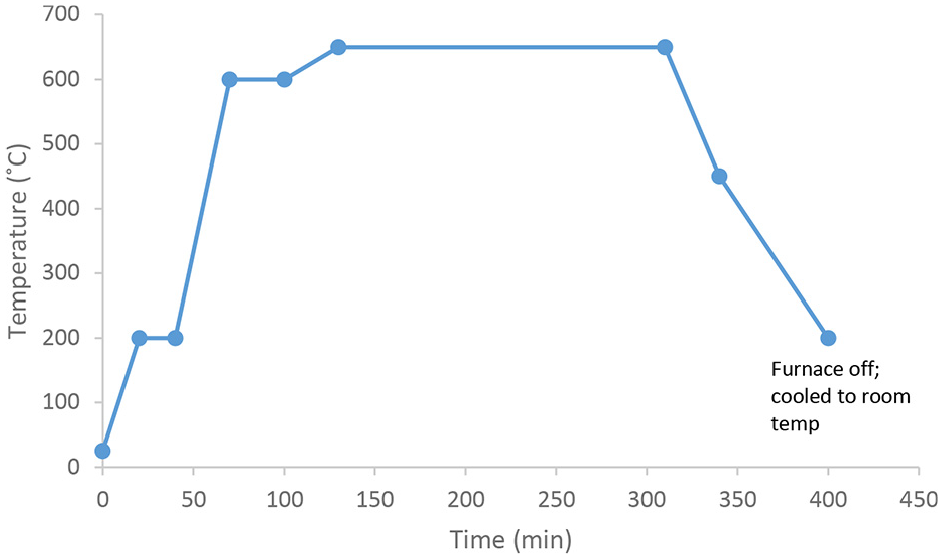
PM sintering cycle.
Melt infiltration
For MI, the procedure followed was different from that of PM due to the state of the matrix used. For the molten aluminum to infiltrate the preform, NaCl crystals need to be fully connected. As a result, several trial experiments were performed to determine the best way to create that structure. The most promising procedure was established and followed. First, two-third of the mold was filled with shredded Styrofoam material then the weighted % of graphene powder was added on the top. The mold was then spun at 2000 rpm for 2 min using an in-house manufactured vertical centrifugal machine to ensure proper mixing. This spinning enabled the graphene powder to be dispersed uniformly throughout the Styrofoam, sticking on the surface of the shredded foam without agglomeration in a specific place as shown in Figure 3. At the same time, in a separate cup, water was added slowly to NaCl and stirred well while maintaining the temperature of the mixture at 90°C until the NaCl-water mixture is clear, that is, the mixture was supersaturated and NaCl could not dissolve anymore. Then the mixture was added to the mold with the shredded Styrofoam-Gr and left to cool down for 1 day. This was followed by draining the water from the mold. A brine-crystalized NaCl mixture was formed interlocking with the Styrofoam and Gr. Aluminum was heated to 700C using a Carbolite furnace (model number 21-000452 GPC 1.2/65) then poured into the mold. The heat from the molten aluminum evaporated the foam while mixing with the Gr and NaCl. Finally, the mold was cooled in air and weighed then immersed in distilled water at 75°C for 4 h before leaving it to dry for another 24 h and weighing it again.
Foam-Gr sample preparation.
Material characterization
To characterize the samples’ physical and mechanical properties hardness tests and porosity measurements were conducted on all samples while compression tests and microstructural analysis were performed on selected samples to reinforce results.
Hardness test
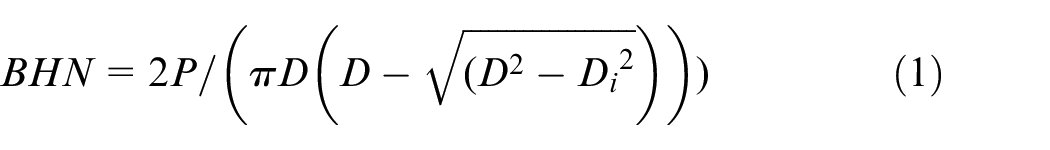
Brinell test is conducted to measure the hardness using a 10 mm spherical indenter. A 0.8 kN load (P) was maintained for 20 s then resultant indentation diameter (D) was measured using an electronic microscope. The test was repeated once at the center of the specimen then on each side. The Brinell Hardness Number (BHN) is calculated based on the magnitude of the load and diameter of the resulting indention as shown in equation (1).
Porosity measurements
Porosity was measured using the bulk mass method (BMM) per 42 based on the relative density reduction between measured and calculated density as shown in equation (2). This measurement was simple to implement but results in an averaged porosity throughout the entire part not accounting for local variations in part porosity. The main uncertainty was in the volume measurements since we assumed that all samples would fill the whole height of the cylindrical die, which varied during the manual pouring process.
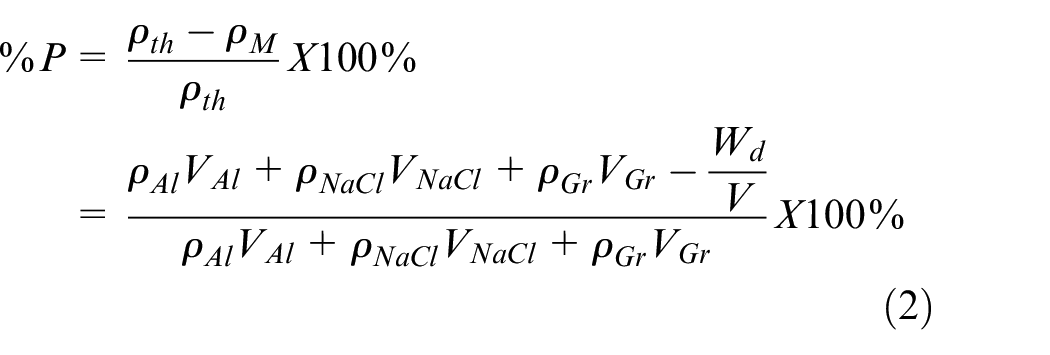
where
Compression test
The compression properties of PM foam samples were also determined as per ASTM E9-89a using a temperature-controlled Instron 5982 machine. The machine has a force measurement accuracy: of ± 0.4% of reading down to 1/100 of load cell capacity and displacement measurement accuracy of ±0.01 mm. Quasistatic compression tests were carried out at a strain rate of 0.01/s at room temperature conditions.
Microstructural analysis
Microstructural analysis was carried out to examine porosity distribution and shape in the prepared samples using a Tescan Vega scanning electron microscope (SEM). The samples were carefully sectioned, mounted on epoxy, and polished with 1000 and 2500 grit SiC papers before conducting the analysis. Energy dispersive spectrometer (EDS) analysis was then conducted to examine the composition and development of new phases if any.
Results and discussion
In this section, the plan and results of the design of experiments (DOE) for each method are provided along with a comparison between the two. Minitab 17.2.1 software was used to create and analyze the two DOEs.
Powder metallurgy
Design of experiments
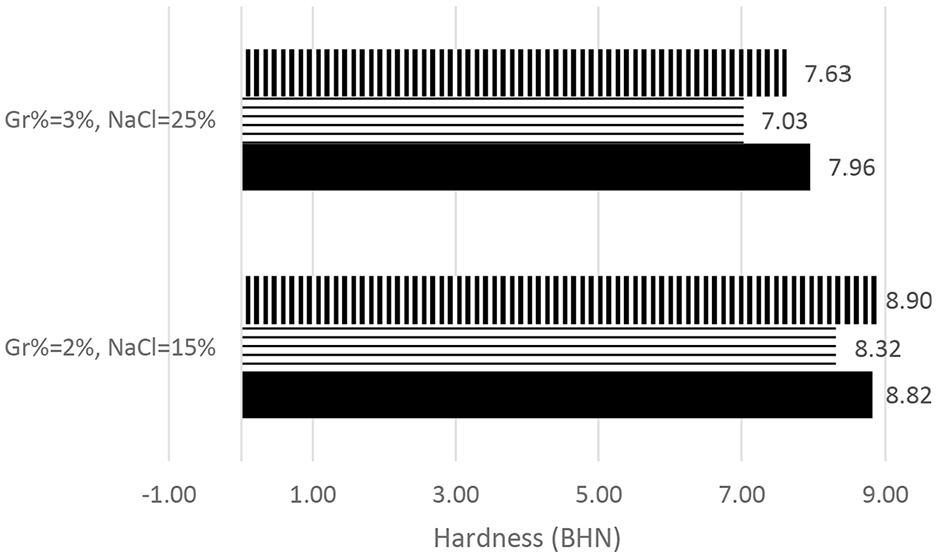
Before conducting PM DOE, a repeatability study was conducted to ensure that experiments are repeatable. Two settings were selected and replicated three times, namely Gr% = 2% and NaCl% = 15% and Gr% = 3% and NaCl% = 25%. Figures 4 and 5 summarize results for both hardness and porosity, respectively. The hardness results were within ±6% of average BHN while porosity was within 5% of average %porosity.
PM hardness repeatability study.
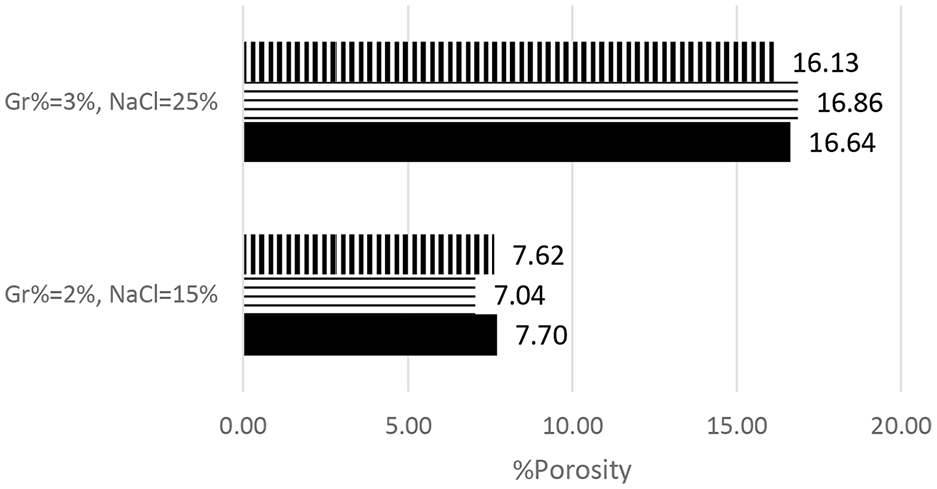
PM %porosity repeatability study.
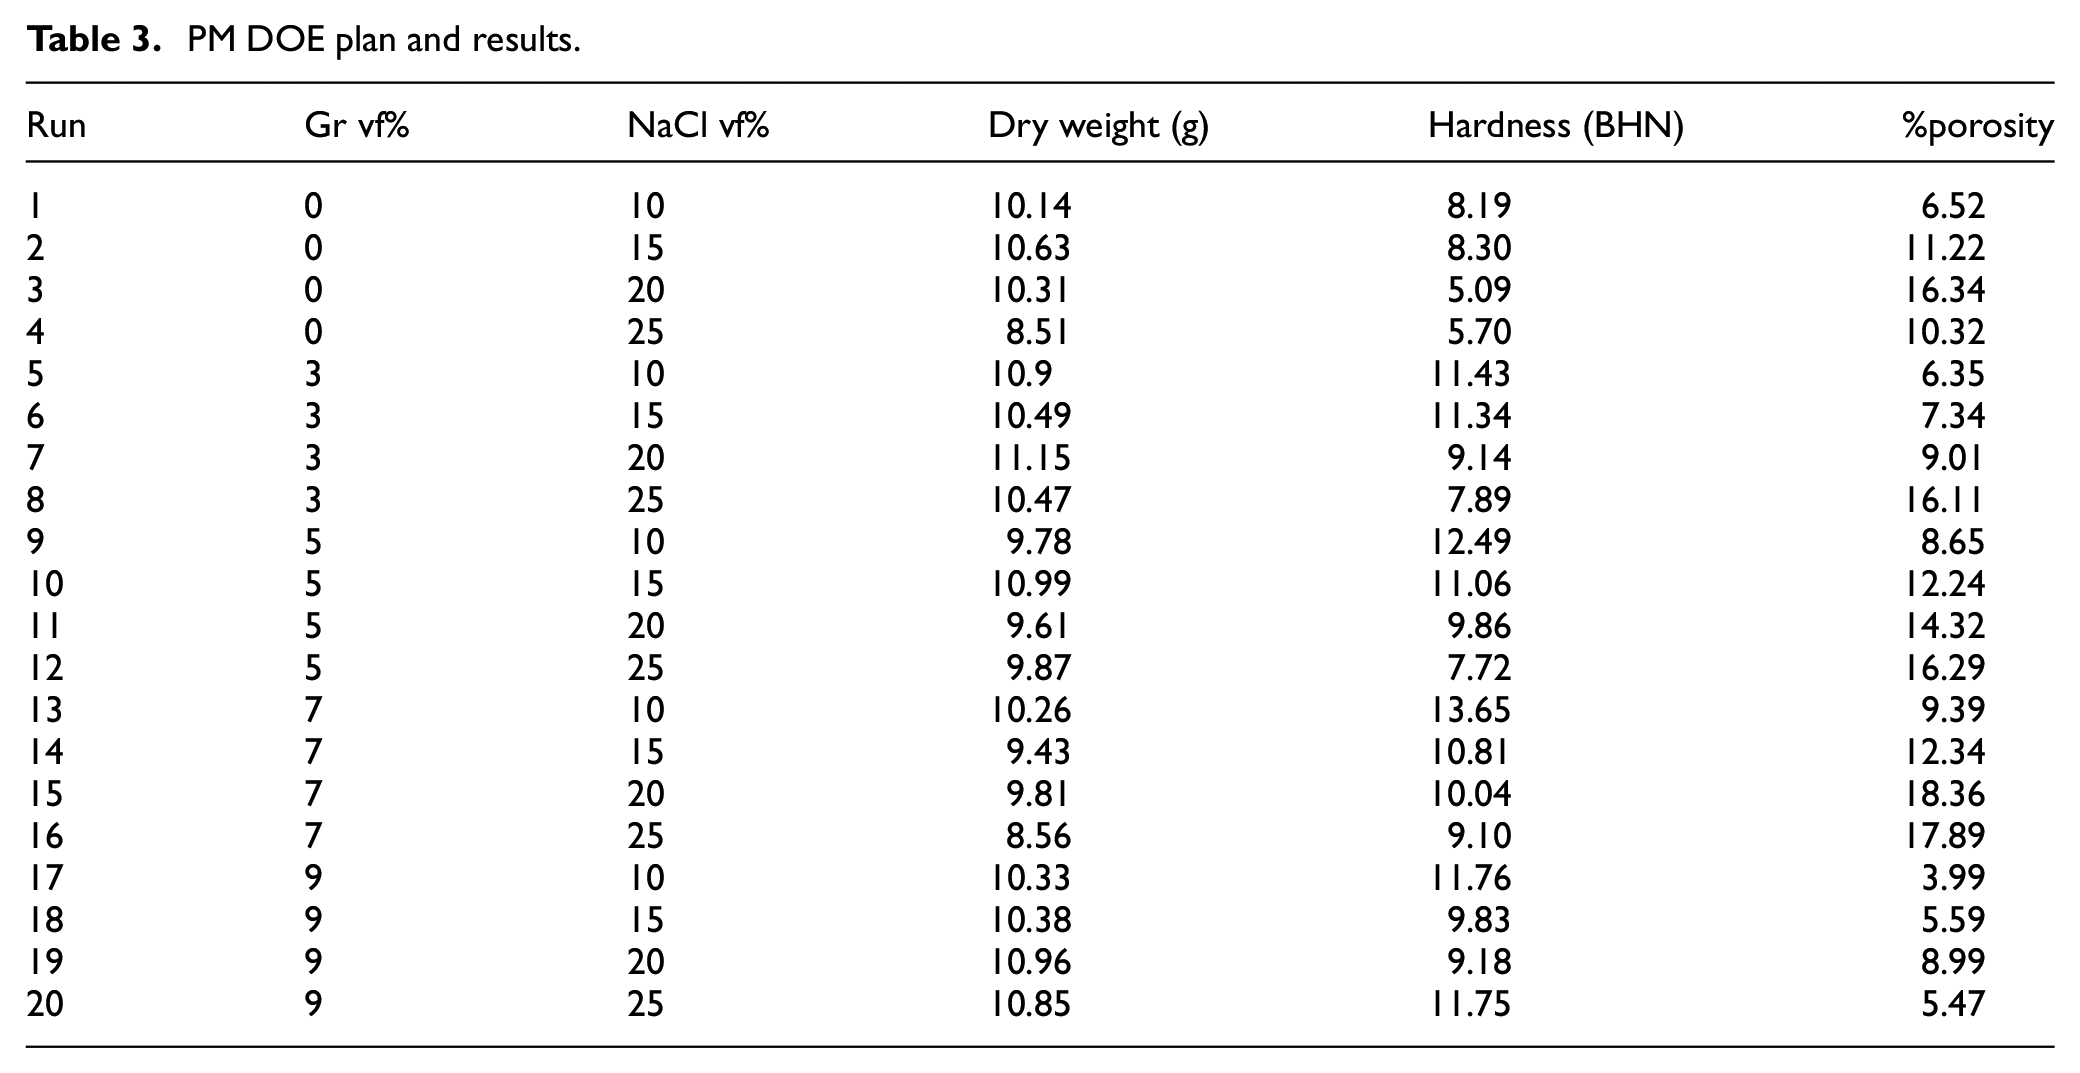
Next, a full factorial DOE was conducted to investigate the impact of Gr and NaCl volume fraction
PM DOE plan and results.
Analysis of variance and regression analysis
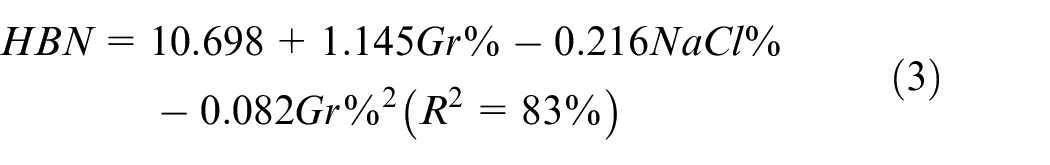
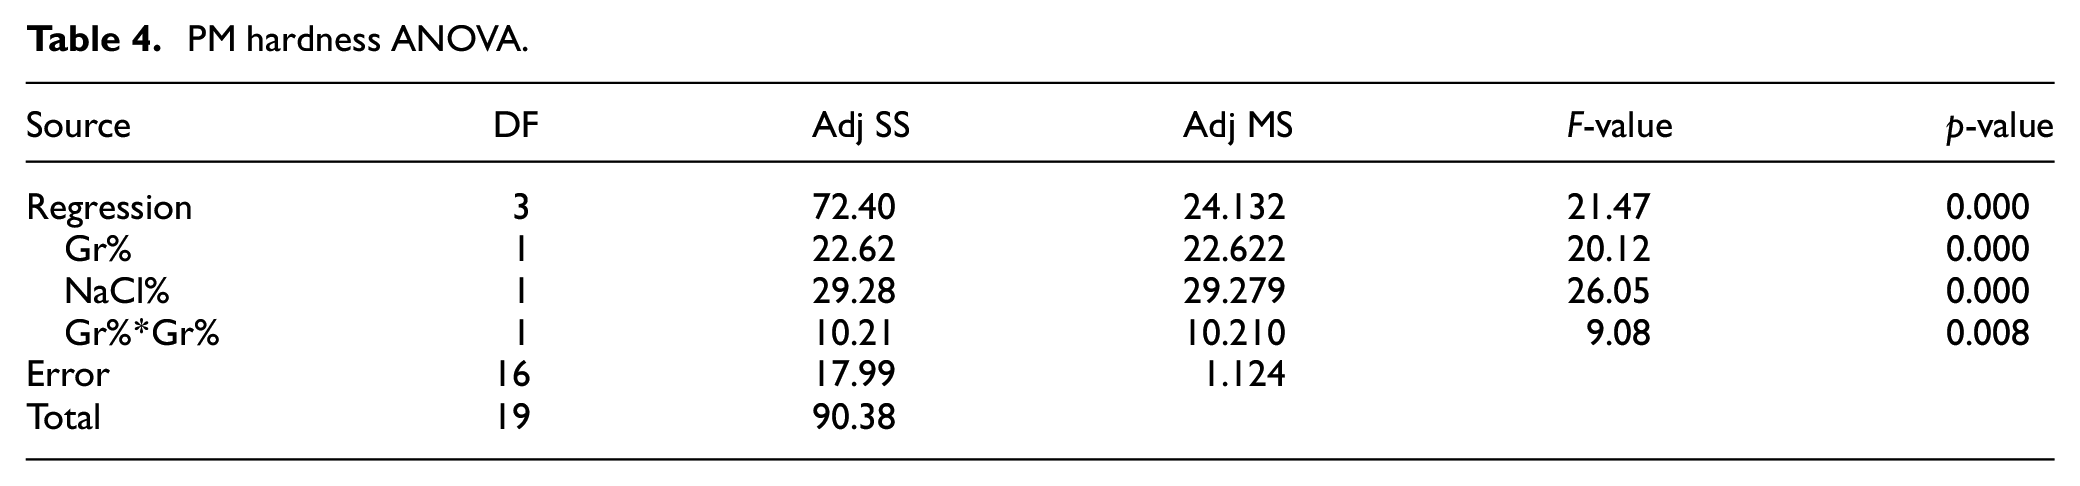
In order to investigate the impact of Gr% and NaCl% on hardness and porosity, effect plots, analysis of variance (ANOVA) and regression analysis were conducted for both responses. The main effects plot of the PM DOE on hardness is depicted in Figure 6 while ANOVA is summarized in Table 4. Main effect plots and ANOVA suggest that both Gr% and NaCl% are influencing hardness with p-values of 0. Moreover, ANOVA indicates that there is no evidence of any interaction between the two factors. The main effect plot of Gr suggests that adding Gr reinforcement increases the hardness of the composite up to around 7% then declines slightly. Any clustering of graphene or agglomeration would result in a decrease in hardness and a reduction of the ability of the aluminum powder to sinter properly. Adding NaCl increases the number of pores after dissolving and causing hardness to decrease. A predictive model of hardness (BHN) in terms of significant terms only is summarized in equation (3). The coefficient of determination
PM hardness ANOVA.
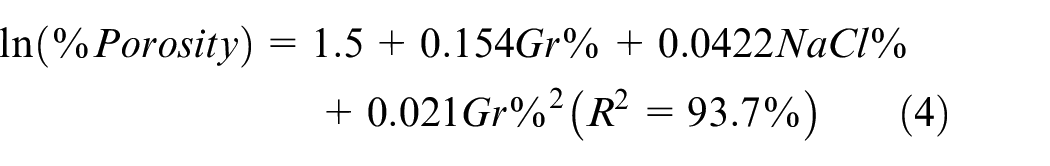
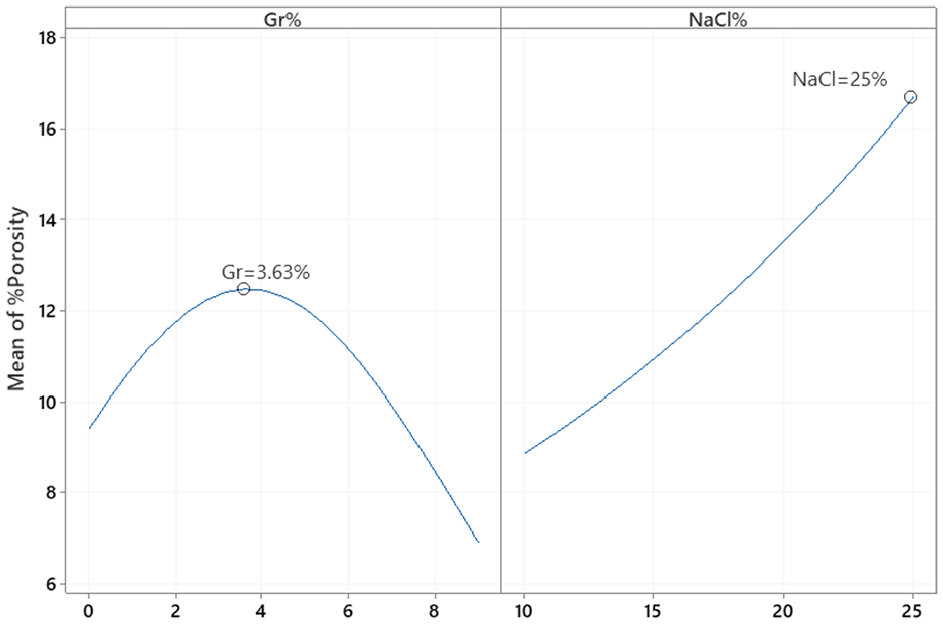
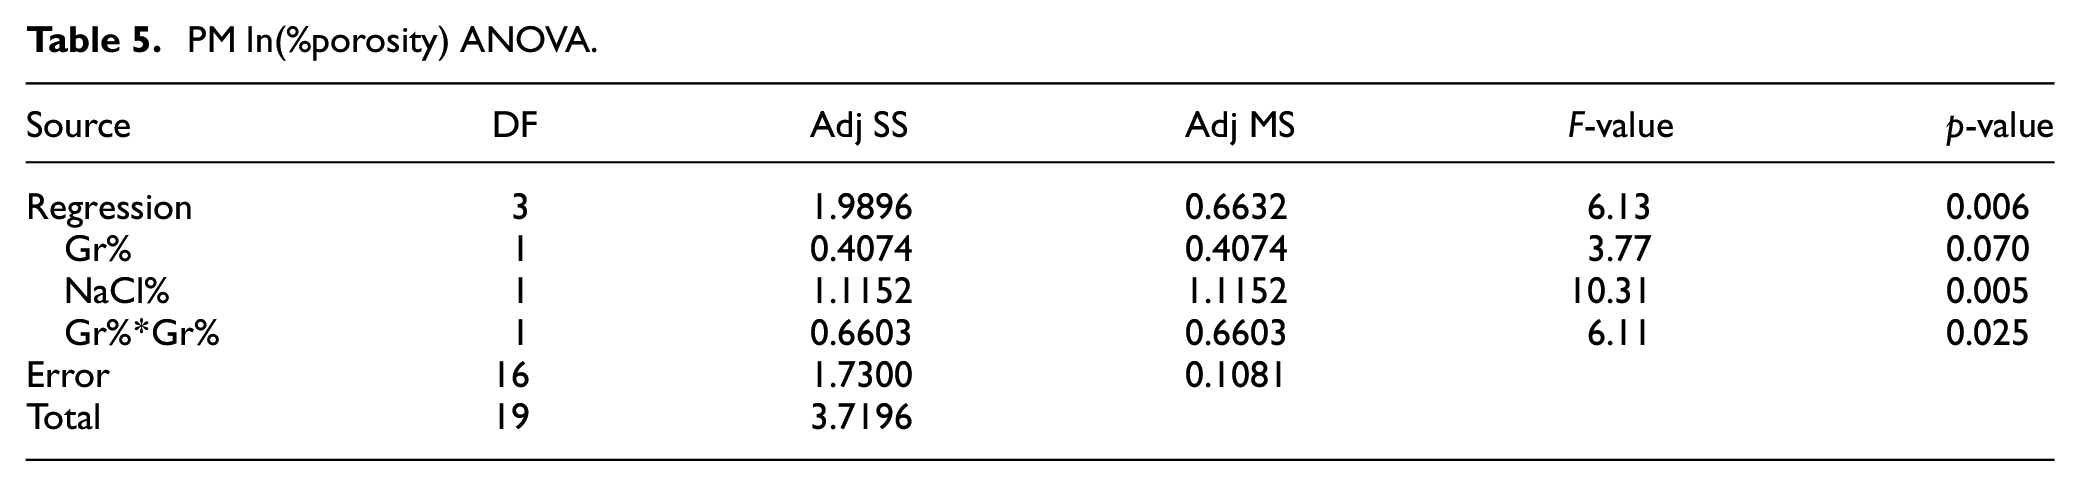
In terms of porosity, Figure 7 depicts the %porosity main effects plot while the ANOVA analysis is summarized in Table 5. ANOVA analysis indicates that both Gr% and NaCl% are significantly affecting %porosity with p-values of 0.07 and 0.005 respectively with no evidence of an interaction. Main effect plots suggest that porosity is proportional to NaCl% while adding more Gr beyond 3% reduces the porosity of the PM sample as it consumes more space. Residual analysis suggests an increase of residuals variance as porosity increases. As a result, a transformation of the model was necessary and natural logarithmic showed the best fit based on box-cox transformation, see equation (4). The optimal settings for maximizing hardness and minimizing porosity independently are shown in Figures 6 and 7, respectively.
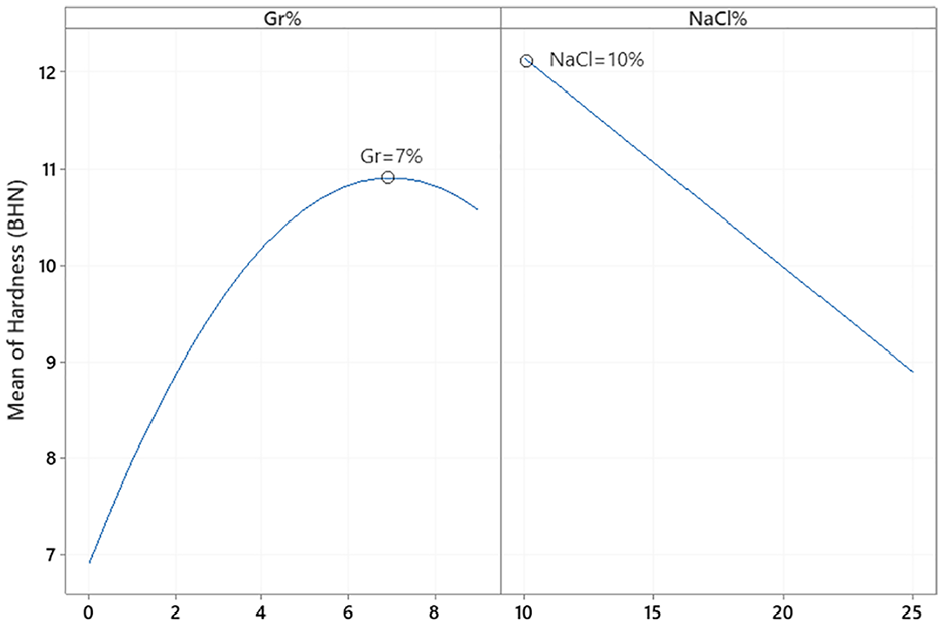
PM hardness main effects plot.
PM %porosity main effects plot.
PM ln(%porosity) ANOVA.
Microstructure analysis
Analysis of PM sample 5 (Gr = 3%, NaCl = 10%) and 13 (Gr = 7%, NaCl = 10%) was carried out using SEM and shown in Figures 8 and 9, respectively. It can be seen that the pores in the resultant porous Al were mainly composed of closed macro-pore structures. Coupon with 3% Gr (sample 5) shows approximately 3 pores/mm compared to approximately 2 pores/mm in 7% Gr sample (sample13). The average pore surface area and average pore longitudinal length in the two samples are approximately 60,000 µm2 and 100,000 µm2 and 300 µm and 400 µm respectively while the pore transverse length is in the range of 200 µm and 250 µm, respectively. The average spacing between pores is in the range of 500 µm for sample 5 and 300 µm for sample 13. Studies have shown that it is important to ensure that the pore formation resembles the morphology of space holder material in obtaining porous Al with better quality. This supports the formation of macro-pore closed-cell aluminum foam. Pore distribution in sample 5 is uniformly distributed while sample 13 had a higher pore concentration towards the center. Sample 5 which had a lower percentage of Gr showed a distinct cell wall formation and isolation of pores. Both samples exhibited a non-equiaxial (width/length) ratio of approximately 0.62. An increase in the percentage of Gr from 0% to 7% with constant NaCl addition of 10% leads to an increase in hardness of the foam by 62% while the porosity also increased by 43%. The dense cell wall is formed in the case of test sample 5 compared to test sample 13 which had irregular pore formation and agglomeration in the matrix. This is primarily attributed to the presence of a higher amount of brittle Gr particles along the aluminum grain boundaries. Following the dissolution of NaCl crystals, the coalescence of interfacial cracks along the grain boundaries with Gr and the Al matrix leads to the formation of larger pore surface area and average pore longitudinal length, resulting in higher porosity. For a fixed percentage of Gr (5%), an increase in the percentage of NaCl from 10% to 25% leads to a decrease in hardness of the foam by 45% while porosity increases by almost 95% which is a good sign. It is shown through this study that the PM process can produce the desired closed pore structure in the aluminum matrix. The higher the volume fraction of the space holder, the thinner the closed-cell walls and the lower the density of the foam. Similar observations are reported in the works of Manonukul et al. 43 and Jamal et al. 41 It is therefore evident that the density post sintering and porosity of the aluminum matrix can be tailored by varying the content of graphene and space holder material.
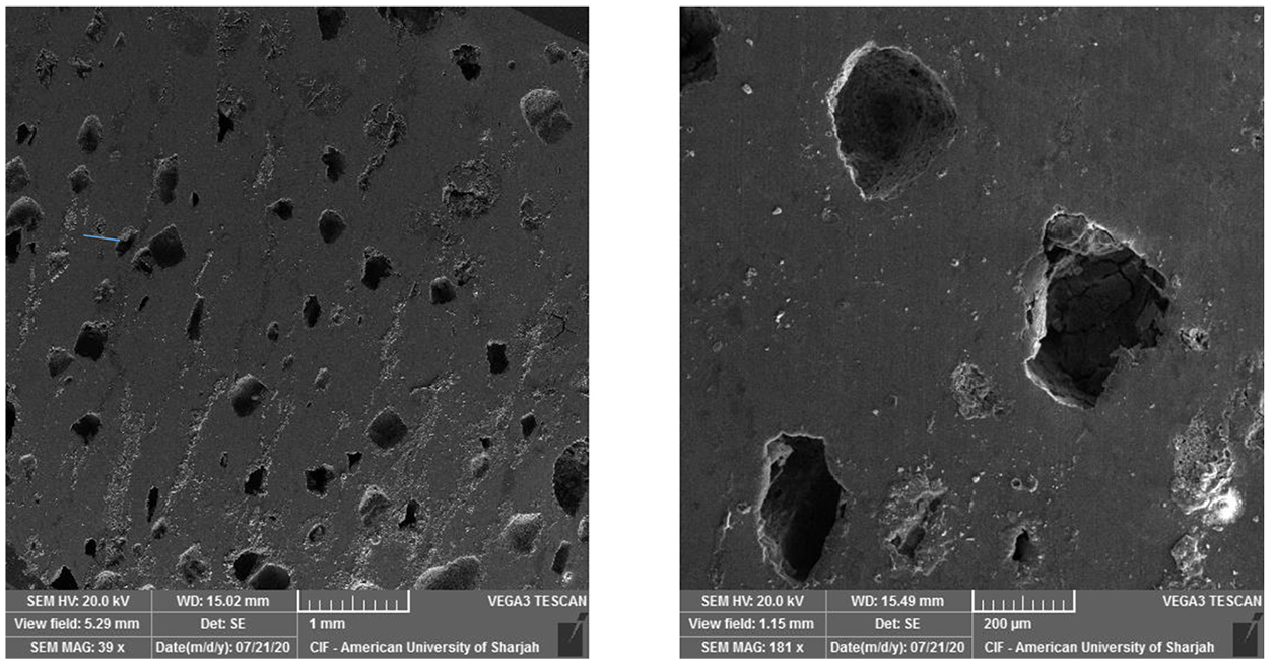
SEM analysis for PM sample 5 (Gr = 3%, NaCl = 10%).
SEM analysis for PM sample 13 (Gr = 7%, NaCl = 10%).
EDS analysis for sample 5 is conducted and shown in Figure 10. The formation of aluminum oxide Al2O3 which has negative impact on metallurgy is evidenced by analysis. The presence of small traces of NaCl space holder material is confirmed in the aluminum matrix before dissolution. Studies have shown the importance of forming the pores in the same morphology as the space holder material to obtain a good quality porous aluminum with sound mechanical properties.43–45 The presence of microporosity due to incomplete sintering could affect the mechanical properties of the foam. As seen in Figures 8 and 9, the presence of microporosity in the as-sintered samples is visible. Based on the pore morphology observed in the PM samples they are classified as type 1 and type 2. Type 1 pores are micro porosity caused due to incomplete sintering. Type 2 pores are formed due to the dissolution of NaCl space holder materials which are much larger in size compared to the type 1 pores. A higher percentage of type 1 porosity was observed in test sample 13 in between the cells. These micropores present along the cell walls and grain boundaries promoted the initiation and propagation of inter-cell cracks resulting in the formation of larger pores. To study the influence of Gr addition on the modulus of elasticity of the manufactured foam, a uniaxial compression test was conducted on two PM samples, namely samples 4 and 20. Figure 11 depicts the recorded stress-strain curves for both samples. The tests were carried out at room temperature. Test results reveal that increasing the percentage of Gr (up to 9%) with 25% NaCl increases the modulus of elasticity by approximately 70% (from 0.440 to 0.758 GPa) and the peak compression strength of the composite foam up by 45%. This result correlates well with a corresponding increase in hardness and reduced porosity with increasing Gr in the foam.
EDS analysis for PM sample 5 (Gr = 3%, NaCl = 10%).
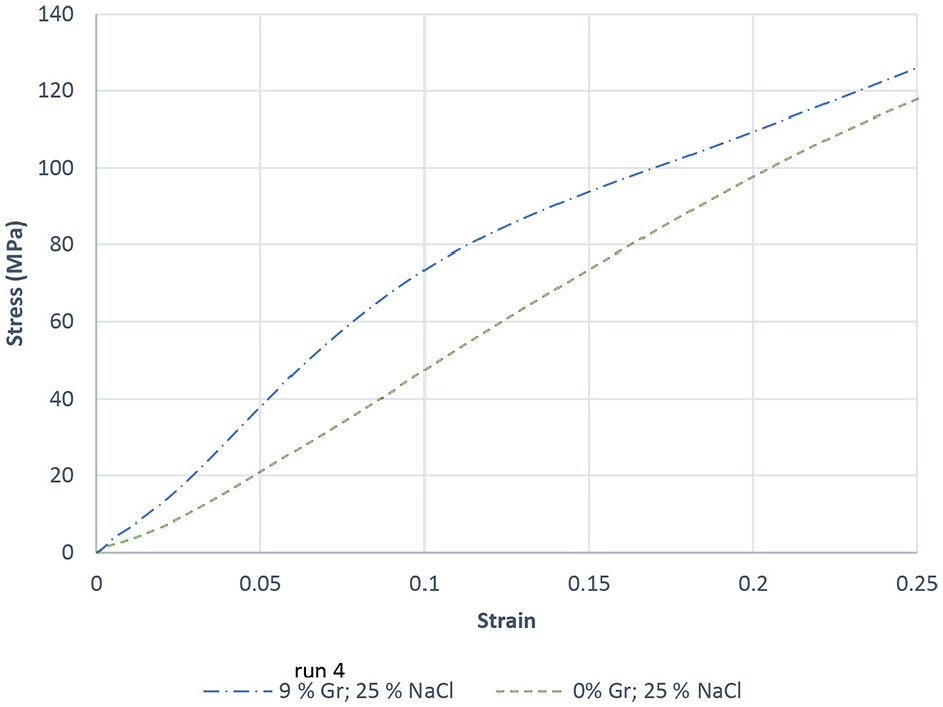
Stress-strain curves for PM samples 4 and 20.
Melt infiltration
Design of experiments
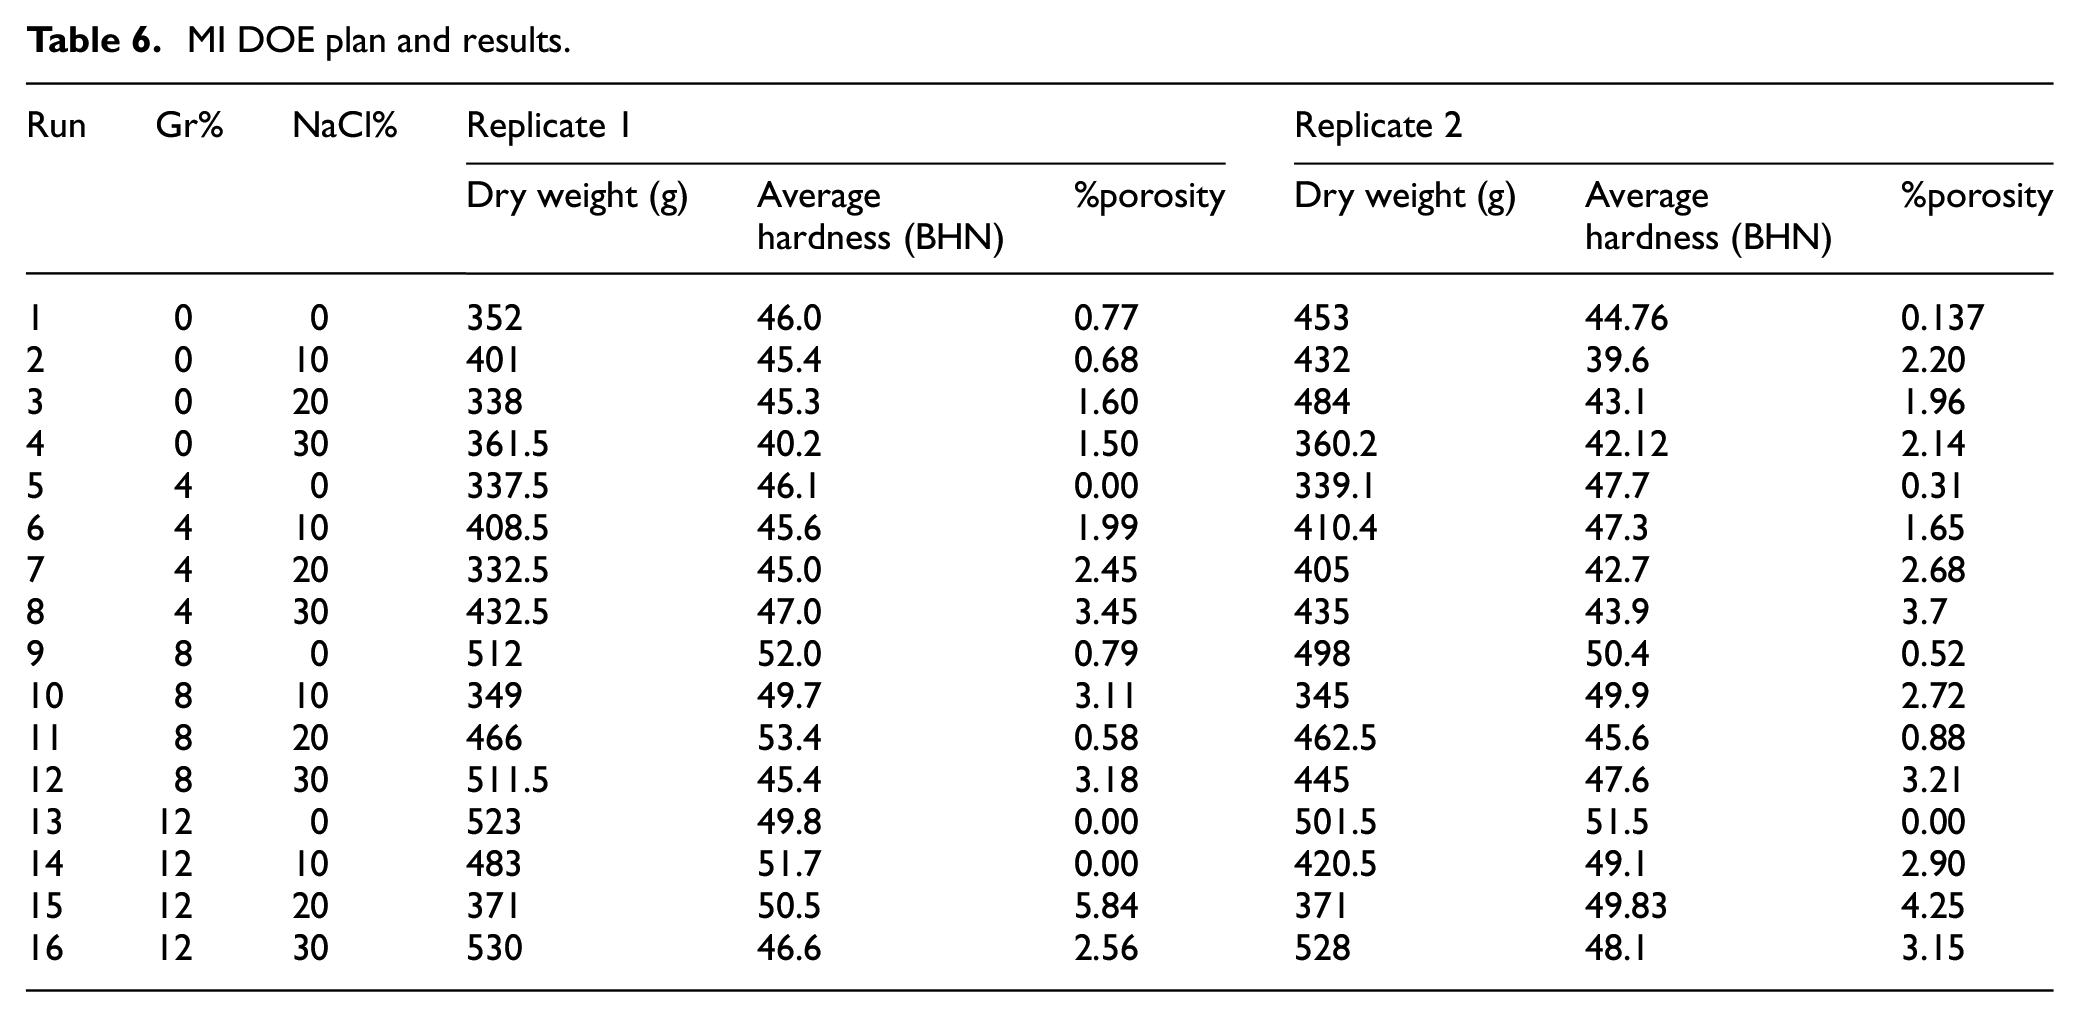
For MI, a 24 full factorial DOE with two replicates is performed. In this DOE four levels of NaCl% and four levels of Gr% are used as shown in Table 6.
MI DOE plan and results.
Analysis of variance and regression analysis
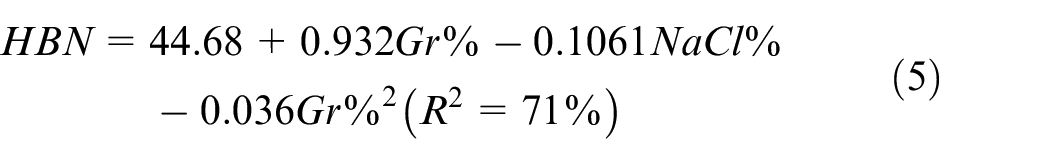
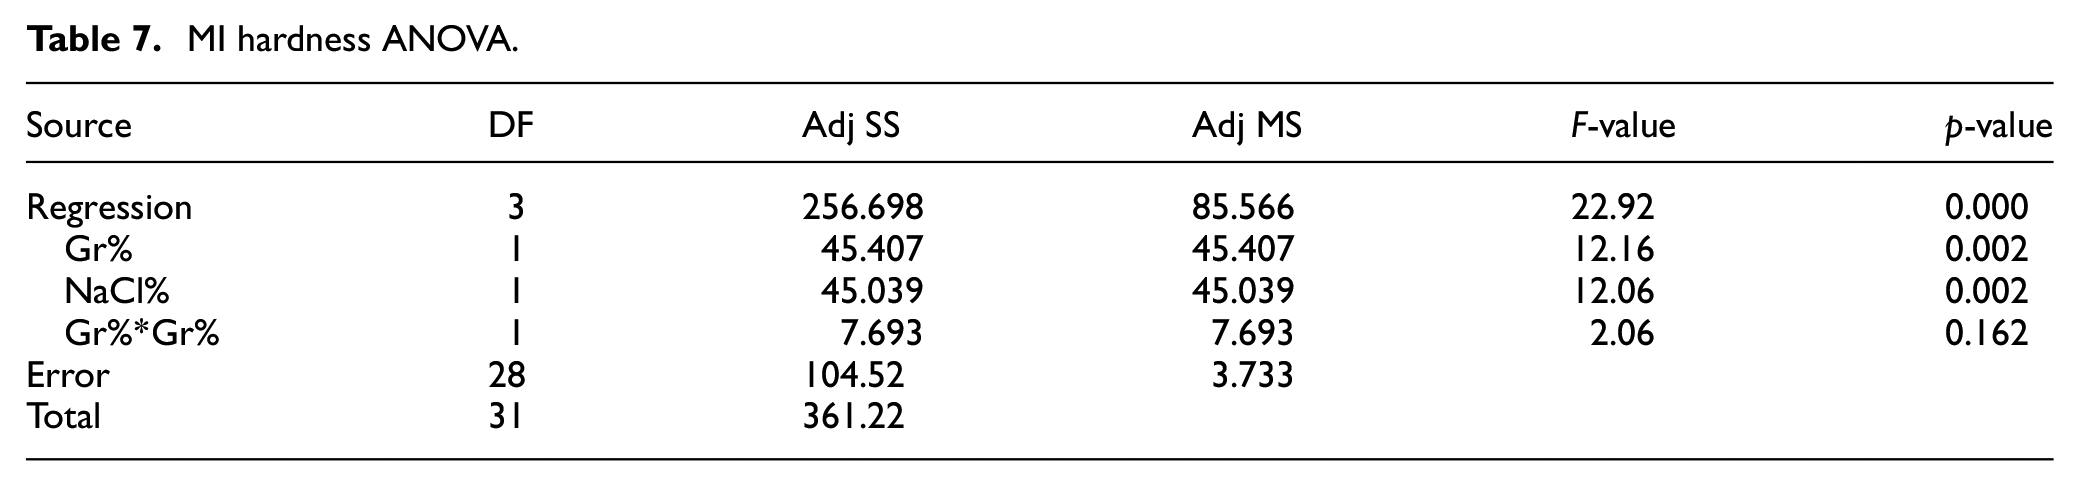
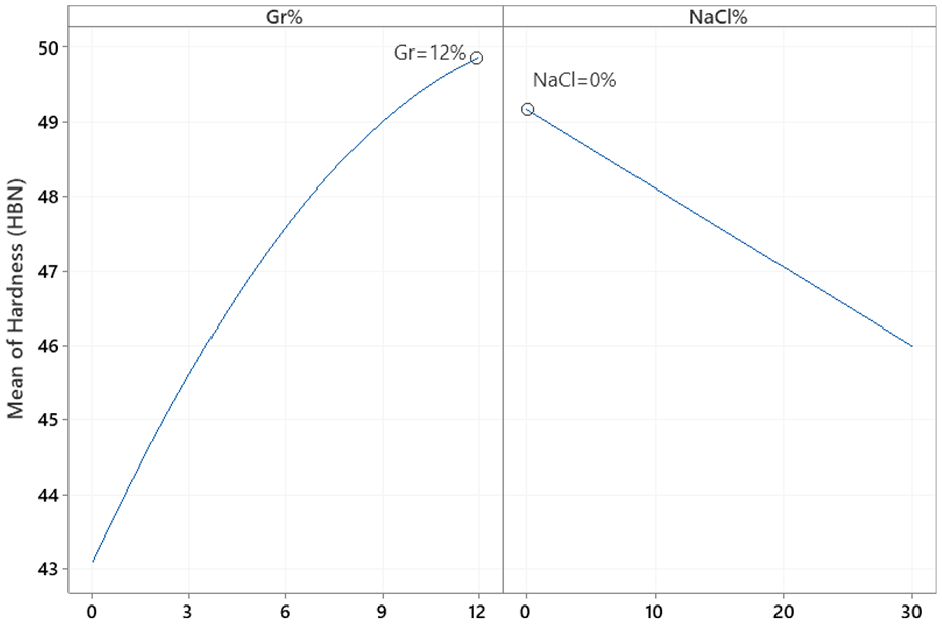
Similar to PM, the main effect plot depicted in Figure 12 suggests a nonlinear Gr%-hardness relationship. ANOVA analysis of hardness shown in Table 7 indicates that both Gr% and NaCl are statistically impacting hardness with p-values of 0.002. Moreover, no evidence for Gr-NaCl interaction. The predictive model of hardness is shown in equation (5) has
MI hardness ANOVA.
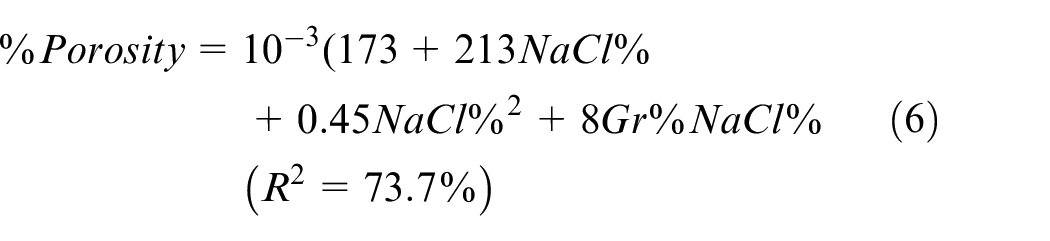
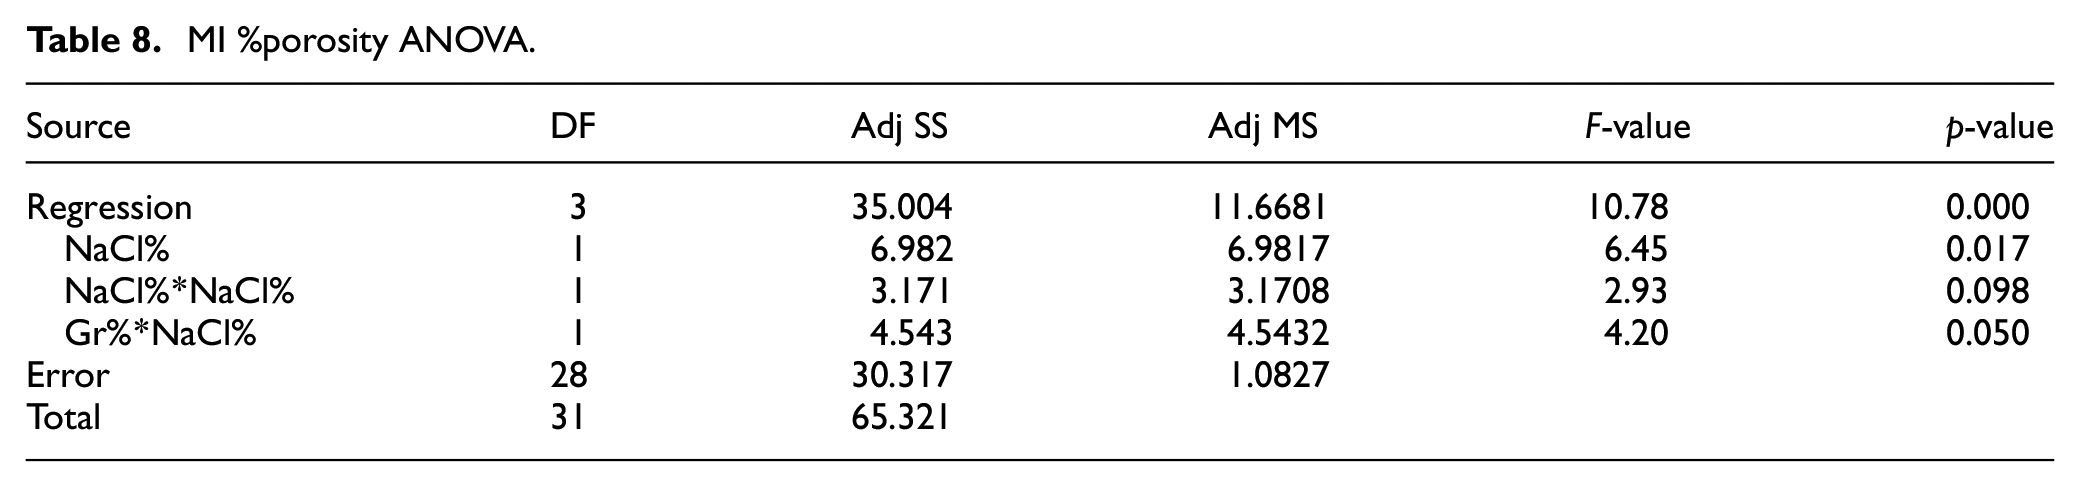
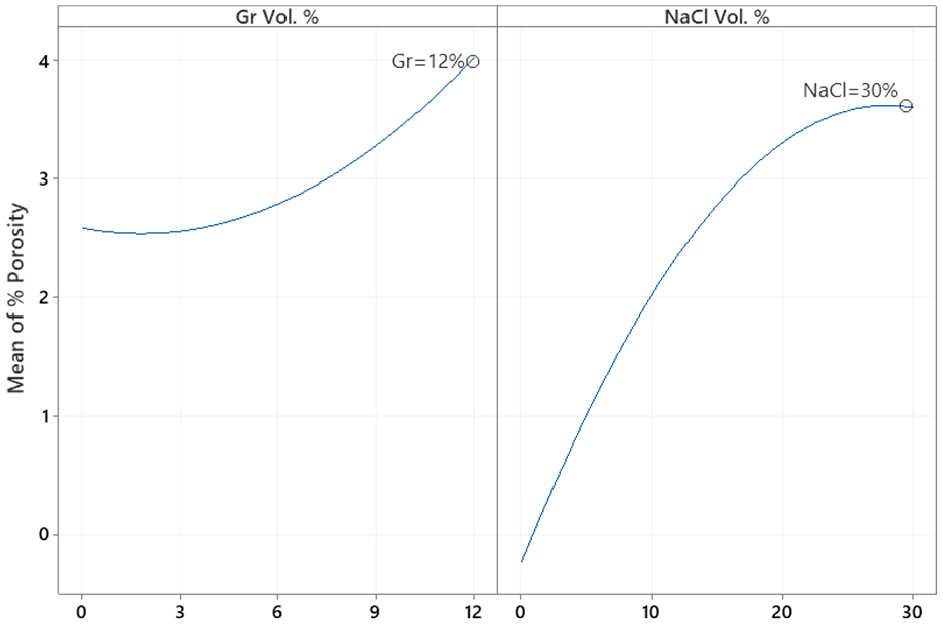
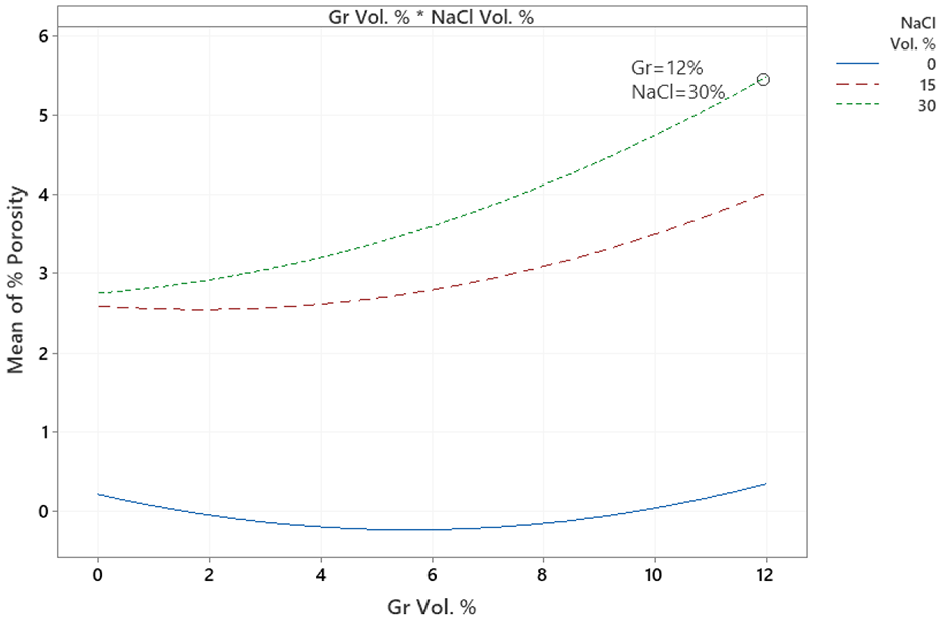
Similarly, the main effect plots and interaction plot for porosity are depicted in Figures 13 and 14, respectively while the prediction model is shown in equation (6). The interaction plot suggests that adding Gr with no NaCl does not impact porosity. However, adding more Gr slightly increases porosity at higher levels of NaCl. Results suggest that NaCl% is proportional to porosity but inversely proportional to hardness. ANOVA analysis for % porosity is shown in Table 8 suggests that NaCl is the main contributor to %porosity with evidence of interaction between Gr and NaCl as well. The optimal settings for maximizing hardness and minimizing porosity independently are shown in Figures 12 and 14, respectively.
MI %porosity ANOVA.
MI main effect plot for average hardness.
MI main effects plot for % porosity.
MI interaction plot for % porosity.
An attempt was made to run similar DOE’s for PM and MI techniques. However, due to differences between the two processes in terms of the effect of Gr and NaCl on responses the variable levels were slightly changed. The impact of Gr% in PM process on hardness was more apparent than MI. As a result, an additional level was used to improve the accuracy of model. Similarly, the range of Gr% in MI process was expanded. One of the major outputs of DOE is to develop a prediction model that can be used to predict any combination of input variables within the design space. Despite the slight differences in the two DOE’s used, they served this purpose. Moreover, the time and effort for running MI experiments was much faster and cheaper than running the PM ones. As a result, the MI DOE was replicated twice.
Microstructure analysis
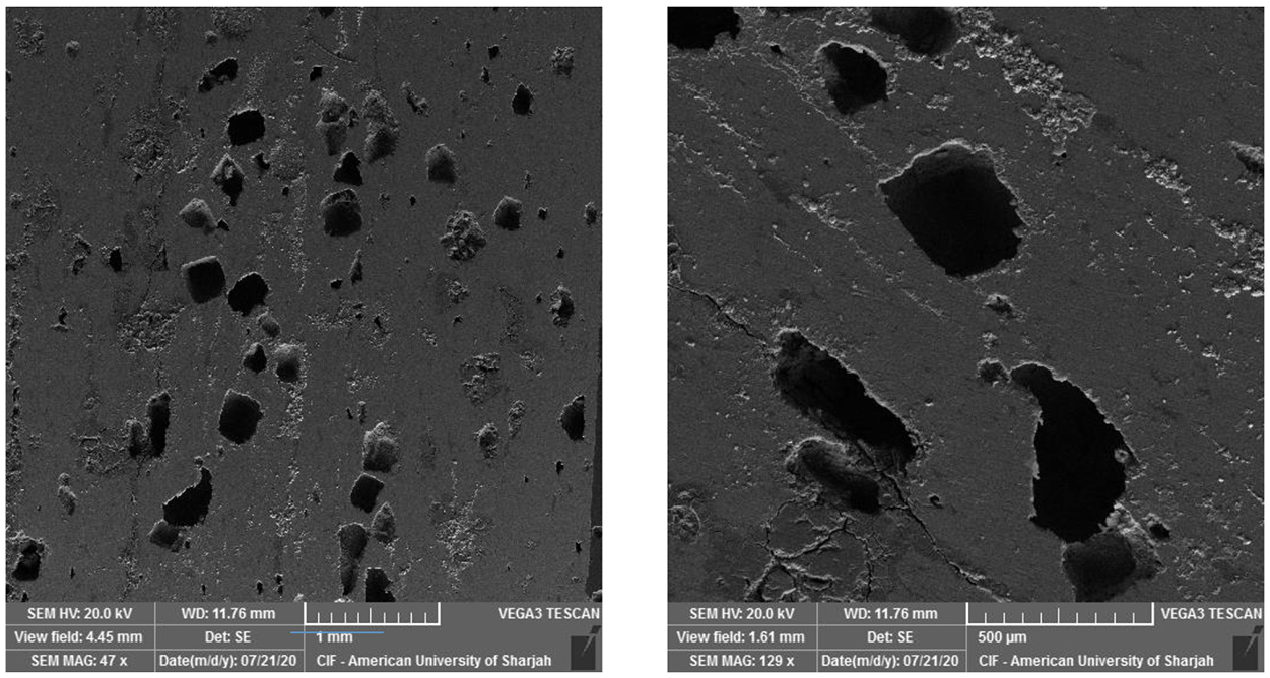
Two MI samples were selected for SEM analysis and comparison: sample 6 (Gr = 4%, NaCl = 10%) and sample10 (Gr = 8%, NaCl = 10%). Figures 15 and 16 show SEM pictures of the two samples, respectively. Unlike PM, the 4% Gr MI sample revealed very low percentage of pores due to undissolved NaCl traces which could be primarily due to high dense MI samples hindering the NaCl dissolution process. The mechanism also hints at good bond strength between the aluminum matrix and the NaCl interface. In addition, a low percentage of microporosity present in the matrix also makes it difficult to dissolute NaCl compared to PM process where type 1 microporosity was present at large. Sample 10 exhibits primarily type 2 porosities. The pores in sample 10 were separated by approximately 400 µm and were smaller in size compared to the space holder material. Type 1 micro porosities were reduced primarily due to high dense material manufactured through the MI process. The average pore size measured was 30–50 µm. The higher the percentage of NaCl, the higher the chances of type 2 pores formation. Absence of interconnectivity among cells in the MI process could be caused due to disconnected NaCl cells and their lower volume fraction as shown in Figure 16. Báez–Pimiento et al. 37 also highlighted the significance of higher interconnectivity between NaCl cells through permanent contact between NaCl to achieve better leaching and consequently a higher porosity of the sample. The percentage porosity measured in the majority of the MI samples were at lower end of 2–3% compared to PM samples which were recorded at maximum porosity of 16–18%. This resulted in a smaller average type 2 pore size and surface area compared to the PM samples. One way to improve the interconnectivity between NaCl particles while they are in the mold is by not allowing them to budge due to contact between the metallic container with aluminum. This can ensure a permanent contact among the NaCl particles and result in interconnected pores through better leaching of NaCl. It is also noted that the higher the percentage of Gr, the higher the hardness of the foam which is attributed to effective load sharing between the aluminum matrix and Gr reinforcement. To study the influence of Gr addition on the modulus of elasticity of the manufactured foam, a uniaxial compression test was conducted on three MI samples, namely sample 3 (Gr = 0%, NaCl = 20%), sample 10 (Gr = 8%, NaCl = 10%), and sample 15 (Gr = 12%, NaCl = 20%). Test results reveal that increasing the percentage of NaCl from 10 to 20%, decreases the modulus of elasticity by approximately 50% (from 1.8 to 0.8 GPa). This result correlates well with a corresponding decrease in hardness and increased porosity with increasing values of NaCl in the foam.
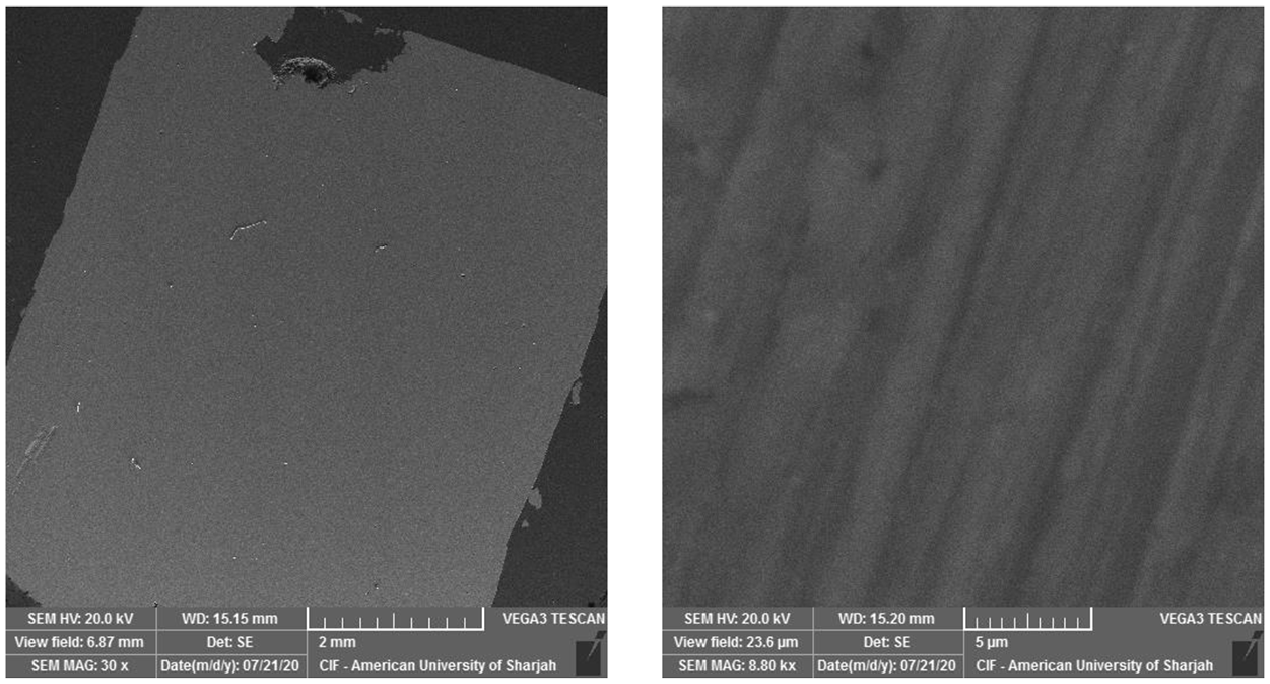
SEM pictures (cross sections at different magnification) for sample 6 (Gr% = 4%, NaCl = 10%).
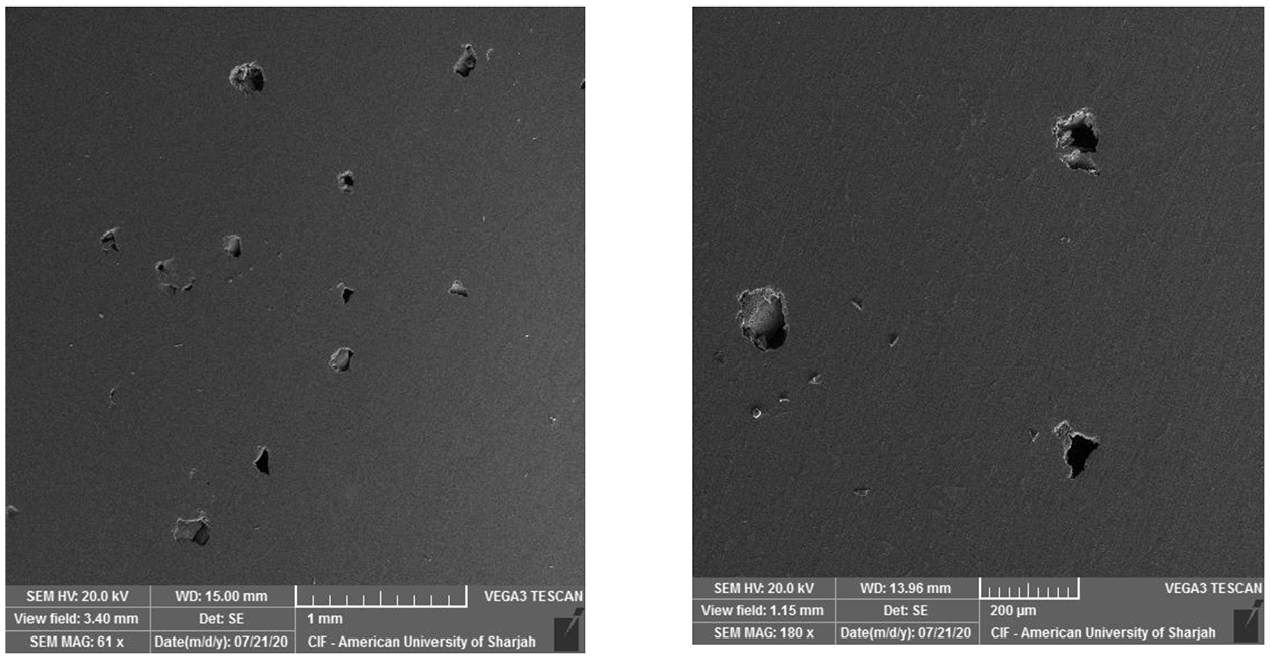
SEM pictures for sample 10 (Gr% = 8%, NaCl = 10%).
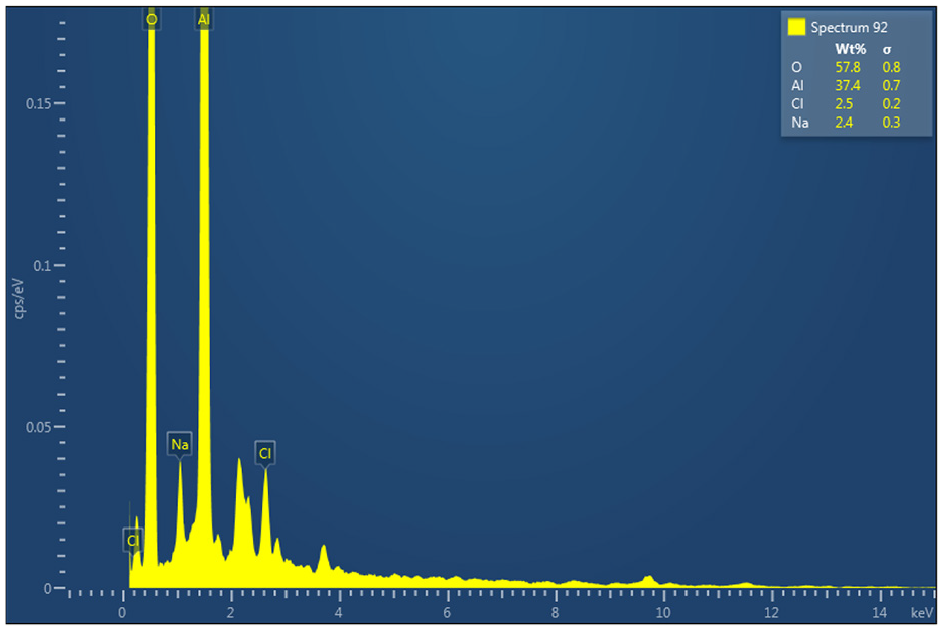
An EDS analysis for sample 6 (Gr = 4%, NaCl = 10%) and sample 10 (Gr = 8%, NaCl = 10%) were conducted. Sample 10 EDS analysis is depicted in Figure 17. Both analyses show similar results with sample 10 showing higher C%. Very small traces of NaCl were present indicating incomplete dissolving of place holder.
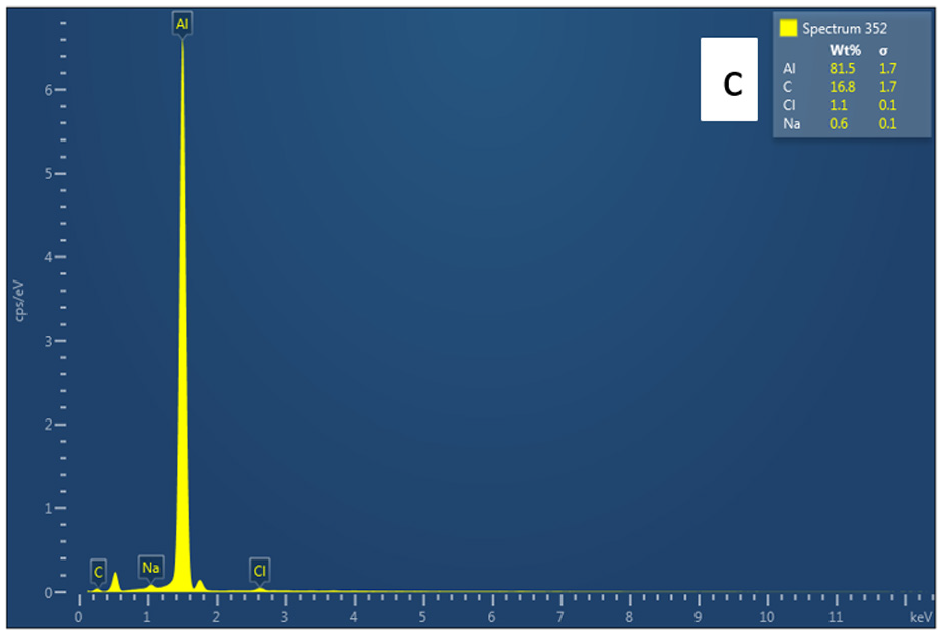
EDS analysis for sample 10 (Gr% = 8%, NaCl = 10%).
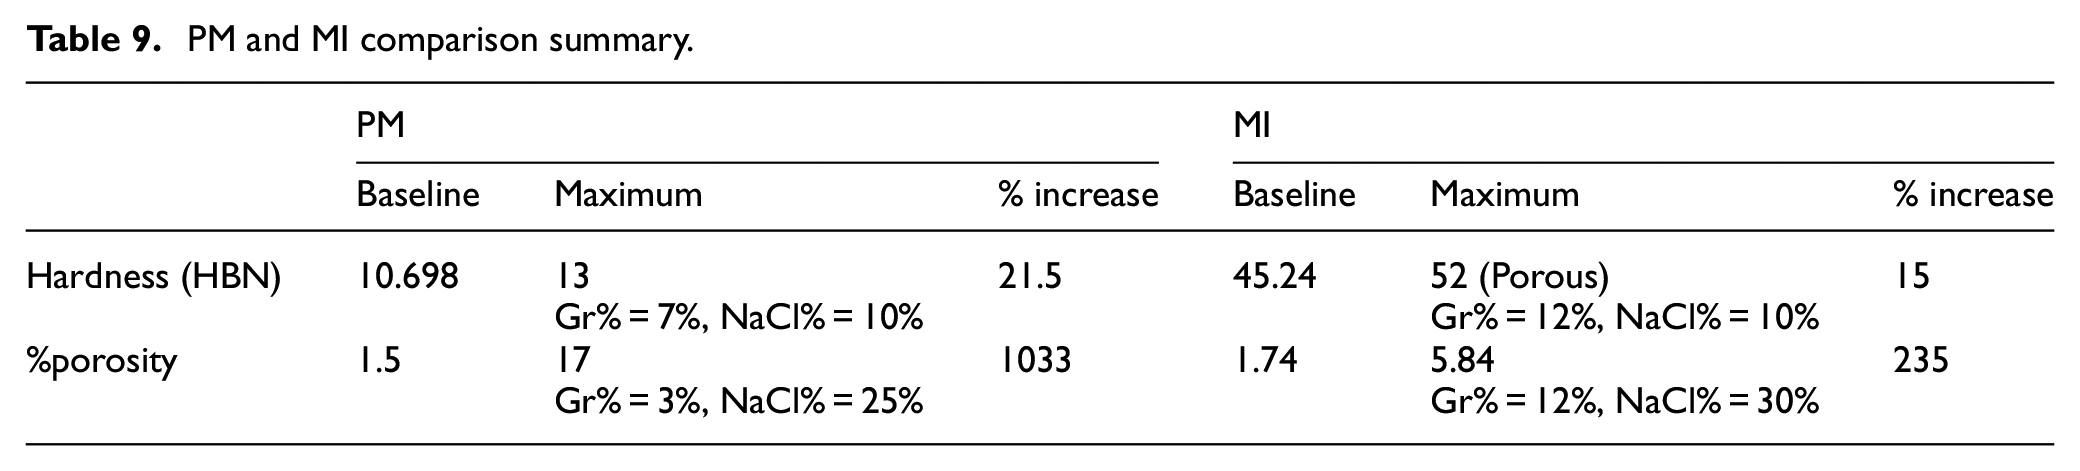
Table 9 provides a comparison between both methods in terms of hardness and porosity. Results obtained are based on the predictive models in equations (2)–(5). The baseline represents pure Al with no Gr or NaCl. Results suggest that the maximum percentage increase in hardness over baseline using PM and MI is 21.5% and 15%, respectively. In terms of porosity, porosity increased more than ten folds using PM and doubled using MI. This is attributed to the formation of type 1 and type 2 porosities in the PM method and predominantly only type 1 porosity in MI samples. The differences in the percentage of type 1 micro porosities between PM is primarily attributed to the un-sintered material and formation of oxide layers in the aluminum matrix. The role played by powder compaction pressure is also noted. The higher the compaction pressure, the higher the sintering rate and the final density, because of reduced green porosity and increased dislocation population. However, excessively high pressure should be avoided because it is neither practical for intended applications nor beneficial to the final microstructures in most materials. 46 It is more complicated in this case because the powder mixture contains a high proportion of NaCl particles. The brittle NaCl particles are liable to be crushed if too high a pressure is applied. There likely exists an optimum range of compacting pressure. The dependency of porosity and density of the green compacts on compaction pressure, with different NaCl particle sizes, and NaCl/Al volume ratio in the compacts is shown in the literature. 47 It is noted that the green porosity decreases linearly with increasing compaction pressure or NaCl/Al ratio. As shown in the literature, an optimum compaction pressure in the range of 150–200 MPa was employed in this study. Studies have shown that lower compaction pressure leads to defective Al foam and resulted in spalling of aluminum particles, whereas higher compaction pressure of greater than 300 MPa led to higher percentage of cracks in the preforms. 47 In the case of MI, the formation of microporosity is due to trapped gases and powder contamination. The absence of such an interconnected microporosity network in MI samples results in the entrapment of NaCl in the aluminum matrix and prevents it from being dissolved in the hot water. This phenomenon could be observed in the SEM picture in Figure 17 where a fraction of the NaCl still adhered in the matrix in the MI samples and not allowing the type 2 macropores to fully open up.
PM and MI comparison summary.
Conclusions
MMCF material provides a promising solution for applications where weight and energy absorption are critical. Experimentation results suggest that adding Gr enhances hardness while adding NaCl increases porosity. Based on predictive models, the maximum percentage increase in hardness over baseline using PM and MI is 21.5% and 15%, respectively. PM outperforms MI in terms of porosity; it can increase porosity up to ten folds while porosity can be doubled using MI. Moreover, NaCl% is inversely proportional to hardness since adding NaCl increases the number of pores after dissolving creating voids. Results also suggest that increasing Gr% in PM increases hardness up to an optimal value in which hardness will decrease beyond. Such a result is desirable since Gr nano-fillers are relatively expensive and any reduction in Gr will promote the economics of the PM process. Adding 9% Gr increased the modulus of elasticity and strength by 70% and 45%, respectively. Adding NaCl increases porosity but decreases the strength of the material. To reach optimum properties where porosity and hardness are maximized, a trade-off is needed using multi-objective optimization techniques.
Although controlling CNT distribution within the metallic matrix is a major challenge, it is easier to control the distribution of Gr and pores in PM than MI. Mass production of PM process is feasible through the automation of mixing, pressing, sintering and dissolution steps. PM samples produced are ductile, and the high active surface area of CNT results in lowering sintering temperature relative to coarser powders. The low sintering temperature is desired because it suppresses grain growth and minimizes energy consumption during manufacturing. The high density of interfaces and grain boundaries in nano-crystalline powders will lead to accelerated grain growth during sintering. On the other hand, MI has higher initial hardness values since ingredients are in their liquid molten form. The main disadvantage of the PM method is metallic oxidation which negatively impacts bonding. Control measures should be taken during mixing and sintering to prevent oxidation. The use of a vacuum furnace minimizes oxidation during sintering but increases cost and slow down productivity.
For future research, it is worth investigating the impact of powder particle size, sintering temperature, and compaction parameters on the physical and mechanical properties of PM samples. The poor wettability between graphene and aluminum powder is also worth investigating. Enhancing the wettability using other agents such as Zinc or Copper may further increase the strength and prevent graphene agglomeration in particular sites. Finally, porosity measurement accuracy can be enhanced using more sophisticated techniques such as the wave speed ultrasonic technique.
Footnotes
Declaration of conflicting interests
The author(s) declared no potential conflicts of interest with respect to the research, authorship, and/or publication of this article.
Funding
The author(s) disclosed receipt of the following financial support for the research, authorship, and/or publication of this article: This work was supported by the American University of Sharjah under grant EFRG18-MSE-CEN-18.