
Abstract
Surface finish is an important phenomenon in hard turning. There are many factors which can influence the finishing of a product. Literature review reveals that substantial research has been performed on hard machining, still relationship of tool wear and surface finish parameters like
Keywords
Introduction
Quality of a product and economy of any machining process depends on many factors. In any machining condition, tool wear is an important phenomenon as it has direct impact on product quality as well as machining economy. It is gaining more and more importance due to emergence of high speed CNC machines and alloys with more and more hardness. In an investigation, it was found that 50% to 80% of the expected tool life is only used in an industrial scenario. It is further observed that downtime of costly CNC machines due to the breakage of cutting tool varies from 7% to 20%. This fact is gaining more and more importance due to high cost of CNC tooling which is ever increasing in nature. Therefore, it is obvious that significant amount of loss of productivity occurs due to tool breakage or unused tool. In addition tool wear may be a significant factor to damage the machine also. Hence, non-optimum use of cutting tool can affect both product quality and manufacturing economy. In practice, many times either cutting tools are not used up to their full life or cutting tool are used beyond their effective life. Both under estimation and over estimation of tool life affects overall productivity and cost. Thus, having an idea regarding tool replacement time based on residual life is highly necessary for a machining system.
There are many influencing factors which can influence the surface integrity in a turning process. These are tool wear, vibration of machine tool and work piece system, nose radius of tool, and above all chip deformation and side flow. Contribution of the geometrical shape of tool into surface integrity is shown in equation (1). Figure 1 shows the influence of tool wear on surface roughness. Figure 2 shows the variation of tool wear with time.
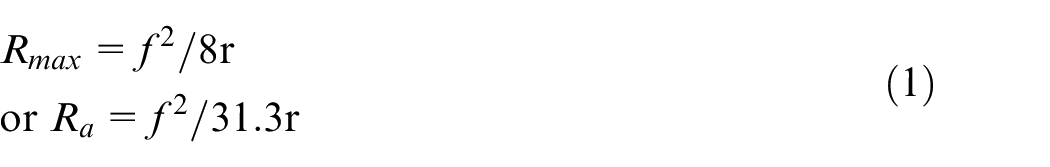
Where
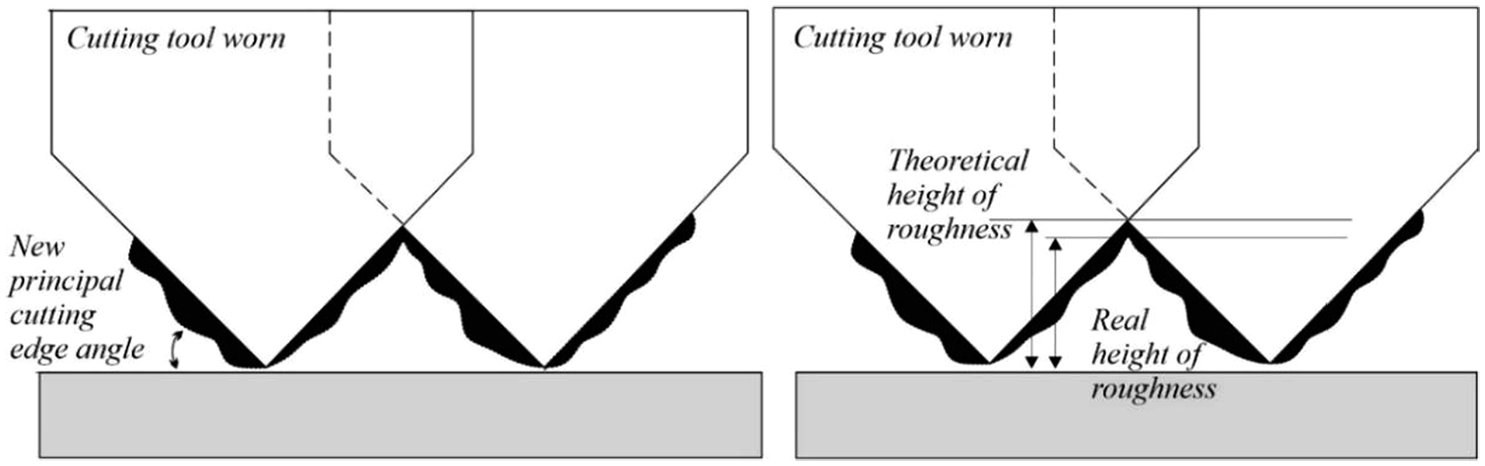
Variation of surface roughness due to tool wear.
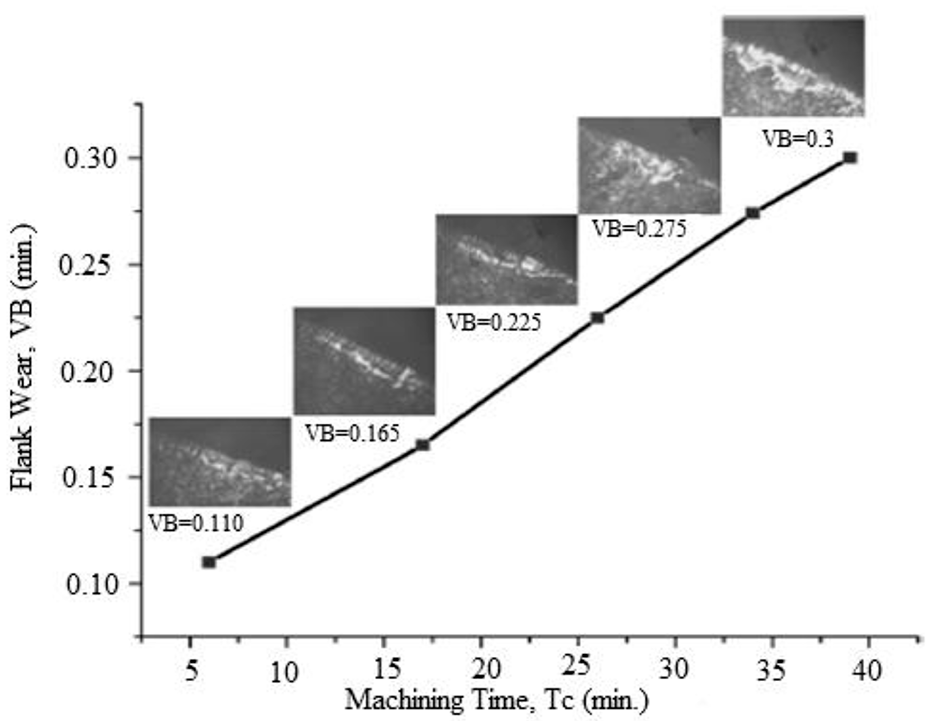
Progression of tool wear when v = 220 m/min, f = 0.087, and d = 0.52 for hard machining of dry hard turningof AISI steel using CVD multilayer coated carbide tool. 3
Related work
Jukovic et al.
1
used three algorithms and opined that polynomial regression method may be used for predicting cutting force and surface roughness but opined that ANN gives best performances for tool life prediction. Kumar and Chauhan
2
investigated on Al7075 and used Response Surface Methodology and concluded that best surface quality is achieved when feed rate is low. Das et al.
3
investigated on surface finish and progression of tool wear with time during hard turning of AISI4340 steel with multi-layer coated carbide tool. Jehan et al.
4
investigated the nature of tool wear and surface finish during micro slot milling of a particular milling of a particular type of polycarbonate using three types carbide tools namely coated with TiN and TiALN and uncoated also. Elias et al.
5
used both FEM simulations and experiments to determine the flank wear during micro-turning of Ti-6AL-4V alloy using both Usui tool wear model and Malakizadi model. Ma et al.
6
developed a theoretical model for tool wear mechanism and identified most influential factors during milling of Inconel 718. Pavani et al.
7
developed a Mamdani fuzzy inference system model, which is able to predict the wear zones in the form of hard and soft zones in place of contact of tungsten carbide inserts and the work piece during the machining process. Karandikar et al.
8
applied naïve based classifiers for tool condition monitoring in end milling of 1018 steel using carbide insert. They used the relationship of tool wear, the force features both in time, and frequency domain to train the naïve based classifiers. Barucka and Grzelak
9
studied the significance and influence of various factors such as economica, technological, political, and social on production machinery efficiency using logistic regression method. Mahel et al.
10
used adaptive neuro fuzzy approach to predict surface roughness, and performed correlation analysis between cutting force and surface roughness and established 96.65% of accuracy. Mia et al.
11
discussed the effect of feed rate on surface roughness and concluded that an increase of feed rate imparts higher cutting force and temperature. High temperature softens the material and facilities material adhesion over the machined surface which increases the average surface roughness. Karkolas et al.
12
used artificial neural network to predict the surface roughness and also concluded that the feed rate is the most influencing factor for surface roughness. Bouacha and Terrab
13
used steel and CBN tool as workpiece and cutting tool respectively and performed Analysis of Variance and concluded that cutting force mostly influenced by depth of cut and workpiece hardness and less sensitive to tool wear. Drouiket et al.
14
predicted the residual tool life and concluded that root mean square value of power is the most sensitive factor to tool wear. Rao and Murthy
15
used Response Surface Methodology (RSM), Artificial Neural network (ANN) and Support Vector Machines (SVM) to investigate the machinability characteristics of AISI 316 steel and concluded that cutting speed is the most influencing factor for machine vibration. Shankar et al.
16
opined that best surface finished might be obtained in case minimum feed rate. Shankar et al.
17
expressed that an increase in depth of cut increase the flank wear and cutting force simultaneously. Mia and Dhar
18
investigated on hard steel under Minimum Quantity Lubrication condition and optimized the surface roughness and identified the most influencing factor. Kara et al.
19
investigated
Gaussian distribution
The nature of distribution of data obtained from an experimentation can be of various types namely Bernoulli distribution, Multinomial distribution, Weibull or Gaussian distribution. Choice of a particular distribution depends upon the nature of data. In this investigation, Gaussian distribution is used to analyse the data. This is basically a normal distribution which indicates that the frequency of occurrence of any particular event is more near the mean than that of the far from the mean. This distribution is continuous in nature. The probability distribution function (PDF) of Gaussian distribution is represented in equation (2) as follows.
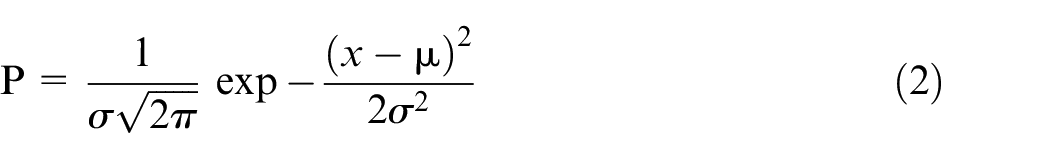
Where σ is standard deviation and µ is mean of the data and the values of x lies between –α< x < α
Naïve based classifier
In this investigation, Naïve Bayes classifiers 8 is used for probabilistic modelling of tool wear based on observed geometric data of surface integrity. The basic steps of Naïve based classifiers are as follows.
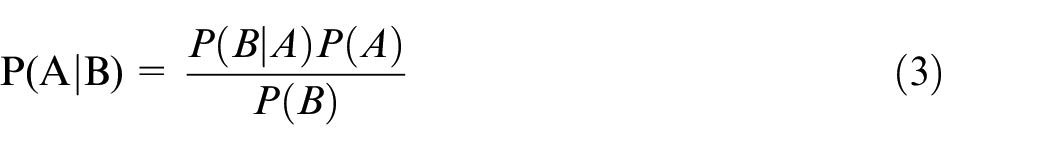
Let, there are two events (e.g. tool wear and surface roughness) and the probabilities of the uncertain events A and B is P (A) and P (B) respectively which is independent in nature. The conditional probability of B given that event A has occurred is P (BIA). Now, we used Bayes rule to fix the posterior probability or belief about event A observing the experimental result, P (AIB) as shown in equation (3) as follows.
Bayes rule helps us to gain information through observation.
If there are n no. of experimental results like
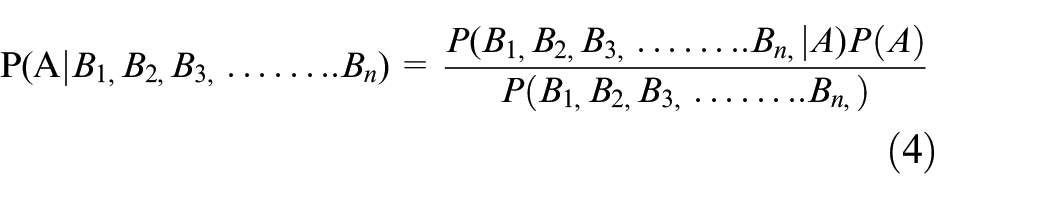
The numerator of equation (4) is a probability of P (A,
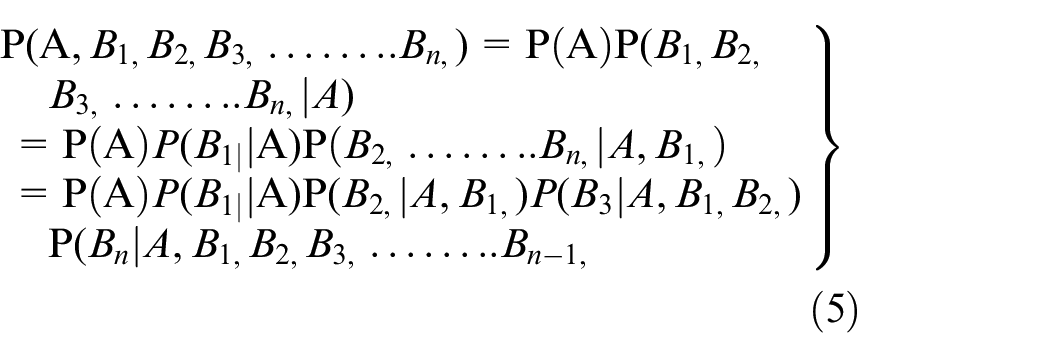
It is to be noted that in case of n having large value, it is a tedious task to calculate the joint probability P (A,

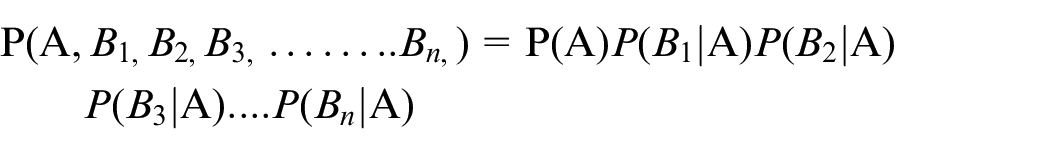
Conditional independence assumption simplifies equation (3) as follows.
Again, considering the Bayes rule and naïve conditional independence assumption can be rewritten as equation (7) as follows.
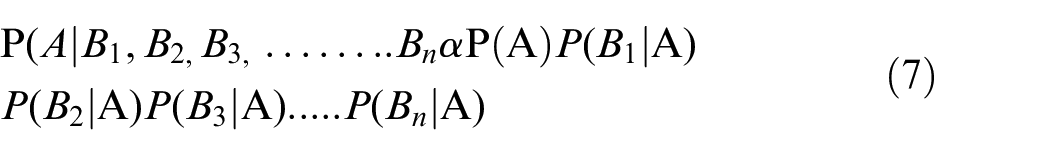
It is to be noted here, that denominator of equation (5) is a normalizing constant and it is not shown in equation (7).
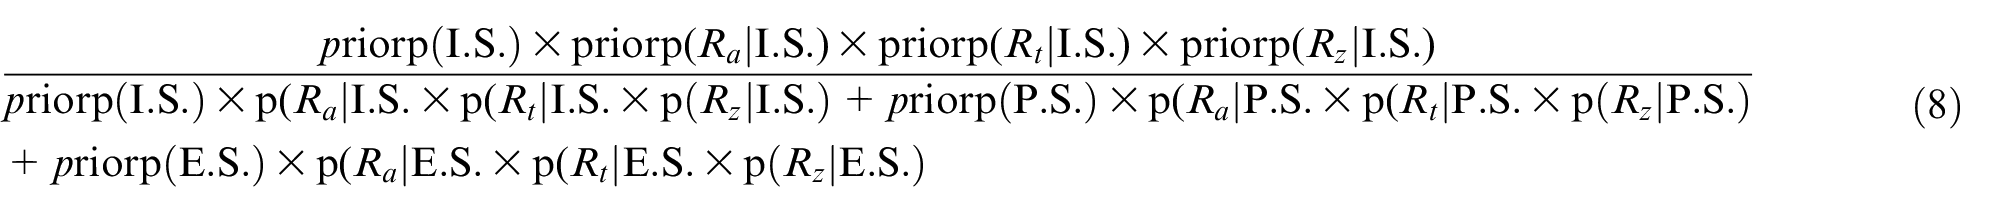
Naïve based classifier to identify the stages of tool wear
In this investigation, the stages of tool wear are classified in three distinct stages which are given below
Initial stage (I.S.)
Progressive stage (P.S.)
Exponential stage (E.S.)
Naïve based classifier is used to identify the stage of tool wear given the that certain surface integrity namely
Posterior probability of initial stage is given in equation (8) as follows
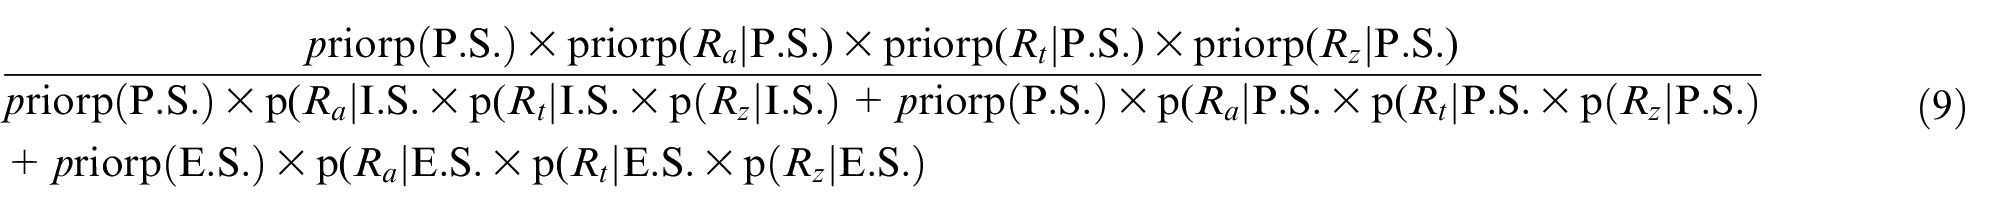
Posterior probability of progressive stage is given in equation (9) as follows
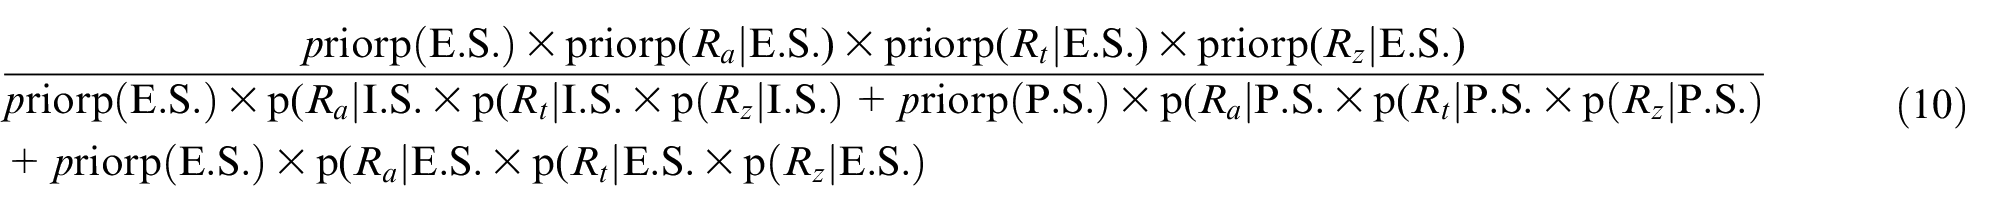
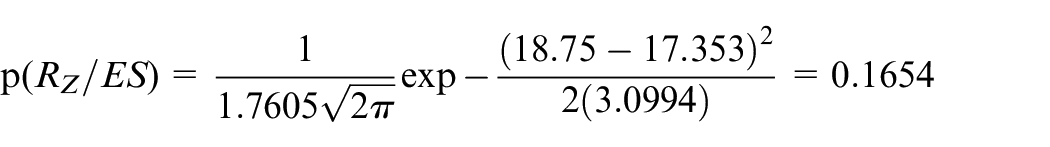
Posterior probability of exponential stage is given in equation (10) as follows.
From the above three equations, posterior probabilities need to be determined from the experimental data
Multinomial logistic regression
Logistic Regression is used when the output is binary in nature e. g. when a student will pass or not, a structure will break or not, or a particular person will develop a disease or not? Multinomial logistic regression model is similar to a Logistic Regression model but the only difference is that the probability distribution of the response variable or dependent variable is multinomial instead of binomial.
Let Yi are categorical response variables and Xj are independent variable where,
i = number of categories of the response variable (Y1, Y2, Y3…….Yn)
j = number of independent variables (X1, X2, X3……………………Xj)
Then, if there are three stages (Y1, Y2, Y3) that is, categories of the response variable, and three independent variable (X1, X2, X3) the model can be written as equations (11) to (13).
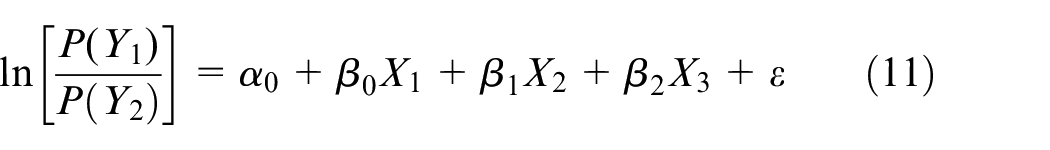
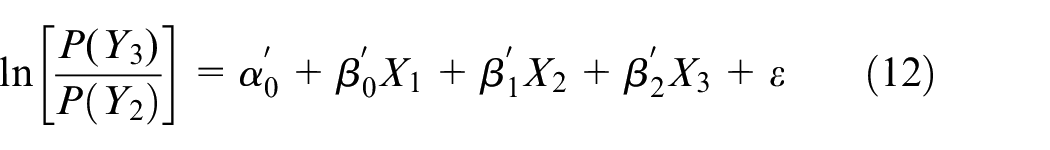

Where, P(Y1), P(Y2), P(Y3) are probabilities of each category of the response variable
ε = error
Here in the model P(Y2) is taken as reference for the log odds. Anyone of the P(Yi) can be taken as the reference and the number of log odds and the probabilistic equation will be (i-1).
Prediction for tool wear using Multinomial Logistic Regression.
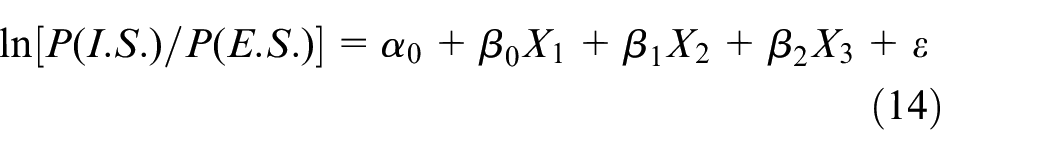
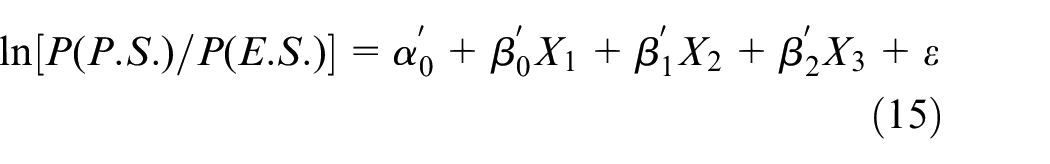
In this investigation, three distinct categorical responses are as follows
Initial stage (I.S.) of the tool wear
Progressive stage (P.S.) of the tool wear
Exponential stage (E.S.) of the tool wear
Multinomial Logistic Regression (MLR) is used to identify the stage of tool wear given that certain surface integrity namely

Experimentation
Cylindrical bar of AISI D2 steel is used as work piece material. Dry turning operation have been performed on CNC turning centre as shown in Figure 3. Carbide inserts coated with TiN (CNMG 120408) have been used to conduct experiments. Tool wears are measured after 180s, 360s, 540s, 729s, 900s, 1080s, 1260s and 1440s.
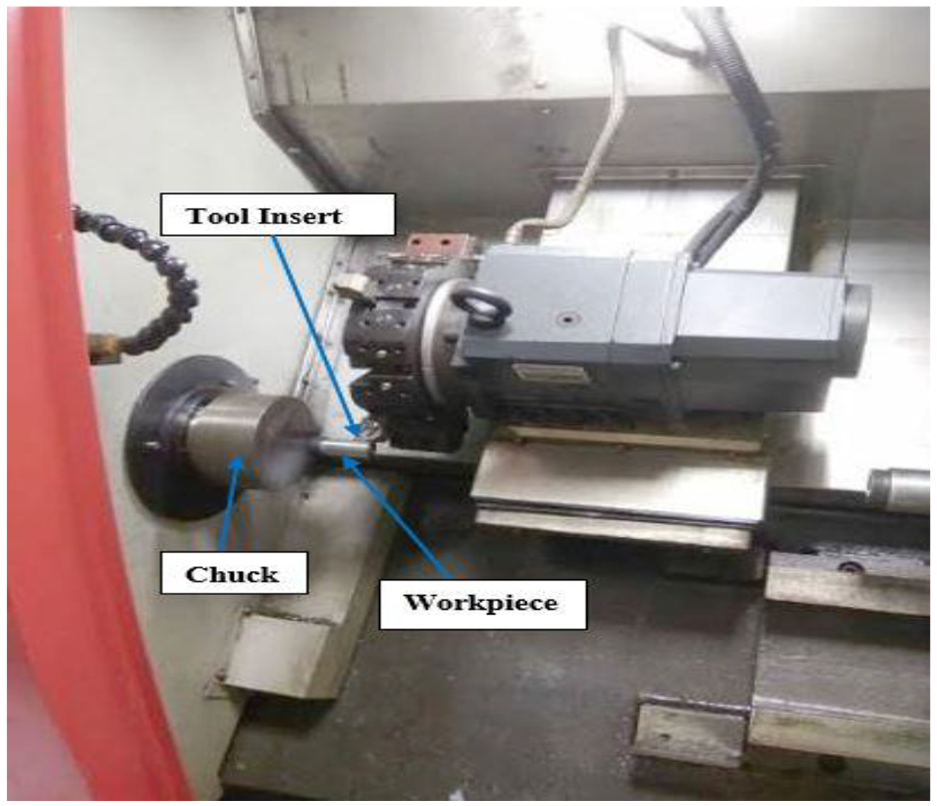
Experimentation on CNC turning centre.
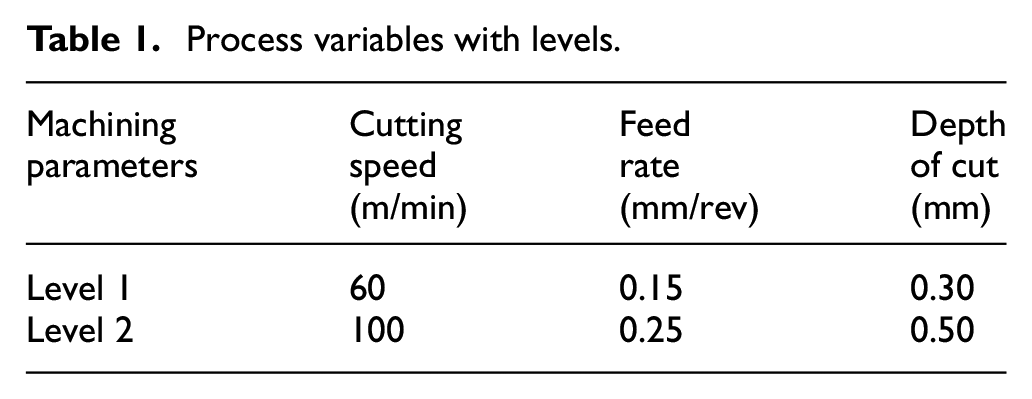
The value of cutting parameters are selected based on literature review and capacity of available machining set up. The machining parameters with their levels are given in Table 1.
Process variables with levels.
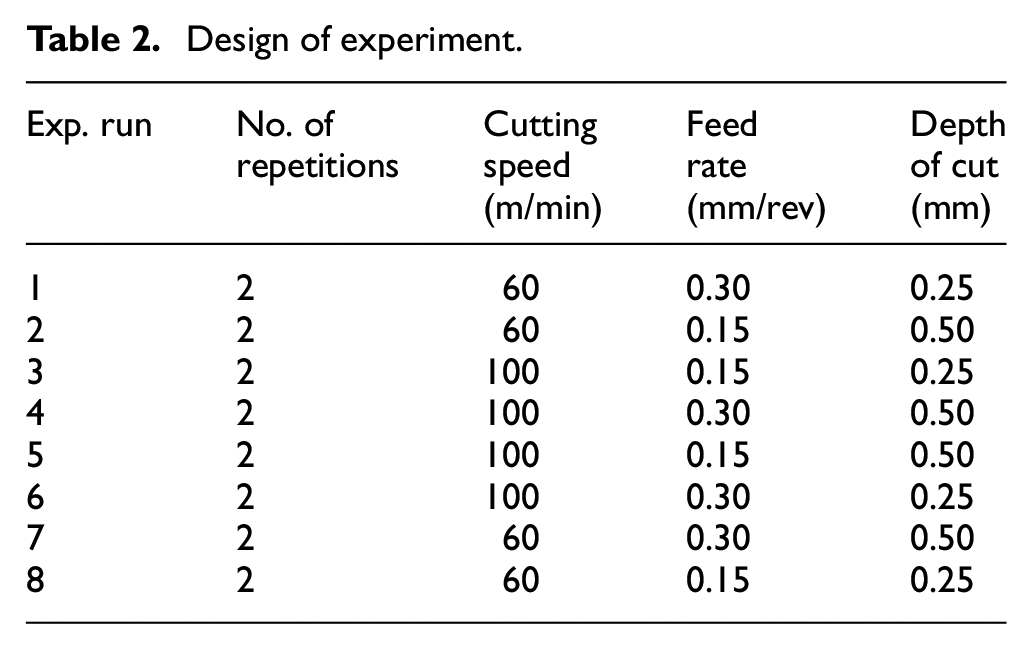
Experiments have been performed based on the full factorial design of experiment considering three factors with two levels as given in Table 2.
Design of experiment.
The cutting tool fails when the tool becomes dull and no longer operates within acceptable quality. Critical tool wear limit is chosen based upon the economic aspect of the machining process and product. In this study, it is assumed that when the flank wear reaches the value of 0.2 mm, then the life of the cutting tool ends. Sixteen number of new cutting tool inserts were used for eight no. of experiments (each experiment was repeated two times). Figures 4 and 5 show the measurement of tool wear and surface parameters respectively.
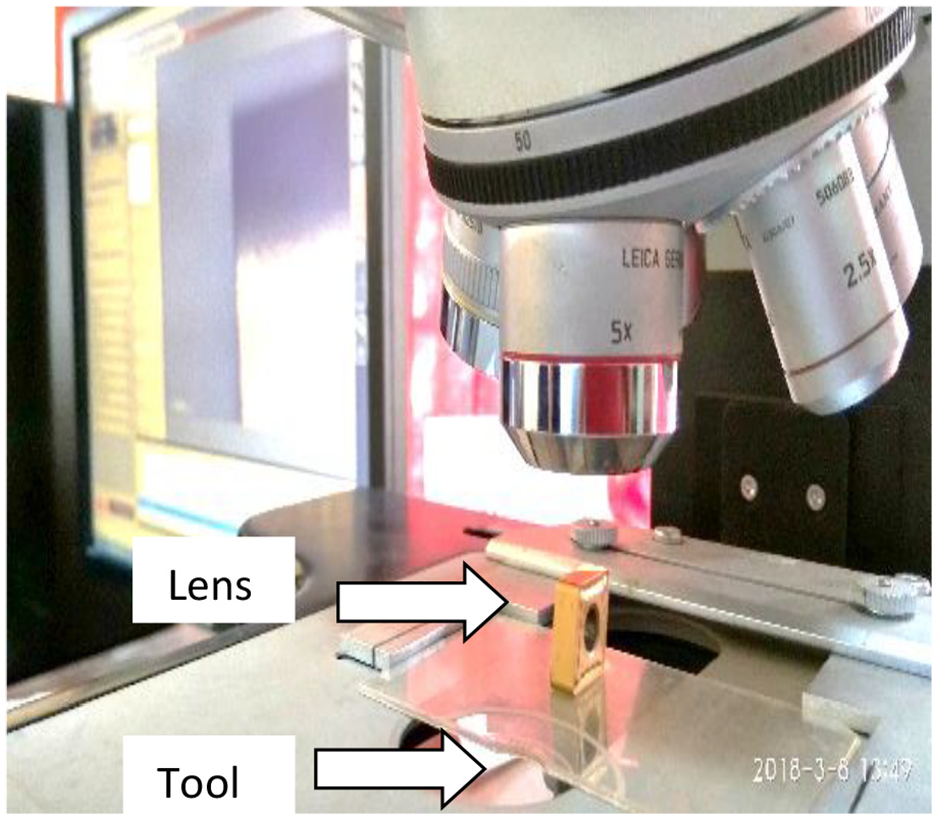
Measurement of tool wear using upright materials microscope.
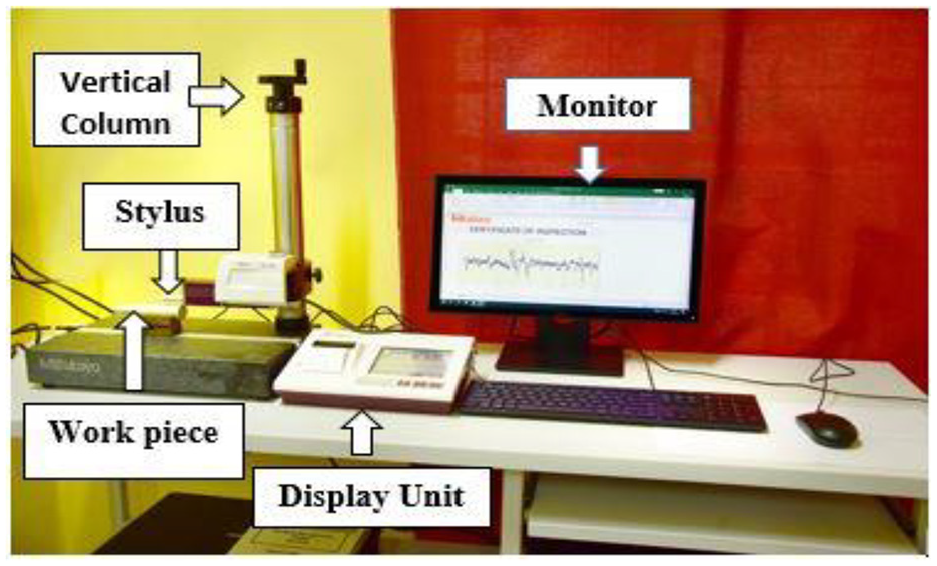
Measurement of surface parameters.
Results and discussions
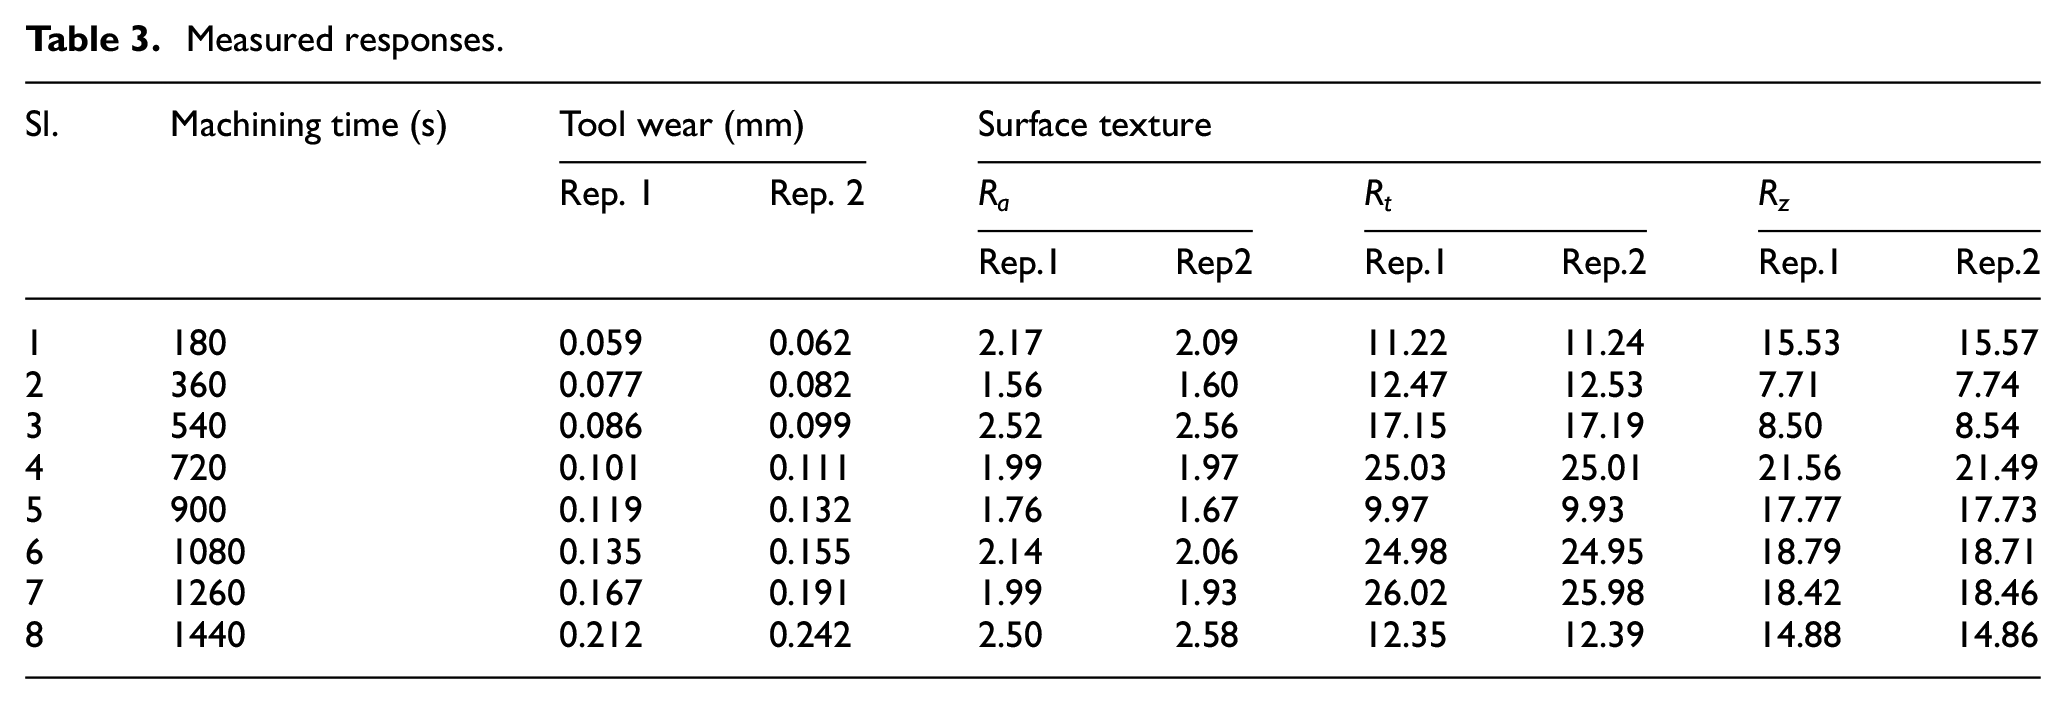
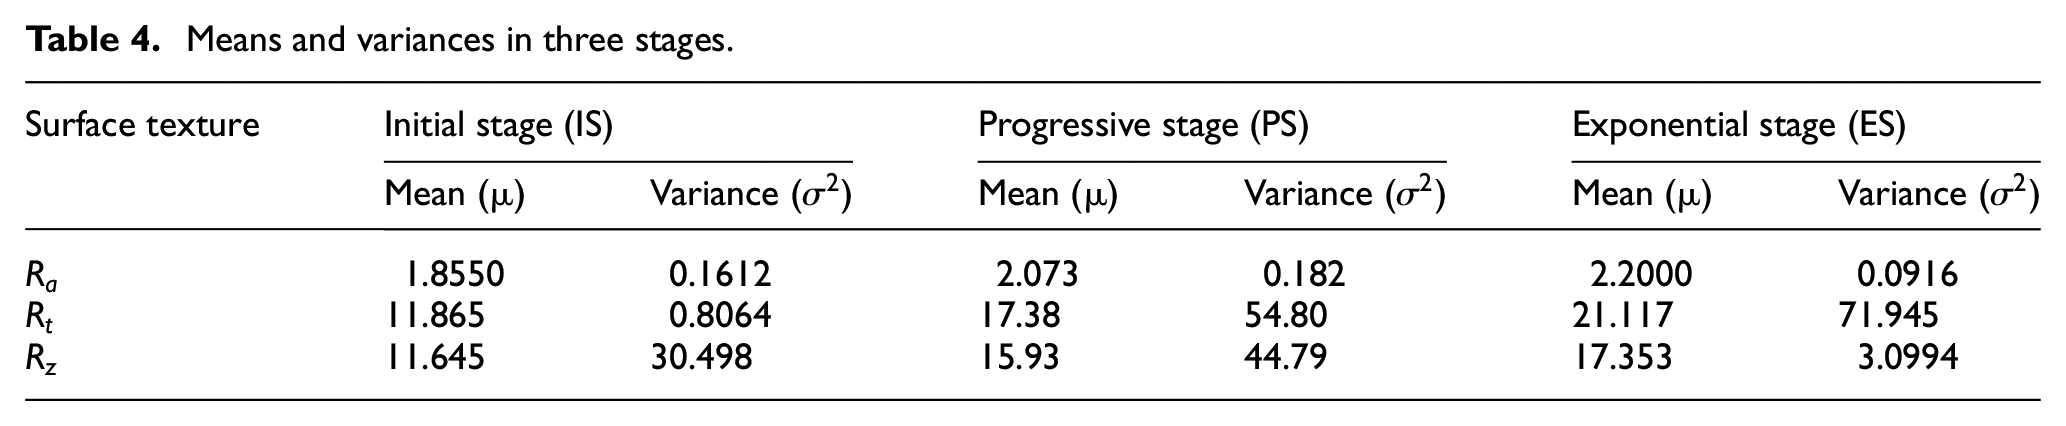
Naïve based classifier method was used to predict the tool wear assuming that certain surface texture already occurred. Table 3 shows the tool wear and surface texture parameters after experimentation. Table 4 shows the means and variances of the observed data.
Measured responses.
Means and variances in three stages.
Each experimental run has been repeated twice using sixteen number of new cutting tools in order to include random nature of data. While turning, sequential observation (measurement of tool flank wear) has been carried out until the pre-defined threshold flank wear limit
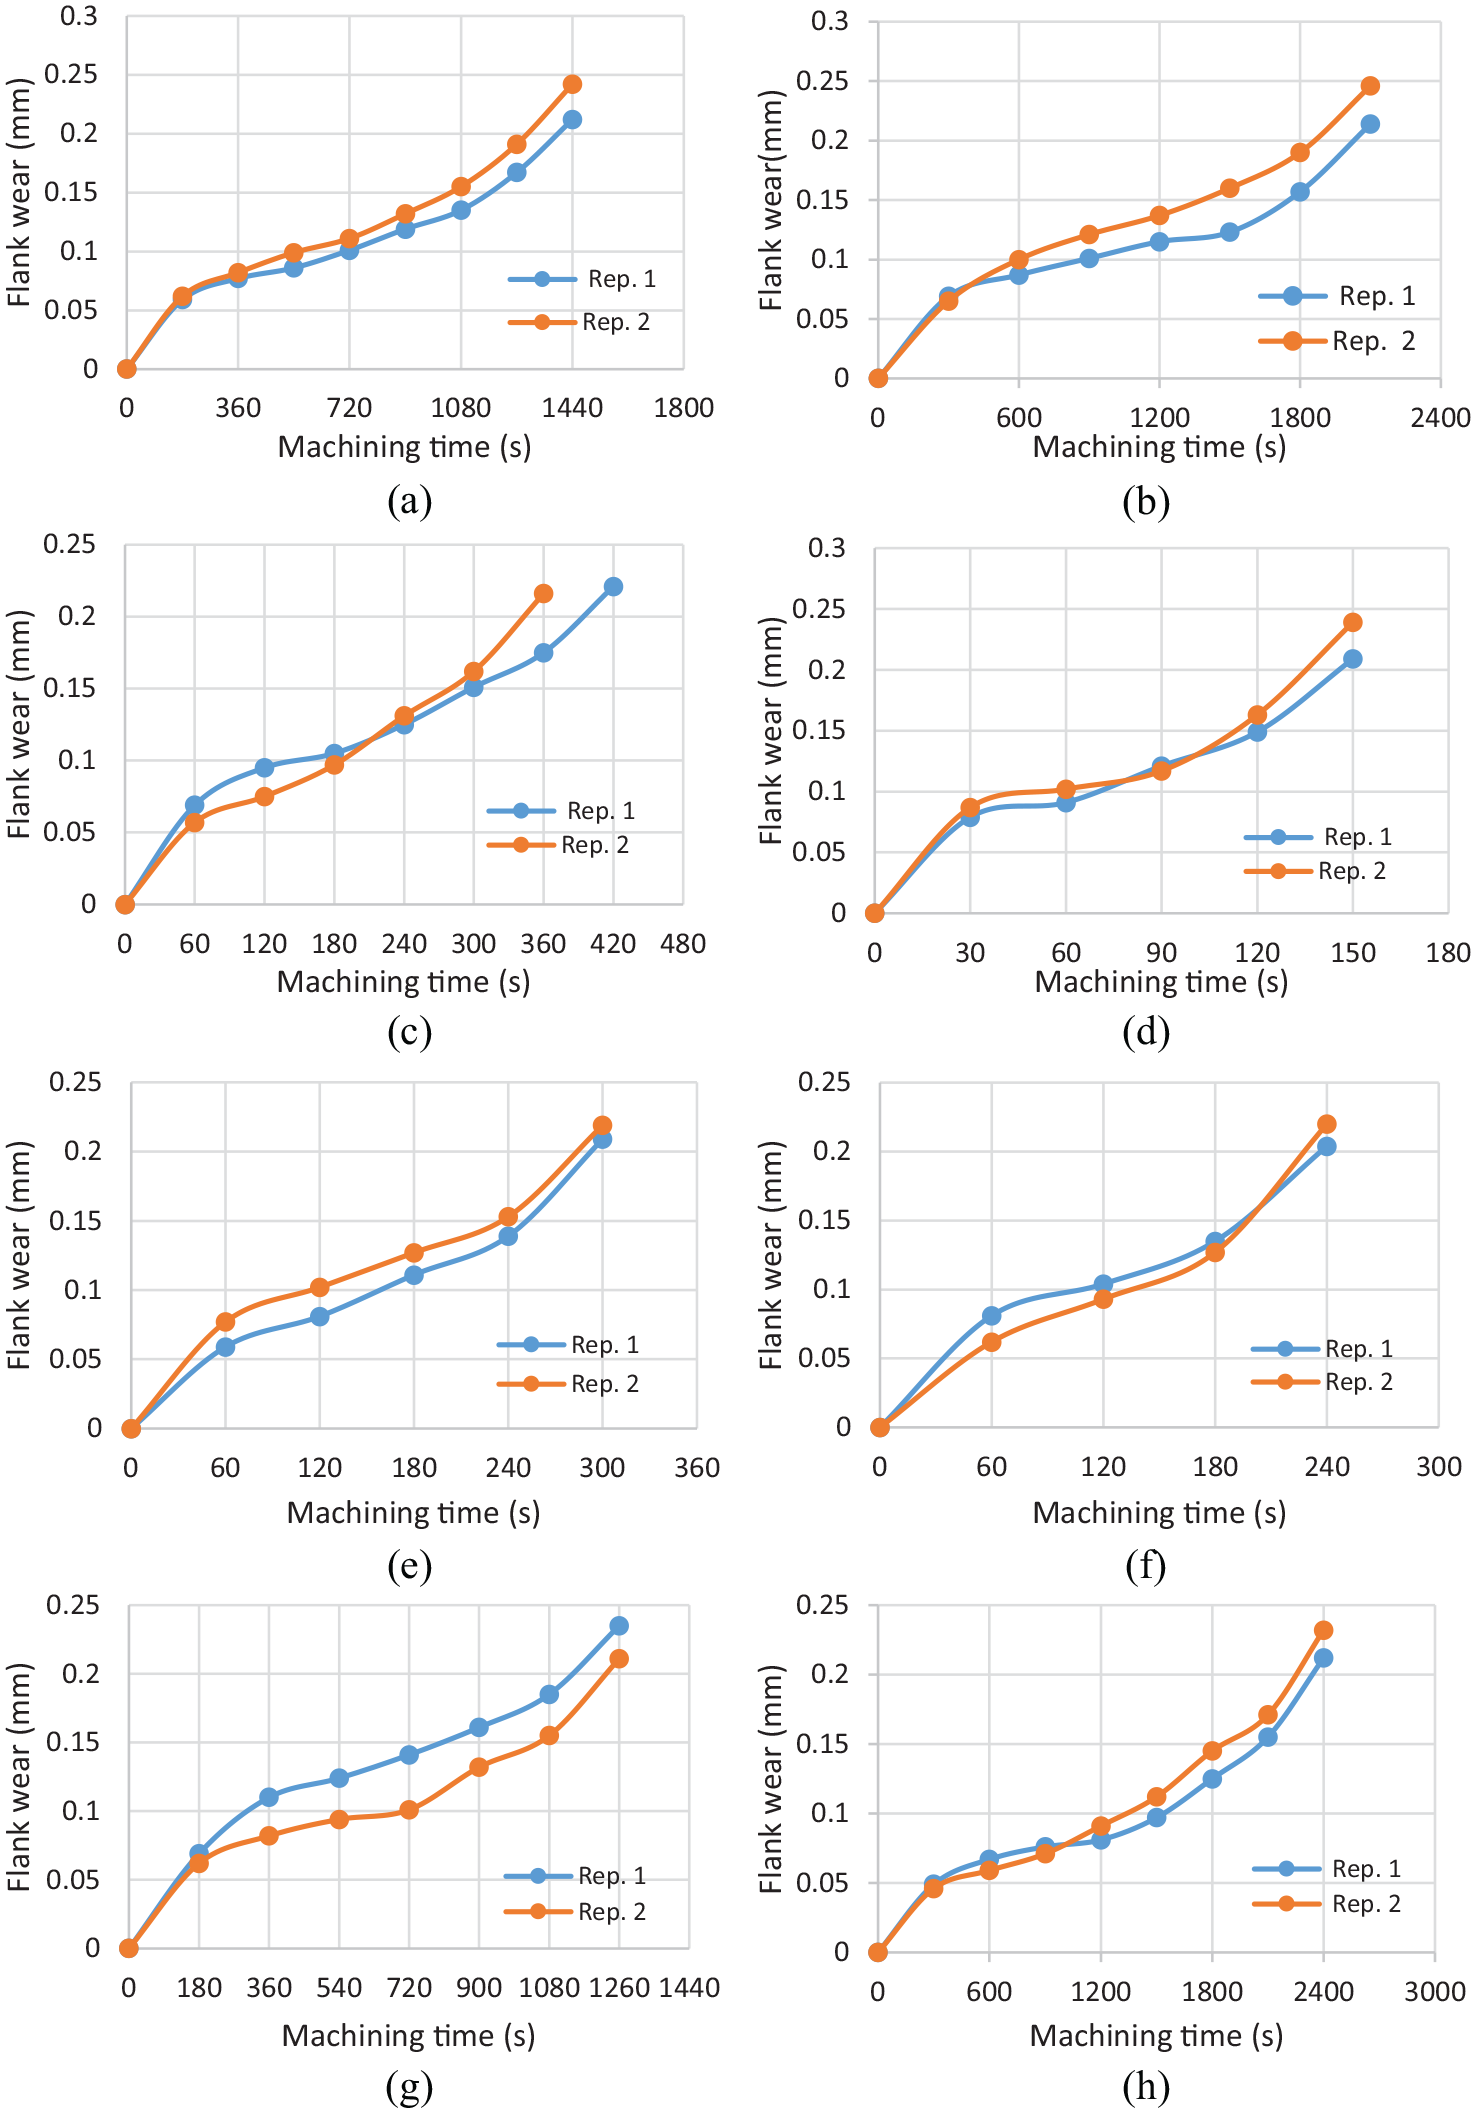
Variation of flank wear curve for 8 experiments: (a) Exp. 1, (b) Exp. 2, (c) Exp. 3, (d) Exp. 4, (e) Exp. 5, (f) Exp. 6, (g) Exp. 7, and (h) Exp. 8.
Observing the closeness of the data, all height parameters can safely be assumed that it follows Gaussian distribution as stated in equation (2). All stages are equally likely therefore prior probabilities of initial stage = prior probabilities of progressive stage = prior probabilities of exponential stage = 0.33 as they are equally likely.
Testing with naïve based classifier
For testing the model discussed above, let us assume the following arbitrary data,
First, we calculate the individual conditional probabilities for the above data as follows.
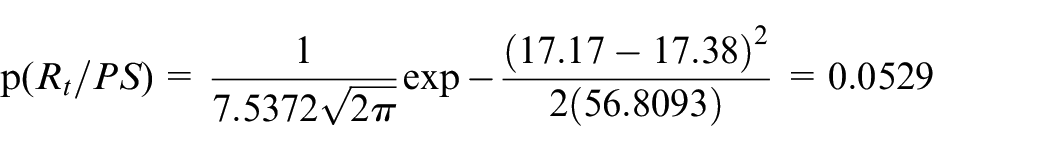
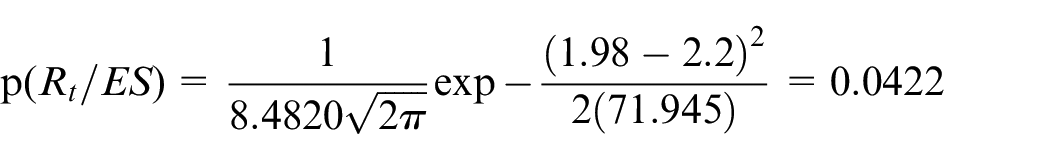
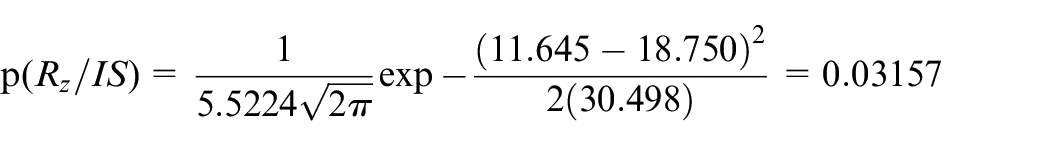
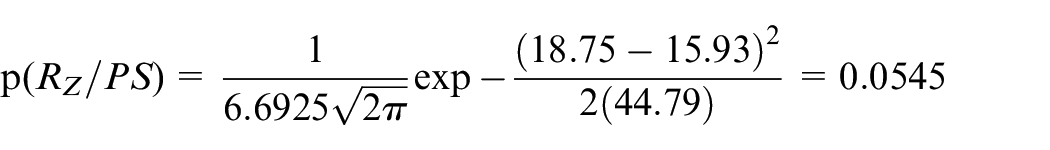
Probability of surface roughness,
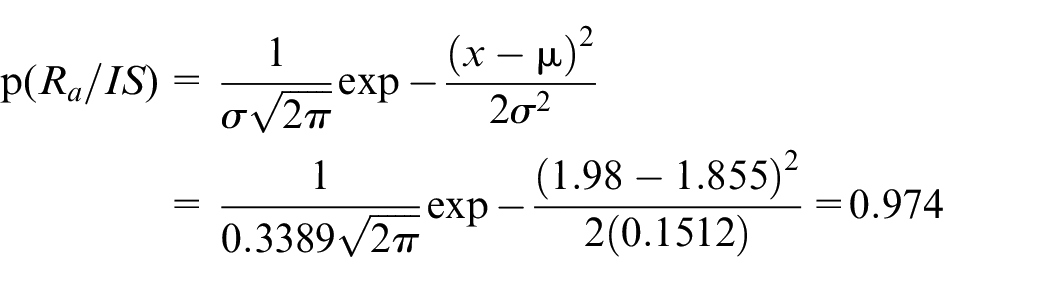
Probability of surface roughness,
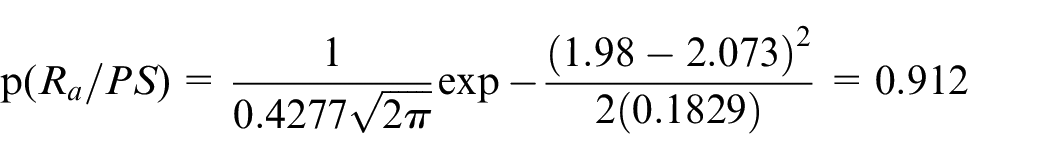
Probability of surface roughness,
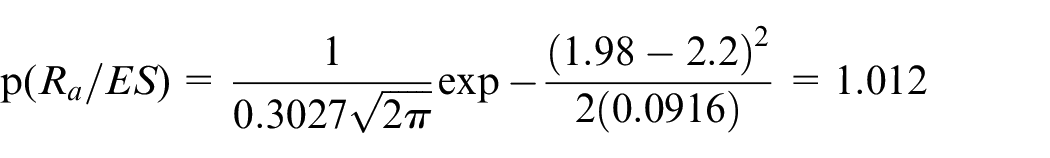
Probability of surface roughness,
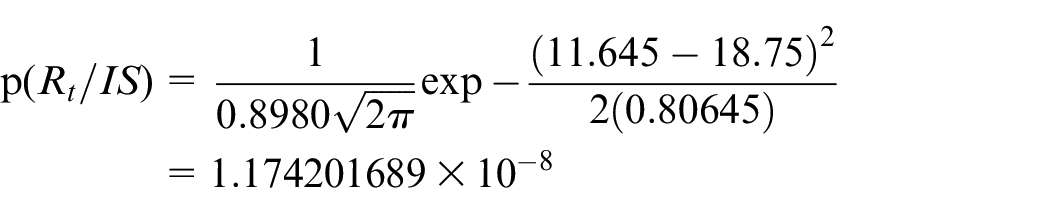
Probability of surface roughness,
Probability of surface roughness,
Probability of surface roughness,
Probability of surface roughness,
Probability of surface roughness,
Putting the above value in equation (8), we get
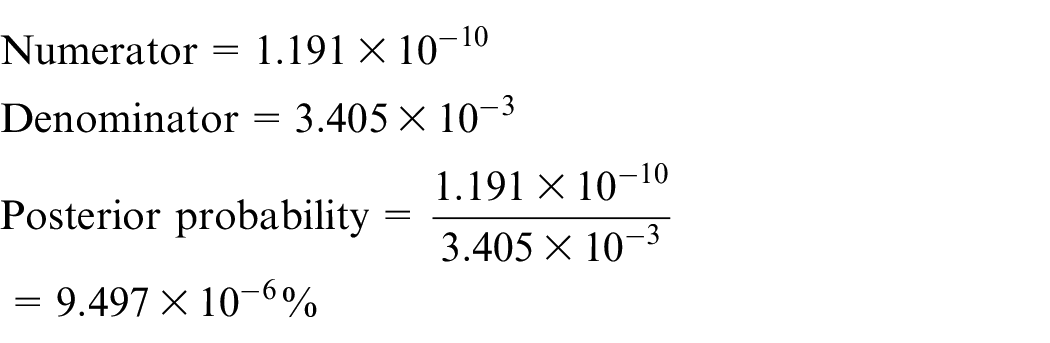
Therefore, the posterior probability of initial state is 9.497 ×
Putting the above value in equation (9), we get
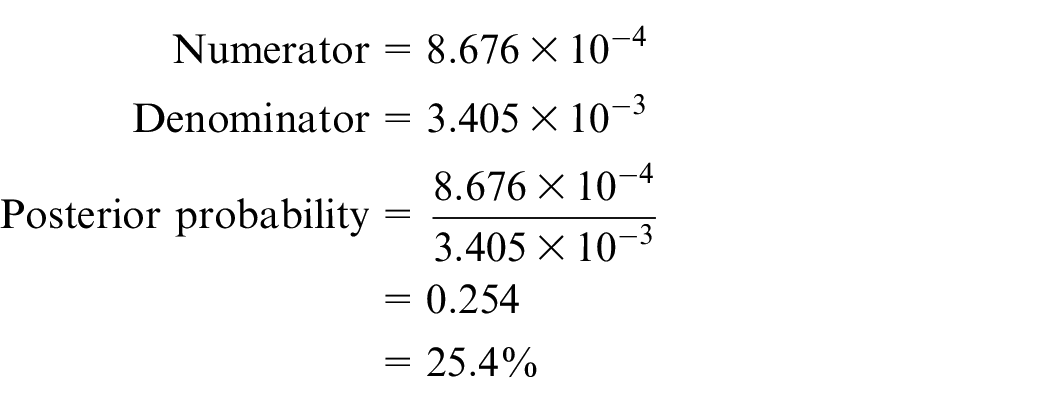
Therefore, the posterior probability of progressive state is 25.4%
Putting the above value in equation (10), we get
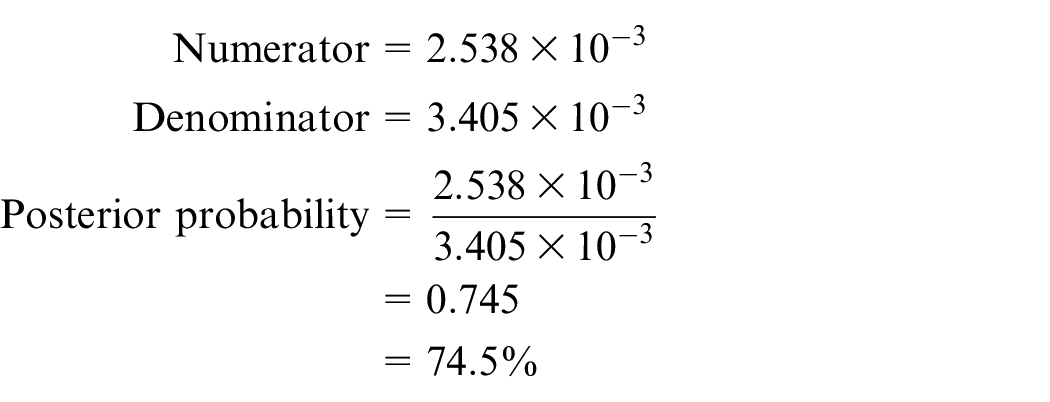
Therefore, the posterior probability of exponential state is 74.5%
Therefore when
Testing with multinomial logistic regression
Using the responses obtained as in Table 3, the MLR model is trained with statistical software ‘R’ and the model gives the value of the coefficients as follows.
The model is trained with the data obtained from the experimentation, the estimated error of the model is found to be 18.75%
This model is further tested with same arbitrary values of
P(I.S.)=3.024083755×10−41
P(P.S.)=0.329131263 = 32.91%
P(E.S.)=0.670868737 = 67.08%
Therefore, both of the above model indicate that the tool have reached in exponential stage when the surface integrity parameters are
Conclusion
A predictive tool wear model is developed and discussed using naïve based classifier method. Three surface texture characteristics namely surface roughness
Footnotes
Declaration of conflicting interests
The author(s) declared no potential conflicts of interest with respect to the research, authorship, and/or publication of this article.
Funding
The author(s) received no financial support for the research, authorship, and/or publication of this article.