
Abstract
Ball screw mechanisms (BSMs) are used as accuracy transmission components in a wide range of industries and are characterized by their high accuracy. More specifically, the positioning accuracy of BSM has a significant effect on the accuracy of machine tool. Based on the macro-micro multiscale method, an exponential prediction model for the BSM positioning accuracy was developed considering time-varying working conditions (load and rotational speed) and feed modes. Since the accuracy degradation is mainly caused by wear, a microscopic approach was proposed to describe the positioning accuracy retention and the microscopic wear process was investigated. The sliding contact of the asperities between the ball and raceway was analyzed, and the microscopic wear behavior of the asperities was determined. Considering the time-varying working conditions, the BSM positioning accuracy characteristics were obtained under the normal feed mode by conducting suitable tests. The exponential wear model used the wear index to describe the wear status based on the positioning accuracy measurement. The accuracy loss value and the prediction index of positioning accuracy were determined based on an exponential model, and the effective lifetime of the BSM was predicted. Finally, the exponential prediction model was used in negative/positive skew feed distribution, and the effective lifetime determined.
Keywords
Introduction
The ball screw mechanism (BSM) is an important functional transmission component commonly widely used in various fields, such as transportation, CNC machine tools, and other industries precision equipment. The accuracy degradation of the BSM significantly affects the transmission accuracy of the precision device. The accuracy retention indicates the ability to maintain the accuracy at a certain level under certain conditions and times. Accuracy is mainly deteriorated by wear. The studies on BSM accuracy retention mainly include accuracy degradation basic, analysis of accuracy degradation, and revealing the law of accuracy degradation.
The basics of the BSM accuracy degradation include kinematics1–5 and dynamics,6–13 which have been independently investigated. First, Lin et al. 1 conducted a basic study on BSM kinematics. Based on the work of Lin et al., 1 Wei and Lin 2 improved the kinematics considering the effect of structural parameters such as contact angle. Based on the kinematics analysis, Lin et al. 3 initially established a design method for optimizing the transmission efficiency. The contact load distribution was investigated by Lin et al. 4 and Zhao et al., 5 considering the motion torque and geometric error, respectively. The research on the BSM dynamics has been mainly focused on the high-speed, 6 high acceleration, 7 and multi-domain integrated modeling. 8 The working conditions that affect the BSM dynamics include the worktable position 9 and the time-varying and piecewise-nonlinear stiffness. 10 Moreover, the effect of operating temperature on the BSM dynamics was also studied.11–13
With regard to analysis of accuracy degradation and the law of accuracy degradation, based on the basic research on friction and wear and the creep theory,14,15 BSM wear models and wear characteristics have been established, and related experiments have been designed and conducted.15–19 In addition, the positioning accuracy prediction 20 and accuracy compensation of the ball screw 21 have also been studied. Based on the creep theory, Xu et al. 15 established a BSM friction force calculation model, while Oh et al. 16 improved the friction torque model of a double-nut BSM. The BSM wear characteristics have been extensively investigated by Wei et al., 17 Zhou et al., 18 and Cheng et al. 19 based on the Archard theory. 22 In particular, Zhou et al. 18 studied the precision loss rate of screw raceway based on the wear analysis. Cheng et al. 19 investigated the BSM accuracy degradation due to wear under time-varying conditions. The positioning error of the ball screw feed drive system was predicted considering different mounting conditions, 20 and an adaptive on-line analytical compensation model of the BSM positioning error was established. 21
In summary, the kinematics, dynamics, and wear modeling of BSMs have been investigated in detail. However, little study revealed the macroscopic BSM wear characteristics from the microscopic wear perspective. In addition, the accuracy degradation under the action of micro-sliding wear and the lifetime prediction under specific operating conditions also need to be investigated. These problems were solved by the macro-micro multiscale method to reveal the accuracy degradation law from the microscopic wear perspective. According to the accuracy degradation characteristics, an exponential prediction model for the positioning accuracy of BSM was developed considering time-varying working conditions (load/rotational speed) and feed modes. Finally, the positioning accuracy retention was investigated under a normal feed mode, and the effective BSM lifetime was predicted.
Microscopic wear of contact asperity
Sliding contact of asperity
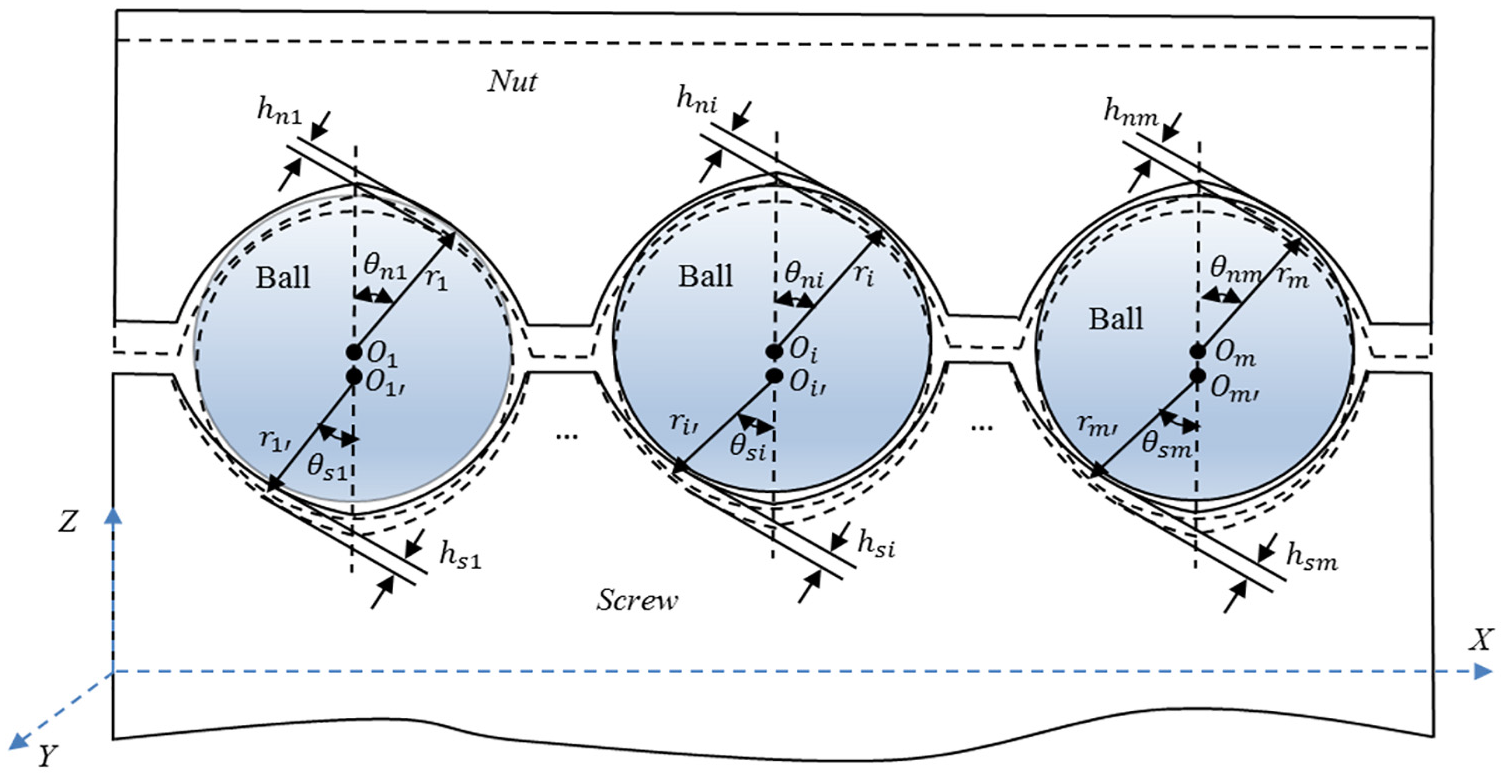
As shown in Figure 1, the contact surface between ball and raceway comprises many asperities. According to the GW contact principle,
23
the number of asperities
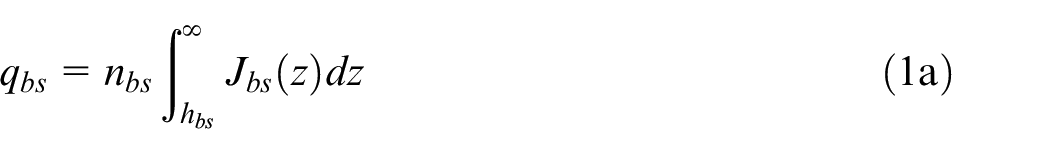
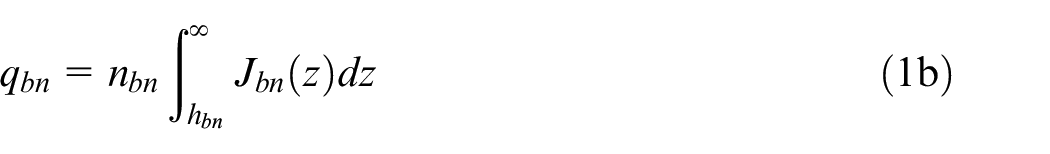
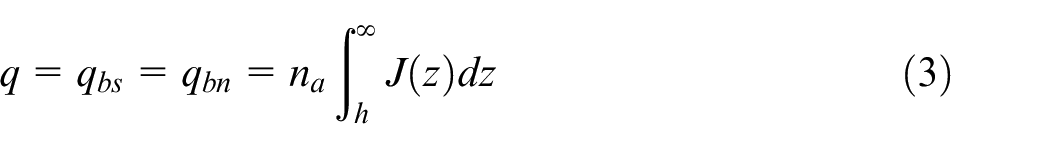
where


Subsequently, the number of asperities q between the ball and raceway were obtained as follows:
where

where
Then,
where
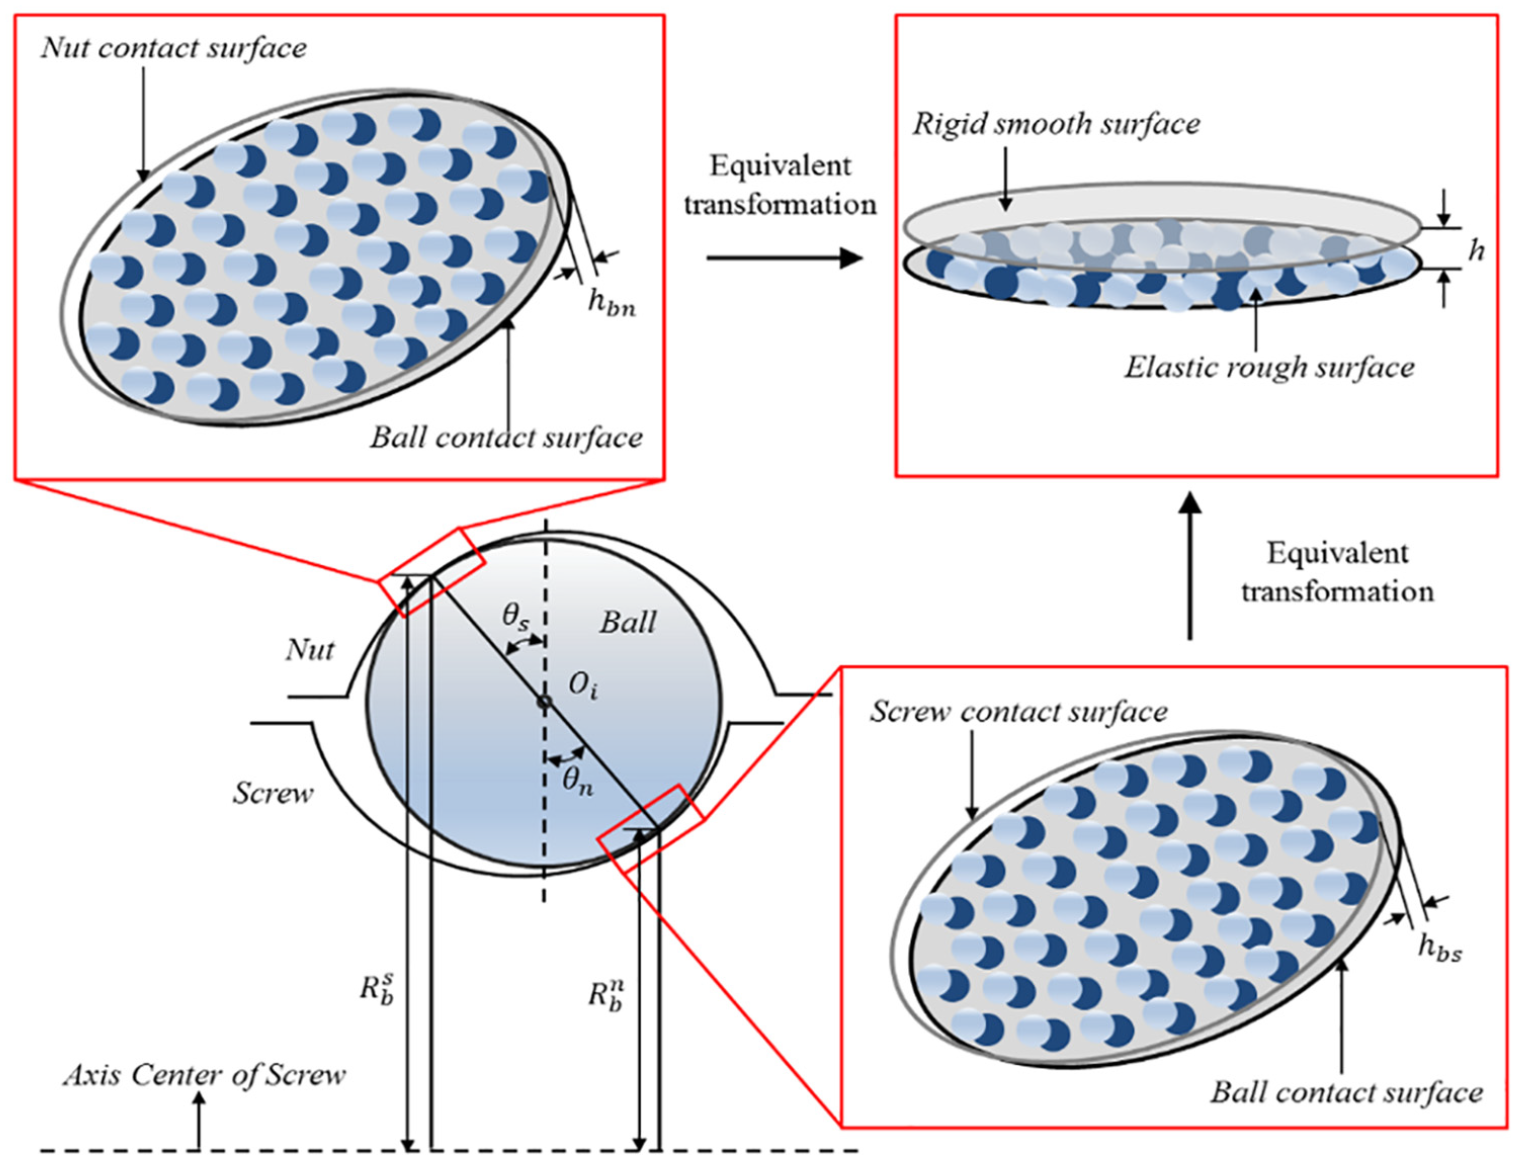
Microscopic contact diagram of ball and raceway.
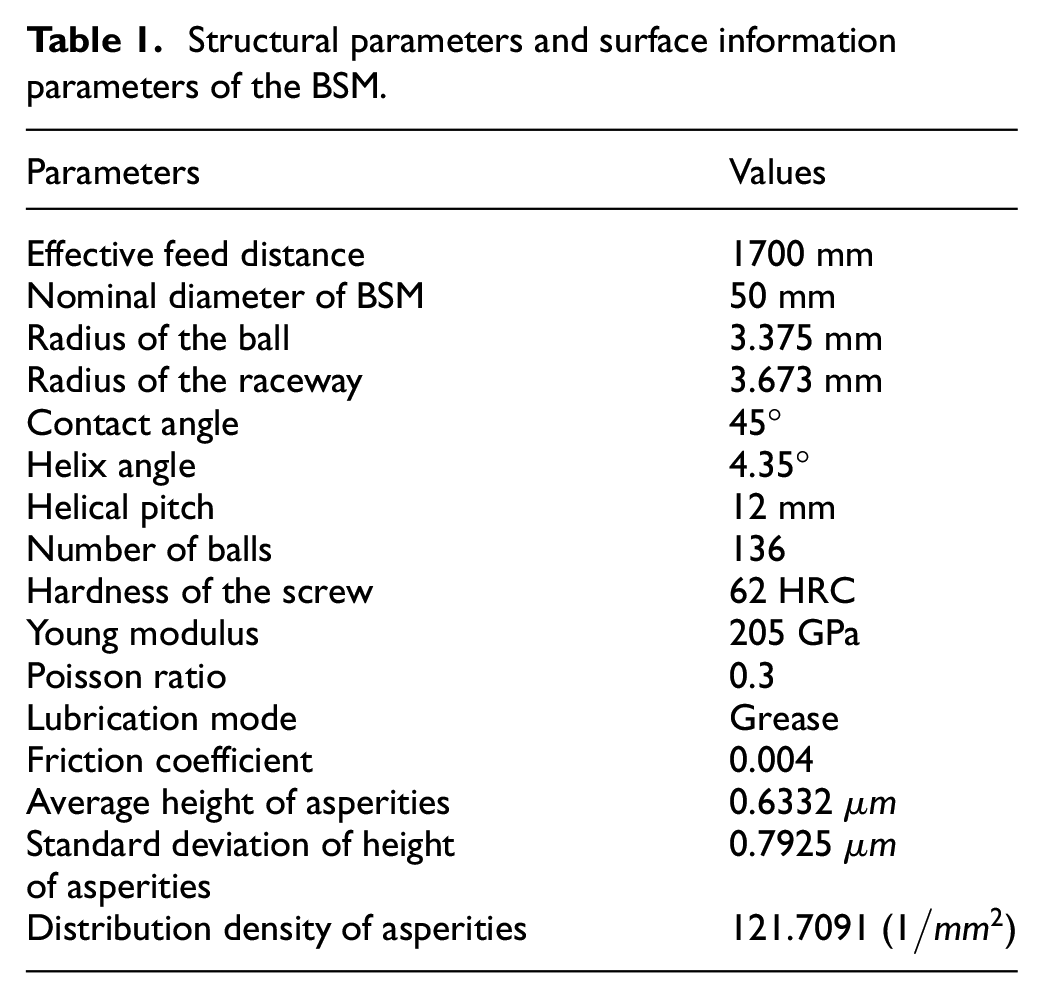
Structural parameters and surface information parameters of the BSM
Asperity wear
According to Figure 2, the number of sliding contacts is
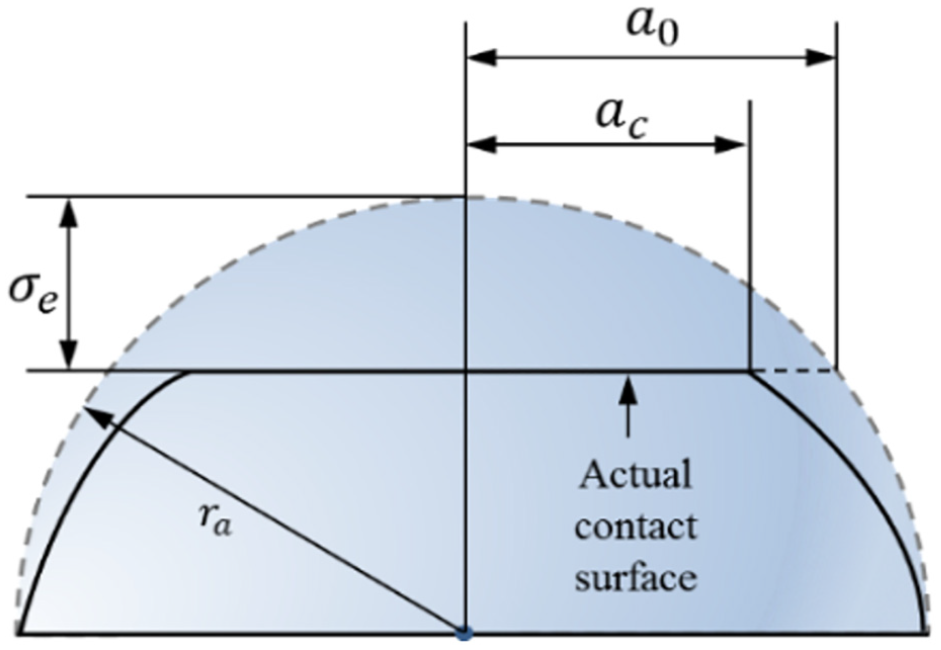
Wear volume of asperity.
Based on Figure 2,
where
where c is a constant determined based on the Poisson ratio v of the material by
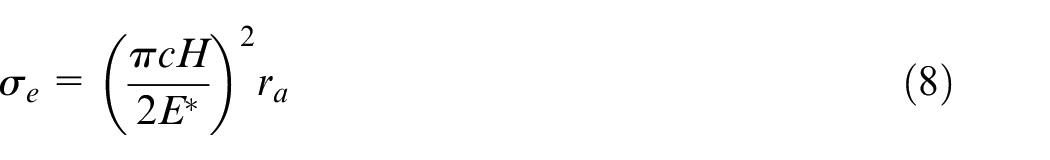
Based on Figure 2 and equation (8),

According to the experimental results of Kragelsky et al.,
26
when the wear volume of a single asperity is
where
where
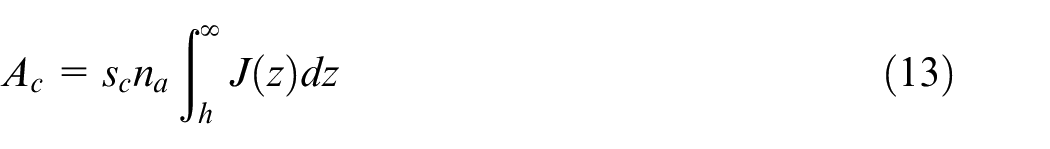
By combing equation (12) with equations (3), (4), and (8), the actual contact area
where

Macroscopic wear of BSM
Based on the microscopic wear analysis of a single contact asperity, the wear characteristics of the BSM macroscopic components were analyzed. Under time-varying rotational speed conditions, the sliding distances between the ball and raceway can be obtained 19 :
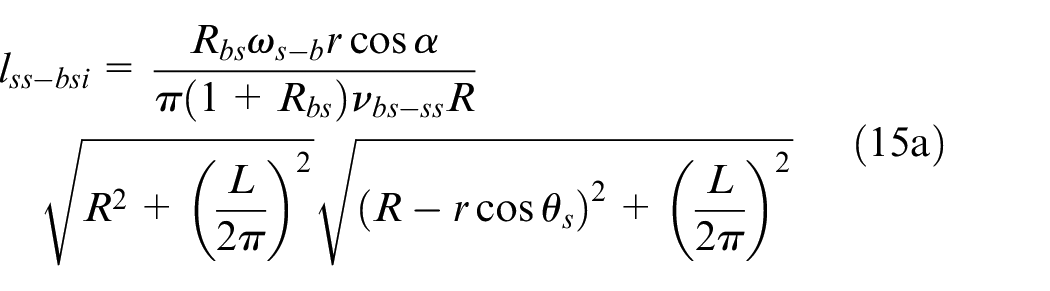
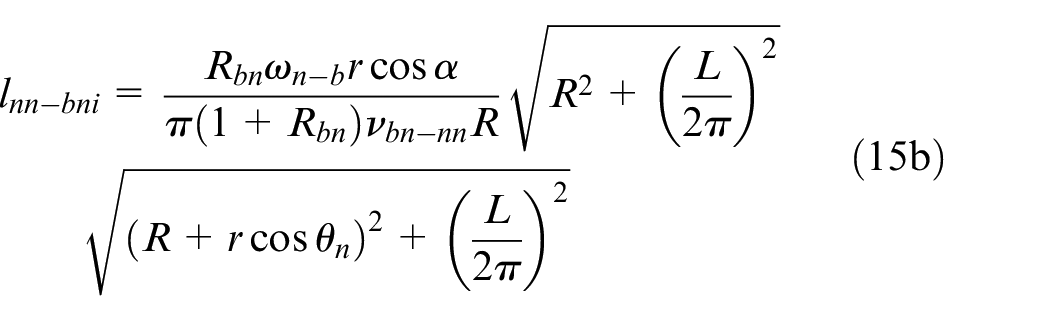
Equations (15a) and (15b) are the sliding distances between the ball and screw/nut raceway, respectively. L is the lead of the screw and can be obtained following literature method.
19


By combining equations (3) and (15a)–(16b), the numbers of contact asperities between the ball and raceway during sliding are represented by equations (17a) and (17b), respectively:
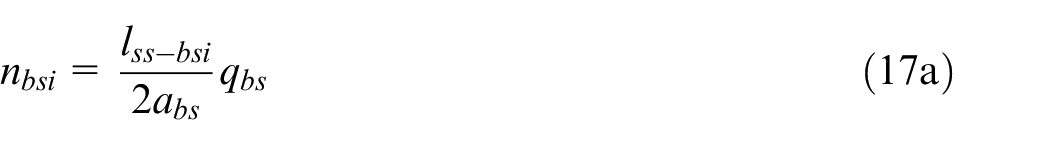
where
When the BSM is in operation the sliding contact numbers of asperities between the ball and screw/nut raceway are
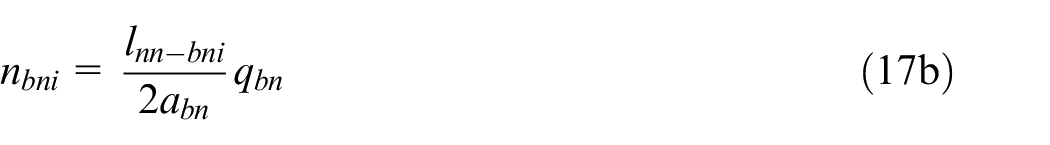
Combining equations (18a) and (18b), the wear volume between all the balls and raceways were obtained as:
where m is the total number of balls.
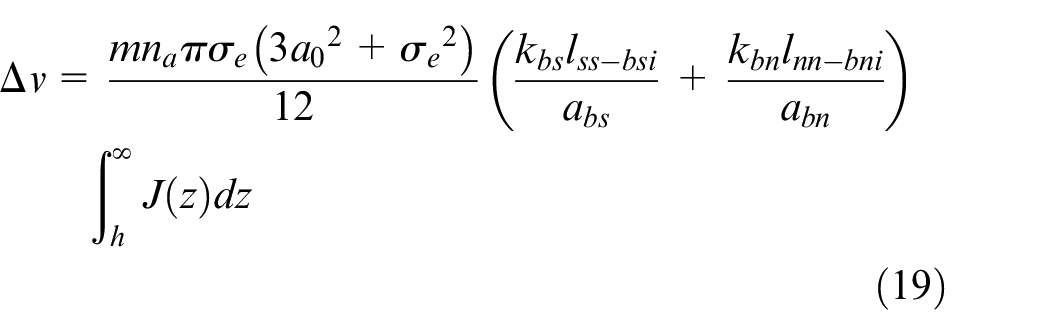
Exponential prediction model for positioning accuracy
Figure 3 illustrates the condition of a BSM due to wear.
Schematic illustration of wear in a BSM.
Figure 3 shows the
The accuracy degradation in the BSM with respect to the X, Y, and Z directions is directly caused by wear. Therefore, the arc length of each ball in the screw/nut raceway can be respectively described as:
where
If the average deviation of all the contact asperities of the ith ball and screw raceway is
Equations (20) and (21) were the arc length of each ball in the screw/nut raceway, respectively. And equation (22) was the parametric equation for the ball center. Combining equations (20)–(22), the measured value of the BSM positioning accuracy
where
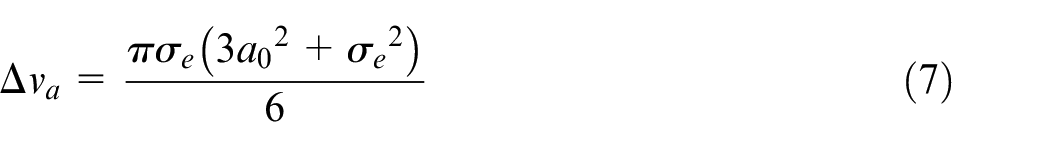
By combining equations (3), (7), (10), and (17a)–(19), the relationship between the wear volume
where
Based on the degradation analysis of the BSM positioning accuracy, during the stable operation period, the degradation of positioning accuracy is related to the wear as follows:

By combining equations (23) and (25), an equation for a simplified positioning accuracy measurement point was formulated as:

where
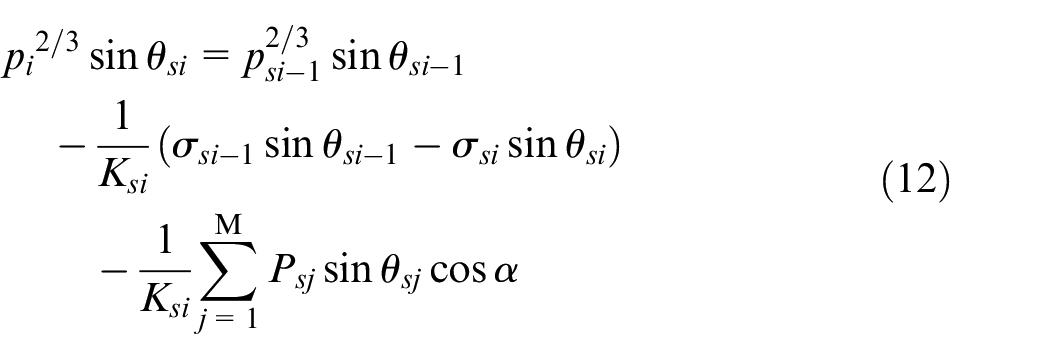
The total number of contact asperities at different positions varies with different operation conditions and feed modes. When the total number of contacts between asperities increases continuously, the asperities at different positions exhibit different wear characteristics. According to Figure 3 and equation (26), the equation of positioning accuracy retention can be written as:

where
BSMs play an important role in controlling the CNC machine tools (M800 made in China). Due to varying size of workpieces, the BSM requires different feed distances. The total number of feed cycles during operation is N, the minimum feed distance of the nut relative to the screw is
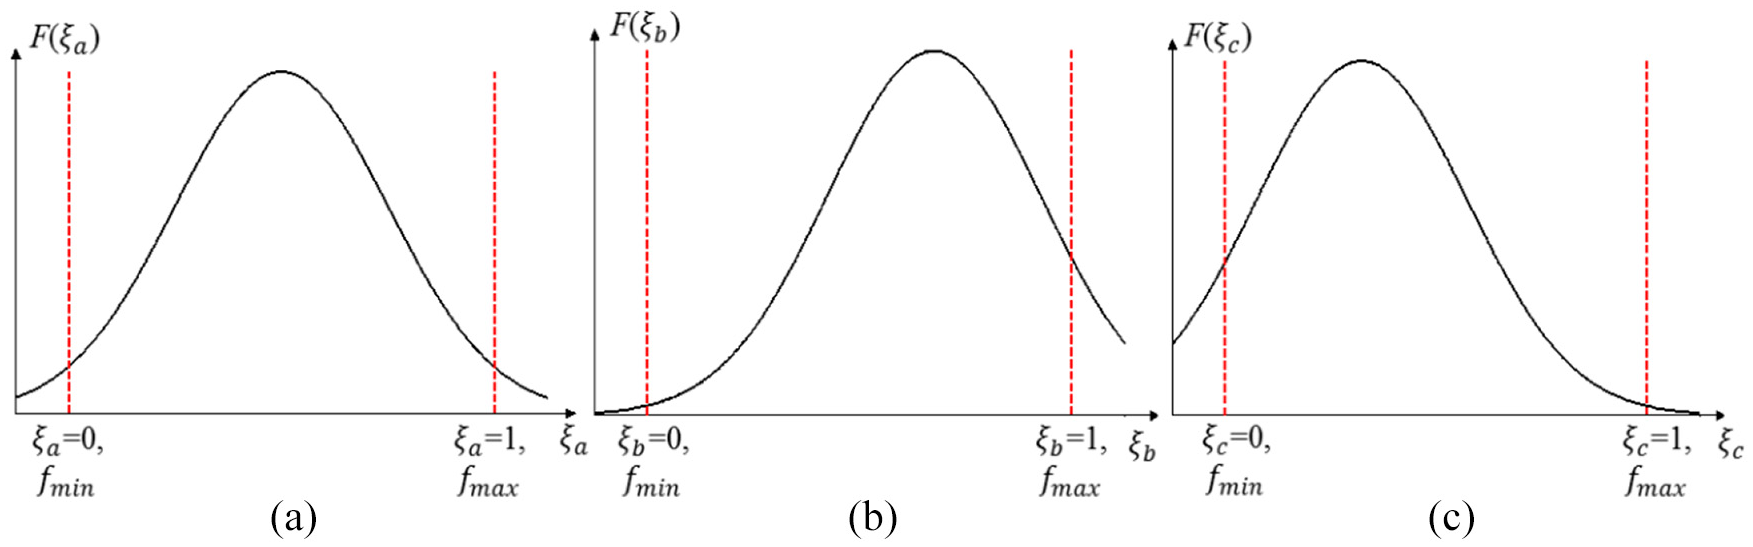
Probability density distribution function of
The normal distribution shown in Figure 4(a) indicates that the proportion of smaller and larger feed distances is smaller under actual operating conditions. In Figure 4(b), the negative skew distribution indicates that the feed distance under actual operating conditions is biased toward larger values. The positive skew distribution shown in Figure 4(c) indicates that the feed distance under actual operating condition is biased toward smaller values.
Positioning accuracy retention prediction
Based on multi-functional test platform for BSM (Type: W5017-C2Z12), a suitable positioning accuracy retention test was designed and tested. On the test platform, the feed distance, rotational speed, and load can be adjusted. According to the requirements of the experimental design, the rotational speed and load conditions can be controlled through programming. The tests were designed to determine and predict positioning accuracy retention characteristics under different feed modes.
The initial parameters are listed in Table 1.
The aim of the experiment was to investigate the effect of feed mode (normal distribution) and time-varying working conditions on the positioning accuracy retention of BSM. The feed distance of the BSM obeyed the normal distribution. The time-varying load was set to
Based on Figure 4(a), the positioning accuracy retention test time was 800 h. After testing for 200 h, the positioning accuracy of the BSM was measured using an API laser interferometer at room temperature. Figure 5 shows the devices that control the required rotational speed, load, and feed modes.
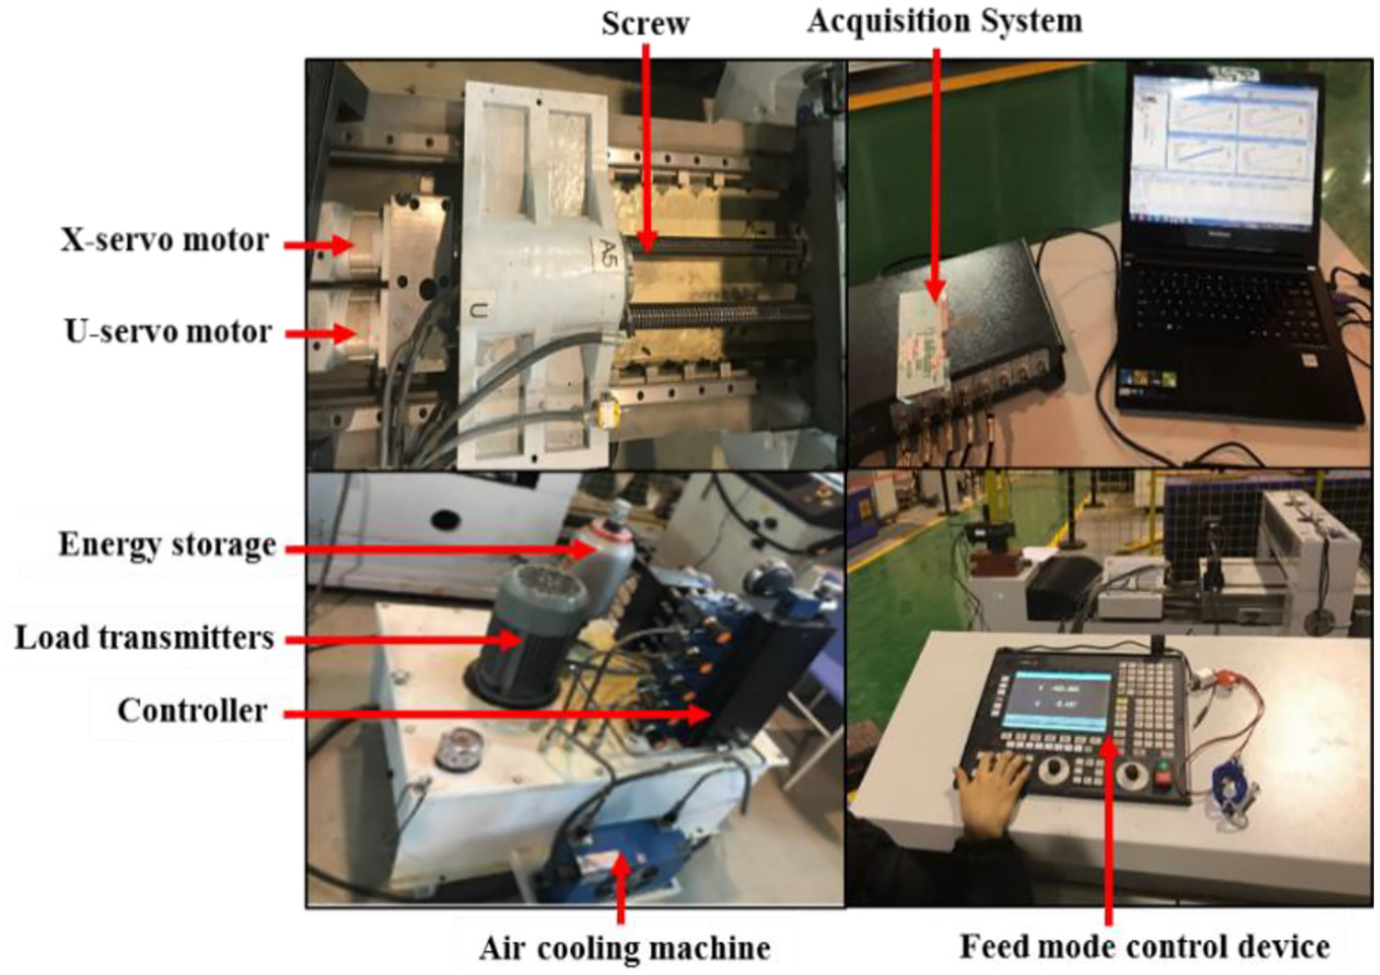
Devices that produce the required rotational speed, preload, and feed modes.
Figure 6 shows the settings used to test and measure the cumulative positioning accuracy. Notably, the obtained positioning accuracy results included wear-induced errors, manufacturing errors, and assembly errors.
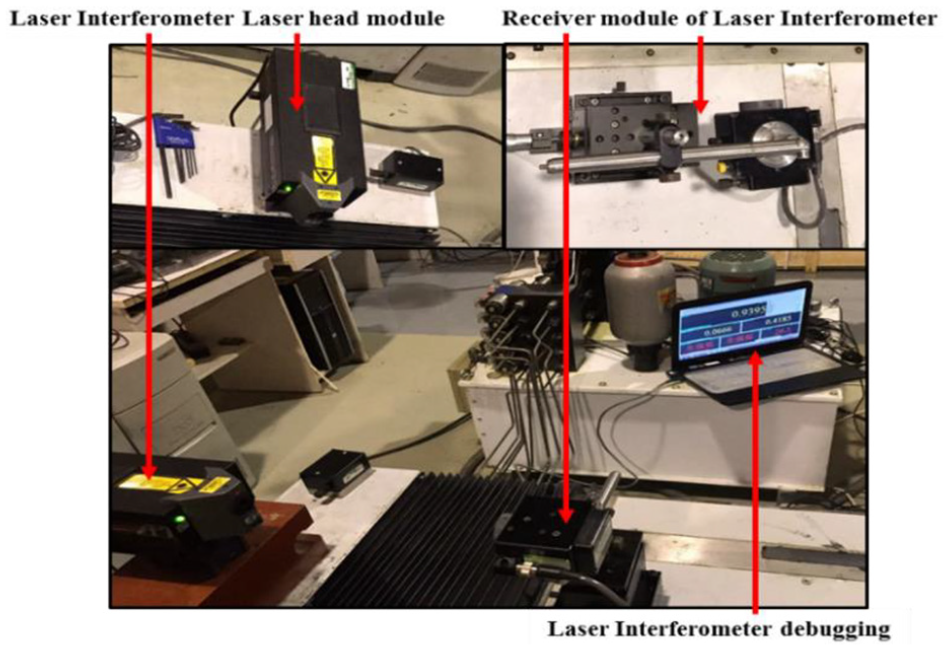
Setup to test positioning accuracy.
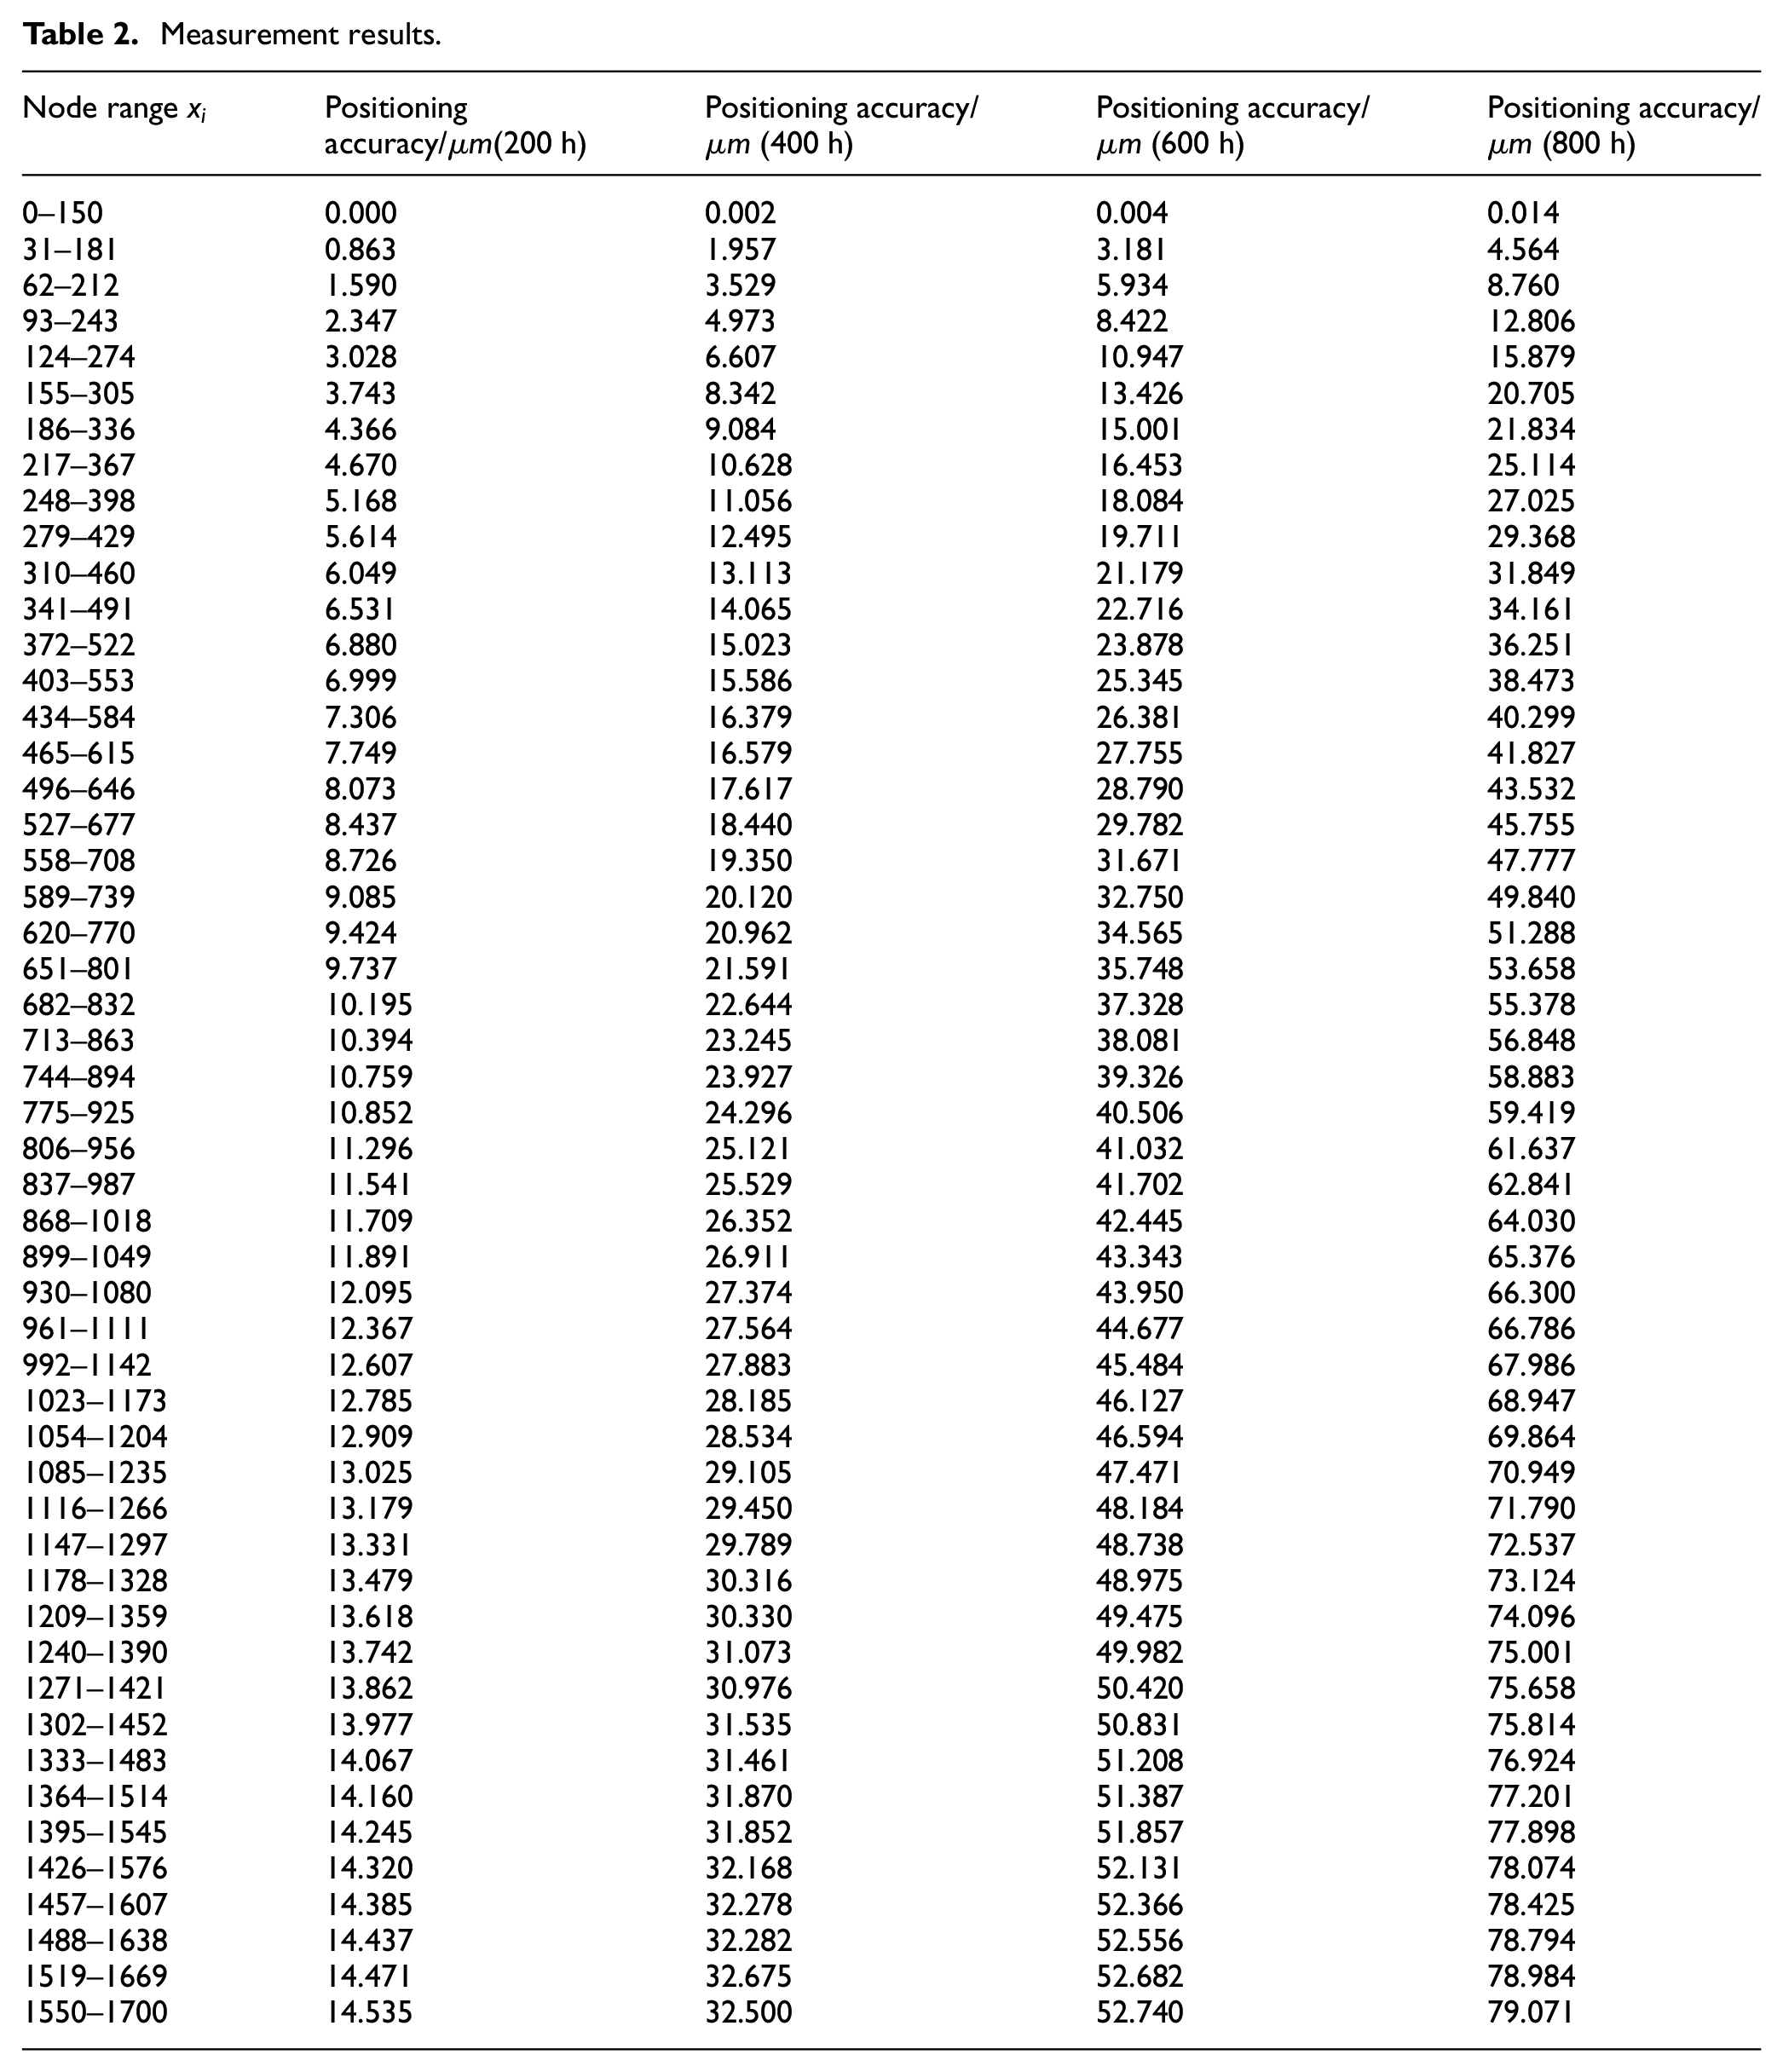
The results presented in Table 2 were obtained from the setup shown in Figure 6.
Measurement results.
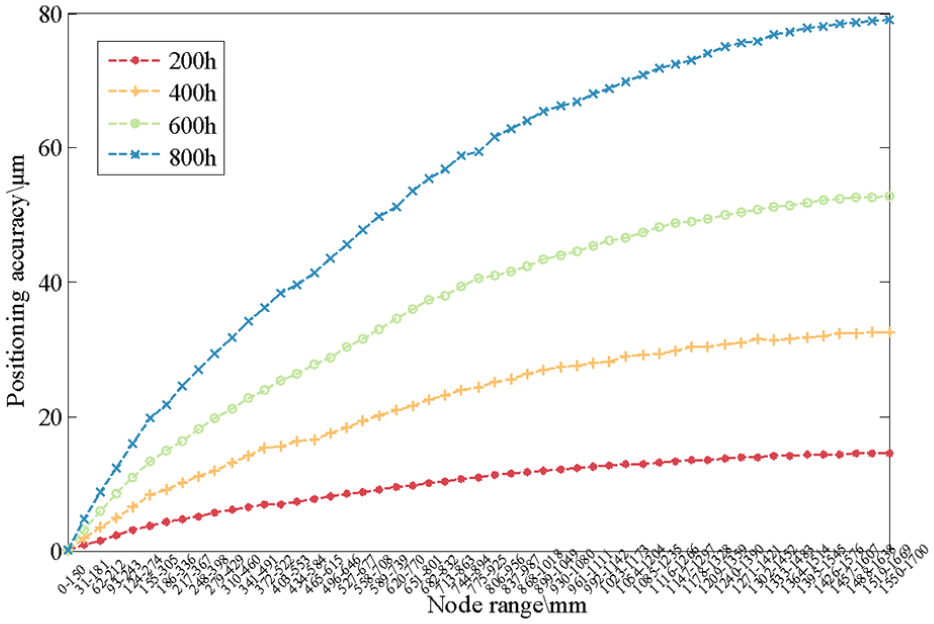
The measurement results of the positioning accuracy along the feed direction are shown in Figure 7.
Measured values.
Figure 7 shows that for the normal distribution of probability density, the cumulative times of contact and wear decrease gradually with increasing feed distance. According to the four measurements taken every 200 h, the growth rate of BSM positioning accuracy slowed down gradually with increasing feeding distance. The maximum positioning accuracy of BSM increases in a multiplier manner.
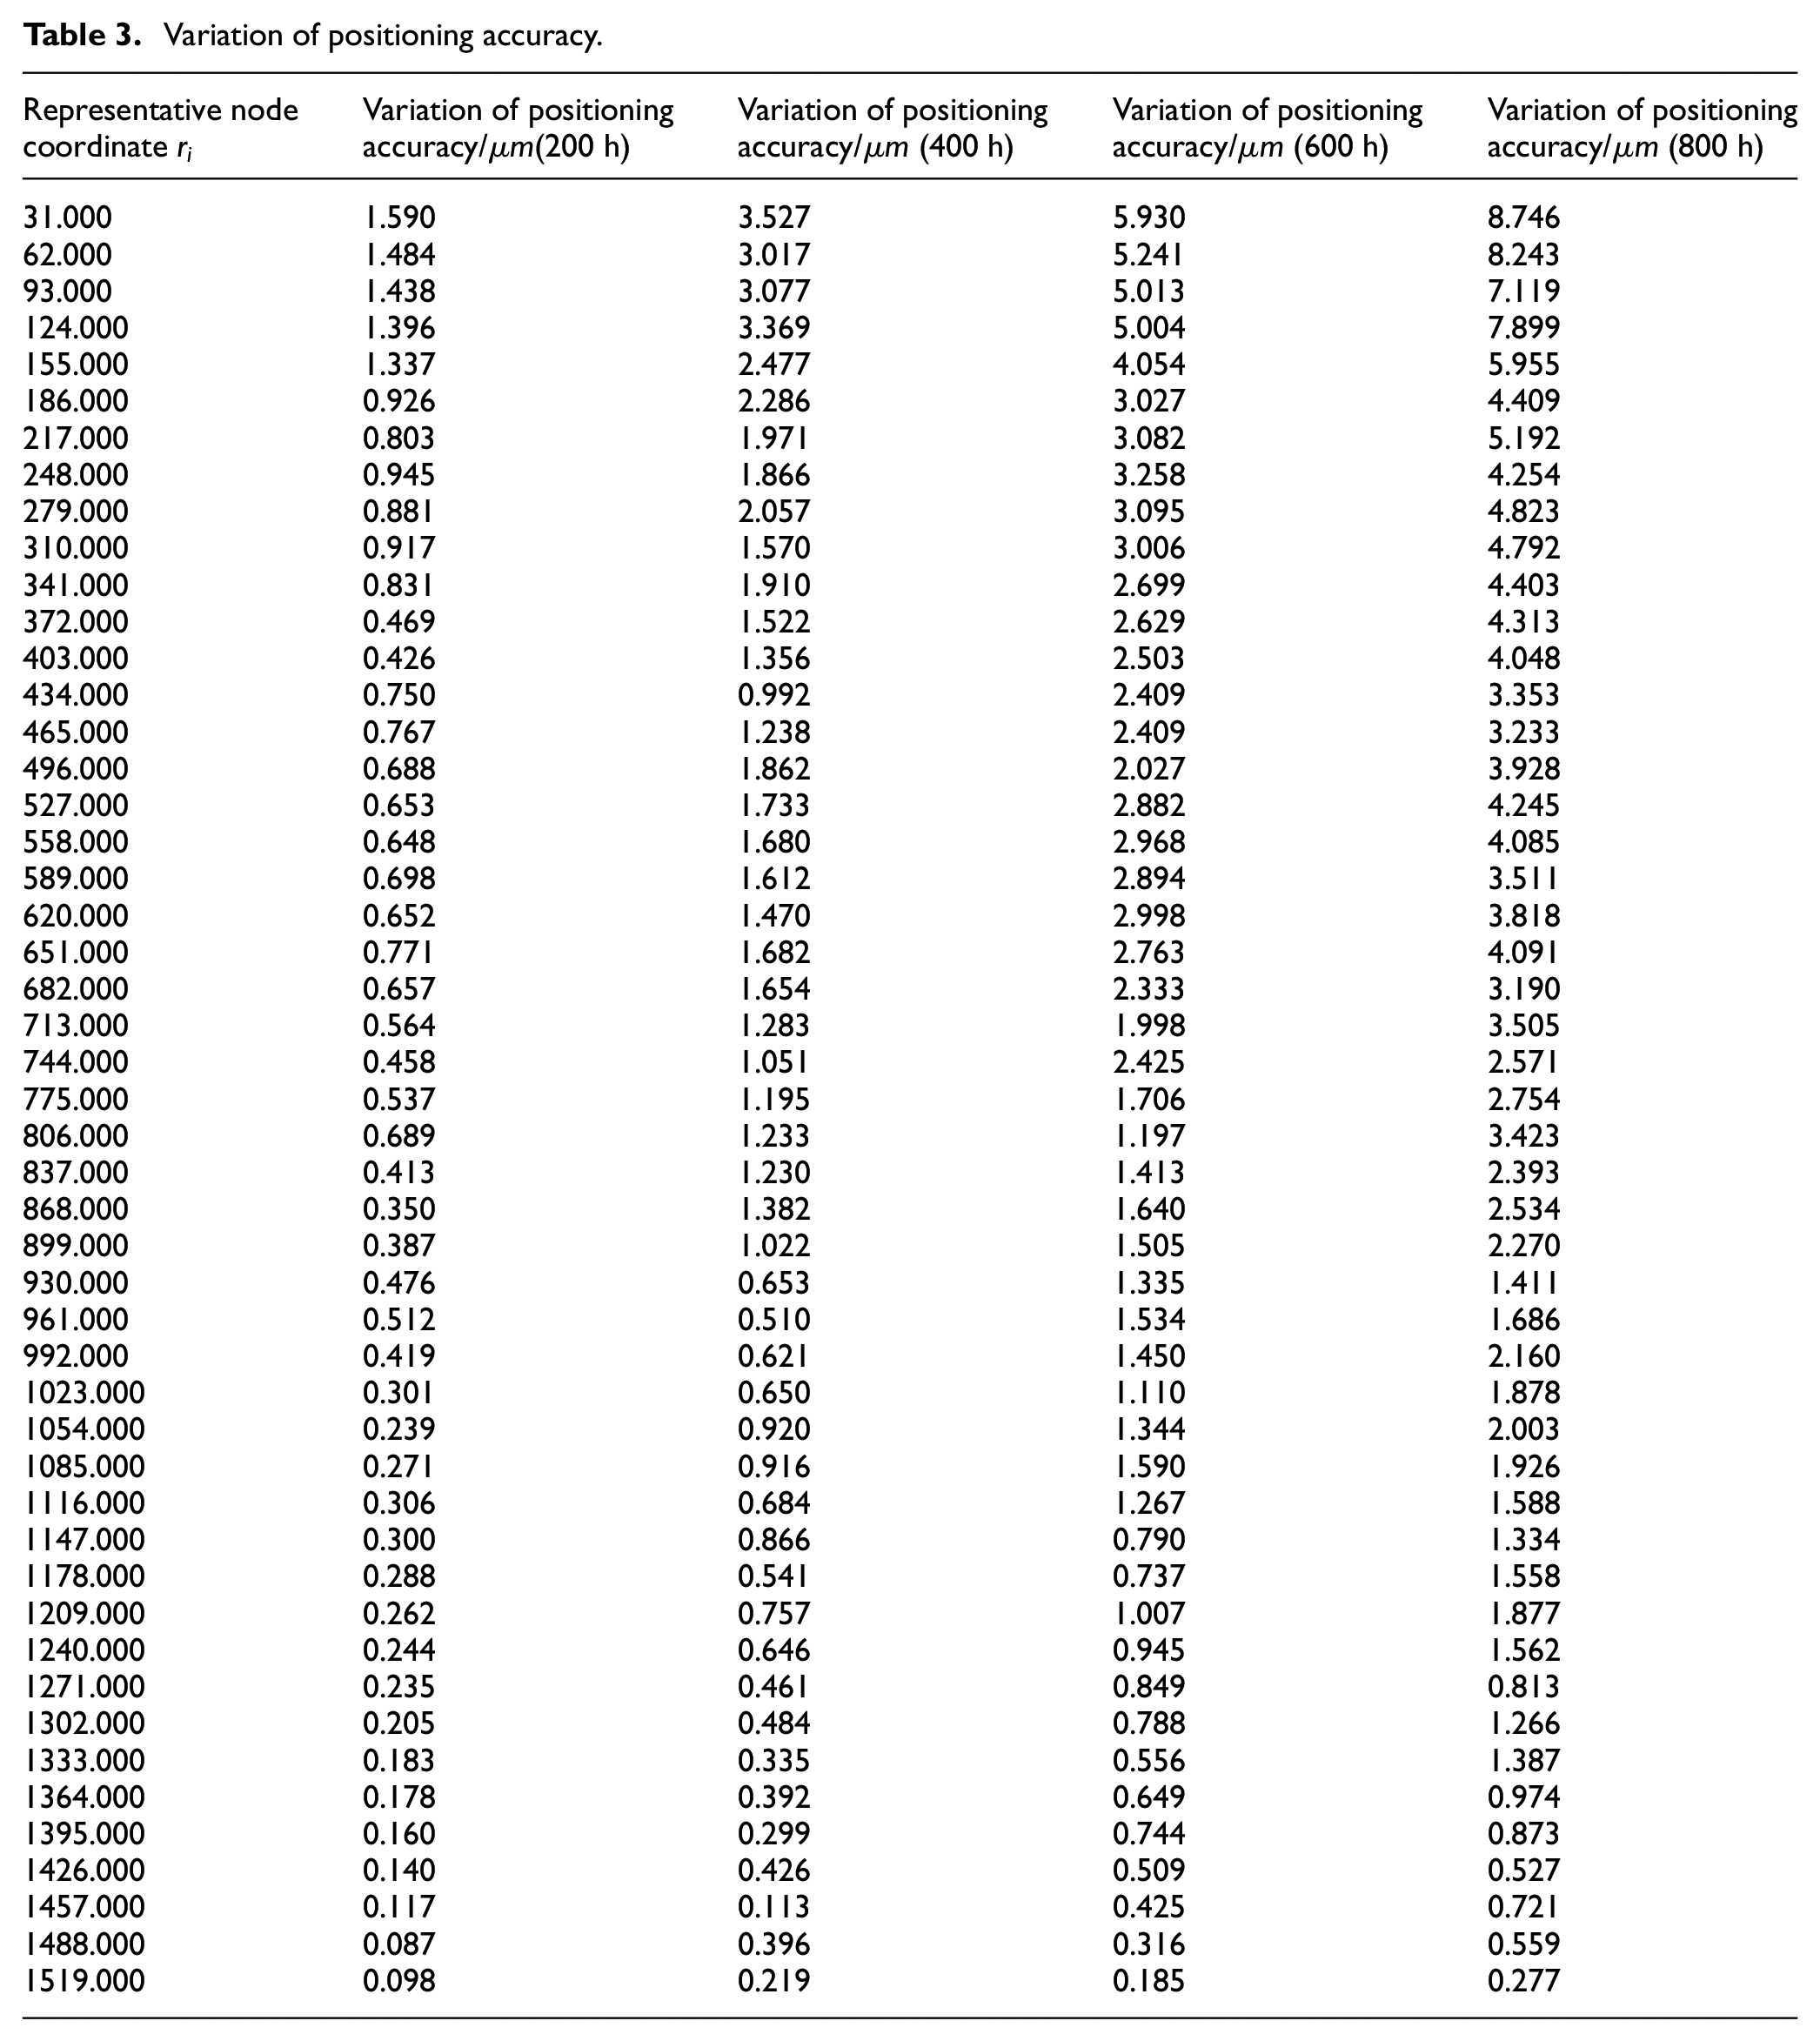
The research object BSM adopted in this research complies with the national standards. Thus, it can be considered that the manufacturing and assembly errors are equal at any position. In order to extract the accuracy degradation within the same feed distance, the data in Table 2 were subtracted alternately. The positioning accuracy variation was determined by calculating the difference between two rows. The midpoint of the measured asperities was selected as the coordinate center of the representative node. The positioning accuracy variation is lsited in Table 3.
Variation of positioning accuracy.
These variations occurred at different time periods and are shown in Figure 8.
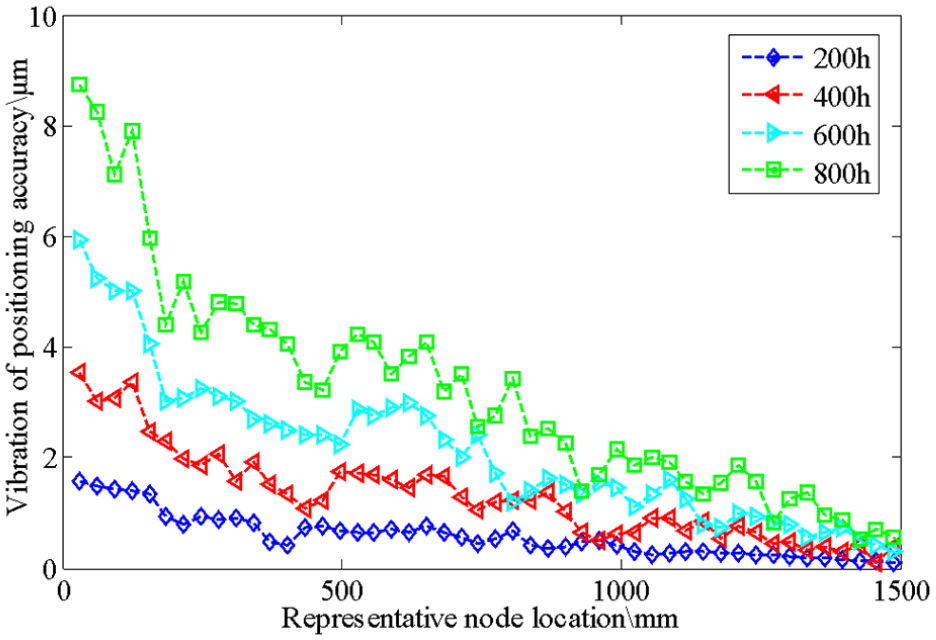
Positioning accuracy variation.
Figure 8 shows that for normal distribution of probability density, the variation in positioning accuracy decreases with increasing feed distance, attributing to the highest cumulative number of contacts at the starting position.
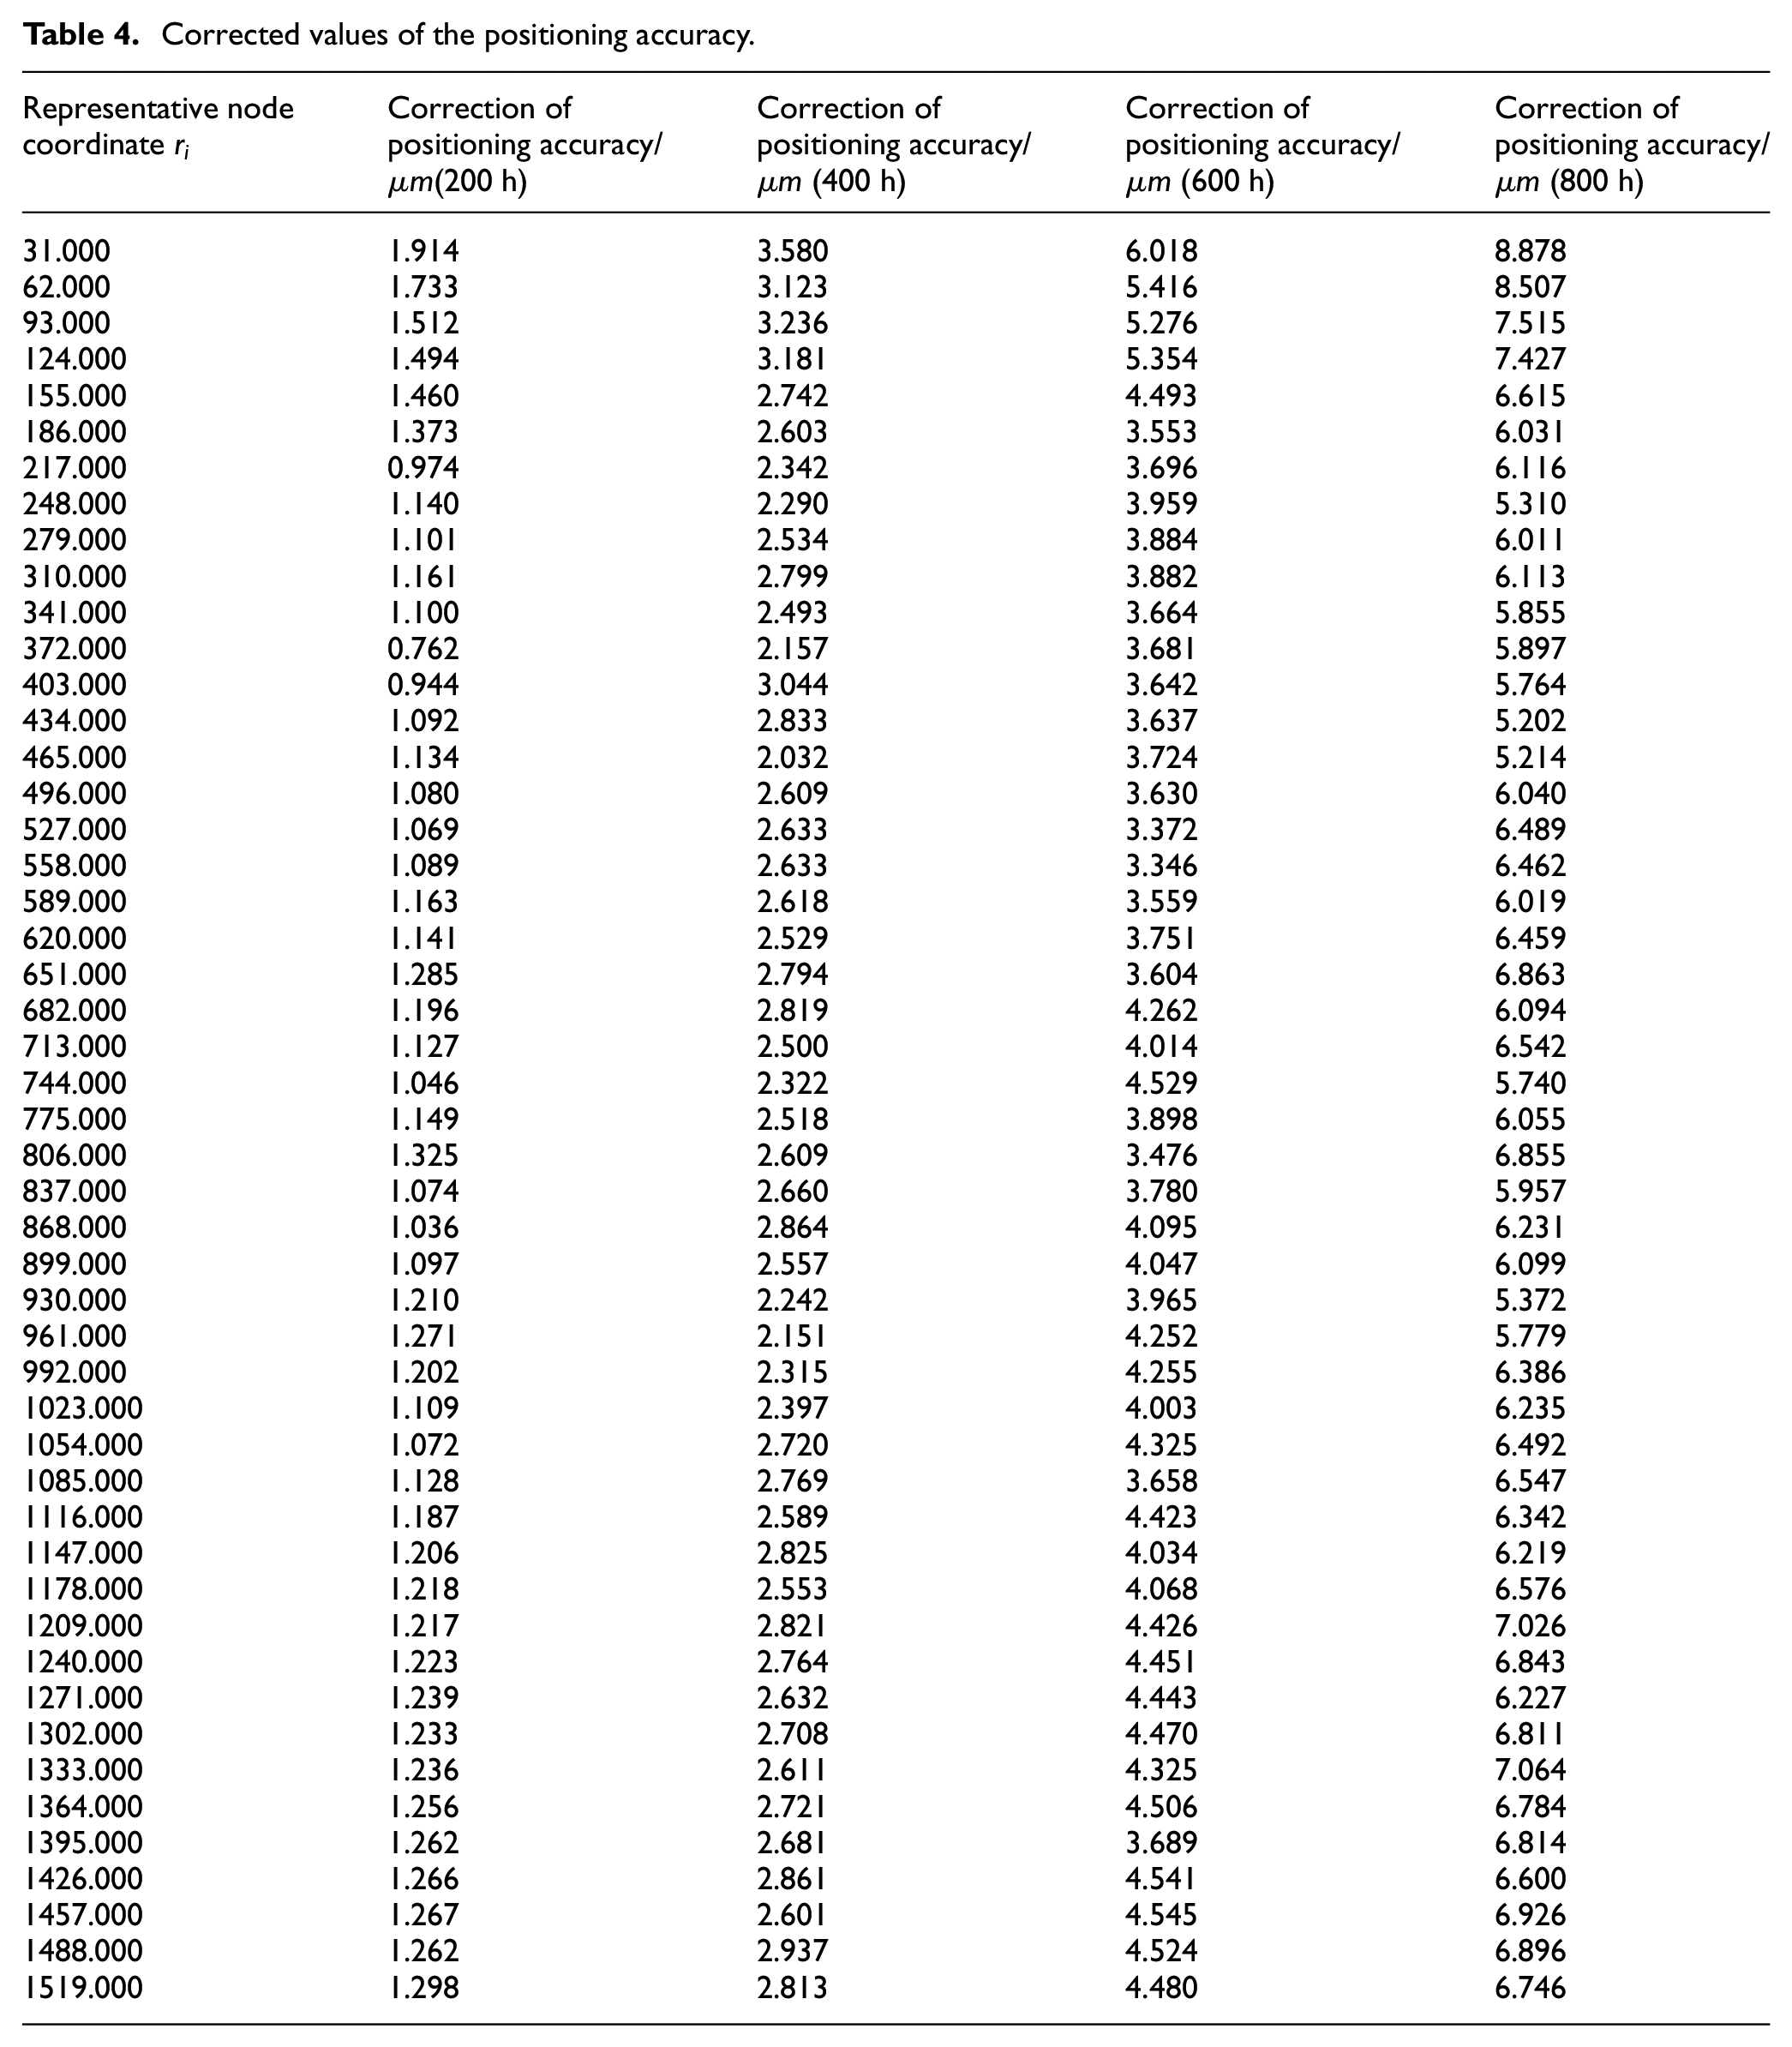
According to the Rodriguez rotation theory, the values in Table 3 can be corrected. Again, the midpoint of the measured asperities was selected as the coordinate center of the representative node and the positioning accuracy variation was corrected, and the corrected values are listed in Table 4.
Corrected values of the positioning accuracy.
The positioning accuracy at different time periods of the wear test was corrected, and the corrected values along the feed direction are shown in Figure 9.
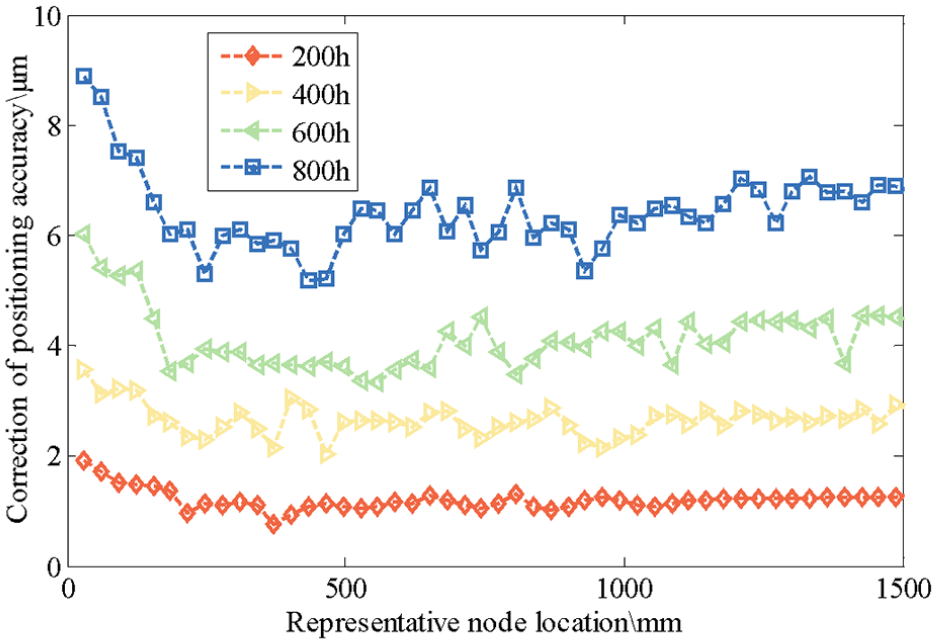
Corrected values of positioning accuracy.
According to Figure 9, for the normal distribution of probability density, the positioning accuracy degradation is highest at the starting position.
Table 4 shows the results of linear regression processing for the corrected errors at different test periods. For the normal distribution of probability density, the prediction index for these time periods were obtained. At 200, 400, 600, and 800 h operating times, the prediction indexes were
At a feeding distance of 300 mm in the BSM, multiple values associated with large loss in positioning accuracy were selected, and the average value was defined as the loss of positioning accuracy. Based on equations (25)–(27) and assuming the operation time as

When the loss in the positioning accuracy due to wear is equal to
Application of positioning accuracy prediction
According to the size of the processed specimens, the feed distance of the BSM demonstrates different distributions in the operation cycle. When the BSM feed mode presents a negative skew distribution, its actual operating condition for the feed distance is biased toward larger values, and when it presents positive skew distribution, its actual operating condition for the feed distance is biased toward smaller values. The BSM positioning accuracy characteristics were analyzed under negative/positive skew feed distribution, and the BSM lifetime was predicted.
Under the feed condition of negative/positive skew distribution, the time-varying load and rotational speed were also examined. The feed distance of the BSM and the percentage of feed distance are shown in Figure 4(b) and (c) under the negative/positive skew distribution, respectively. The experimental results shown in Figure 10(a) and (b) were recorded at different time periods under the feed condition of negative skew/positive distribution, respectively.
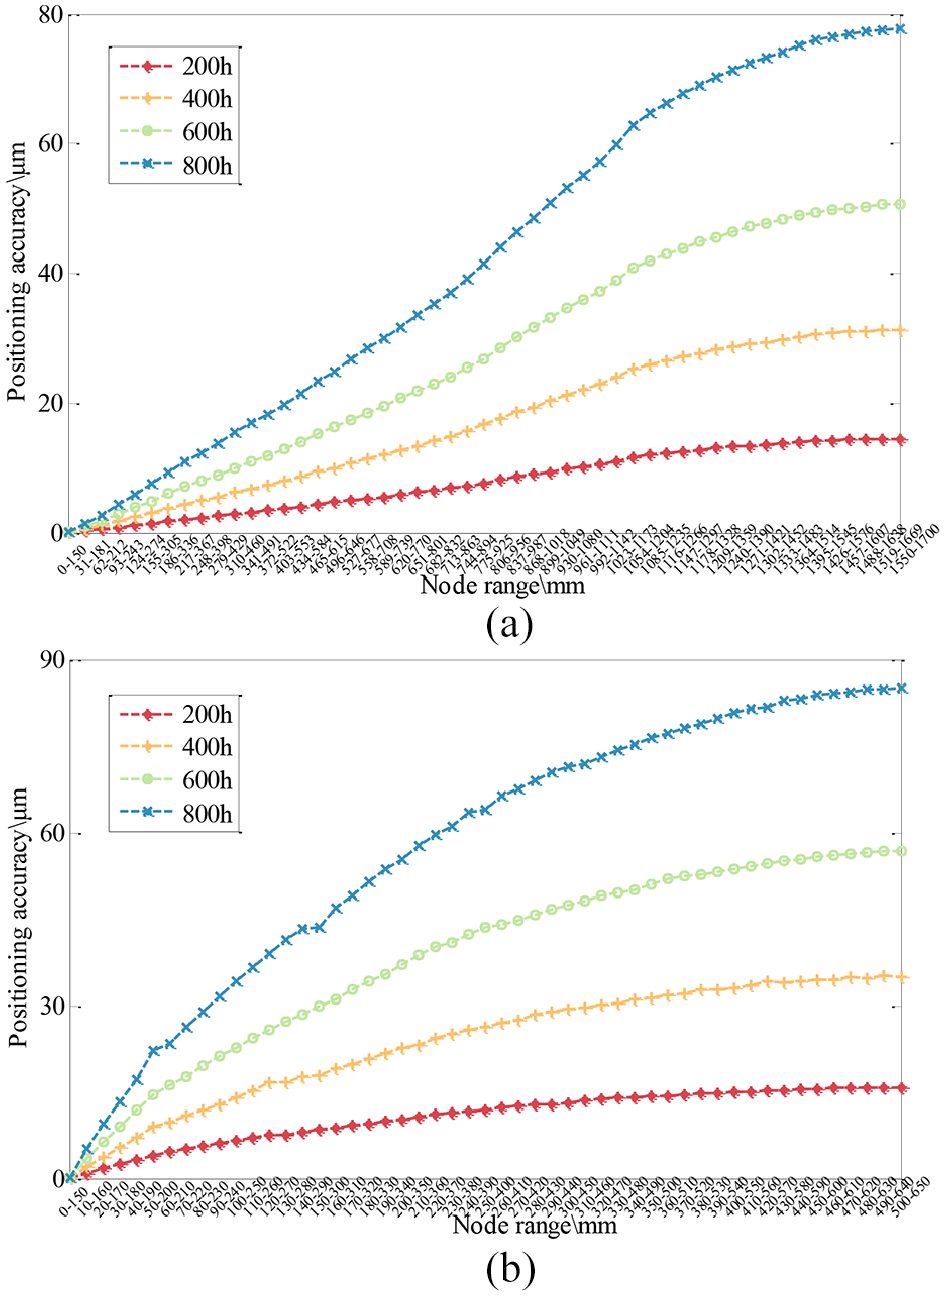
Measured values: (a) positioning accuracy under the negative skew distribution and (b) positioning accuracy under the positive skew distribution.
Figures 7 and 10 indicate that the maximum positioning accuracy was very similar among the three tests. However, the precision loss characteristics under different feed modes were different, because of different cumulative contact times of the asperities at different positions. As shown in Figure 7, for the normal distribution of the feed mode, the cumulative times of the contact and wear decreased gradually with increasing feed distance. As shown in Figure 10(a), under the negative skew distribution of the feed mode, the BSM has a region where the asperities exhibited the same contact numbers. The positioning accuracy gradient follows essentially a linear growth trend. As shown in Figure 10(b), for the positive skew distribution of the feed mode, the trend of the positioning accuracy was similar to that shown in Figure 7. However, the variation gradient of the positioning accuracy was larger than that in Figure 7.
Again, the positioning accuracy variation was determined by calculating the difference between two acquisition points. The midpoint of the measured asperities was selected as the coordinate center of the representative node. The measured positioning accuracy variation under the feed condition of negative and positive skew distributions is shown in Figure 11(a) and (b), respectively.
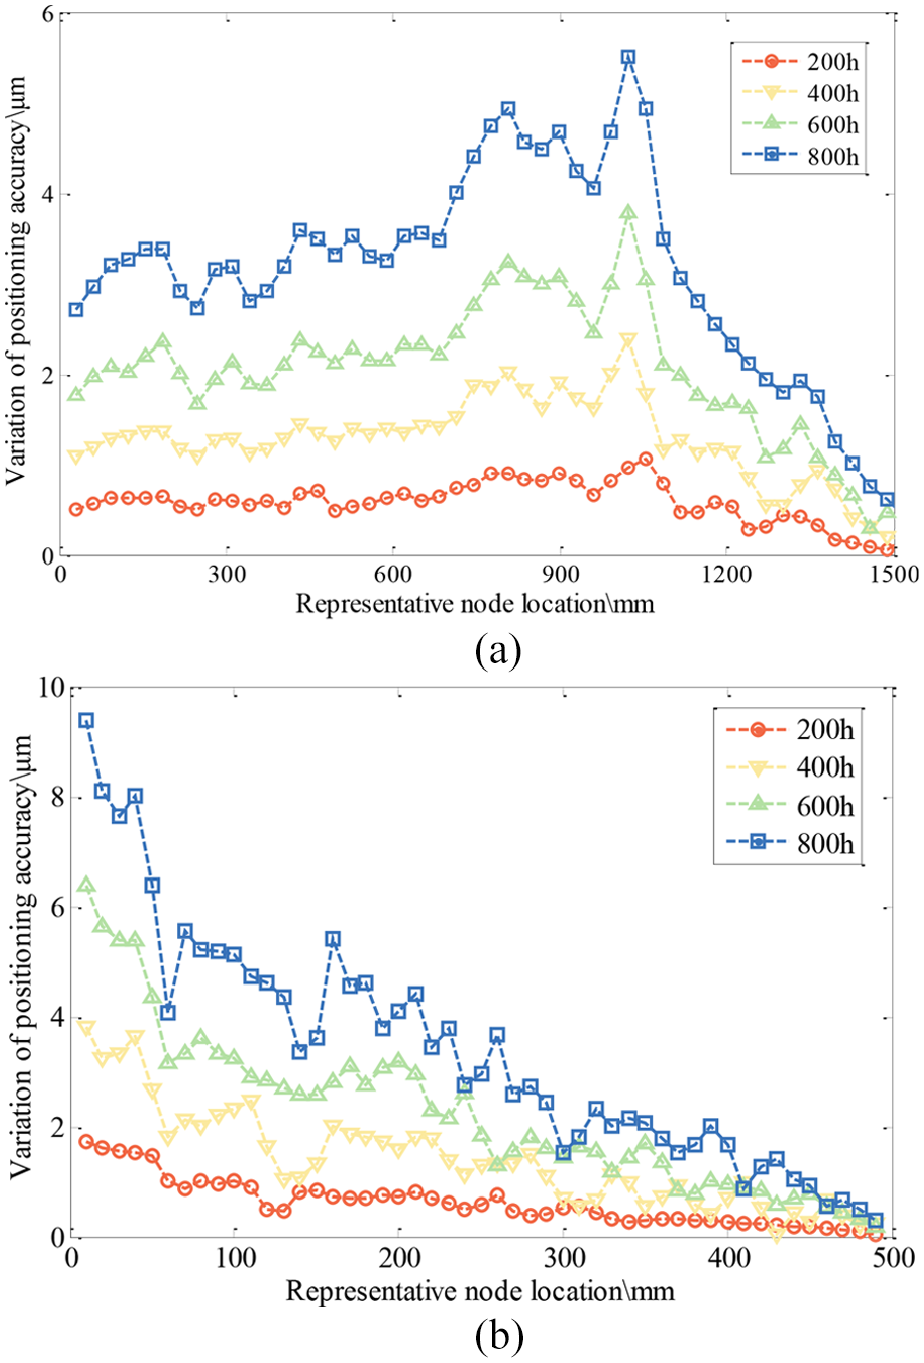
BSM positioning accuracy variation: (a) the measured positioning accuracy variation under the feed condition of negative skew distributions and (b) the measured positioning accuracy variation under the feed condition of positive skew distributions.
Figures 8 and 11 indicate that under the normal distribution of the feed mode, the positioning accuracy variation decreases with increasing feed distance, attributing to the highest cumulative number of contacts at the beginning of the feed. Figure 11(a) indicates that when the feed distance was less than 1050 mm, the positioning accuracy variation was almost constant. In contrast, when the feed distance exceeded 1050 mm, positioning accuracy variation decreased gradually with increasing feed distance. Figure 11(b) shows that under the positive skew distribution of the feed mode, the variation trend of the positioning accuracy was similar to that shown in Figure 8; however, the highest positioning accuracy variation was larger than that observed in Figure 8.
Similarly, the BSM positioning accuracy variation was corrected. The corrected values for the feed mode of negative and positive skew distributions are presented in Figure 12(a) and (b), respectively. According to Figure 12(a), for the negative skew distribution of probability density and feed mode, the positioning accuracy degradation was the largest at a feed distance of 1050 mm.
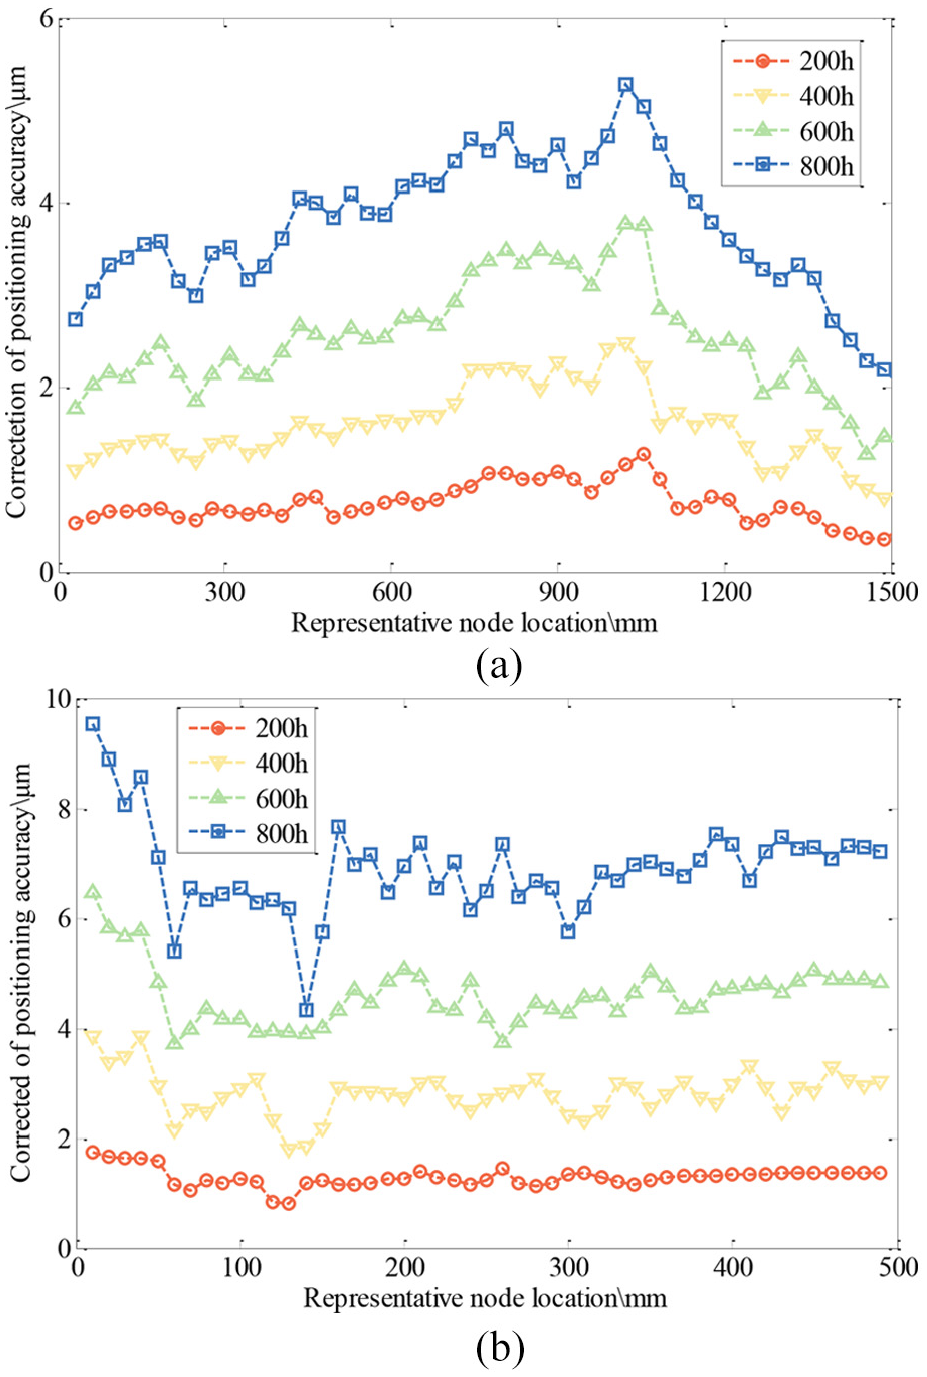
Corrected BSM positioning accuracy: (a) the corrected values for the feed mode of negative skew distributions and (b) the corrected values for the feed mode of positive skew distributions.
For the negative skew distribution of the feed mode, the prediction index for different time periods was obtained. At 200, 400, 600, and 800 h operating times, the prediction indexes were
Under the negative skew distribution, the operating time was 800 h. At a feeding distance of 300 mm, several values associated with a large loss in positioning accuracy were selected and the average value was defined as the loss of positioning accuracy. Herein, the value of

When the loss in the positioning accuracy due to wear is
According to Figure 12(b), for the negative skew distribution of the feed mode, the positioning accuracy loss was the largest at the beginning of the feed; however, the positioning accuracy loss was larger than that shown in Figure 9.
For the positive skew distribution of the feed mode, the prediction index for different time periods was obtained. At 200, 400, 600, and 800 h operating time, the prediction indexes were
Again, based on equations (25)–(27) and assuming

When the loss in positioning accuracy due to wear is
The BSM accuracy degradation values at 200, 400, 600, and 800 h were detected separately, and the wear index was obtained. Under the same accuracy level standard, the lifetime of the BSM was predicted, as listed in Table 5.
The service lifetime prediction.
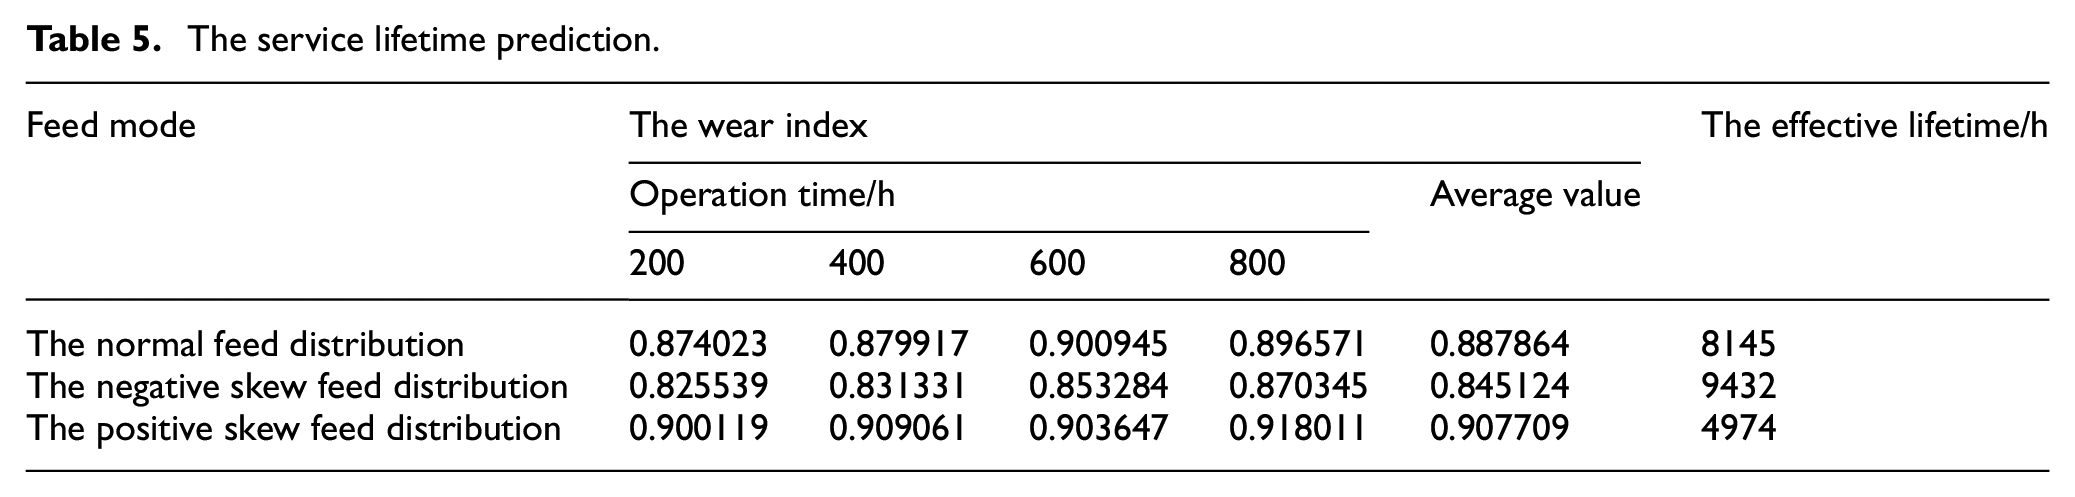
The comparison results in Table 5 demonstrate that different feeding methods lead to different expected lifetimes at the same accuracy level. The lifetime of the BSM under negative skew distribution condition is 9432 h, with the best accuracy retention ability. Under the positive skew distribution, the lifetime is 4974 h with the worst accuracy retention ability. Moreover, the lifetime under normally distributed feed conditions is 8145 h, and the accuracy retention ability is moderate. Under negative skew distribution, asperities have the least number of contacts. Under the normal feed conditions, the contact number of asperities increased. Under the positive skew feed, the contact number of asperities was the largest. Consequently, the wear of the BSM under the three feed modes in turn increases, and the accuracy retention ability declines. Therefore, the test results were consistent with the accuracy degradation model.
Conclusion
In conclusion, using the macro-micro multiscale method, an exponential prediction model for the positioning accuracy of the BSM was developed considering time-varying working conditions (load and rotational speed) and feed modes. Relevant positioning accuracy tests were successfully designed considering the time-varying load and rotational speed conditions. In addition, the exponential prediction model was applied to different feeding conditions, allowing correct prediction of lifetime. The main conclusions of this study can be summarized as follows:
Considering time-varying working conditions (load and rotational speed), the macro-micro multiscale method was convenient to determine the micro wear characteristics of the contact surface. The positioning accuracy retention of the BSM was investigated when the feed distance coefficient follows the normal distribution. At the operating times of 200, 400, 600, and 800 h, the prediction index were
When the positioning accuracy prediction model was used in the negative/positive skew feed distribution, the prediction indexes are as follows:
When the positioning accuracy loss value was 25 um, the lifetime of the BSM under negative skew distribution condition was 9432 h, with the best accuracy retention ability. Under the positive skew distribution, the lifetime was 4974 h with the least accuracy retention ability. Moreover, the lifetime under the normally distributed feed conditions was 8145 h, with moderate accuracy retention ability. Because the BSM was under the negative skew distribution, asperities have the least number of contacts. Under the normal feed conditions, the contact number of asperities increased. Under the positive skew feed, the contact number of asperities was the largest. The corresponding prediction indexes were
This study successfully used exponential prediction model for determining the positioning accuracy of the BSM under different feed modes, and the future study will be focused on positioning accuracy retention and life prediction of other types of ball screws. In addition, the ball screws will be tracked and detected on the machine tool to verify the accuracy degradation under time-varying working conditions and under different feed forms.
Footnotes
Declaration of conflicting interests
The author(s) declared no potential conflicts of interest with respect to the research, authorship, and/or publication of this article.
Funding
The author(s) disclosed receipt of the following financial support for the research, authorship, and/or publication of this article: The authors sincerely acknowledge the financial supports from the National Natural Science Foundation of China (51975012), Beijing Nova Programmer Interdisciplinary Cooperation Project (Z191100001119010), National Science and Technology Major Project (2019ZX04012001-003) and Shanghai Sailing Program (19YF1418600).