
Abstract
The Selective Laser Melting (SLM) process based additive manufacturing has wide applications in medical, aerospace, defense, and automotive industries. To qualify the components for certain tribological applications, the characterization of surface texture is very important. But the applicability of traditional methods and parameters to characterize the surface texture were under evaluation. As the nature manufacturing the components were very different and complex, the unconventional surface characterization methods also under evaluation to reveal much more meaningful information. This study demonstrates the surface characterization of Ti-6Al-4V SLM components using fractal analysis of the surface images. The computed fractal dimension using the Fourier transform method showed a strong correlation of more than 0.8 with the measured 3D surface roughness parameters. The change in anisotropic nature of the surface images with the process parameter variation is studied and found that the surface textures showed a weaker anisotropic nature at lower laser power ranges, high scanning speed, and high hatch distance values. The lacunarity analysis is carried out using the gliding box algorithm to study the homogeneity nature of the surface texture and found that the surface texture is more homogeneous at higher surface roughness conditions. The study results can be utilized for the development of a quick, low-cost surface monitoring system in real-time for additive manufacturing industries.
Introduction
Metal Additive Manufacturing (AM) processes can produce complex objects from 3D CAD models with large degrees of freedom. One such AM process from the powder bed fusion family, Selective Laser Melting (SLM) uses metal powders for printing the components employing a laser power source incident on the powder bed in an inert gas atmosphere (Figure 1). The laser at the selected power level is scanned along the path as per the input CAD model, resulting in the melting of the powder particles. Once a single layer is scanned, the build plate is moved down a single layer thickness and the re-coater blade spreads a new layer of powder. The process is repeated until the entire part gets printed. The adoption of SLM process has increased in industries like aerospace, automotive, defense, medical, rapid prototyping, and electronics. 1
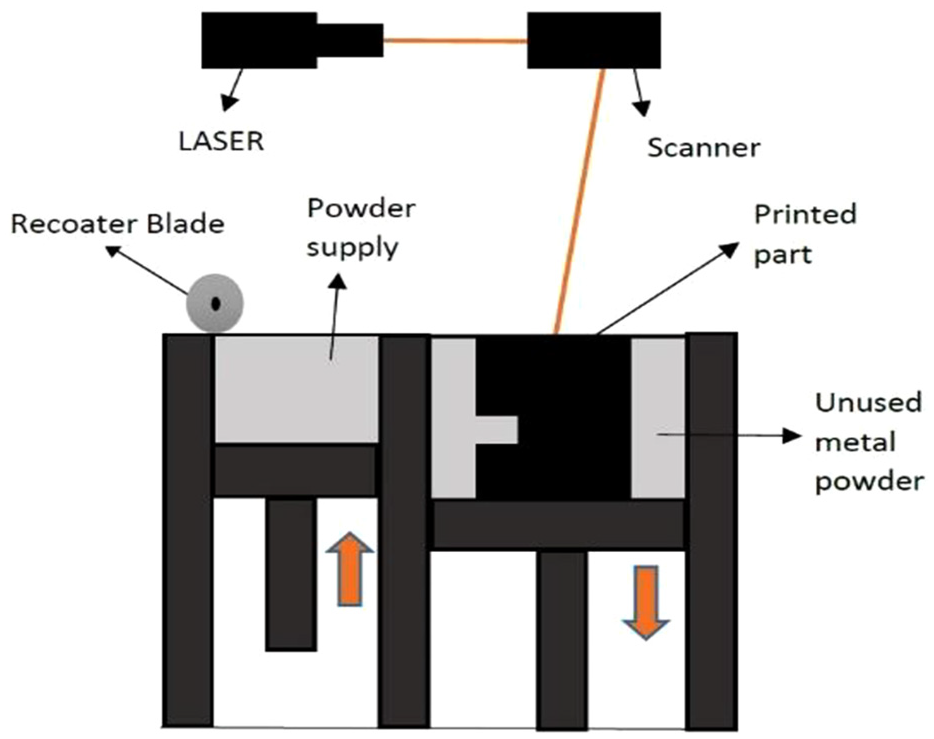
Schematic representation of SLM process.
Besides having an exponential growth and the ability to bring the entire supply chain under a single roof, there are a lot of challenges in full-fledged industrial adoption of AM processes. One such crucial challenge is in the field of surface metrology. The random and unpredictable surface textures formed during additive manufacturing make the characterization difficult using the conventional surface texture measurement methods. Due to its promising potential, it is necessary to address the surface metrology challenges for improved surface integrity of the printed component with minimum post-processing for better productivity.
Leach et al. 2 have dubbed the difficulties in the characterization of metal additive manufactured surfaces as “a metrology horror story” in their paper. Various researchers2–4 have addressed this issue by characterizing the surface topography of powder bed fused metal components with the help of the available standard contact, non-contact and optical measurement technologies. These research works infer that a single measurement technology cannot be relied on for the complete characterization of the surface texture of powder bed fused metal components. It was concluded that the inconsistency between the measurement technologies become more significant at small scale measurements and greater care should be taken for data interpretation. For measurements carried out with large region of interest/large scale measurements, the discrepancies have limited effect in the surface characterization results. The major reason behind the inconsistencies in optical measurement technologies was found to be due to the presence of high local slope and local variations in the reflected light from the surfaces. In the case of contact type measurement, the stylus tip may get jammed due to the steep valleys of surface asperities, which causes a jump or slip temporary loss of tip contact with the surface and even a tip damage can happen. Furthermore, for soft materials, the surface can be damaged if a careful selection of stylus tip radii and contact forces are not carried out. Apart from this, the surface metrology standards for additive manufacturing processes is evolving and also the nature of the process demand for an unconventional characterization approaches to characterize the surface texture pattern and its homogeneity. Charles et al. 5 studied the effect of process parameters of SLM in determining the surface integrity of down-facing surfaces of the components and concluded that the SLM process is a prime candidate for simulation and process modeling analysis because of the unpredictability in the process due to the complex nonlinear behavior of the process parameter interaction. To summarize, it is clear that the surface characterization of the SLM process requires novel techniques apart from the conventional methods for better understanding of the surface. In this work, an unconventional way of characterizing the surface using fractal analysis of the surface image is presented.
Fractals are infinite patterns that repeat themselves at different scales. Fractal nature is exhibited by machined surfaces, 6 and the notion of fractals can be employed for getting insights into the various operational and functional performances of the surface such as defect generation, lay patterns, microstructure variations, etc. This implies that the fractal approach in characterization of surfaces can be a promising method for the development of a quick surface monitoring system and thus have been used for surface characterization of machined components.6–9 Chen et al. 7 carried out a comparative study of various fractal dimension measurement methods and also explained its applications in the characterization of machined surfaces. They concluded that none of the methods used were prominent in characterizing the surfaces for all the performance evaluation aspects considered in the study. Risović et al. 10 found a strong correlation between the profilometric surface parameters and the fractal dimension obtained from electrochemical impedance spectroscopy (EIS) measurements and concluded that the fractal dimension was a straight indicator of surface topography. Zuo et al. 11 characterized the cutting parameters and material properties of milling operation with the help of fractal dimension and surface roughness values. They investigated the relationships between the cutting parameters and material properties (material elongation, hardness, feed rate, spindle speed) with the surface parameters, viz., fractal dimension and surface roughness of the components. The fractal dimension is computed using the RMS method. Also, an empirical relation to assess the surface roughness and fractal dimension based on the material elongation and hardness is developed. Raman and Chellaperumal 12 modeled the contact geometry of the rake face of the cutting tool with the help of fractal dimension analysis. The fractal dimension is computed using the box counting algorithm and the variation of the same with the cutting speed is also investigated.
Though the literature investigating the fractal analysis of machined surfaces is ubiquitous, very few researchers so far have attempted to study the fractal nature of additively manufactured surfaces. Imani et al. 13 have presented a multifractal analysis along with lacunarity analysis for the characterization and quantification of the surface images of Ultra Precision Machining (UPM) and AM processes. Yao et al. 14 demonstrated a new approach for characterizing the powder bed fused parts with the help of multifractal analysis which proved to be efficient in detecting the defects with the help of image and statistical analysis in the surfaces. They also found that the laser power was the most influencing process parameter in the proposed multifractal analysis.
Ti-6Al-4V is one of the widely used alloys in various industries like aerospace, defense, biomedical applications, etc. due to its dominant properties like high strength to weight ratio, good elevated temperature strength, and fracture toughness, etc. In this paper, the fractal nature of Ti-6Al-4V SLM surfaces and its application in understanding the anisotropic nature of the surface texture images are presented. The fractal dimension of the surface images is computed using the Fourier transform method. Also, the homogeneity nature of the texture is studied with the help of lacunarity analysis. Lacunarity helps in identifying the homogeneity nature of the texture images and it is calculated using the gliding box algorithm. The results can be used for developing a quick, robust and low-cost surface monitoring system for the Ti-6Al-4V SLM components, which can be extended for better process parameter optimization for maintaining the surface quality demands of the customers.
Experimental methodology
Material details
The material used for printing the samples for the study is EOS Titanium Ti64 powder, which is the fine powdered form of Ti-6Al-4V alloy optimized for EOS INT M systems. Figure 2 shows the SEM image and the particle size distribution plot of the EOS Titanium Ti64 powder used. The powder particles show a spherical morphology with an average particle size of 31 µm. The Energy Dispersive X-ray Analysis (EDAX) data plot (Figure 3) shows the percentage composition of the elements in the material used. Both the weight percentage and the atomic percentage of the elements are obtained through the EDAX analysis. From the EDAX data, it is visible that the Ti64 powder used in the study contains 91.1% of weight percentage of titanium element and the remaining is shared by aluminum and vanadium with a weight percentage of 5.7% and 3.3% (Figure 3).
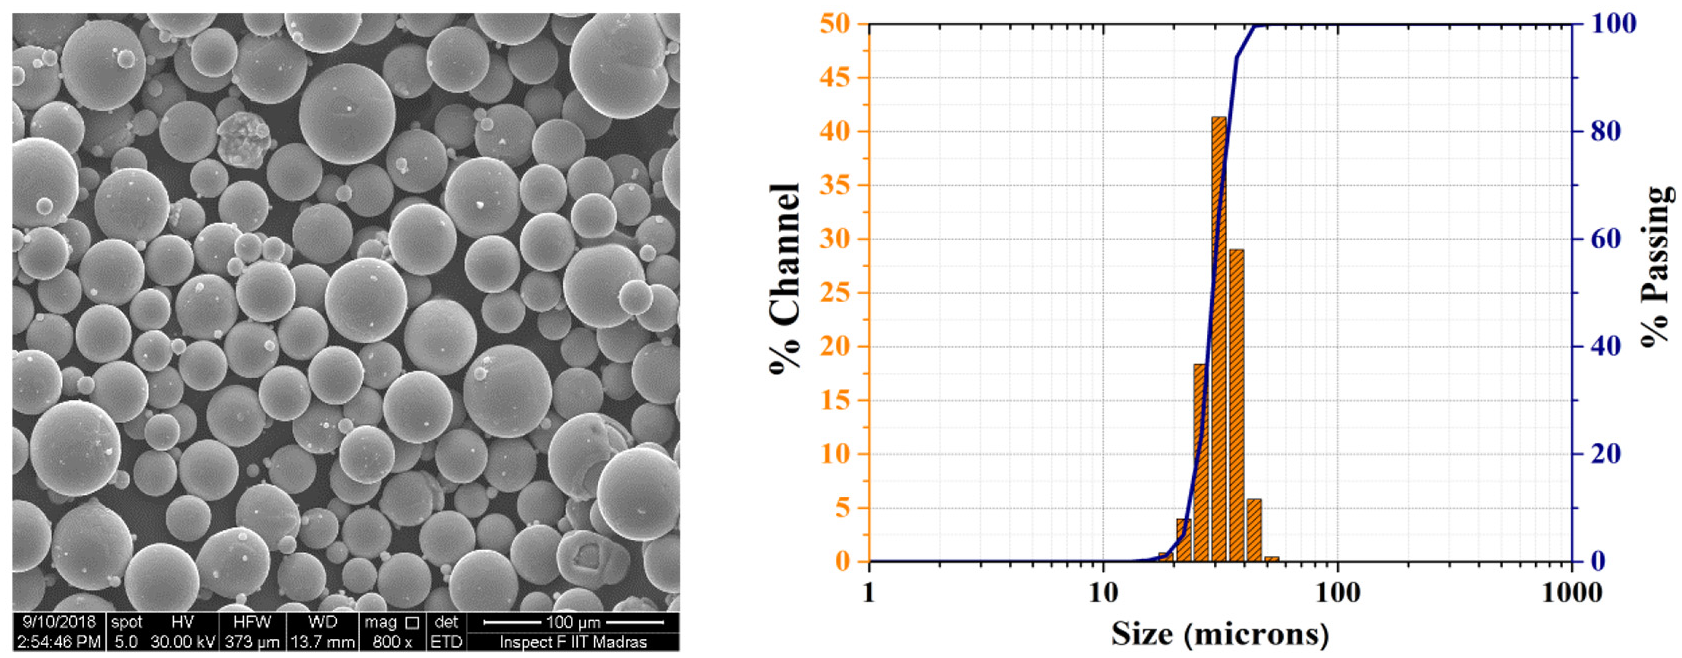
Particle size distribution and SEM micrograph of EOS Titanium Ti64 powder used for printing the samples.
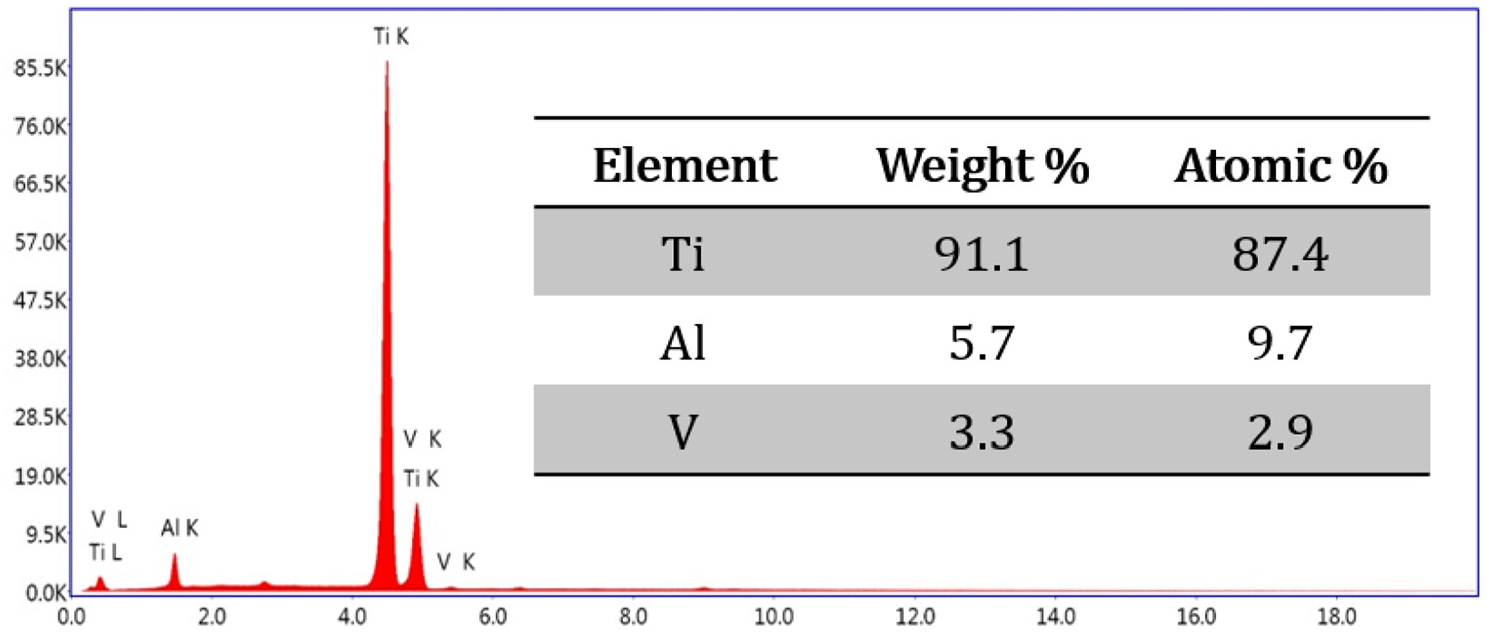
EDAX data plot showing the material composition of EOS Titanium Ti64 powder sample.
Part printing and data acquisition
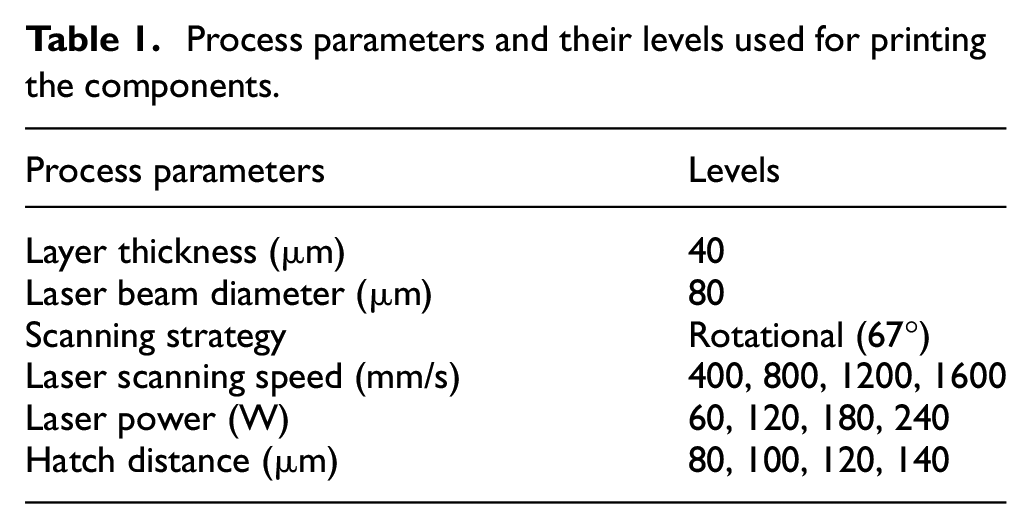
Three variable process parameters, viz., laser power, laser scanning speed and hatch distance, at four levels are used for printing the specimens. The layer thickness, scanning strategy, and laser beam diameter are the fixed parameters. The parts are printed in an Argon inert gas atmosphere using EOS INT M280 machine which has an inbuilt Yb-fiber laser. The process parameters and its levels selected for the design of experiments are shown in Table 1. A full factorial design is carried out using the selected process parameters and its levels. A total of 64 cubical specimens of 10 mm side (Figure 4) were expected to be printed at three parameters and four levels, but five specimens were not to print completely because of the process parameter combination that resulted in extremely low/high energy density values. The part geometry and the printed samples before removal from the build plate are shown in Figure 4. To study the surface texture in the in-built conditions, no post-processing processes were carried out after the print.
Process parameters and their levels used for printing the components.
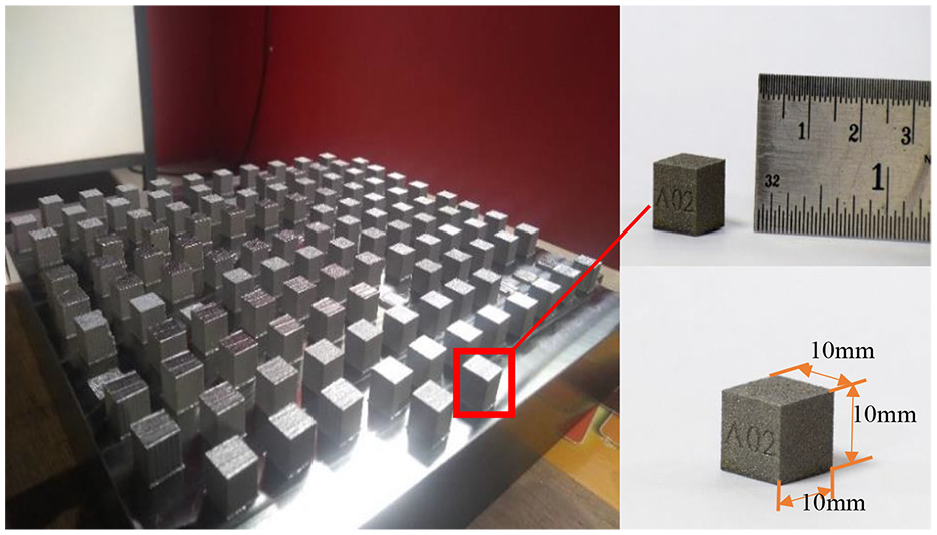
Printed samples before removal from the build plate and part dimensional details.
Post removal from the build plate, the roughness amplitude parameters, 3D average surface roughness (Sa), 3D root mean square roughness (Sq) and maximum height of the surface (St) of the samples were measured using Bruker 3D non-contact optical profilometer. The surfaces are scanned at 10× magnitude with a pixel resolution of 640 × 480. The surface images of the printed Ti-6Al-4V SLM parts were then acquired using Dino-Lite Edge 3.0 digital microscope with an inbuilt LED ring light illumination at a pixel resolution of 1280 × 960.
Image pre-processing
The images are pre-processed with a column-wise neighborhood operation. In this operation, the image is divided into [m × n] blocks, and each block is rearranged into a column of a matrix. The filter function is then applied to each column to obtain a single value for each column of the matrix. This value replaces the corresponding [m × n] block from which the column was derived. Block size is chosen as [5 × 5] in the present work. The chosen filter function is as follows:
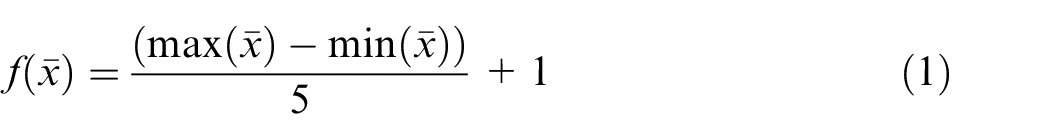
Where
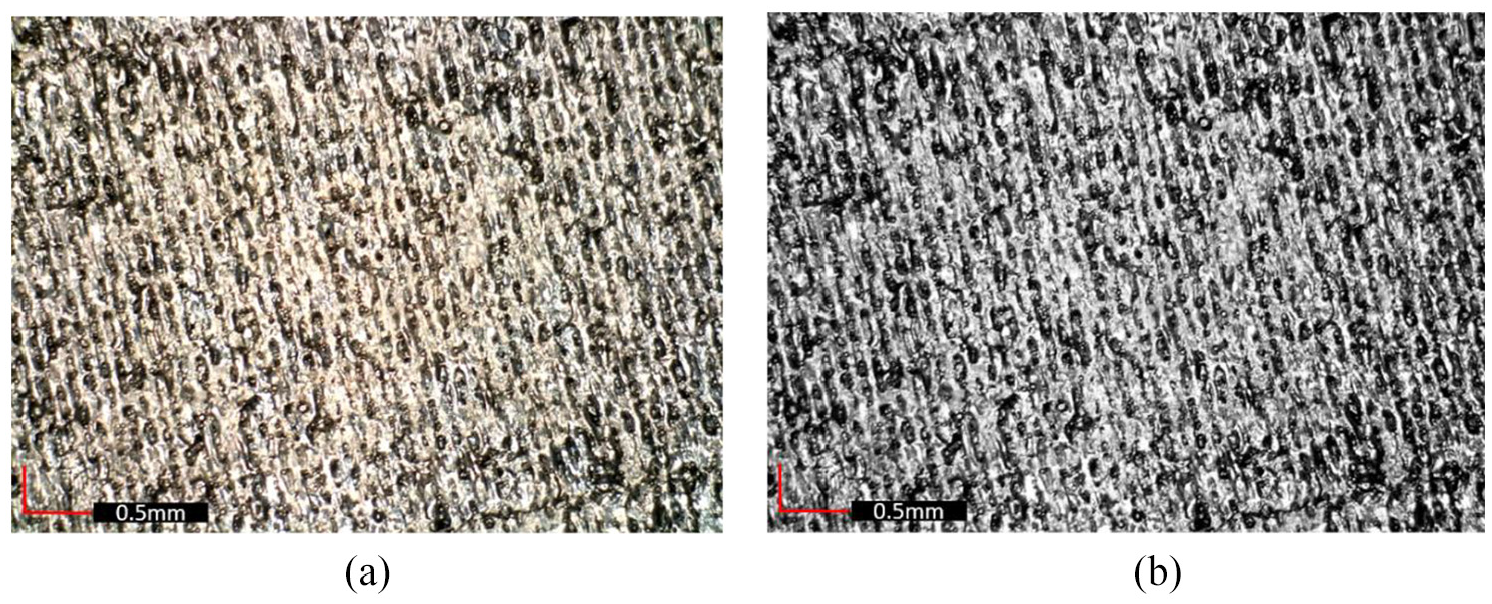
Sample surface images: (a) original image and (b) filtered image for analysis.
Fractal dimension analysis
Fractal geometry was designed to handle complicated shapes, but with complexity arranged in some hierarchical fashion. The concept of fractal or fractal dimension was introduced in mathematics. Mandelbrot 15 explained about the fractals and its characteristics. The self-similarity indicates that the subdivision of the curve when magnified looks the same as the original. However, the shapes observed in nature do not show exactly the same profiles at a magnified scale, but it maintains a similar appearance which are often statistically self-similar. 16 In other words, on an average they are similar. The concept was introduced to find the fractal dimension that can be associated with the measured length and it follows the relation

where “L” is the measured length of the statistically self-similar profile and “∈” is the unit of measurement. The number “D” is called the fractal dimension or fractal of the object. For a line profile, the fractal dimension values vary in the range 1–2, and for surface profiles, it comes in the range of 2–3. 17 The increase of the fractal dimension from 1 indicates that the profile spatial relation becomes more space filling and less line filling. Hence the fractal dimension contains both profile deviation information and spatial information of a surface topography. 16
In the present study, the fractal dimension of the surface images of Ti-6Al-4V SLM parts has been computed using the Fourier transform method. 18 This not only gives an estimate of the fractal dimension but also helps in the anisotropy study of the image. The algorithm to find the fractal dimension involves its calculation along several directions (dividing the plane equally) and taking an average over all directions. A total of 24 directions with 15° intervals and 30 divisions of radius are chosen for the study. The fast Fourier transform of the pre-processed surface image and the magnitude of the power spectrum (P) is calculated at each marked divisions along a given direction. After plotting the log-log graph of power spectral density and frequency (Figure 6), the slope of the graph (β) is found out. The slope of the plot is proportional to the fractal dimension (D) mathematically as follows 18 :
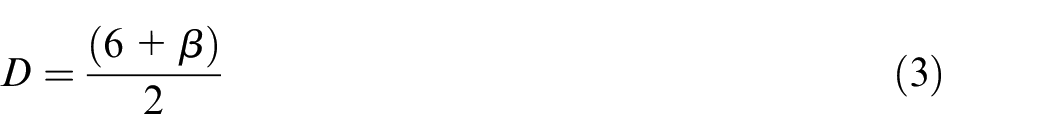
The process is carried out in all 24 directions and the average fractal dimension is calculated.
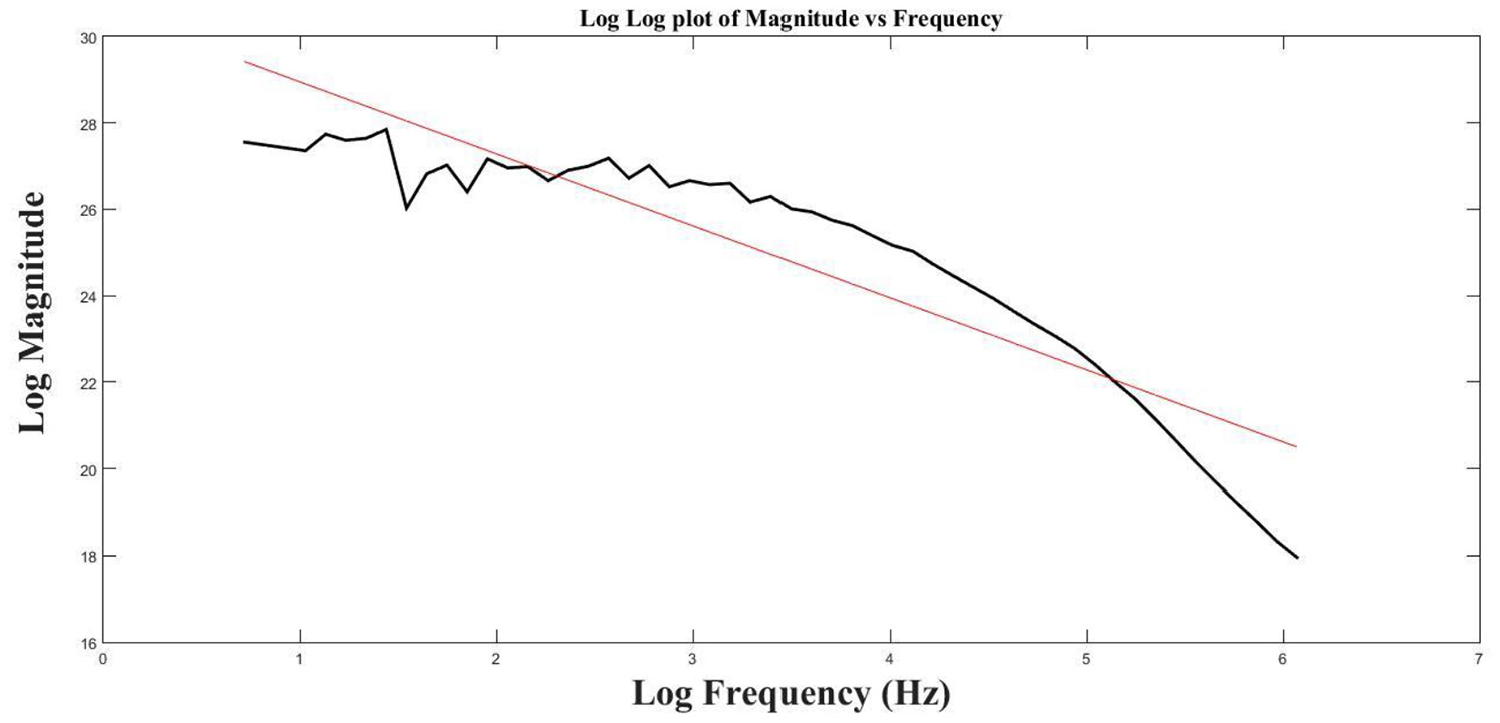
Log-log plot of magnitude versus frequency of part surface image for computing the fractal dimension values.
Lacunarity analysis
The term “Lacunarity” was coined by Mandelbrot 19 for quantifying the data filling ability or the gap distribution in a fractal. Fractal dimension alone cannot give a complete insight into the data filling characteristics of the image texture. It gives an understanding of how much texture space is filled, but not the trend in which the data is filled in the space. Lacunarity is a measure of the heterogeneity of the image texture. The most commonly used method for finding the lacunarity is the gliding box algorithm, 20 which is similar to the box count method for fractal dimension analysis. The process involves gliding a box of selected size all over the image matrix and counting the number of set points (black pixels) within it. The fast algorithm for implementing the gliding box algorithm developed by Tolle et al. 21 is used in the present study. The lacunarity of the grayscale image is computed using the algorithm by approximating the image by converting to a binary image. The computation involves finding the number of gaps or cluster of black pixels in the binary image. The steps involved in the calculation of the lacunarity of the surface images is as follows:
Initialize the box as 2 × 2 and the box is placed on the top left of the image.
The number of set points (black pixels) covered in this position is counted.
The box is then moved one step to the right, and the number of black pixels is counted and noted.
The process is repeated until all the pixels in the image is covered.
Calculate the sum (σ1) and the squared sum (σ2) of the number of black pixels computed.
The value M(n) is calculated as follows:
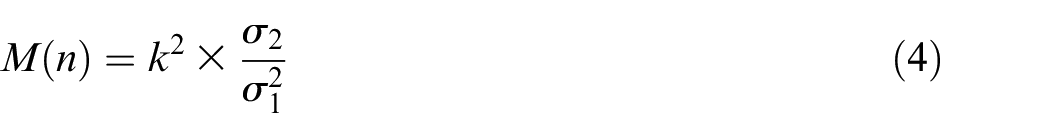
Where “n” denotes the box size, “k” denotes the number of steps involved in arrow or column to move through, “σ1” is sum of the black pixels counted and “σ2” denotes the squared sum of black pixels counted at a box size of n.
(g) The above steps are repeated by doubling the box size (in the multiples of 2) and the M(n) value is computed till the box size doesn’t exceed the row or column of the image.
The average values of M(n) gives the lacunarity value of the image.
Results and discussions
The major influencing process parameters considered in present surface texture analysis are laser power, scanning speed and hatch distance. The relation between the fractal dimension and process parameters are studied. The variation of measured surface roughness parameter Sa and spread of the calculated fractal dimension values with the process parameters are shown in Figures 7 and 8. It is visible that the spread of fractal dimension shows some trend with the input process parameters. Also, the fractal dimension values show a strong positive correlation (more than 0.8) with the measured surface roughness parameters, that is, the fractal dimension increases with an increase in surface roughness (Figure 9). The low surface roughness is due to better interlayer connection and continuous smooth surface due to the formation of a stable melt pool. At higher laser power, lower scanning speed and hatch distance, the powder particles have better wettability and form a stable melt pool. This results in better interlayer connection and continuous smooth surfaces with low surface roughness values are formed. The fractal dimension values showed lower values at the low surface roughness conditions. At low laser power and high scanning speed, the powder particles lack enough energy for the complete melting of the powder particles and formation of a stable melt pool. Also, when the hatch distance becomes higher than the laser beam diameter, the bonding between the powder particles are affected. All this results in the formation of a large number of partially or un-melted particles sticking on the surfaces, resulting in a rough, coarse surface at low laser power, high scanning speed, and high hatch distance values. The fractal dimension will be higher for such surfaces (Figure 8).
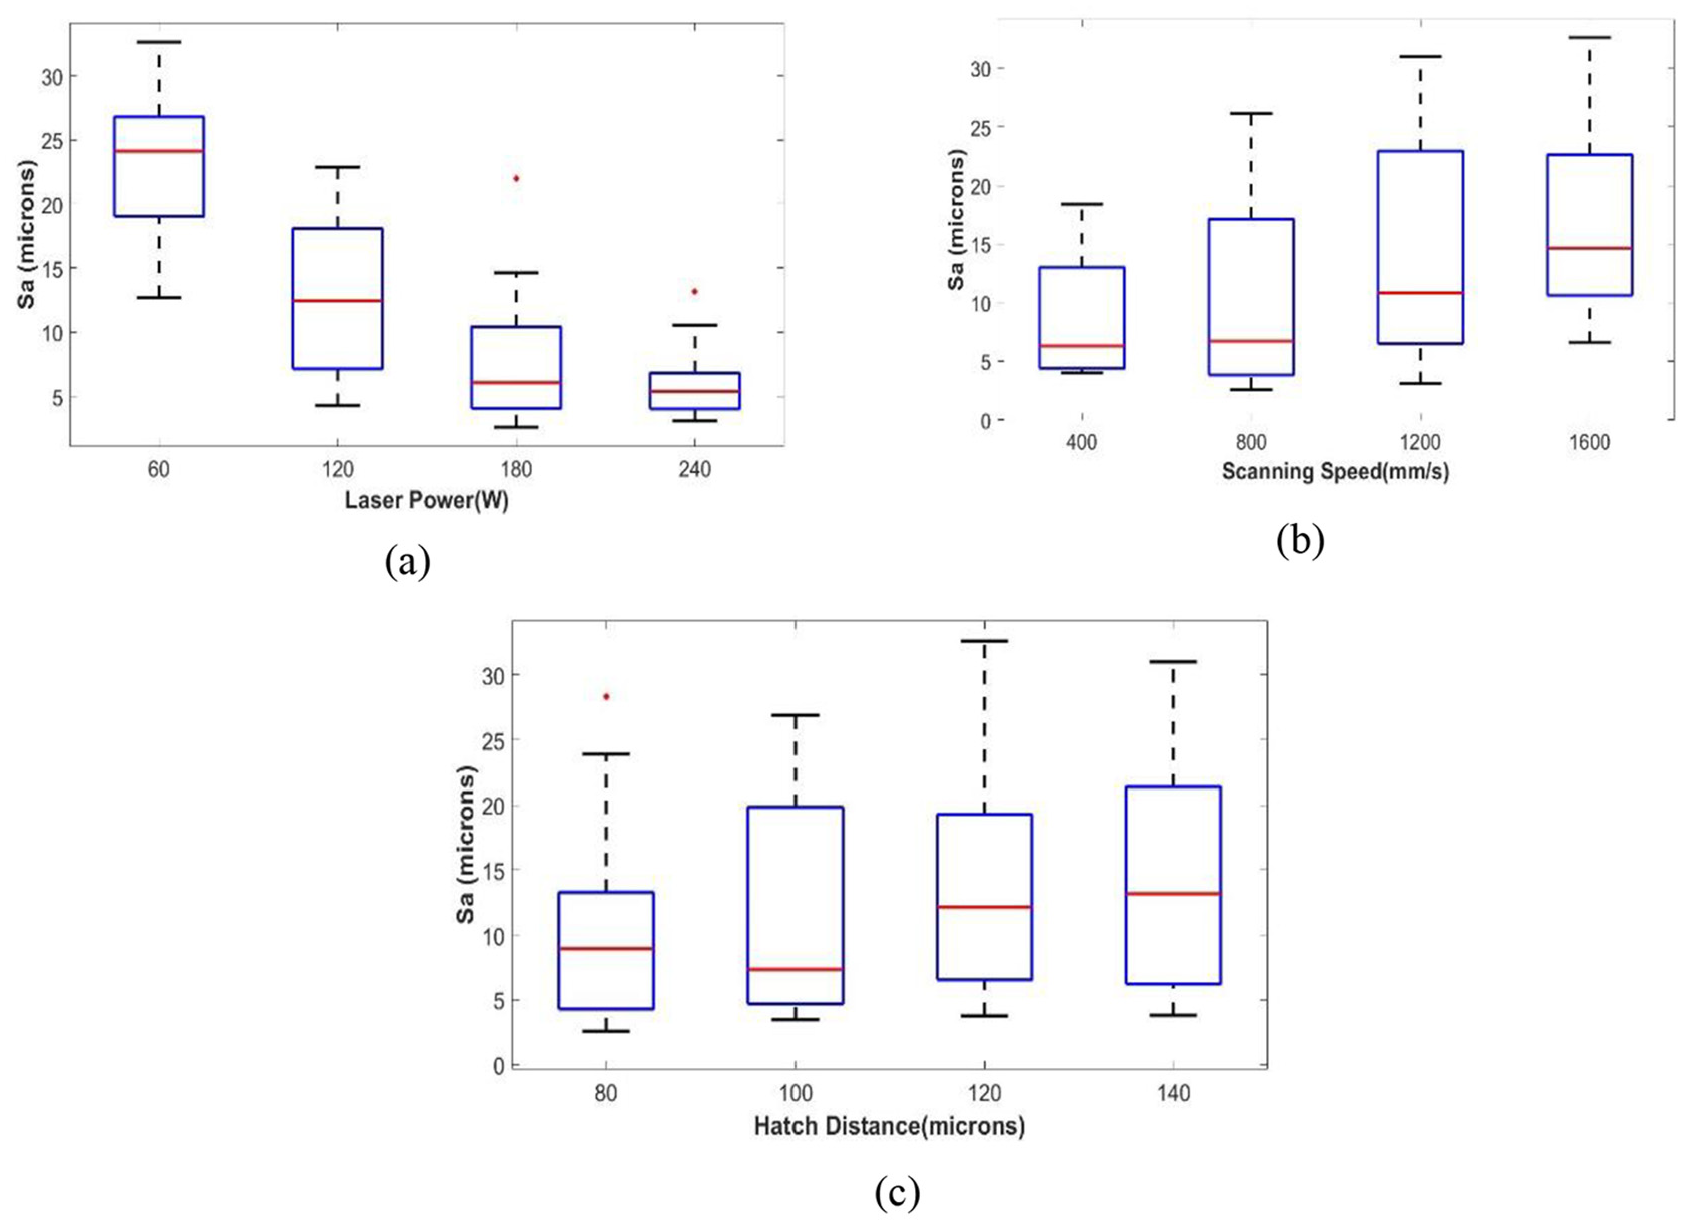
Variation of mean surface roughness parameter Sa with process parameters: (a) laser power, (b) scanning speed, and (c) hatch distance.
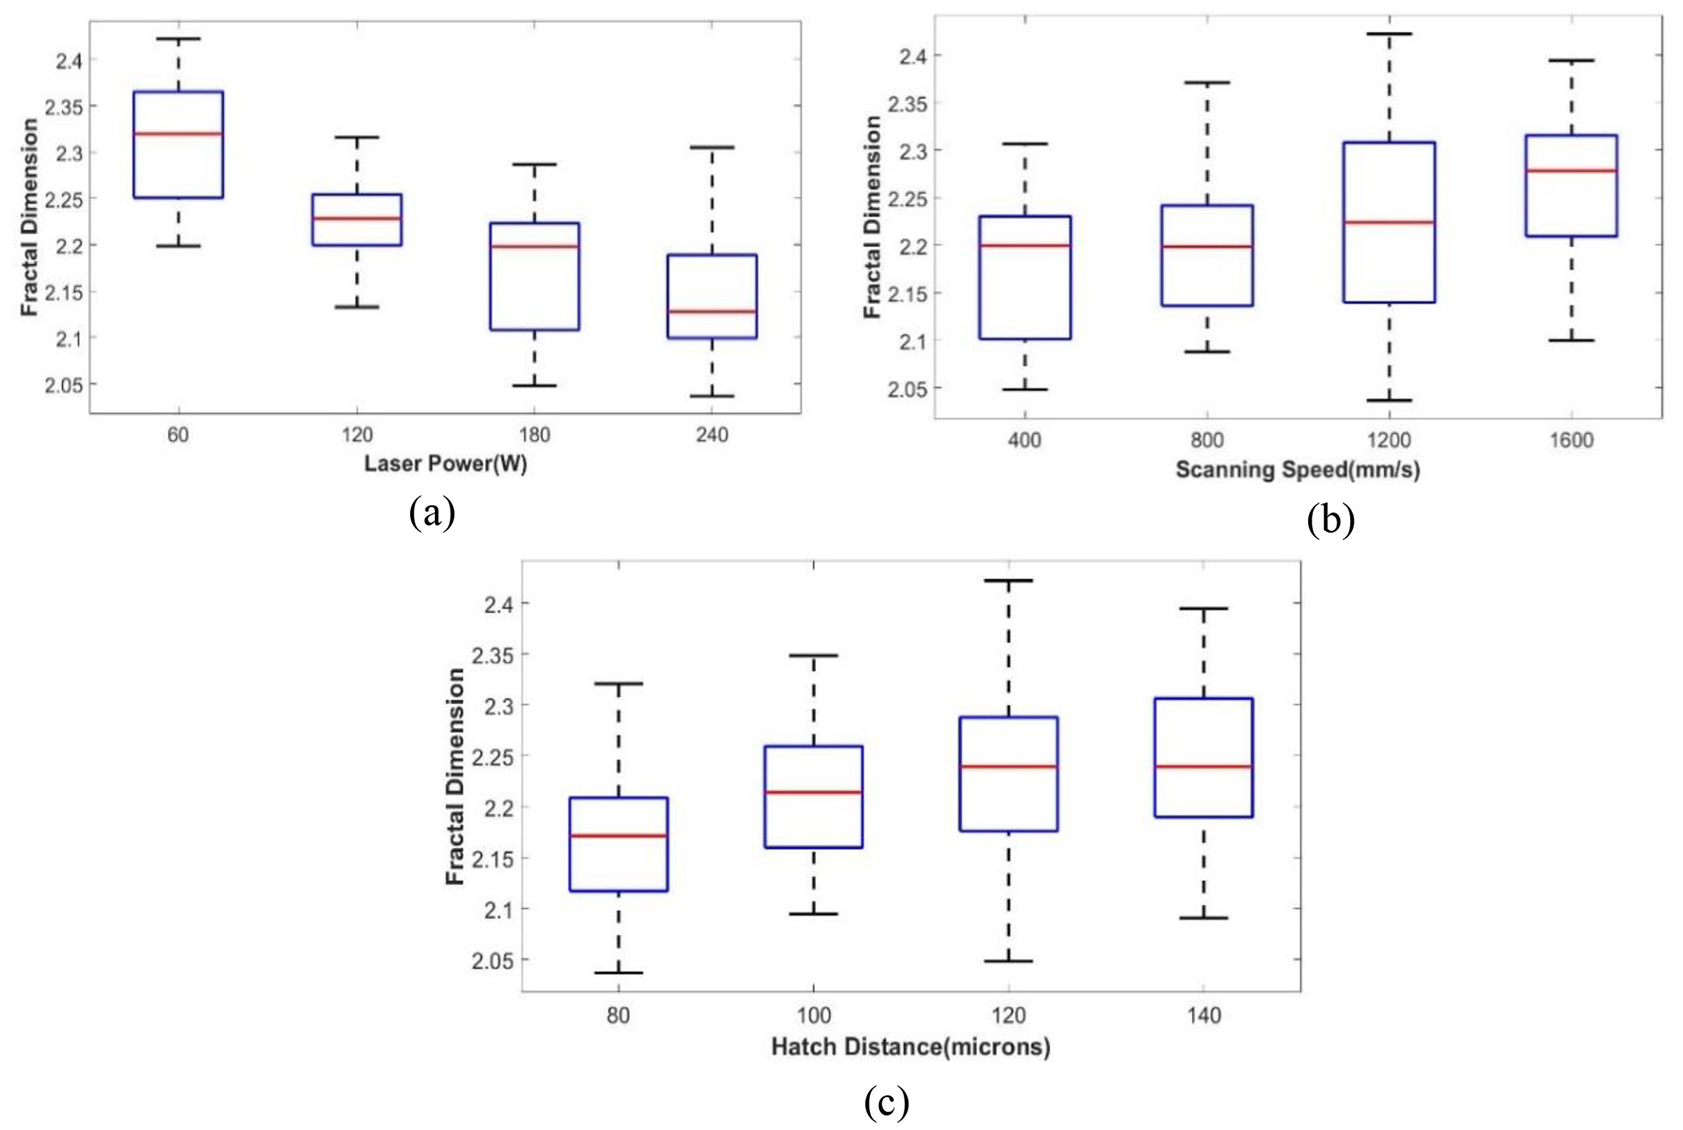
Variation of fractal dimension with process parameters: (a) laser power, (b) scanning speed, and (c) hatch distance.
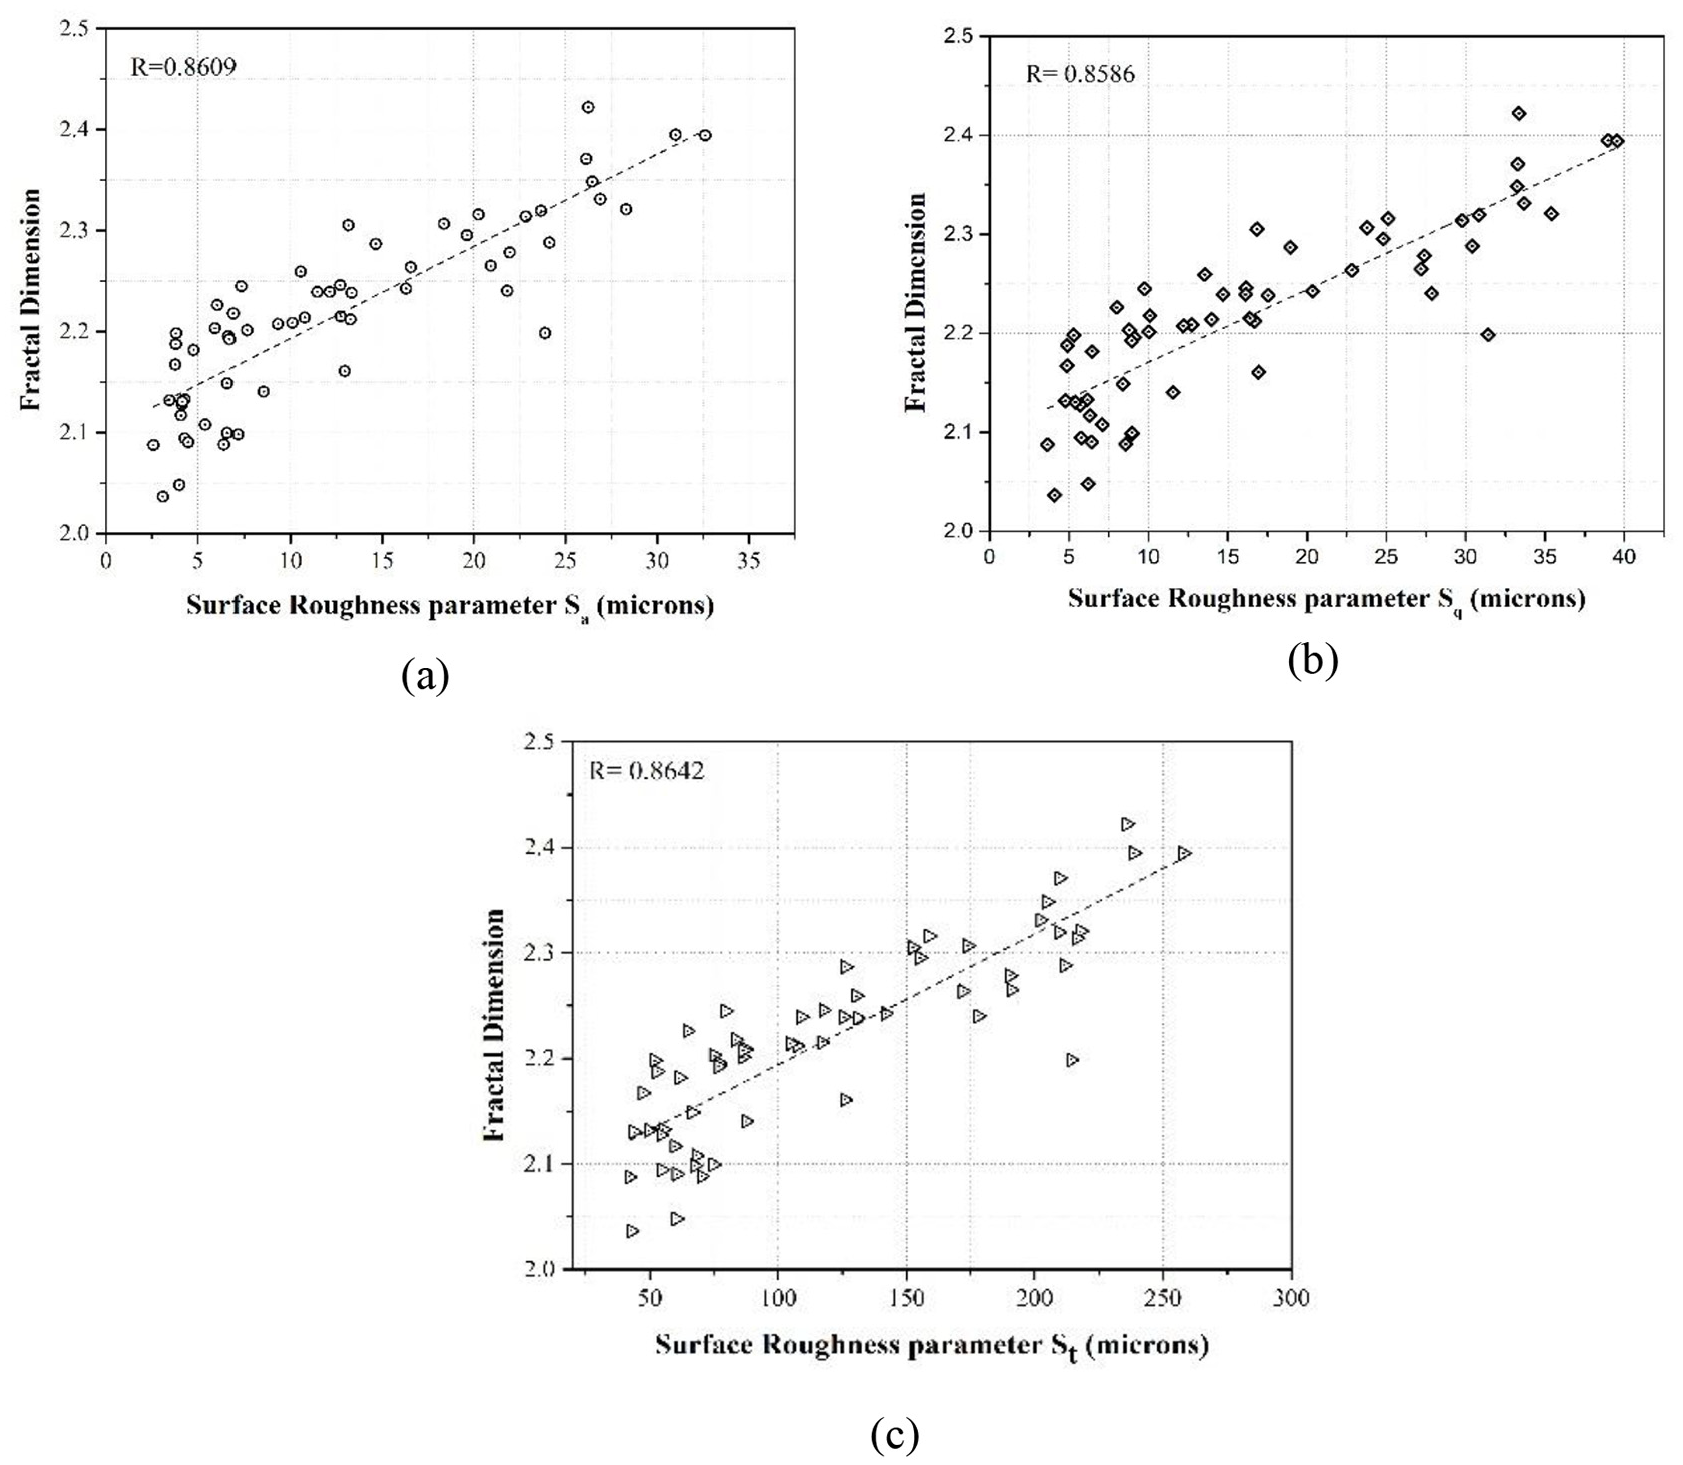
Variation of fractal dimension with measured surface roughness parameters: (a) Sa, (b) Sq, and (c) St.
To study the anisotropic nature of the surface image of Ti-6Al-4V SLM components, as mentioned before, the fractal dimensions are calculated in 24 directions with an interval of 15 degrees. To quantify the anisotropy values, the parameter degree of anisotropy (Da), which is the ratio of maximum fractal dimension value to minimum fractal dimension value 22 is used. For an ideal isotropic texture, the values of Da will be 1, and for an anisotropic surface, the value will be more than 1. In the present study the Da values of all the surface texture images are found to be more than 1. It indicates that the printed Ti-6Al-4V SLM parts shows an anisotropic characteristics. This anisotropic nature can be visualized with the help of rose plots, where the fractal dimension computed in all directions are plotted as a polar plot with respect to a radial direction, as shown in Figure 10. For an isotropic surface texture, the computed fractal dimension values will be the same in all directions (hence Da = 1) and the rose plots would be a perfect circle. With the increase in Da values, the fractal dimension values in different directions vary significantly, and hence, the rose plots show a significant deviation from being a circle (Figure 10). This shows that the surface texture properties may vary significantly at various directions of the texture. To have a better understanding, the influence of process parameters in determining the anisotropic nature of the surface textures is analyzed by plotting the mean Da values against the process parameters (Figure 11).
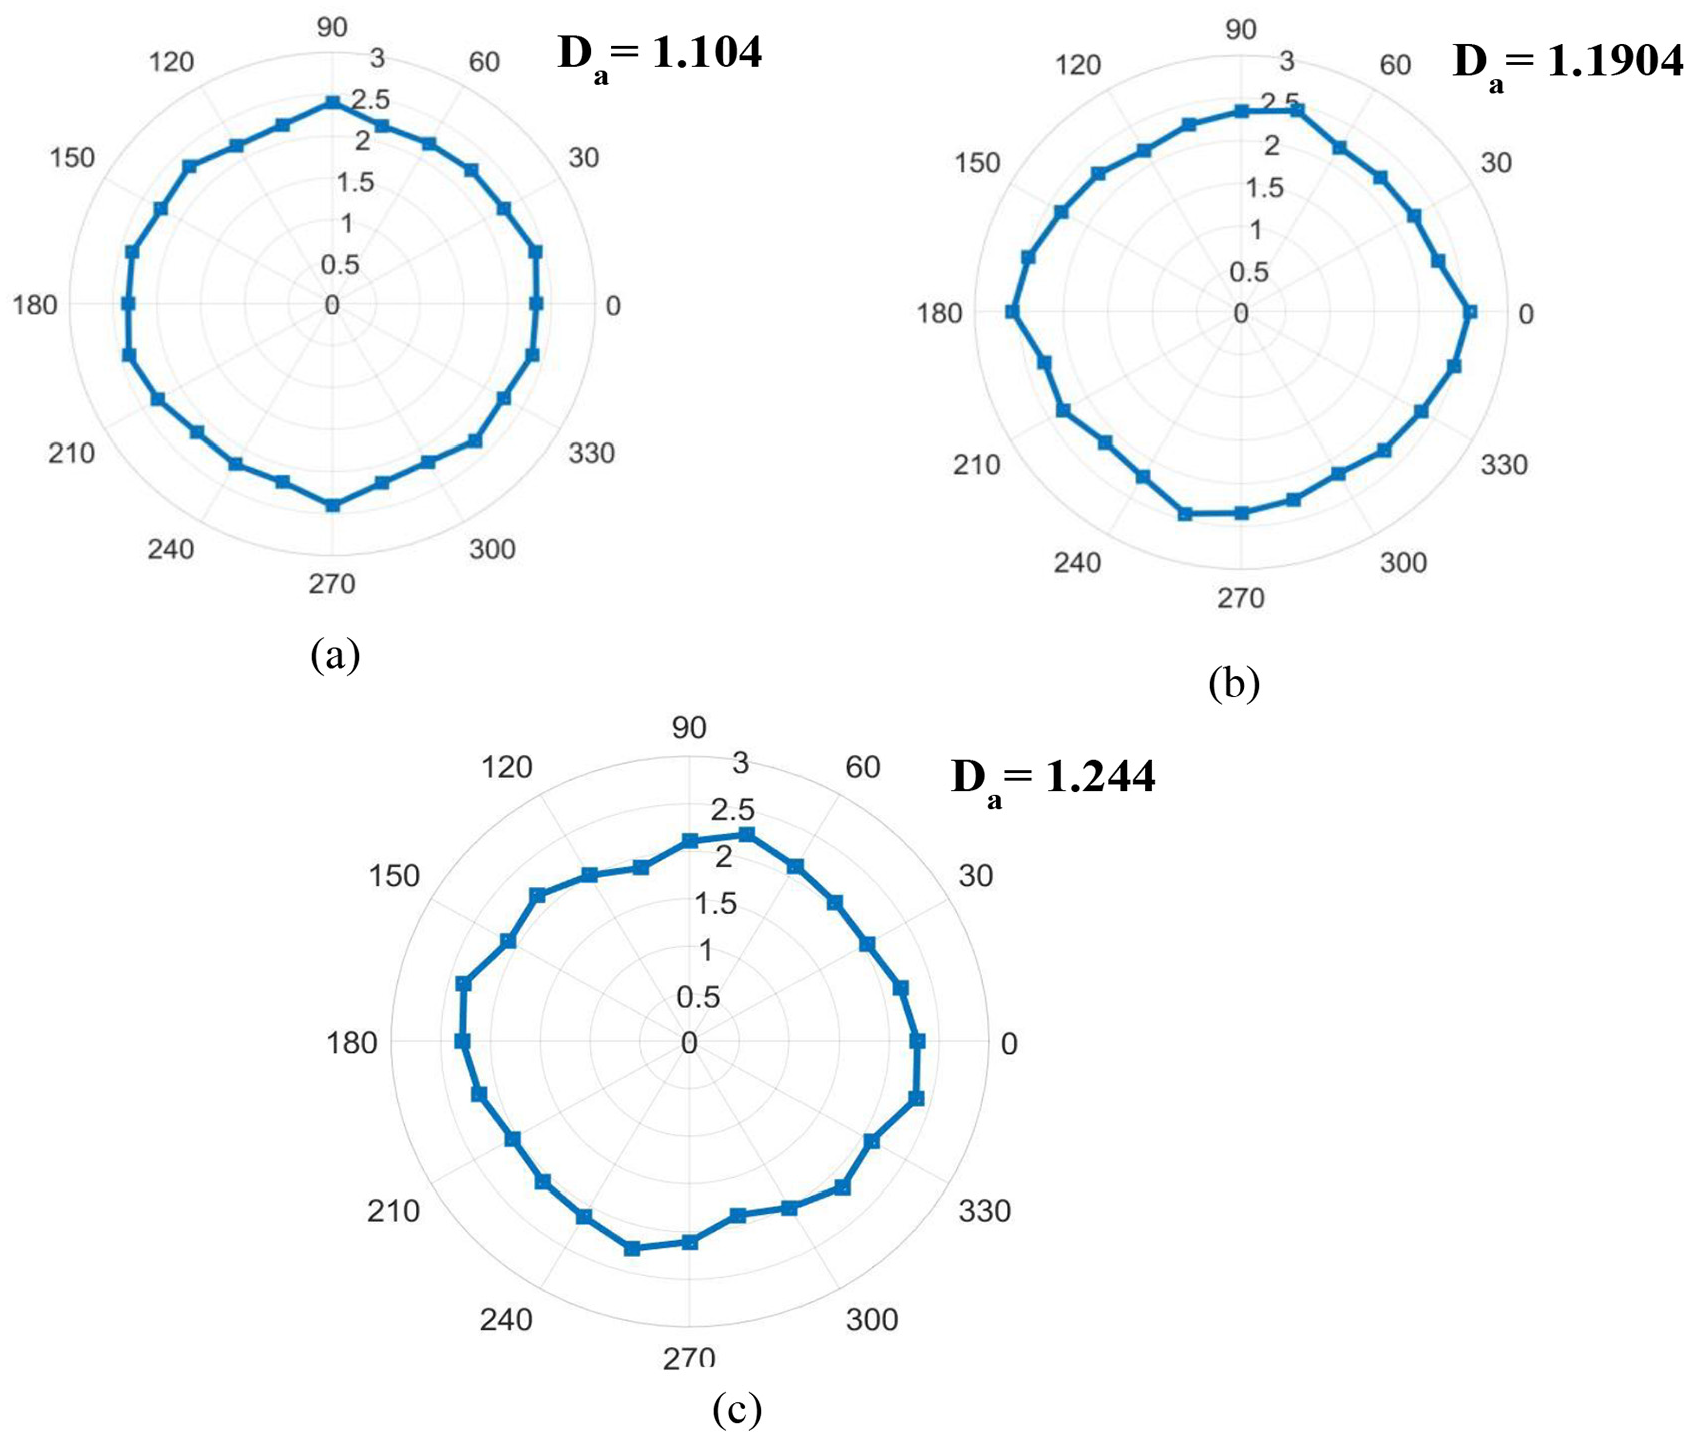
Rose plots showing the variation of fractal dimension values at various surfaces with process parameters: (a) P = 180 W, SS = 1600 mm/s, h = 140 µm, (b) P = 60 W, SS = 1200 mm/s, h = 80 µm, and (c) P = 240 W, SS = 800 mm/s, h = 100 µm.
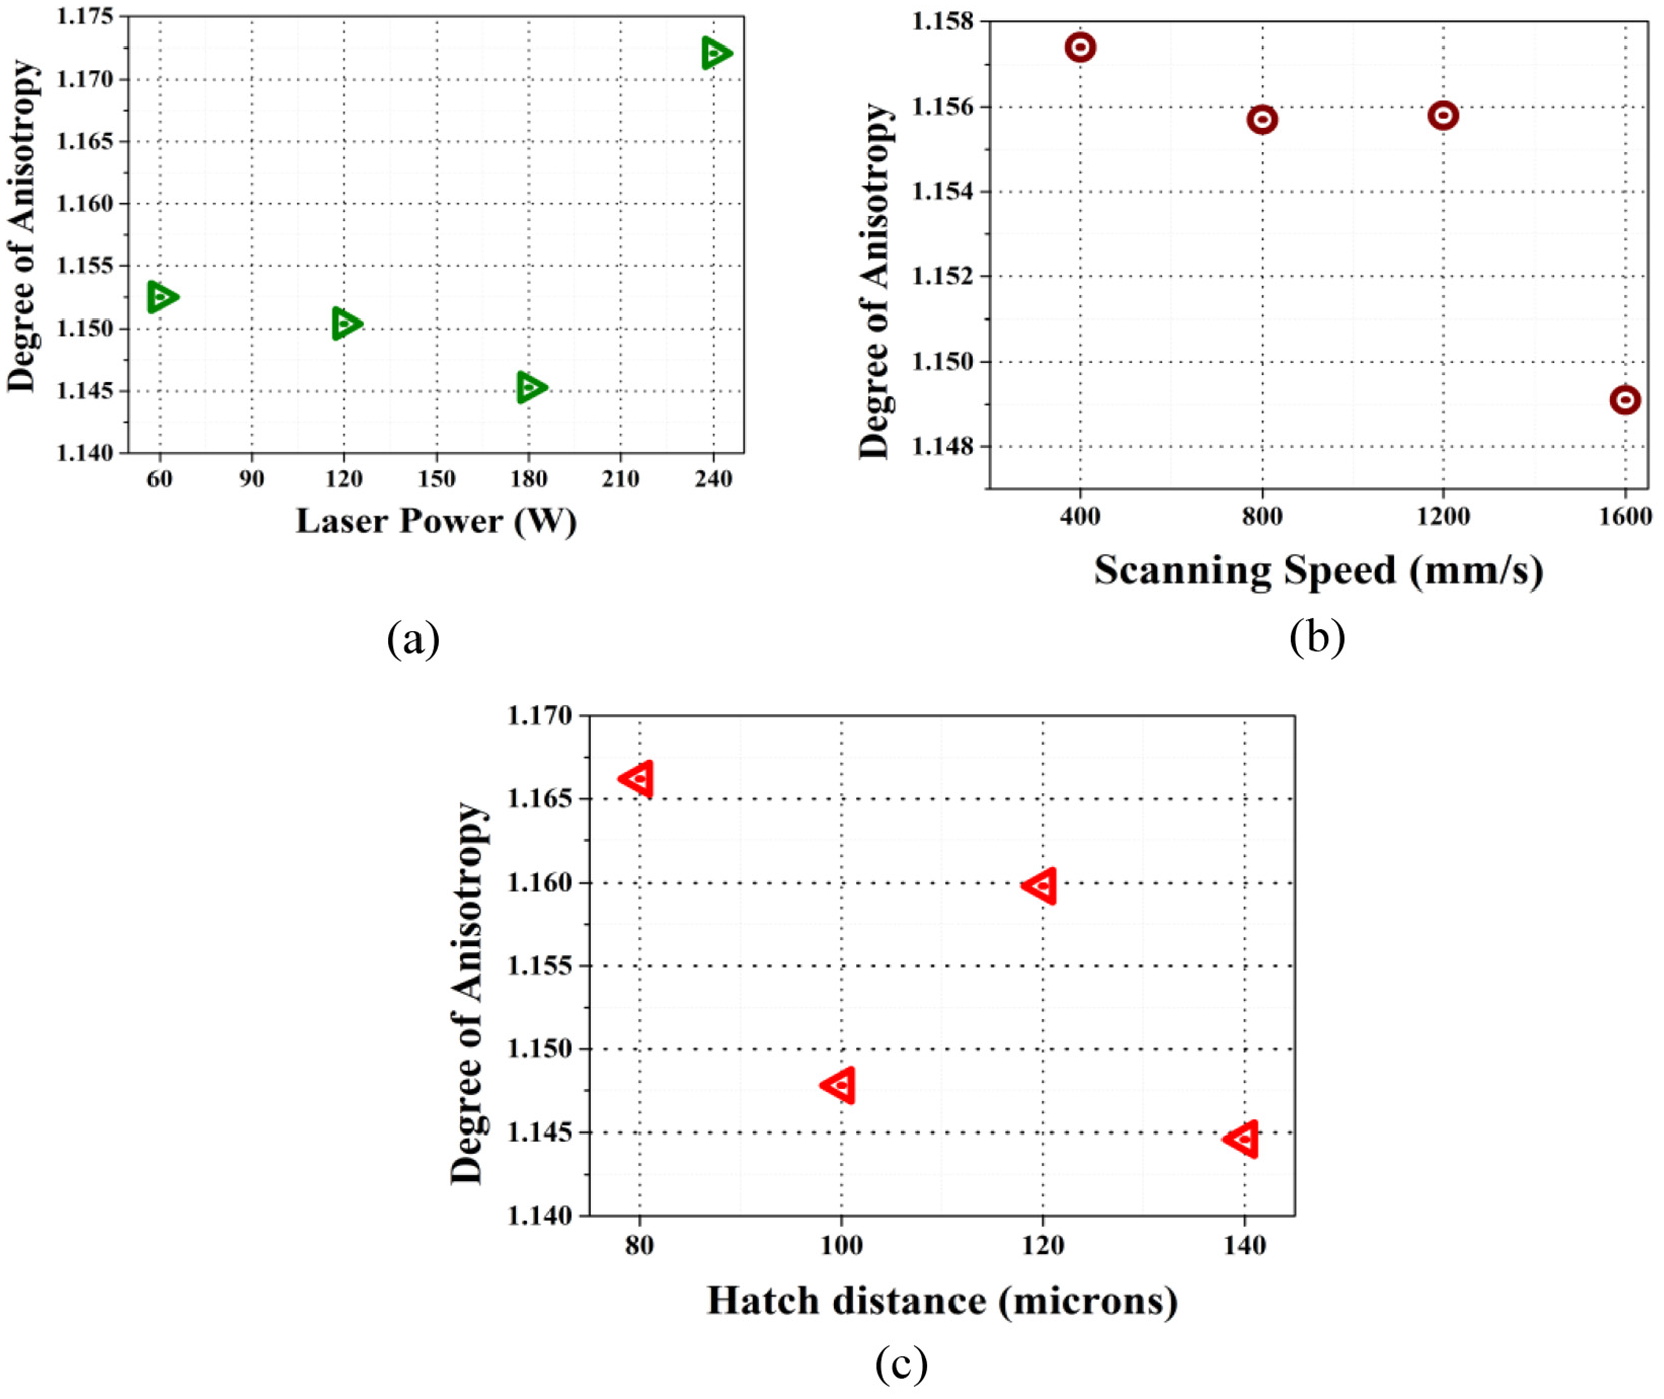
Variation of degree of anisotropy at various process parameter values: (a) laser power, (b) scanning speed, and (c) hatch distance.
Figure 11 shows the plots between the computed mean degrees of anisotropy (Da) values against the three process parameter values, laser power, scan speed and hatch distance. From the Figure 10, it was clear that the surface textures of the printed SLM parts showed an anisotropic nature. The Da is computed in order to quantify the anisotropic nature. Figure 11(a) shows the variation of the Da with the laser power level values. From the plot it can be observed that the surfaces shows a weaker anisotropic nature at lower laser power ranges (60W, 120W, and 180W). This indicates that the variation of surface texture properties of the acquired surface images is minimal at this range. The main reason behind this is due to the observed patterned reflection of the light during the image acquisition of the surfaces. At lower laser power ranges, large number of powder particles undergo partial melting or incomplete melting and stick on to the surfaces and results in increased surface roughness values. Similarly, the scan speed showed a decreasing trend with the Da value. At lower scan speed ranges, the Da values are higher and the Da values decreases with the increase in the scan speed. This occurs because, at high scan speed the lack of sufficient time to form a stable melt pool results in the formation of the powder particles sticking on to the surfaces and results in high surface roughness conditions. The third parameter, hatch distance, is the distance between the two adjacent scans, did not show any explicit trend with the Da values. However, the Da value showed a minimum value at the maximum hatch distance (140 µm). In short, at lower laser power, high scan speed and high hatch distance values, due to the lack of formation of a stable melt pool, a large number of un-melted and partially melted particles stick on to the surfaces and this results in the formation of surfaces with high surface roughness values. This un-melted particles resulted in a patterned reflection of the brighter pixel values (close to 255 grayscale values) when light is incident on the surface for image acquisition (Figure 12). The gray scale values of the surface images under such conditions distributed only in fewer levels which resulted in minimal variation of the computed fractal dimension values at different directions. Hence, the surface texture image showed weaker anisotropic characteristics at these process parameter conditions which results in a lower values of Da.
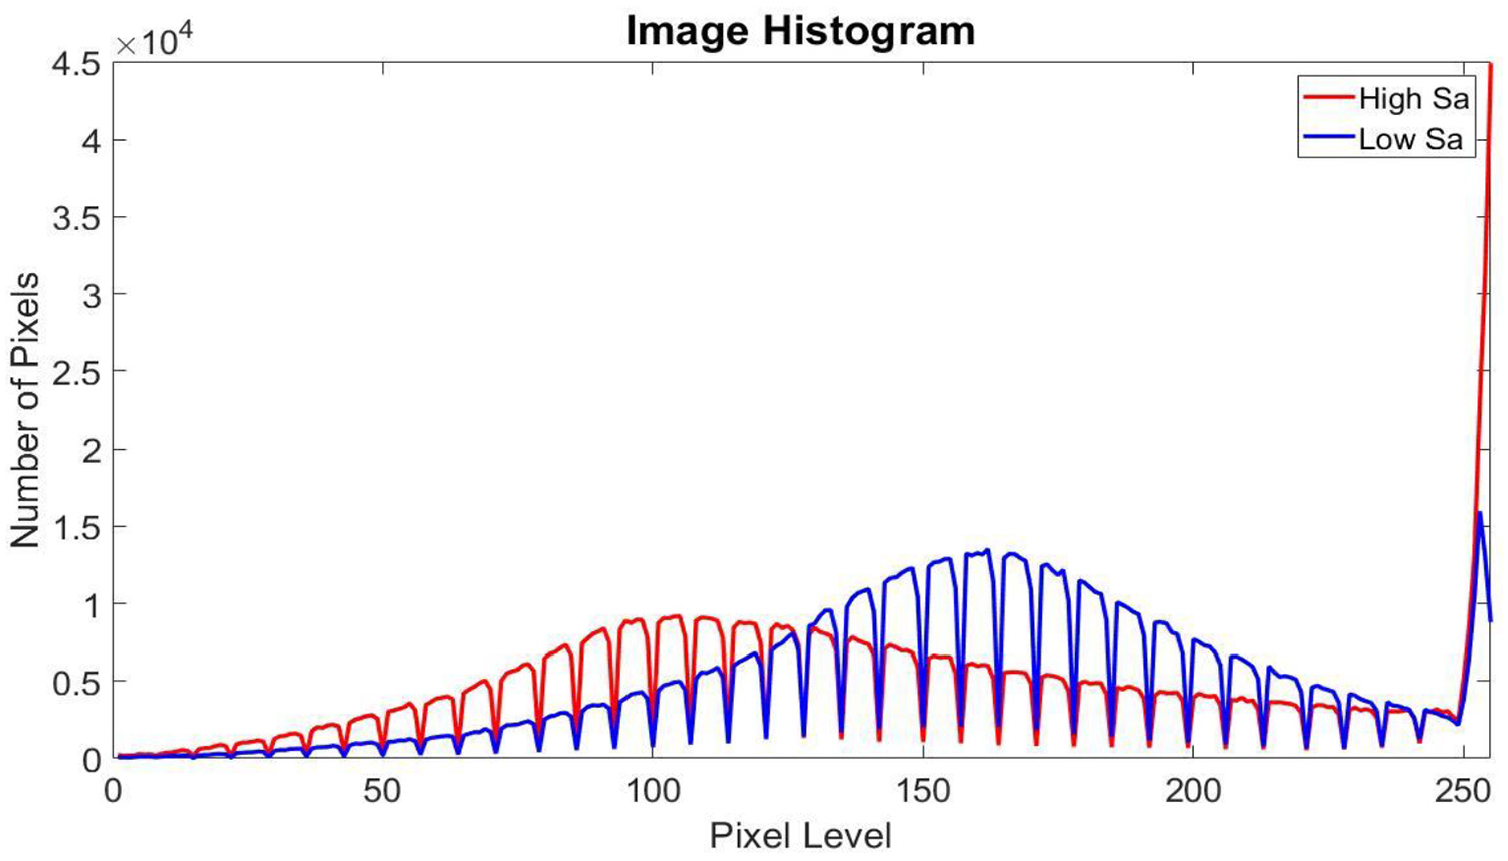
Histogram plot of surface images with high and low surface roughness values.
The lacunarity measurement in image morphological analysis is a measure of the heterogeneity of the image texture. Higher lacunarity values indicate larger texture heterogeneity (poor homogeneity). In the present study, the influence of process parameters in determining the homogeneity nature of the surface texture images is analyzed by computing and plotting the mean lacunarity values against the process parameters, as shown in Figure 13. From the Figure 13(a) it is observed that the lacunarity values shows a clear increasing trend with increase in laser power values indicating an increase in the heterogeneity nature of the surfaces at high laser power or an improved homogeneity nature at lower laser power values. In the case of scan speed, the lacunarity values showed a decreasing trend implying a homogeneous surface texture image is obtained at higher scan speed ranges. Similarly, the lacunarity values showed a decreasing trend with increase in the process parameter hatch distance Figure 13(c) indicating a homogeneity texture at higher hatch distance conditions. From the plots, it is observed that the surface texture images are more homogeneous (low lacunarity values) at high surface roughness conditions (at low laser power, high scanning speed, and high hatch distance values). This is because of the patterned reflection of brighter pixels by rough surfaces due to the presence of a large number of un-melted or partially melted particles as discussed. The surface heterogeneity is high (high lacunarity values) at higher laser power, lower scanning speed and lower hatch distance where the surface roughness is low.
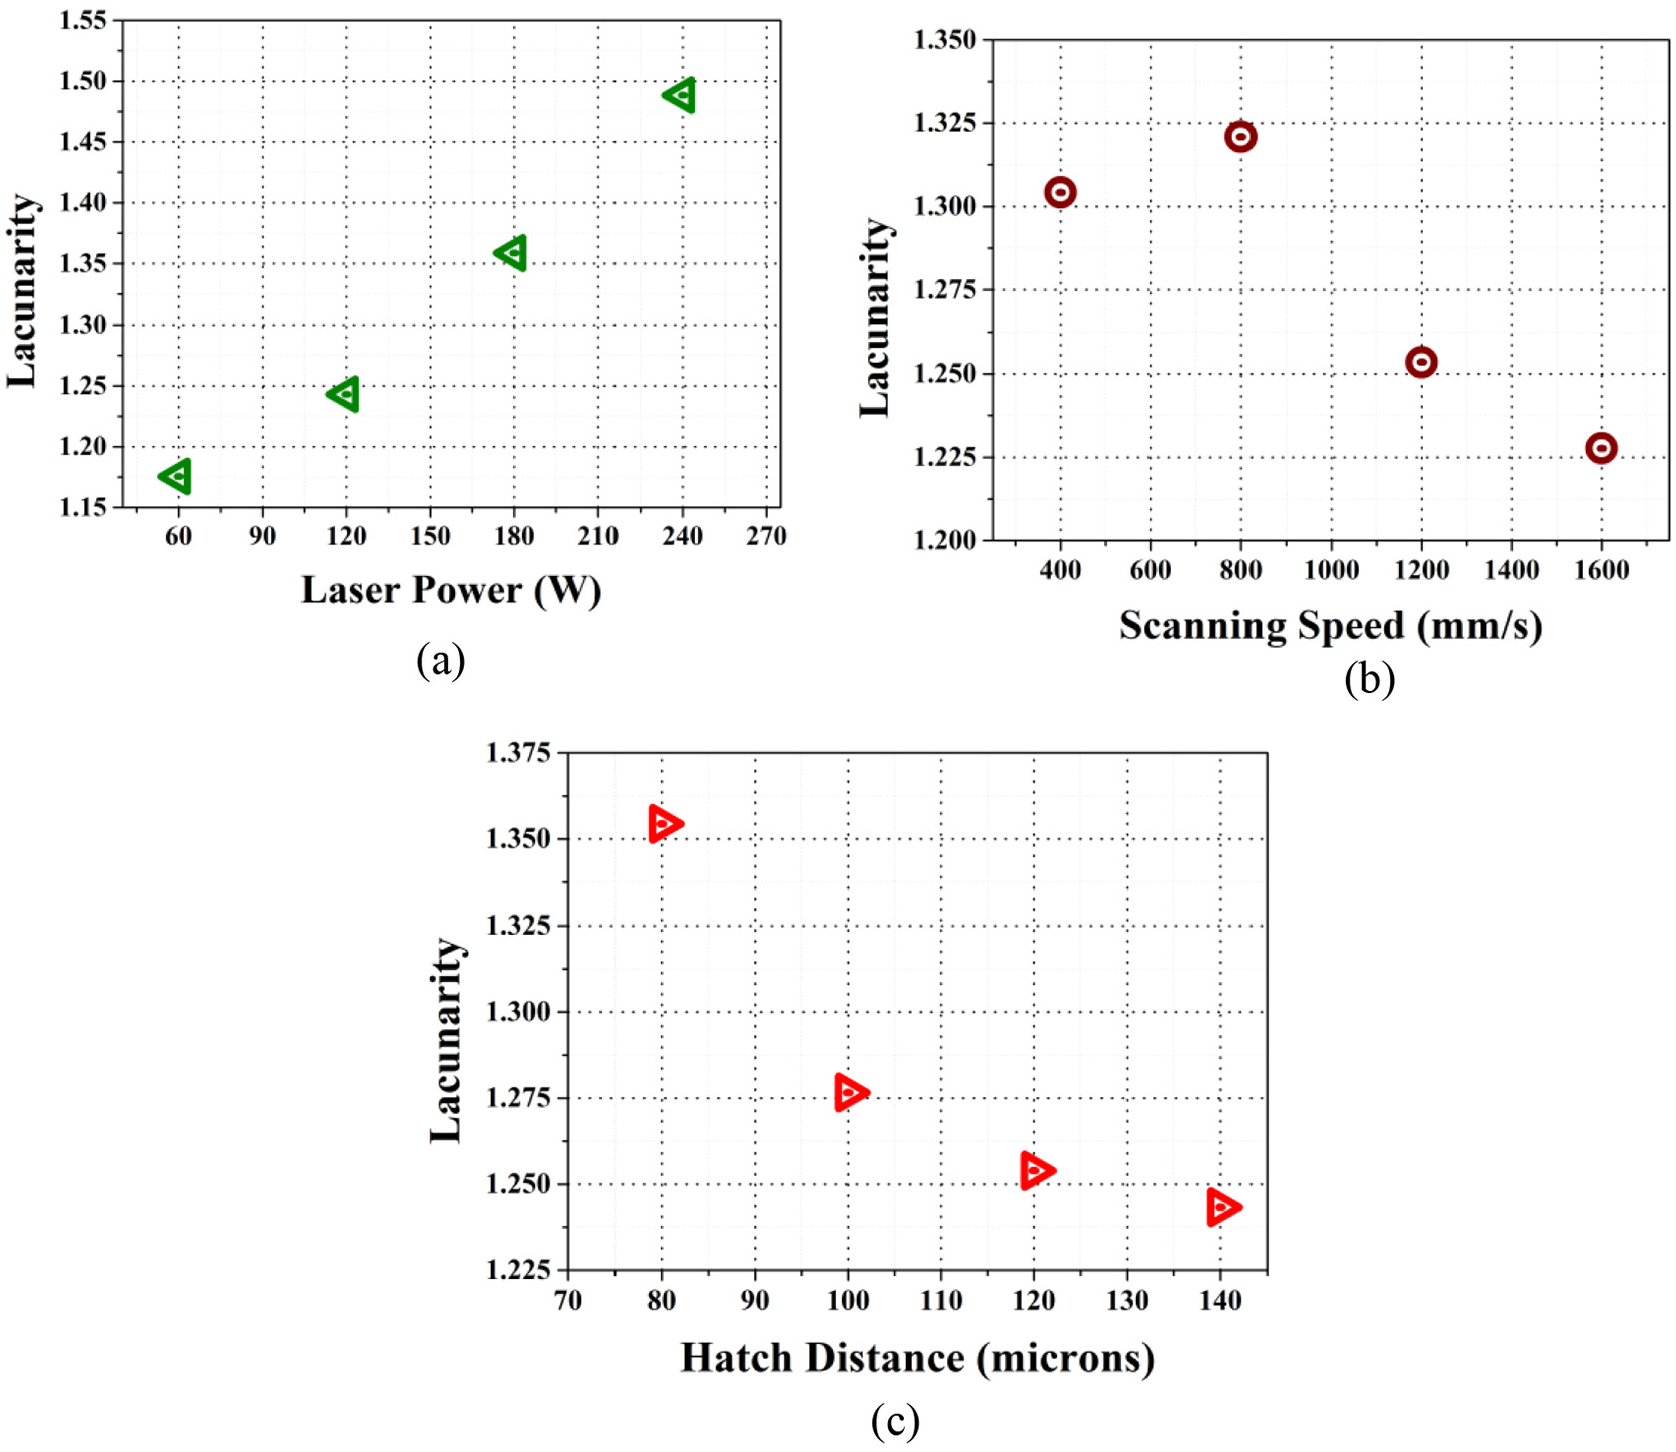
Variation of lacunarity at various process parameter values: (a) laser power, (b) scanning speed, and (c) hatch distance.
This is because the light incident on such surfaces is more distributed in a large number of gray levels (Figure 12). The distribution of un-melted and partially melted particles can be clearly visualized with the help of SEM micrographs. Figure 14 shows the surface SEM micrographs, at a constant magnification, showing the increase in the number of powder particles sticking on the surface as the surface roughness is increasing.
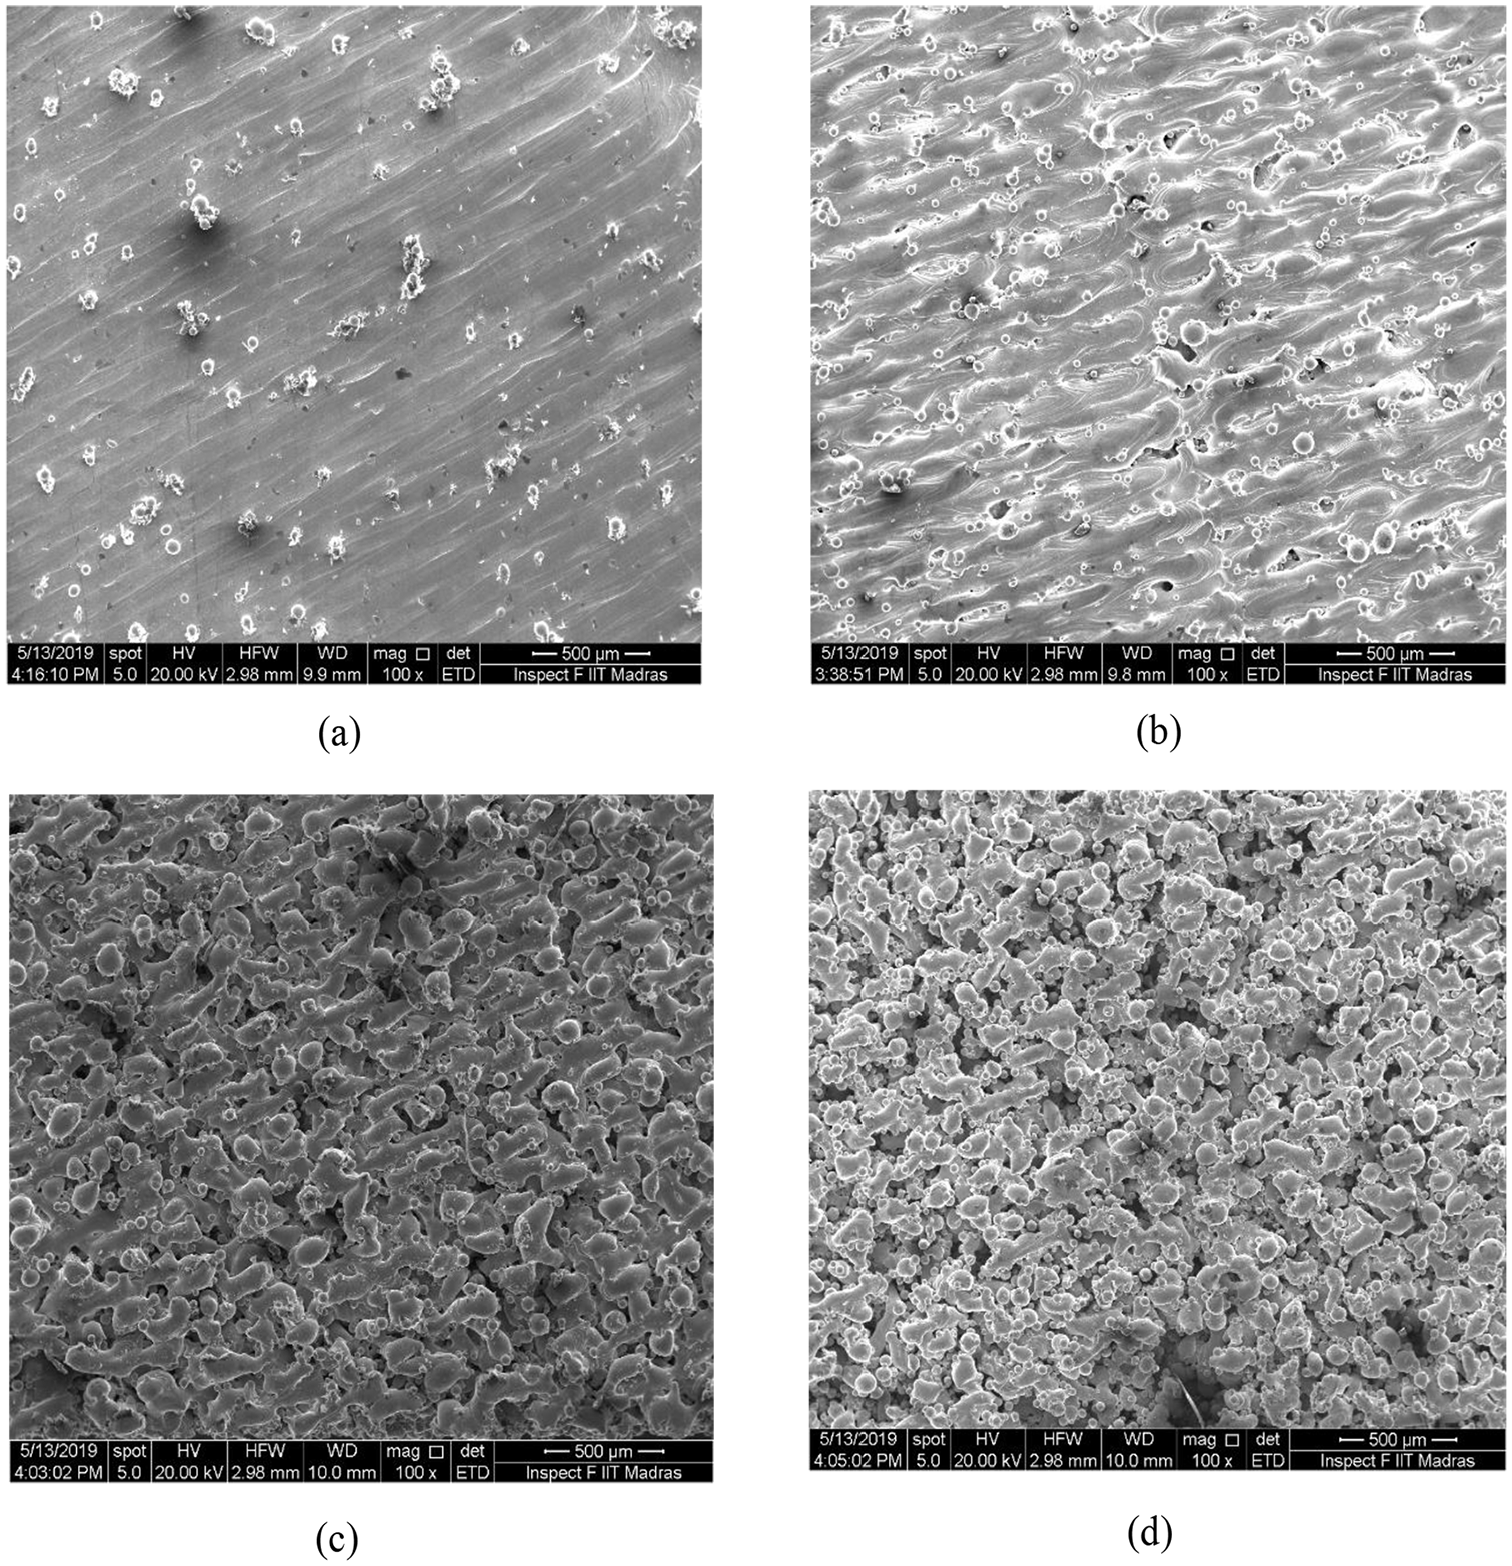
SEM micrographs showing the un-melted and partially melted particles distribution trend at various surface roughness values: (a) Sa = 2.58 µm, (b) Sa = 16.563 µm, (c) Sa = 26.463 µm, and (d) Sa = 32.623 µm.
Conclusion
The surface texture of Ti-6Al-4V SLM components is characterized with the help of surface images and fractal dimension analysis. The fractal dimension of the surface images is computed using the Fourier transform method. The variation of the calculated fractal dimension values with the input process parameters are also studied. It was evident that the fractal dimension showed higher values for higher surface roughness conditions (low laser power, higher scanning speed, and high hatch distance). Also, the fractal dimension showed a solid correlation of more than 0.8 with all three measured 3D surface roughness parameters. The anisotropic nature of the surface texture image is studied by calculating the fractal dimension in different directions at equal intervals. A parameter called the degree of anisotropy (Da) is used for quantifying the anisotropic nature of the images. From the variation of the mean Da values with the process parameters, it was visible that the surface images showed weaker anisotropic nature at low laser power ranges and high scanning speed. Even though the effect of hatch distance was highly fluctuating, the Da values showed a very low value at the maximum hatch distance value. In short, the surface images were weakly anisotropic at higher surface roughness conditions. Lacunarity analysis using the gliding box algorithm is carried out to study the homogeneity nature of the SLM texture images. The surface images showed lower lacunarity values at the process parameters conditions where the surface roughness values are high. This indicates the texture is less heterogeneous (improved homogeneity) at higher roughness conditions (high laser power, low scanning speed, and low hatch distance). The reason behind the weaker anisotropic nature and improved homogenous nature of surface images at higher roughness conditions of SLM parts is due to the patterned reflection of brighter pixel intensity by the surfaces caused by the presence of a large number of un-melted and partially melted particles sticking on the surfaces. The distribution of such powder particles was clearly visualized with the help of SEM micrographs of surfaces. The study results presented can be used for the development of a low-cost quick surface monitoring system for Ti-6Al-4V SLM parts. The use of fractals is indisputable, however, the computation of fractal dimension present elusive challenges. In the present study, the fractal dimension is computed using the Fourier transform method. However, no single method in the fractal dimension calculation is suitable for all cases. 23 Also, the parameters are showing a nonlinear variation in SLM process. Hence an extensive analysis in the same by increasing the range of the process parameters for getting deeper insights is much appreciated.
Footnotes
Acknowledgements
We would like to thank Wipro3D, Bengaluru, India, for their support by providing their SLM facility for part printing.
Declaration of conflicting interests
The author(s) declared no potential conflicts of interest with respect to the research, authorship, and/or publication of this article.
Funding
The author(s) received no financial support for the research, authorship, and/or publication of this article.