
Abstract
Productivity in micro-milling is hindered by premature fracture of tools and difficulty predicting wear. This work builds upon previous investigations into tool wear mechanisms and coatings for micro-mills.The technology readiness level of this work exceeds previous studies by investigating the micro-mills for practical applications and comparing this data. 0.5 mm micro end mills are tested with different coatings on CuZn38, and wear curves produced both in the case of simple straight slot testing and milling of complex parts representing industrial applications. The results show that curves produced using straight slots can be used to predict the behaviour of tools used to machine industrial parts. Due to interrupted cutting, tools used in straight slot tests reach the end of steady state wear after approximately 12 s of cutting as compared with 170 s in continuous milling. Typical cutting forces seen for the tools are in the order of 2–4 N. Catastrophic failure is seen towards the end of tool life for a TiAlN tool with a cutting force of over 30 N seen. For the first time a comparison has been made between fundamental tool wear studies and tool wear observed when producing test pieces representative to micro-industrial parts. This presents a novel perspective on tool wear and facilitates the integrating of existing micro-milling research into industry
Introduction
Micro-milling is a viable method for producing high-precision parts, particularly those with high aspect ratios and complex geometry. It is used from low volume to mass production in a number of industries, including aerospace, medical, dentistry, optics, electronics and micro-mechanical systems. 1 Applications of particular note include electrodes to produce cutting inserts; miniature hydraulic parts for aerospace instrumentation systems; and mould tooling for biotechnology components (e.g. electrophoresis devices for DNA, RNA and protein analysis). Due to their small size, micro-tools wear quickly and unpredictably compared to macro-scale tools, resulting in excessive tool changes and reduced productivity. Research into tool wear of such tools is therefore crucial. However, this research must have the potential to be applied to industry to have value.
In the context of this work, micro-machining can be defined as the use of mechanical tools which have geometrically defined cutting edges, to manufacture features which have dimensions in the order of micrometres
(i) Cutting edge radius is limited by chip thickness in the sense that uncut chip thickness cannot be less than the radius of the cutting edge of the tool 3 or it significantly increases the ratio of cutting force to thrust force. 4
(ii) Geometrical features which are dependent on very precise tolerances may not tolerate an edge radius that is large compared with the overall size of the tool.
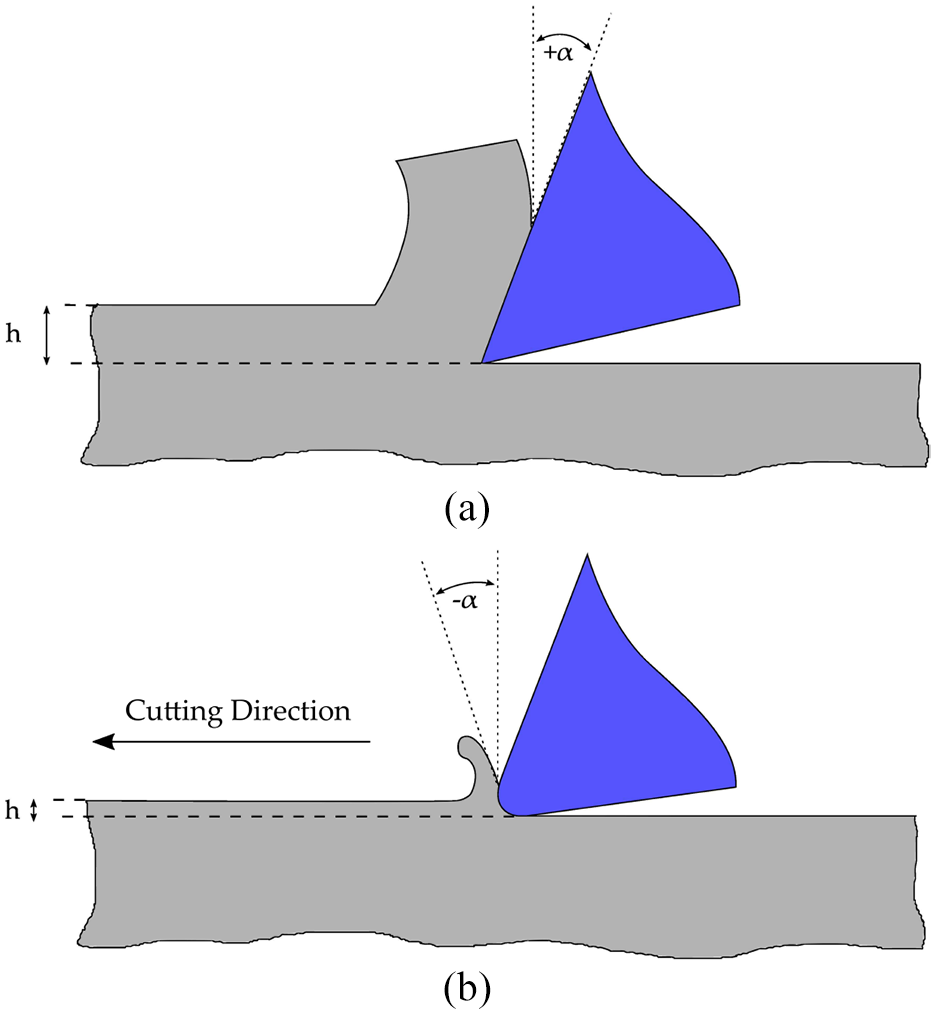
Depiction of shearing and burning respectively for (a) a sharp tool and (b) a tool with cutting edge radius introduced.
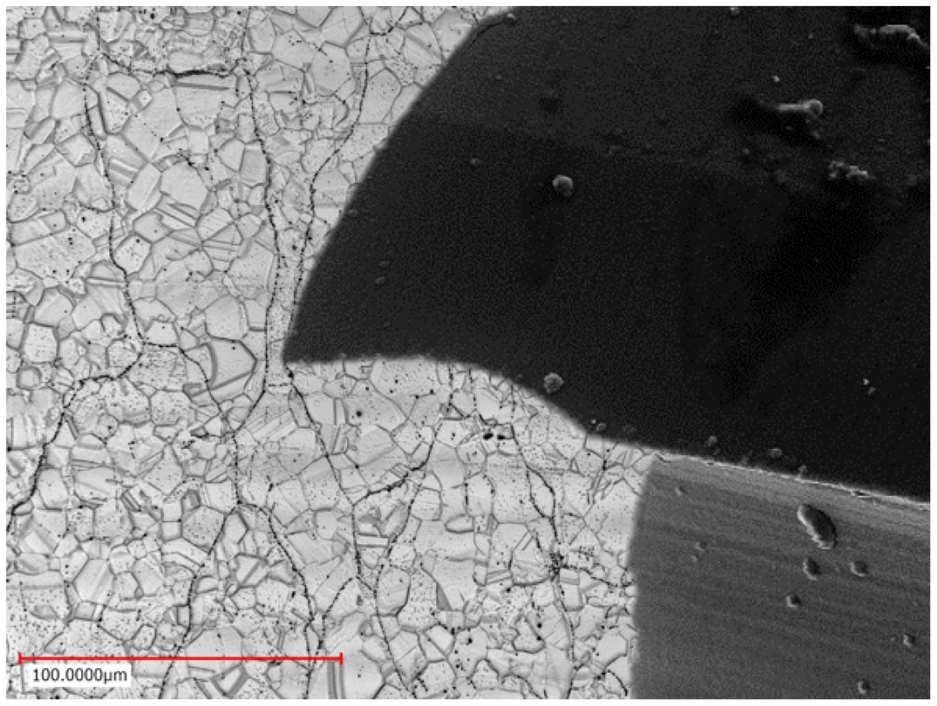
Grains appear relatively large in comparison to tool size.
The size effect leads to challenges in measuring tools and predicting wear behaviour, which combined with the relative novelty of micro tools when compared to macro-milling tools hinders research in the field. 5
Fundamental studies and transfer into industry
There have been many successful studies into the micro-milling process in literature with the view to characterising the process. However, they and the studies that have taken place in this work typically focus on straight slot cuts6–10 and shoulder milling. 11 Sometimes, the type of cut used (slot or shoulder) is not reported in the work.12,13 On the other hand, in industry it is typical to develop processes iteratively using trial-and-error.14–16 There is a tremendous scope for fundamental research in machining to be applied to industrial contexts to improve process efficiency. NASA originally defined Technology Readiness Levels (TRLs) as a method of assessing the maturity of a technology. 17 TRLs relate to the maturity of the process in terms of applying it to industry. They range from TRL 1; which describe a technology in it’s infancy; through intermediate TRLs (conceptualisation, laboratory validation, real world application 18 ); and finally to the higher TRLs 7-9 (system completion and ‘proof of flight’). These have been adapted for various situations including manufacturing. 19 They can be applied to micro-milling as follows:
It is typical in an academic environment to carry out research up to TRL 3 or 4. Meanwhile, TRLs 8 and 9 are most common in industry, with TRL 7 where industrial R&D takes place. Commonly, it is difficult to implement low-level research in the realistic environments, while many industrial set-ups have limited R&D. The result is that often, the middle levels are not fulfilled and the academic research does not get implemented in industry. 20 This is commonly referred to as a research gap (Figure 3).
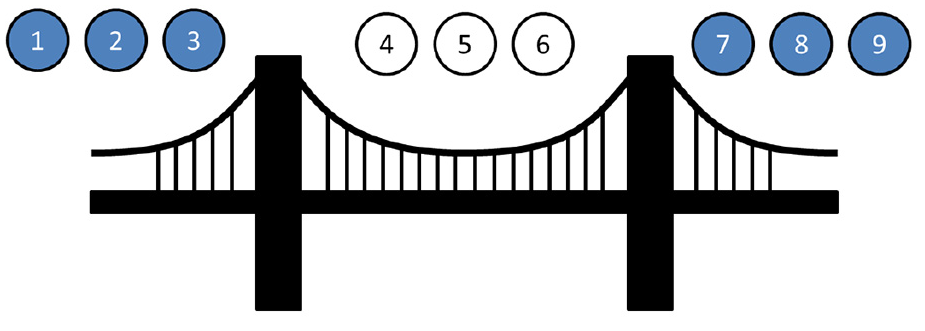
Commonly the mid-level TRLs are missing. Catapult centres help to bridge this gap.
The first step to bridging this gap is to validate whether results from the more fundamental research (for example, straight slots or single shoulder cuts) apply to more complex situations.
The higher the TRL level, the more certainty as to the applicability and success of the process there is. The work carried out herein represents TRL 4: the process has moved towards industrial levels of complexity but is not being used for production. In the context of this work, this means the measurement of tool wear and determination of coatings performance has been applied to semi-realistic situations. In this case, that is useful since Kyocera are not looking to produce the parts themselves, and so representative features give a broad overview of what their customers, the end users, will use the tools for. The purpose of initial tests, which included longer machining times, is to simulate the industrial machining environment more realistically since tools of this size are typically used to machine for minutes rather than seconds.
Tool wear measurement on and off-line
On-line and continuous tool wear techniques measure significant parameters throughout the cutting process. Off-line methods measure these parameters during intervals, often by removing the tools from the system. 21 Tool wear measurement both on and off-line have different benefits. On-line tool wear measurement allows tool-change policies to be determined, adaptive machining control, and removes the errors caused by tool removal. 22 On-line measurement uses techniques such as optical methods, 23 force measurement24,25 and acoustic measurements. 26 Off-line measurement, on the other hand, allows more complex imaging techniques such as scanning electron microscopy to be used.
On the micro scale, optical imaging is much more challenging due to the small scale. Force measurement is used,7,27,28 but this lacks the resolution in terms of wear over tool life that optical imaging offers. Acoustic emissions have also been used successfully to identify tool breakage, 28 and the ability to map force and acoustic signals is desirable but has not yet taken place. 1 As a result, optical measurement of micro-milling tools takes place off-line. Typically, the methods used and the orientations measured are hugely variable. This has lead to the development of a tool wear measurement protocol. 29 The aim of this was to standardise the way micro milling tools are measured, in the way that they are on a larger scale. Since micro-milling standards are not appropriate for micro-machining, 7 this was required before significant research could take place and provides the field with an opportunity to make comparisons between results, tools and across materials.
The importance of combining force modelling and measurement with tool wear measurement
As previously discussed, force measurement both on and off-line provide essential insight into the behaviour of all tools and is especially important in the context of micro-tools where the cutting tools experience different physical phenomena due to the size effect. 30 Cutting force modelling presents opportunities for prediction not only of tool wear but also ultimately the failure mechanisms. 31 Do to the challenging nature of modelling complex micro-milling processes, 32 it is useful to combine such modelling with experimental work in order to best predict tool behaviour. Modelling is also extremely valuable in the context of expensive and novel tooling materials such as cermets - and geometries - to provide initial understanding of potential capabilities. 33 Increasingly sophisticated force models are able to take into account cutting modes such as ploughing, a common issue in micro-milling caused by the size effect. 34 These models pave the way in fully understanding the micro-milling process, and can be used to intelligently design experimental studies. Such collaborative work has lead to the development of theoretical uncut chip thicknesses for various aerosplace alloys. 35 Significantly, when considering the complex combined effects of termperature and cutting forces, Sahoo et al. established a prediced ratio of chip thickness to tool edge radius of 0.25–0.33. 36 This work was able to inform a study by Aslantas et al. who concluded that the ratio of minimum chip thickness to edge radius was in the region of 0.3 for two aerospace alloys. 37 This convergence of computational and experimental research will accelerate the progress of the field, and though force modelling does not inform this study, it’s significance cannot be ignored.
Purpose of work
It is known that in macro-milling, wear curves for straight-cut slots do not necessarily map well to those for more complex paths. For example, different types of offset cutting paths can yield extremely different tool wear curves in terms of the shape of the curve and the relative length of steady state region. 38 Indeed, the tool path influences factors such as thermal loading and thermal shocks, which accelerates tool wear, 39 resulting in brittle failure. 40
This is due to a much higher variation in cutting forces seen on the macro scale. In addition, because macro-mills have a relatively large cutting tooth relative to workpiece grain size, individual grain boundaries do not contribute significantly to mechanical shock loading in the way that they do on the micro-scale. Thus, interrupted tool paths are the primary cause of significant impact wear, and can be avoided by properly selecting cutting conditions, entry and exit angles and tool path. 41 This is standard practise in macro-milling, and as a result straight-slot cutting measurements are not that representative of realistic cutting scenarios.
The size effect for smaller tools means that cutting forces are inherently more volatile even when cutting paths are optimised and therefore it is harder to completely negate these with sympathetic tool paths. 42 Therefore, it is suggested here that it may be more useful to map between straight slots and curved geometries on the micro scale than it is on the macro scale since the tool wear is inherently more unstable (unpredictable) due to the size effect.
On the micro-scale, it has been seen that the cutting force variation increases with tool wear. 43 This can be explained by the fact that relatively small defects in the cutting edge have a more significant affect on cutting forces when tools are small compared to workpiece grain size. The result of this is that tool wear becomes even more unpredictable towards the end of tool life, and also makes wear hard to study towards the end of the tool life. Thus, the tool wear curves are only of real interest up to the end of the steady state region.
The purpose of this work is to establish the applicability of tool wear curves that are produced during straight slots in micro-machining, to an industrial context. Testpieces with characteristic features seen in micro-machining were used. This will allow optimisation of design factors of micro-end mills with a view to maximising productivity in the micro-milling process. Existing literature has investigated primarily straight slots or shoulder cuts in milling,6–13 due to the described difficulties in measuring micro-tool wear. While this has been important for fundamental investigations, there is a need to increase the technology readiness level of existing wear studies so that the results can be applied directly to industry.
The authors present, for the first time, a comparison between fundamental tool wear studies and tool wear observed when producing testpieces representative to micro-industrial parts. This presents a novel perspective on tool wear and facilitates the integrating of existing micro-milling research into industry. This has been achieved by the following:
Machining trials whereby tool wear has been observed for micro tools when machining custom-designed testpieces with features such as micro channels and matrices for miniature pump systems.
Generation of wear curves using regular off-line observation and direct comparison with wear curves obtained in previous machining of straight slots.
This will establish whether simple straight cut slot tests can be used to evaluate the suitability of tools for different applications, in lieu of using production operations or pseudo-production runs. This is important because such tests can be carried out quickly with minimal tool and material waste. There have not been previous studies on the relationship between straight cut tool wear tests and evaluation of tool wear with more complex cutting and realistic feed and speed rates: indeed, there is little work on complex tool paths in micro-milling in general. 44 The work carried out herein will allow the applicability of these studies to industrial applications for the first time, vastly enhancing the value of both existing and future studies, and resulting in:
(i) Reduced tool wear and higher part accuracy, leading to increased ‘right-first-time’ rates for customers.
(ii) Increased productivity of the micro-milling process.
The outcome of this work, and the tool wear investigations carried out previously, is to provide tooling manufacturers with the insight to select the optimum coatings to apply to micro-tools. This has reduced machining costs and advanced the micro-tool market.
Experimental methods
Trials were designed to replicate previous trials that had been carried out using straight cuts, replacing these with a specially designed workpiece with a variety of test cuts which occur commonly in industry, including micro channels, bosses and a matrix of bosses and pockets. The same measurement protocol as that used for straight cut slots was used to ensure that results could reasonably be compared. This is detailed in the following protocol for tool wear measurement. 29
Measurement protocol used
The tool wear measurement protocol is described in brief in this section, although more detail can be found in protocol for tool wear measurement in micro-milling. 29 This protocol has been used because it allows the authors to compare the data from the geometrically complex tool paths with existing data on straight slots.
Definitions
The surface finish of the workpiece is is measured using
Measure of distance cut
Distance cut is measured using the sliding distance of the cutting edge. This is calculated using:
where
Tool and workpiece preparation
Tools are inspected prior to machining to ensure a minimum quality standard. Workpiece grain direction should be the same for each workpiece. Depth of cut and unit removal should meet the following requirements:
Edge radius
Edge radius
All workpieces should be faced off to ensure flatness perpendicular to the tool and fixed to the machine bed such that the surface is normal to the z-axis. Coolant method should be consistent across comparative studies: for example, the method of lubrication (flood, mist) and pressure/temperature/flow rate and coolant composition should be consistent where comparison between studies will take place.
Measurement of tool
Tools should be measured off-line both prior to testing and during testing. The basic equipment required for testing is as follows:
Scanning electron microscope (SEM) with both secondary and backscattered electron functionality.
3D non-contact profilometer (e.g. focus variation or white light interferometer).
Ultrasound bath.
Acetone.
A force cell for measuring lubricant pressure on workpiece.
Where measured, lubricant pressure should be established before a cutting force is applied. Tools should be removed and cleaned at a pre-determined interval for measurement using an SEM. Measurement orientations are shown in Figure 4.
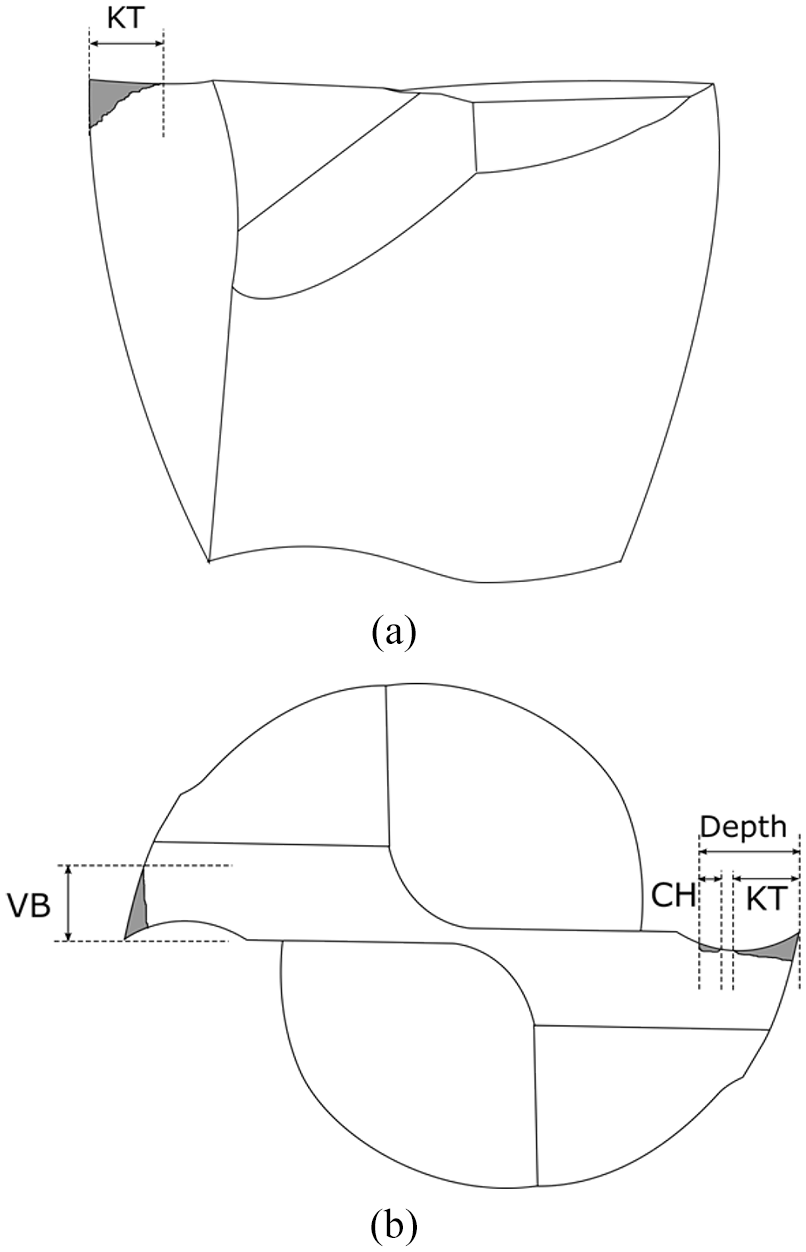
The two orientations in which tools were measured.
Criteria for tool life
Face wear of 0.2D should not be exceeded as this is considered catastrophic failure of the tool.
Test procedures
For wear testing, slots should be machined to a chosen depth. The slot should begin outside the workpiece and run in the y-direction of cut.
Measurement of forces
Optionally, force measurement can be measured for mapping to optical wear measurements.
Reporting of results
Wear be reported in absolute terms relative to the original size of the tool (in
Rapid initial wear.
Steady state wear.
Rapid wear before failure.
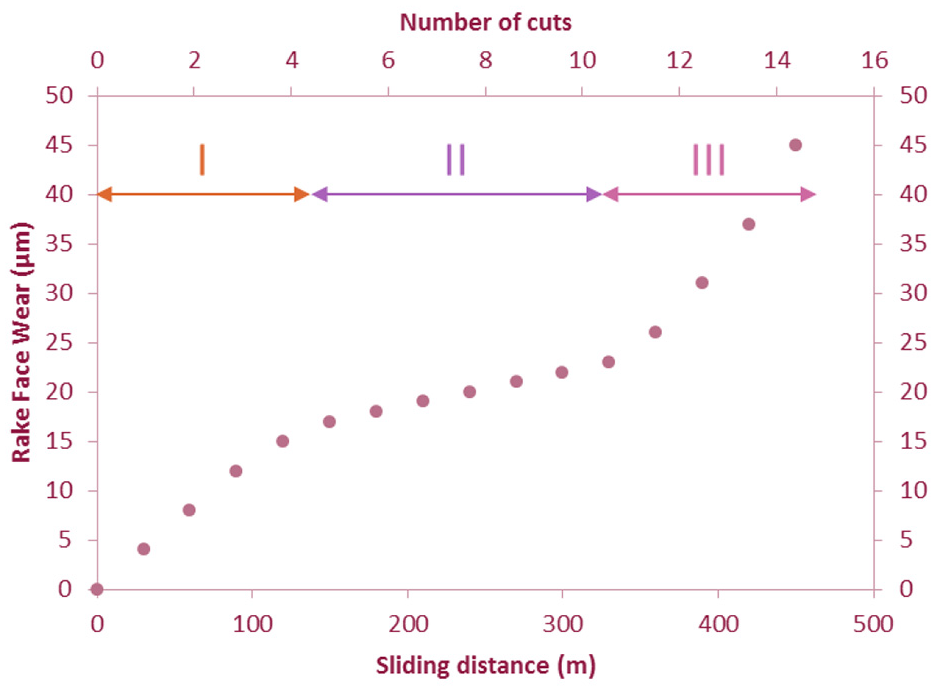
A typical tool wear curve.
The tool-life criterion can then be identified as the intersection between phases II and III. Depending on tool properties, wear curve shape can vary in such a way that the steady state region of wear is proportionally longer or shorter (6).
Machining and testing
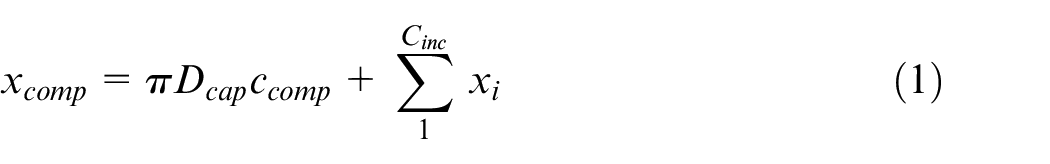
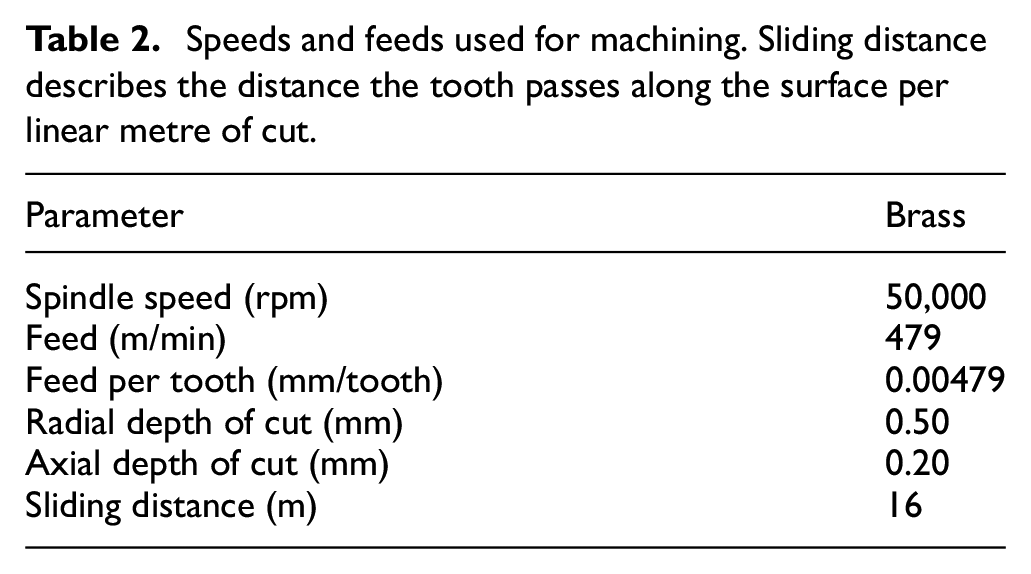
The trials took place on a KERN Evo micro-milling machine with a maximum spindle speed of 50,000 rpm. The tools used were 0.5 mm tungsten carbide end-mills provided by Kyocera-SGS. The recommended spindle speed for these mills is 100,000 rpm, and since the machine used has a maximum spindle speed of half this, the feed rate was reduced in accordance with equation (1) to achieve an appropriate feed per tooth, where

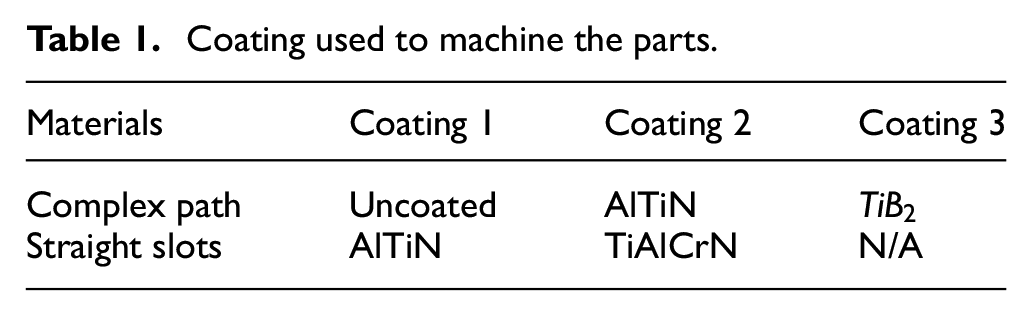
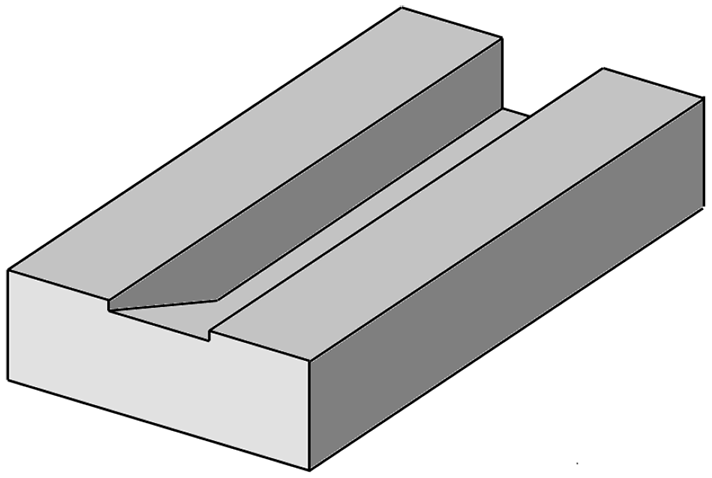
Brass (CuZn38) was chosen due to its easy machinability and wide application for small mechanical systems. Both straight cut slots and then geometrically complex paths were machined using up to three different coating 2. A standard test part designed to mimic features commonly encountered in the micro-mechanical, medical and chemical industries. This is detailed in Figure 6. Before machining with the micro-mills, the test-piece was machined using a 2 mm end mill to ensure flatness. Multiple depths of cuts used were used, as defined in Figure 7. Cutting speeds and feeds for used for each material are given in Table 2.
Coating used to machine the parts.
Speeds and feeds used for machining. Sliding distance describes the distance the tooth passes along the surface per linear metre of cut.
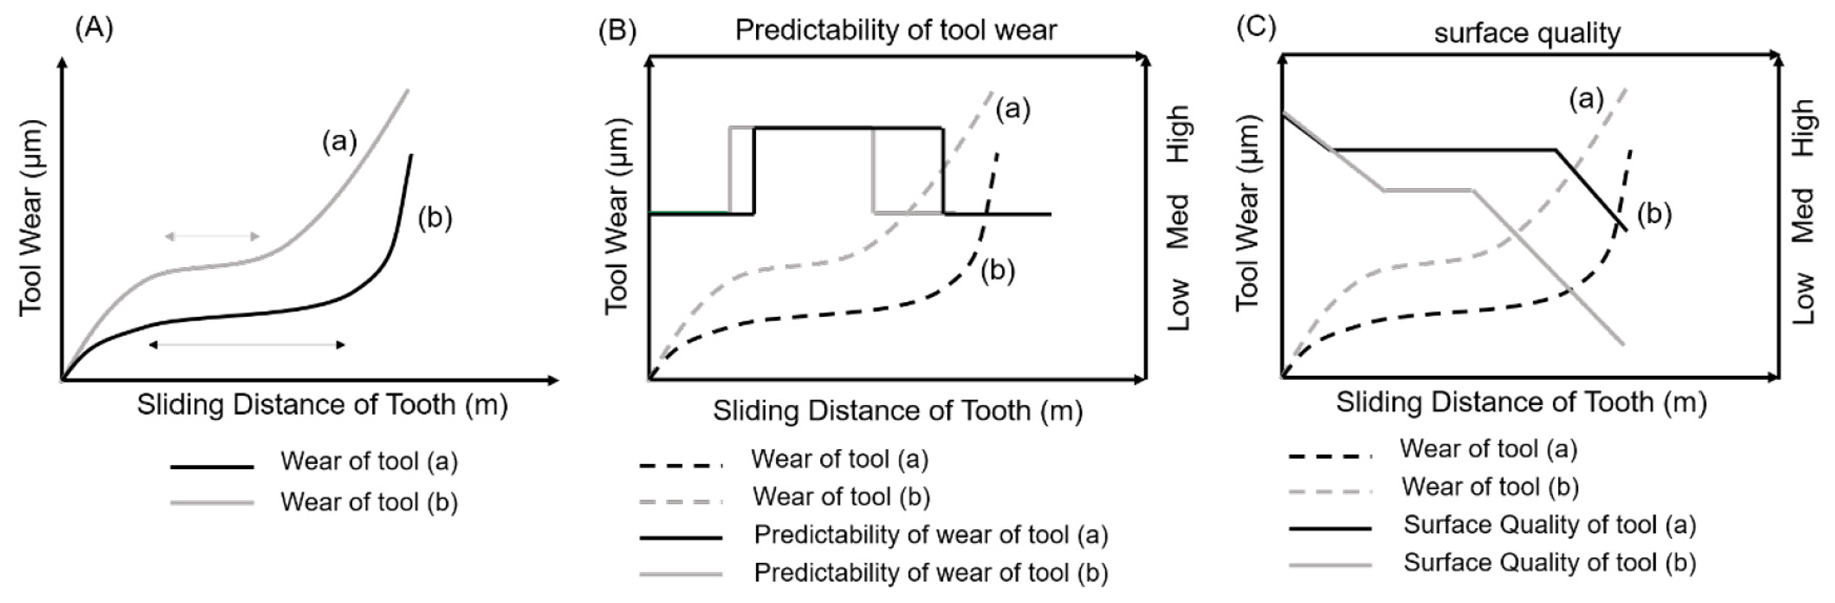
The predictability of the tool wear (6B) and length of time a higher surface quality is achieved (6C) is better for curve (b) seen in 6A than curve (a) which shows a shorter steady state wear region.
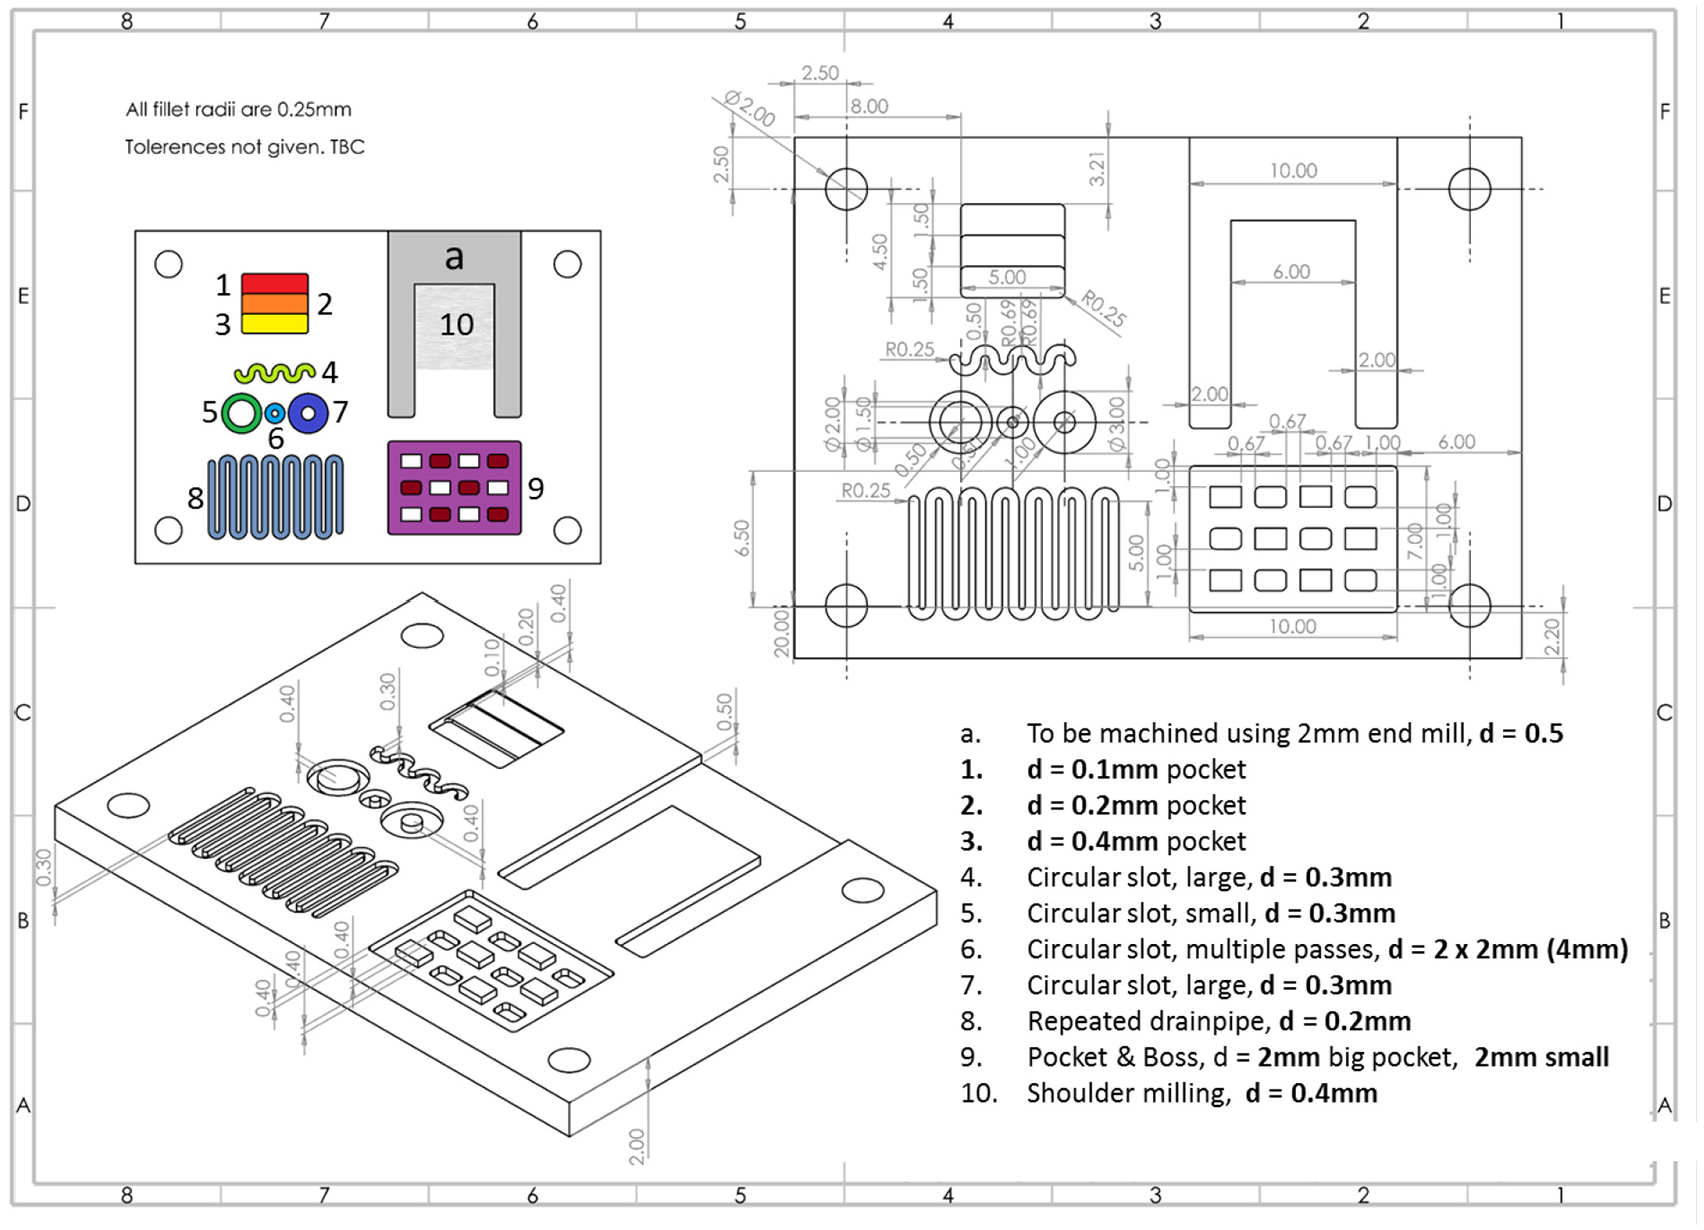
Depths to be cut for each feature.
Designed experiment
Initially, three brass (CuZn38) testpieces were machined. A single tool of each coating type was used for each, and machined to failure to give an idea of surface finish over the entire, uninterrupted tool life. This allowed machining intervals for the measured tools to be determined. Ongoing force testing took place for each of the testpieces.
Following this, two uncoated, two AlTiN and two
Forces were measured using a Kistler 9317c force cell, in the set-up seen in Figure 8. The workpiece was attached to the force cell such that workpieces could be replaced easily and to maximise available machining area (Figure 9).
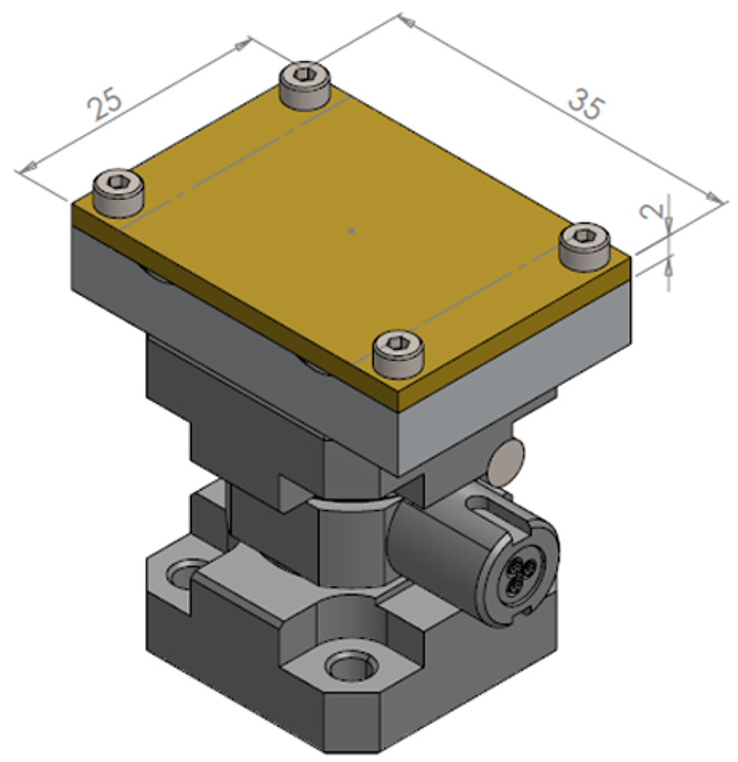
Workpiece mounted on force cell.
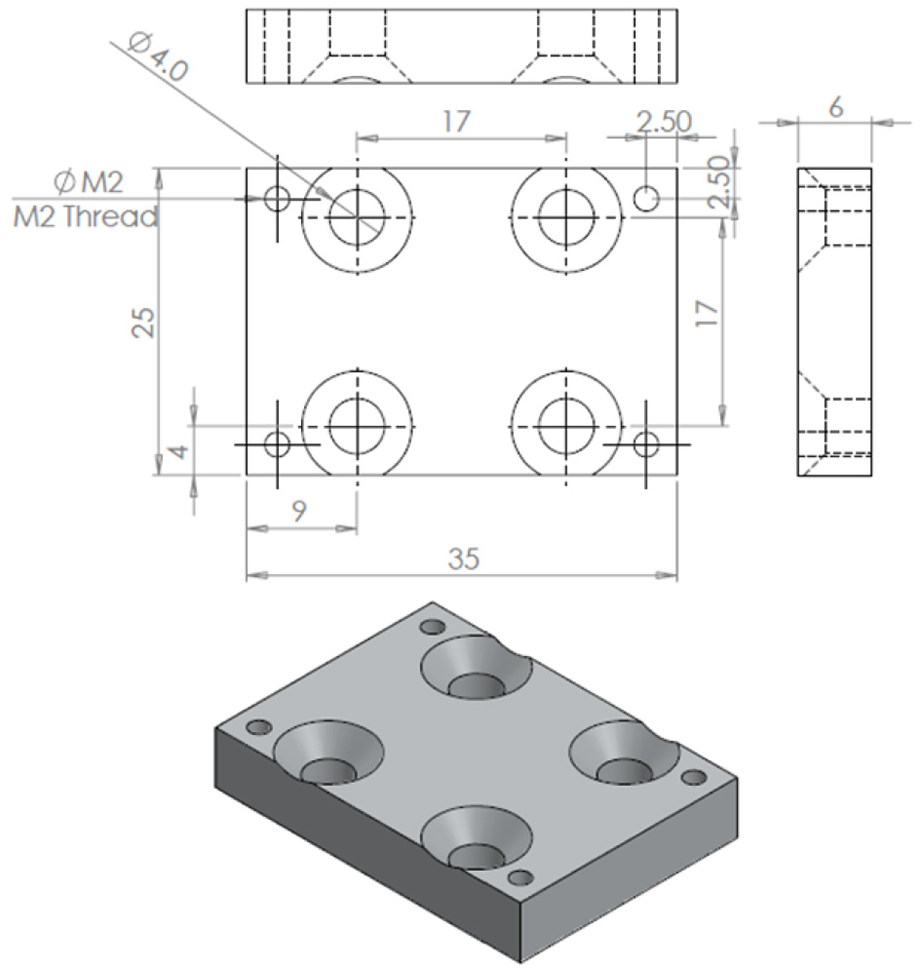
Test-piece to be machined.
Performance metrics
In the discussion, relative performance of tools is discussed. To do so, performance metrics are defined as follows:
(i) A tool which performs better reaches steady state at a lower level of absolute wear (in m)
(ii) A tool which performs better has a longer steady state region (i.e. linear region of the curve, region (II) in Figure 5)
The first is important since absolute wear determines geometrical accuracy and ultimately the higher absolute wear is, the higher the risk of tool fracture. The second is necessary since since absolute wear alone does not necessarily indicate tool life. Furthermore, the steady state region since this region represents the operating region where tool wear is predictable (and hence can be adjusted for). The ability to adjust tool paths in this region allows manufacturers to maintain high part accuracy and reduces scrapping, the need to finish or re-machine parts, and costs.
Results and discussion
Tool wear
For each of the sets of tools, tool wear curves were constructed. This fulfils two purposes:
(i) To verify that the construction of a tool wear curve for micro-end-mills results in the classic tool wear curve as for straight cuts.
(ii) To compare the length of tool life between straight line cuts and geometrically more complex cuts uncoated and AlTiN-coated tools.
Wear curve behaviour of micro-milling tools in practical applications as compared with straight cuts
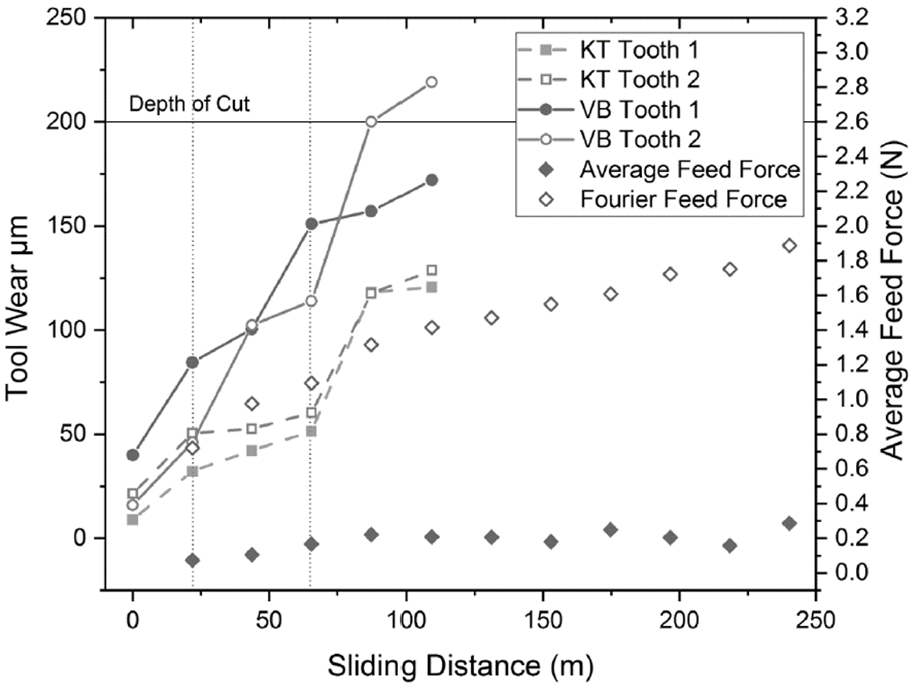
Due to dramatically different measurements between BSE and SE images for the teeth of the AlTiN coated tools, it was determined that uncertainty in the data was such that no useful conclusions could be drawn although there was suggestion of a wear curve for individual teeth (Figure 10). This uncertainty is derived from difficulty in measuring the tools and ensuring their exact position in and SEM, and is evaluated by comparing data from multiple images. Repeated measurements from uncoated and
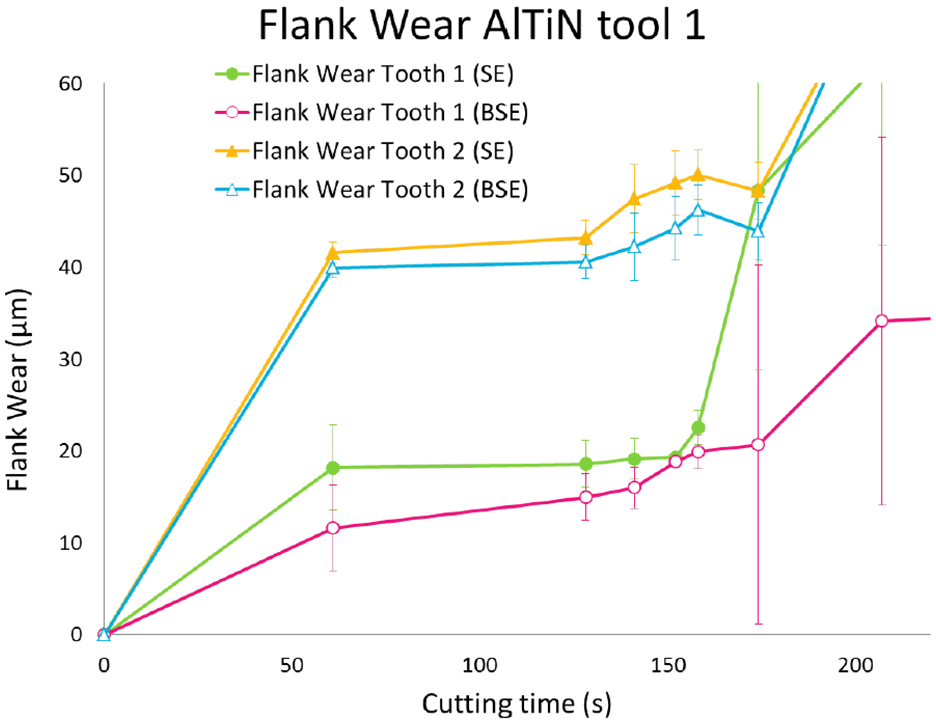
Suggested wear curve from raw data.
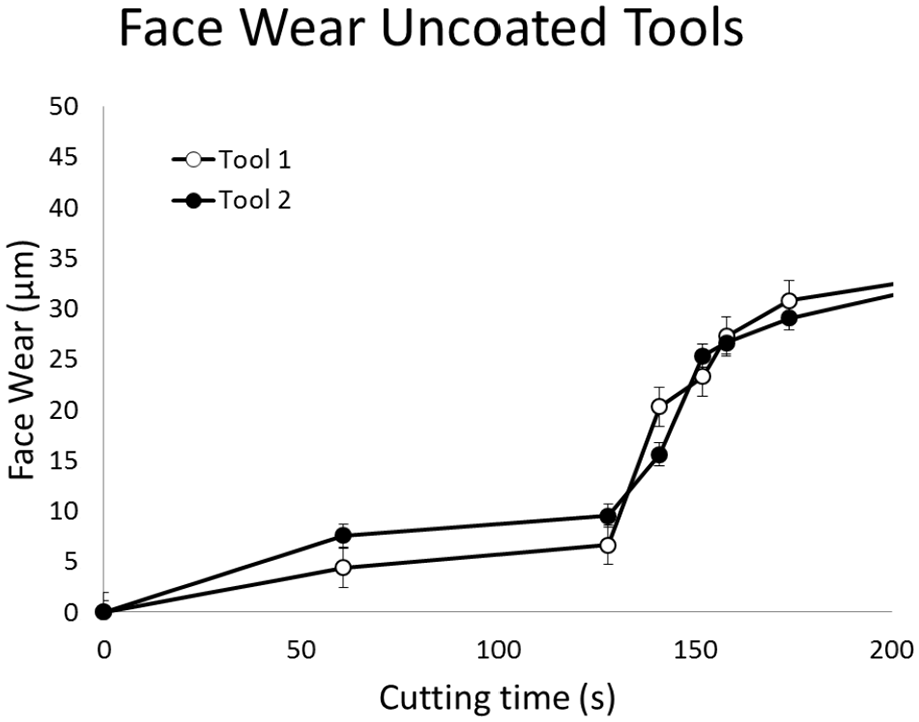
Face wear for uncoated tools used to machine realistic features.
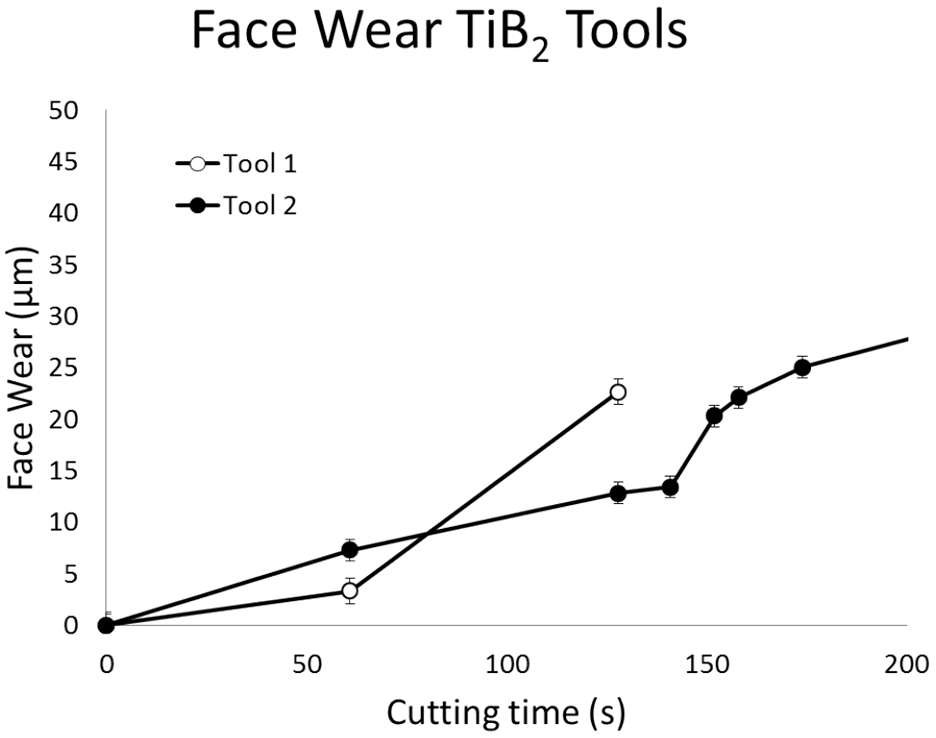
Face wear for
The face wear for both uncoated and
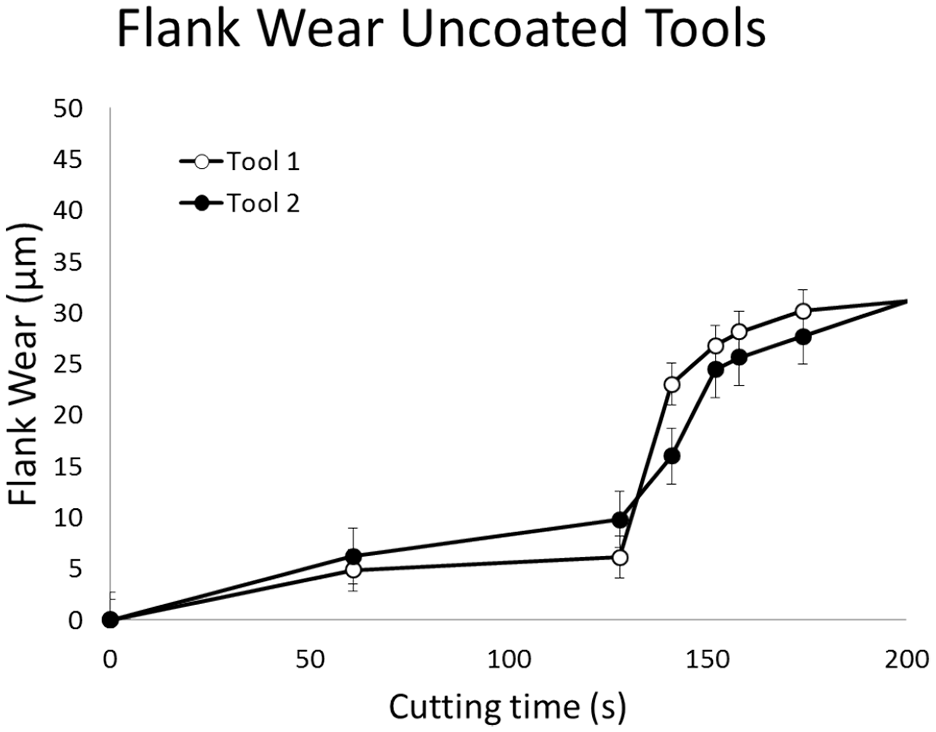
Flank wear for uncoated tools used to machine realistic features.
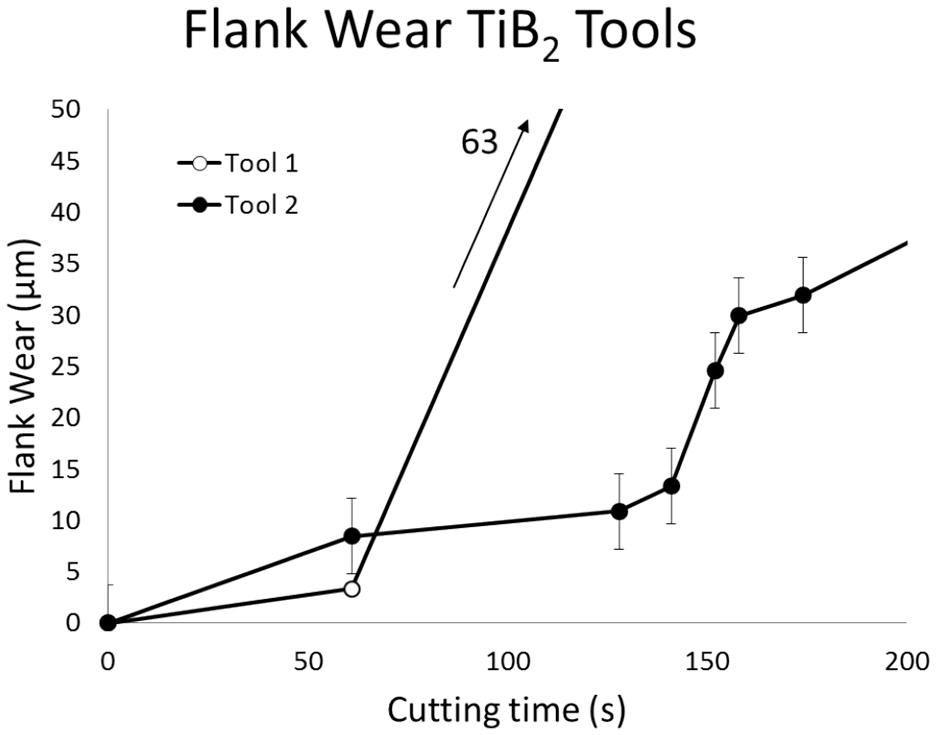
Flank wear for
Comparing lifetime of different coatings in both the straight slot an geometrically complex cases
The overall tool lives measured for tools used to machine straight slots were much shorter. This raises an important issue when measuring micro-milling: the small size of the tools means that measurement has significance for tool wear. Because the tools are so small, run-out has a large impact on cutting forces on the teeth. There is also an experimental issue: abrupt, interrupted cuts such as straight lines exert extreme forces at the start of the slot which wears the tools faster than a longer, continuous tool path would. 45 This is due to mechanical shock applied to the teeth at the start of cuts.
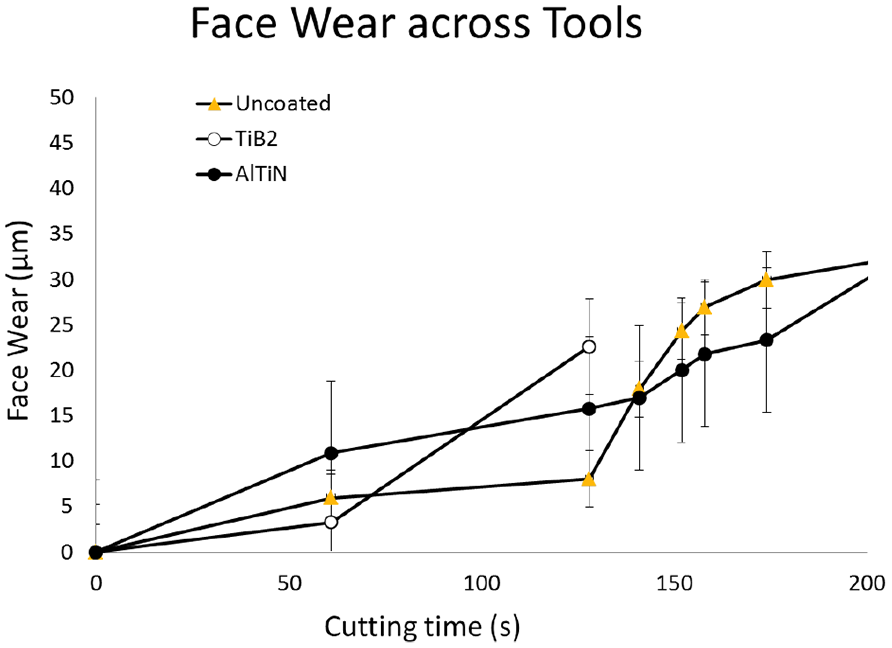
It is also important to note that since only two tools for each coating were measured, it is not possible to draw statistically significant conclusions between the two studies, and between different coatings in this study. Difficult measuring conditions results in high uncertainty, especially for the AlTiN tools. However, it can be seen from the results in both studies that some information can be drawn from the results. Figure 15 shows the face wear for three different types of tool: one uncoated, one
Face wear for different coatings; tools used to machine realistic features.
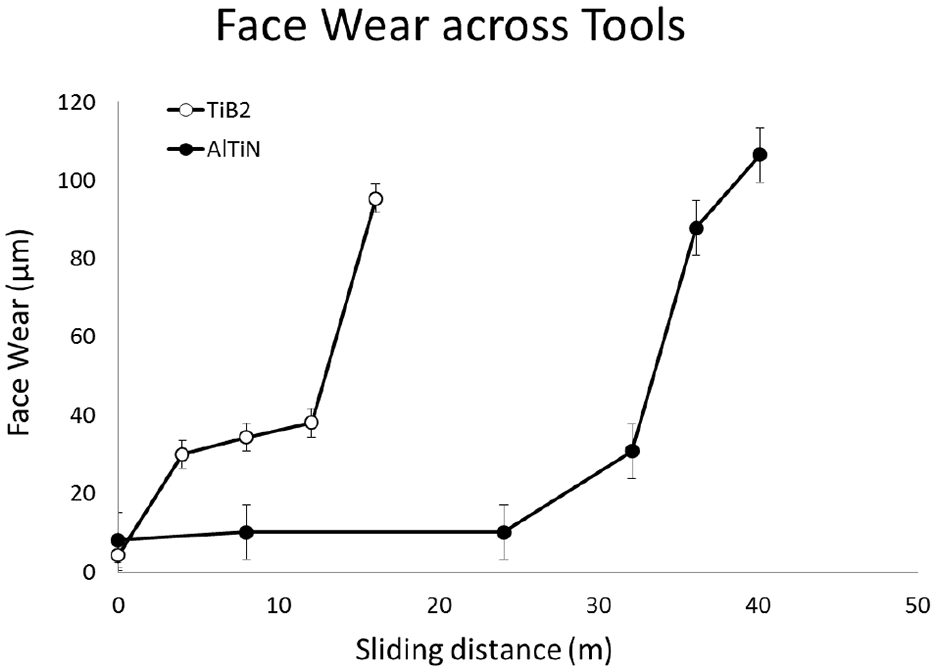
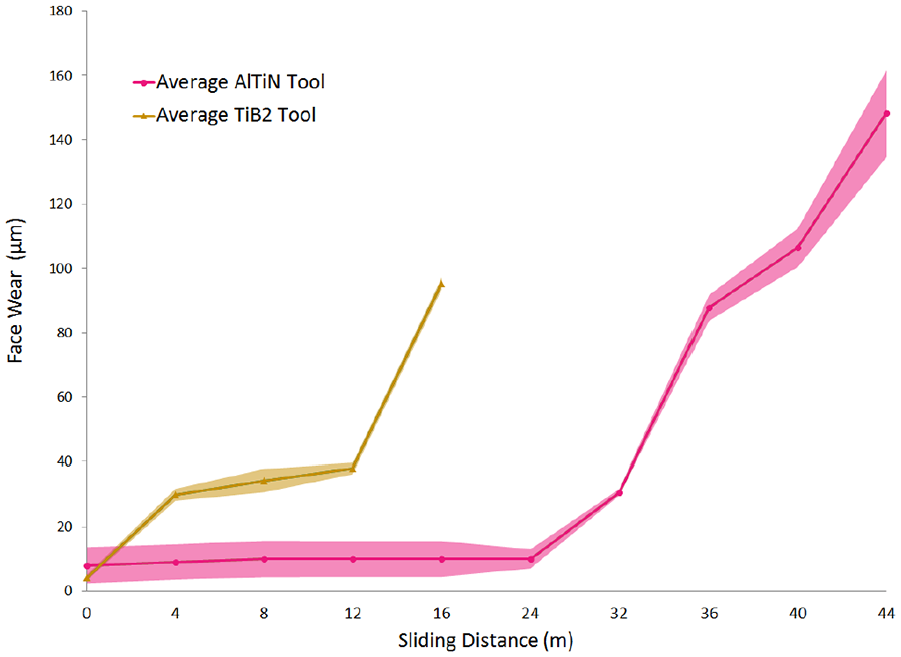
Face wear for different coatings; tools used to machine straight slots.
It should be noted that cutting time was used to measure the complex sample since sliding distance was unknown. Thus is can be seen that the tools used to machine more complex geometries actually lasted longer due to the shock loading to the tools applied at the start of each slot when milling straight slots. A comparison of face wear for realistic cuts and straight slots is given in Figures 15 and 16. Here, the results for the tools machining straight slots (Figure 16) can produce tool wear curves much more easily, although Figure 15 shows a good wear curve in the case of the uncoated tools. As for face wear, the fracture of the
This is also seen in Figure 16 where the AlTiN tool outperforms the
A second perspective can be seen in Figure 17. This time, the face wear within error bounds is shown. This demonstrates the relative size of the errors experienced in micro-mill wear measurement and highlights the fact that it is difficult to determine with certainty over large distances which tool performs better. The consequence of this is that errors, as described above, are significant, and that tool wear should be expected to be expedited where tools are regularly removed and measured. However, in both straight slot and realistic machining scenarios, the steady state of the AlTiN coated tools can be seen to be longer and run-in faster, which indicates better tool performance.
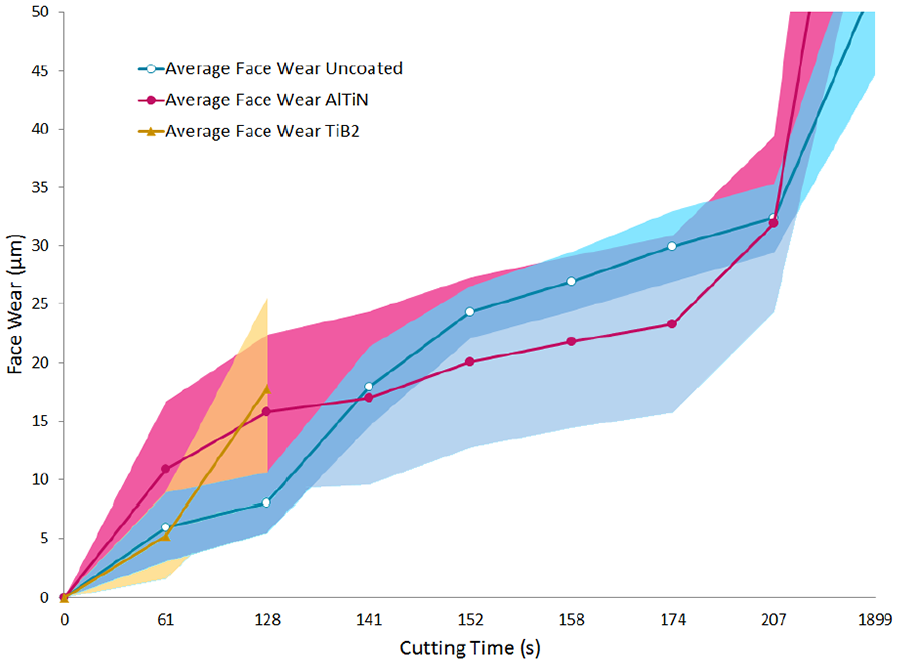
Face wear for different coatings; tools used to machine realistic features.
In the case of 17, the uncoated tool reaches steady state at a higher overall wear volume, and has an overall shorter steady state region suggesting that its wear is less predictable. For the straight slots, depicted in Figure 18 AlTiN is compared with
Face wear with shaded error bounds for different coatings; tools used to machine straight slots
At the extremes of the curve in 17 (beginning and end) it appears that the AlTiN tool is performing better (faster run-in and longer steady-state region than the uncoated tool. The
The early catastrophic tooth failure of the
Cutting forces
Cutting forces are especially important in terms of process variability, stablity of machining and process outcomes (surface finish, tolerences and speed of processing). 47 To illustrate the variation in cutting forces across the cuts, and therefore evaluate the expectation of variability in cutting forces (as would be seen in industrial applications), cutting forces measured for the wavy slot for each tool were measured. This work follows on from a body of work wherein the cutting forces for straight cut slots were analysed and measured, 29 and therefore passing consideration is given to cutting forces simply in terms of differing physical considerations for both straight cut and complex cuts. It should be noted, however, that cutting force modelling and analysis present a valuable next step in this work, as discussed in the Introduction and Conclusion sections.
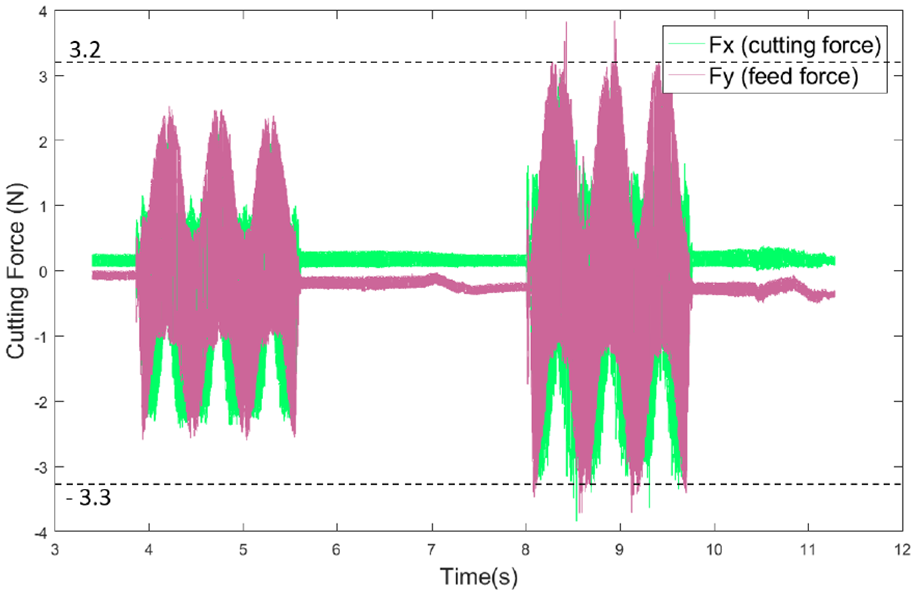
Figure 19 shows cutting forces for the AlTiN coated tools, while Figures 20 and 21 respectively show the cutting forces for
Cutting forces measured for waved slot machined using AlTiN coated tools.
Cutting forces measured for waved slot machined using
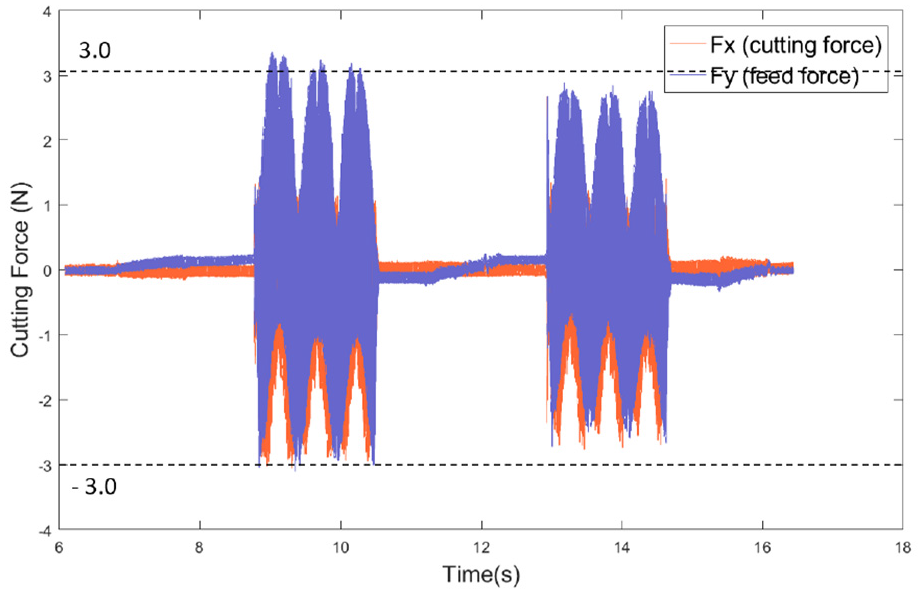
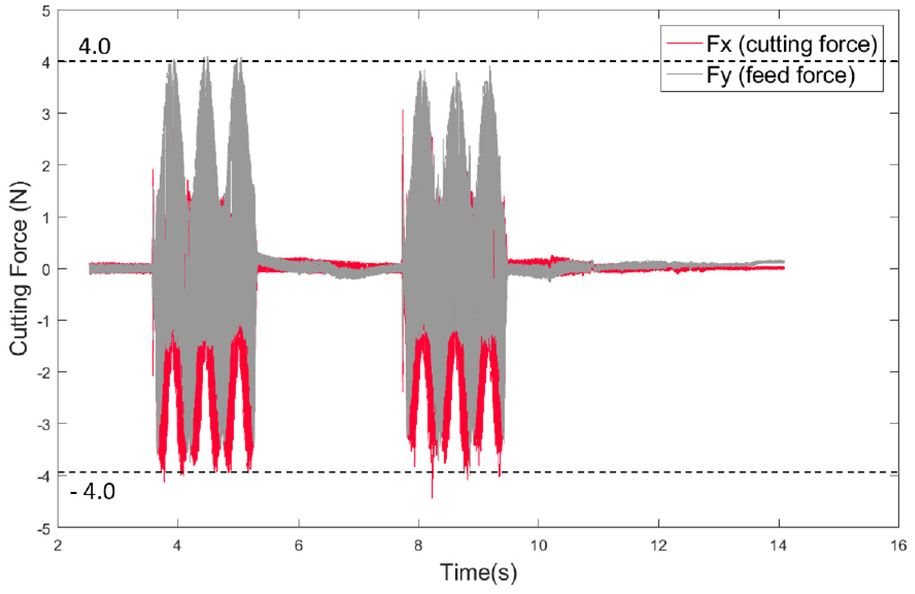
Cutting forces measured for waved slot machined using uncoated tools.
Previous work by the authors found that cutting forces increased linearly with tool wear (Figure 22), and this is important because it results in poor surface finish and increased burring. This is supported by the work carried out here, where increase in forces is seen as cutting distance increases. Here, increased cutting forces ultimately led to fracture of the tool.
In milling of straight slots with the same tools, increase of cutting forces with tool wear has previously been seen. Reproduced under creative commons license. 29
In micro-milling, cutting forces are particularly critical due to the propensity of the tools to fracture, 48 as was seen in this study. Because both the wear and cutting forces are difficult to measure, and the consequences of high cutting forces are severe, cutting force models have been instrumental in the prediction and enhancement of tool life and design. In comparison to macro-milling, modelling is complex due to relatively high ratio of chip thickness to cutting edge radius. 49 Successful models have taken into account tool run-out and workpiece elasticity as these are very important for small tools and small depths of cut, respectively 50 as well as thermo-mechanics and the dynamic response of small tools which are more susceptible to flexing than larger tools. 51 When combined, experimental trials and dynamic models allow micro-mill tool life to be maximised through intelligent design of both tools and machining parameters.
Figure 24 gives more insight into the mean, maximum and variance of cutting forces across the cut. Absolute values of cutting forces (magnitude) are taken. The highest mean force is experienced by the uncoated tools, as indeed is the highest peak force and variance. The instability of the cutting forces of this tool further supports the idea that wear for this tool is more rapid. The
Finally, the AlTiN shows the lowest mean force. This tool consistently outperforms the uncoated and
The similar force signatures across tool coating indicates that each tool experiences similar forces throughout its life.
Alteration to straight slot measurement technique
From the study of cutting forces arises the point of excessive stress upon the micro tools when machining straight slots as compared with realistic geometries, it is clear that straight slots are useful and provide a rapid result. However, the authors have observed that shock loading has a negative effect on producing characteristic tool wear curves. Based on this issue, it is suggested that the simple straight cut slots as used in the standard tool wear measurement protocol. 29 It is proposed that the straight slot testing should be modified to allow a more moderate entry and exit of the tool using an A more appropriate entry route as seen in Figure 23. This would reduce force variations and protect the tools from premature failure due to excessive impact forces.
Alternative path for straight-cut test slots
Alteration to straight slot measurement technique
From the study of cutting forces arises the point of excessive stress upon the micro tools when machining straight slots as compared with realistic geometries, it is clear that straight slots are useful and provide a rapid result. However, the authors have observed that shock loading has a negative effect on producing characteristic tool wear curves. Based on this issue, it is suggested that the simple straight cut slots as used in the standard tool wear measurement protocol. 29 It is proposed that the straight slot testing should be modified to allow a more moderate entry and exit of the tool using an appropriate entry route such as that given in 24. This would reduce force variations and protect the tools from premature failure due to excessive impact forces.
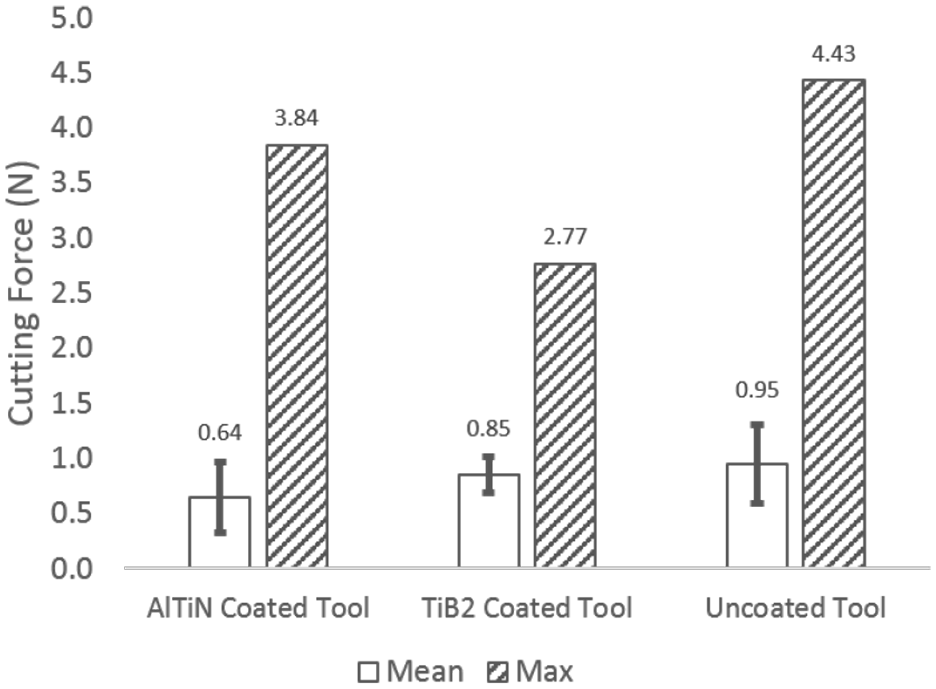
Mean and variance of cutting forces for tools.
Conclusion
The intention of this work was to determine whether simple straight cut slots could be used to produce representative analysis of tool wear that could be extrapolated to industrial environments. This would then allow results from existing and future wear studies to be used to help inform coating choices in industrial micro-milling applications. An issue with the data analysed is the high error bounds - this arises from limited data collection due to time constraints, and the more volatile wear of the micro tools as compared with macro tools - for example, susceptibility to fracture. Nevertheless, the following significant conclusions can be drawn from this work:
The face wear and flank wear for both uncoated and
Tool lives exhibited for straight line cuts can be related tool lives seen for more realistic cutting scenarios.
Measurement of the tools regularly influences the final result. The process of removing the tools subjects them to minor damage and wear, although this does not to be significant. More importantly, the tools cannot be returned to the exact condition - run out and length of tool not clamped - that they held initially, in spite of efforts to do so.
Thus, although increased tool life for different coatings should correlate between slot testing and realistic-scenario testing, the absolute tool life will not.
This data provides an interesting insight into the applicability of straight cut testing to a realistic environment. In-depth force analysis represents an important next step in reliable predicting tool life both in terms of accuracy and efficiency.
Industrial application
This work has applications for Kyocera-SGS, providing an insight into the way their tools wear which can be used to inform tool design. It builds upon the straight slot work and verifies that the micro-milling tools behave similarly in a realistic machining environment.
Footnotes
Appendix
Acknowledgements
The authors wish to acknowledge the contribution of tools from Kyocera-SGS.
Declaration of conflicting interests
The author(s) declared no potential conflicts of interest with respect to the research, authorship, and/or publication of this article.
Funding
The author(s) disclosed receipt of the following financial support for the research, authorship, and/or publication of this article: EPSRC (EP/L016257/1).