
Abstract
Metalworking fluids (MWFs) can greatly improve the machinability of materials and increase cutting tool life. There are a range of MWF products available on the market, however there are very few reliable low cost machining based fluid screening tests which can help select the most suitable candidate. This study developed a novel and rigorous single point milling (SPM) procedure carried out under controlled conditions, which would provide fluid performance differentiation for a range of typical aerospace alloys. The use of a single insert with a controlled geometry reduced machining variance and ensured performance repeatability. Tool life curves were used to determine optimum machining surface speeds for Inconel 718 (In718) of 80 m/min and Ti-6Al-4V (Ti64) of 160 m/min. Carrying out trials using five different cutting fluid products within a controlled tool life window clearly demonstrated that the SPM machining test was able to differentiate performance on both In718 and Ti64 material. Overall a 65% and 53% performance difference in tool life behaviour was observed between the best and worst performing fluids for In718 and Ti64, respectively.
Introduction
Metalworking can be divided into two general types of processes: metal deformation (such as forming or rolling) and metal removal (including grinding and cutting). 1 Metal removal is used for part production when there is a need for high dimensional accuracy and when more simplistic operations cannot achieve the required specifications or rate. The temperature and pressure conditions occurring in metal cutting are extreme, especially with modern difficult to machine materials like titanium alloy Ti-6Al-4V (Ti64), which lead to rapid tool wear and to deformation of the machined surface. 2 The technical and economic feasibility of these operations are constrained by tool wear. As wear increases, surface integrity and tool resilience decrease, dictating the operating speeds attainable whilst maintaining part quality.
In the late 19th century, Taylor demonstrated the practical value of using liquids to aid in metal cutting. 3 By flooding the cutting zone with a sufficient stream of water, cutting speeds could be increased by 30% to 40%. Water allowed an easier removal of chips and excess heat produced through the machining operation. However, although water is an excellent coolant due to its high availability and thermal capacity, 4 it was found that the corrosive nature of water and poor lubrication prevented use in many applications. 5 This issue was addressed by adding a small quantity of sodium carbonate to the water stream to create a solution, 6 so began the exploration into performance enhancing additives.
Modern day metalworking fluids (MWFs) contain various types of fluid and non-fluid materials used for the purpose of cooling, lubricating, swarf (chip) clearance and surface protection.1,7 MWFs are typically used to improve the machinability of materials, to improve the life and function of cutting tools, to improve the machined surface quality and to prevent corrosion of machine tools. Generally, MWFs consist of a base fluid and additive packages. MWFs are classified into the following categories according to ASTM D2881 1 :
Petroleum Oil-Containing Fluids: Emulsifiable Oil (frequently referred to as ‘Soluble Oil’); Semi-Synthetic Fluid; Straight Oil.
Synthetic Non-Petroleum Fluids: Solution Synthetic Fluid; Emulsion Synthetic Fluid; Straight Synthetic Oil.
Previous machining projects have indicated the importance and relevance of different additives regarding tool wear.8–10 The addition to MWFs of oil soluble extreme pressure (EP) additives such as phosphorous or sulphur as well as other novel additives can impact the tool life of end mills when machining Ti64. 3 Thus, it is important to be able to differentiate the impact of fluid additives on performance in machining operations, based on a robust test method which is transferable to industrial applications.
Simple machining tests which evaluate fluids by direct comparison are available to industry. 11 However current research into testing the performance of cutting fluids is often unique in methodology, with no single standard test, making it difficult for data comparison between studies. Considering the associated cost of these individual tests, quantifying the effectiveness of previously untested fluids is very expensive.12,13 Therefore there is a need for a simplified and cost effective screening test for use by industry.
On a lower complexity level, benchtop tribometers such as pin-on-disk, four ball and reciprocating wear tests are commonly used to assess the tribological performance of lubricants. 14 Measured frictional or tangential forces for a selected group of fluids allows fluid ranking to be determined. 15 They provide a controlled system to replicate the conditions found in larger systems, allowing for cheap testing with high repeatability. There have been many studies that use these methods to screen fluids for machining, however they stop short of replicating the extreme conditions and interactions found within metal cutting. 16
Previous work which discusses tool wear test methods in milling in terms of resource efficiency and experimental control is relatively rare. A simplified milling test method was previously used 17 to compare the machinability of multiple steels in terms of tool wear rates. The study concluded that running milling trials with a single insert was a suitable way to compare machinability between different cutting configurations, and that the cost of testing reduced when using a single insert. In ISO 8688-2, 18 thorough detail is provided regarding milling tool geometries, how to document the workpiece material and how to measure tool damage features. In the ISO 8688-2 Annex statistical calculations are provided to differentiate between cutting configurations in the presence of experimental uncertainty. The use of multi-toothed tools in ISO 8688-2 leads to runout, which is deemed acceptable at values up to 30 µm. Furthermore, none of the machining wear testing papers mentioned thus far discuss how to maintain the fluid consistency over the test duration, or how to deal with the avoidance of in-process vibration. The strategy for the tool’s entry into each cut, and how to check the geometrical condition of supply of cutting tools, are not specified.
The enhanced single point milling (SPM) method of this paper is a simplified laboratory style machining performance test, positioned in the gap between a tribometer type performance test and an end user application machining test. It is well suited to provide indication of the most promising options out of a group of in-development MWF packages. Moreover milling operations have been shown to be sensitive to the choice of coolant, 12 and milling accounts for a large proportion of all metal machining operations. The method is based on a single insert in a short, stiff milling tool holder and backend running at low depths of cut, hence the name single point milling. The SPM test consumes little material, requires only one cutting edge to monitor for wear, reduces the likelihood of chatter (excess vibration) during machining, and avoids any runout variations from tooth to tooth. 17 It is also key to note the inter-dependency of wear between teeth in a multi-tooth process – utilising a single tooth per tool reduces complexity. It removes the effect whereby wear on one tooth increases the loading on the subsequent tooth to enter the cut.
This study highlights the development of a novel and rigorous test procedure based on SPM, allowing new-to-market or newly-encountered fluids to be ranked and screened for performance. The aim is to define an enhanced testing methodology that would assess cutting fluid performance through tool wear in the machining of common aerospace alloys, these being Ti-6Al-4V (Ti64) and Inconel 718 (In718).
Experimental work
Trials configuration
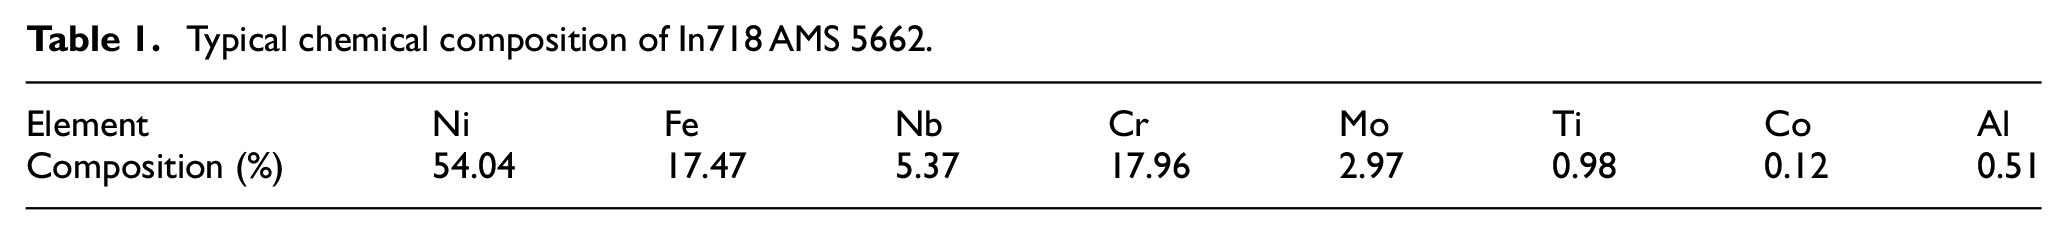
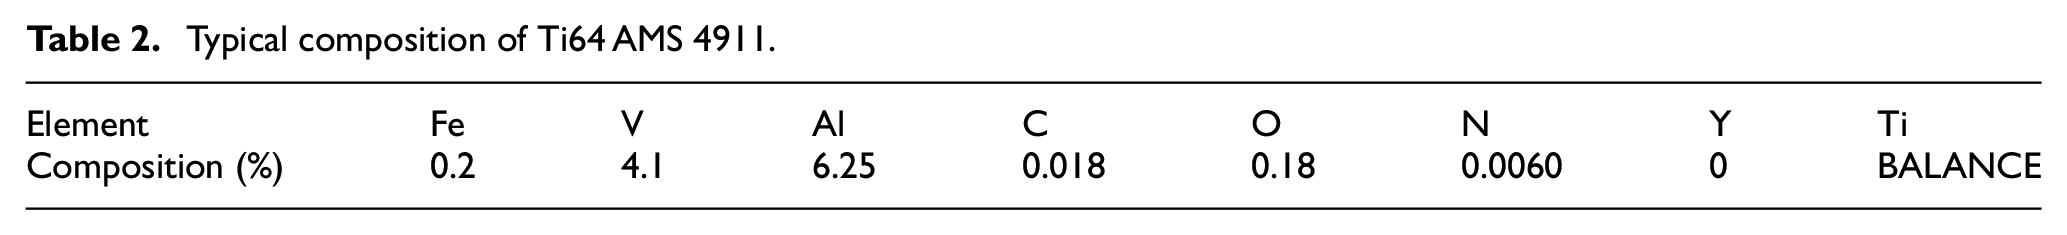
The two common aerospace alloys tested in this trial were Inconel 718 (In718) to aerospace specification AMS 5662 (solution annealed) and Ti-6Al-4V (Ti64) to AMS 4911 (mill annealed). The chemical compositions of the work materials are outlined in Tables 1 and 2. The materials were in block forms (Figure 1(a)): In718 at 165 × 175 × 57 mm and Ti64 230 × 230 × 100 mm.
Typical chemical composition of In718 AMS 5662.
Typical composition of Ti64 AMS 4911.
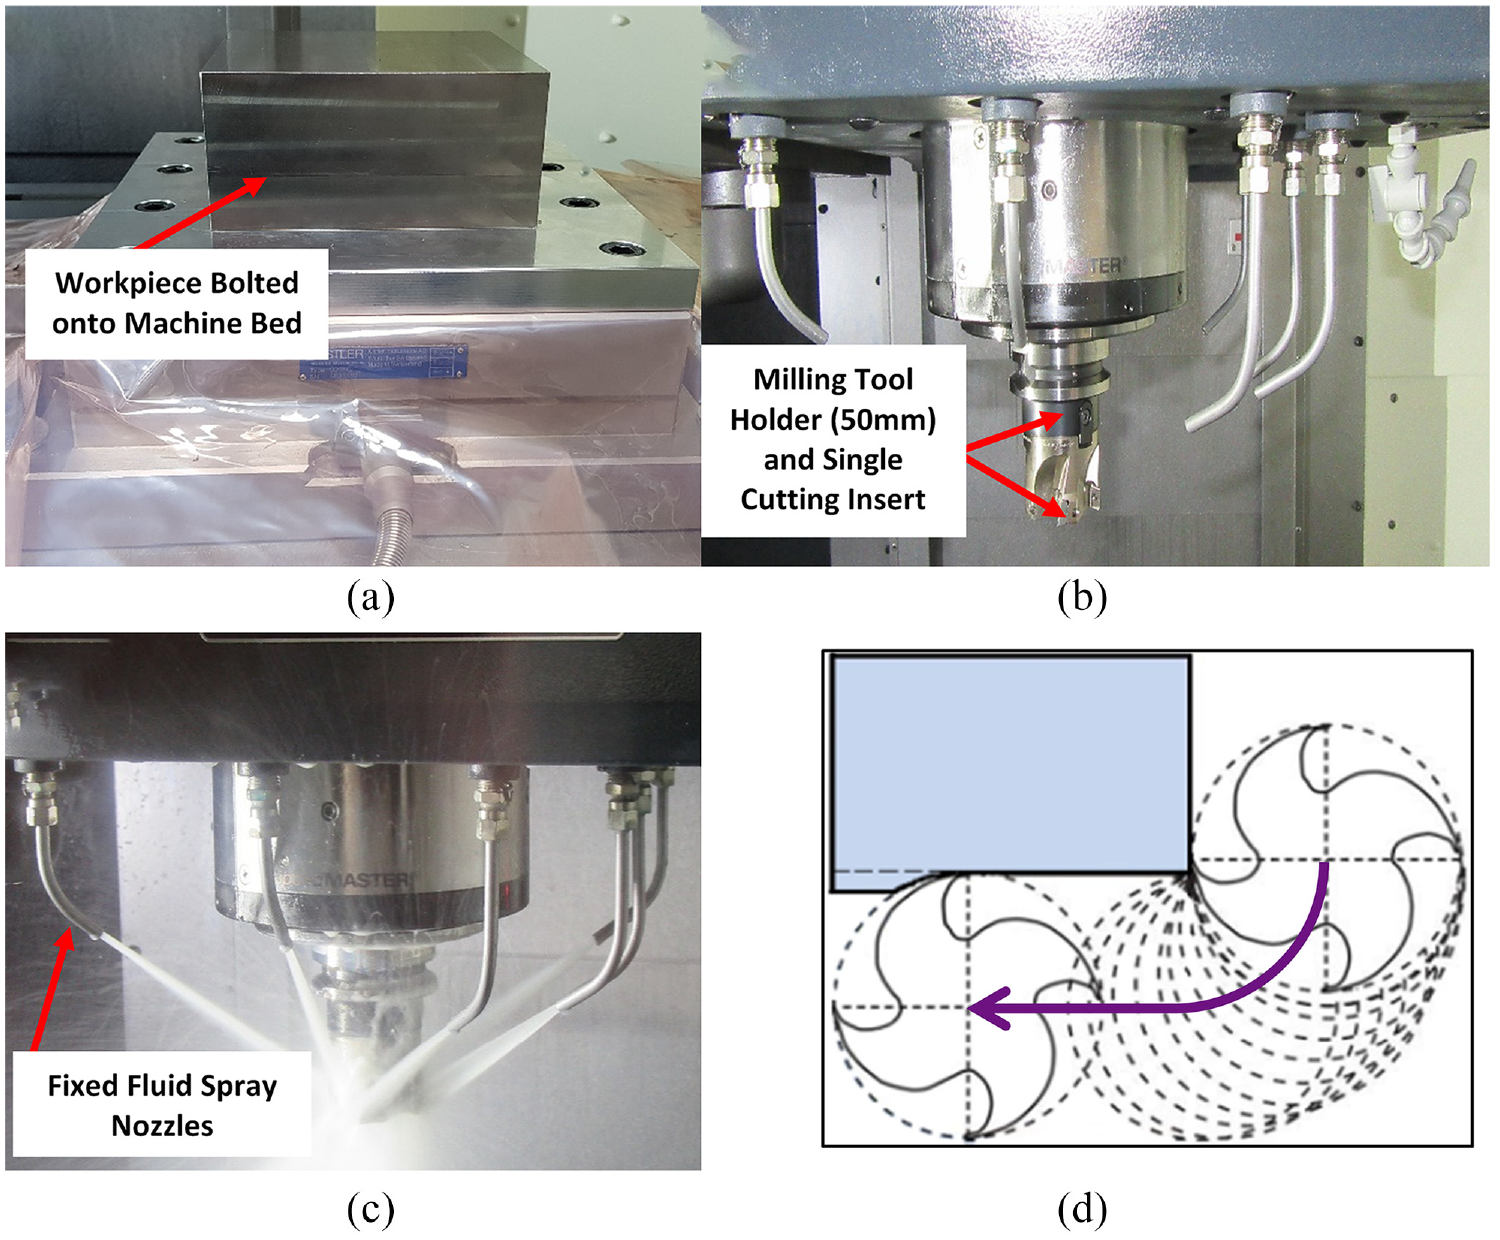
Experimental set-up of the DMG Mori-Seiki NV5000 α1: (a) workpiece set-up on machine bed, (b) tool holder and cutting insert set-up in the machine spindle, (c) external flooding of cutting insert during machining using nozzles and (d) schematic illustration of tool path on entry and cutter position when machining.
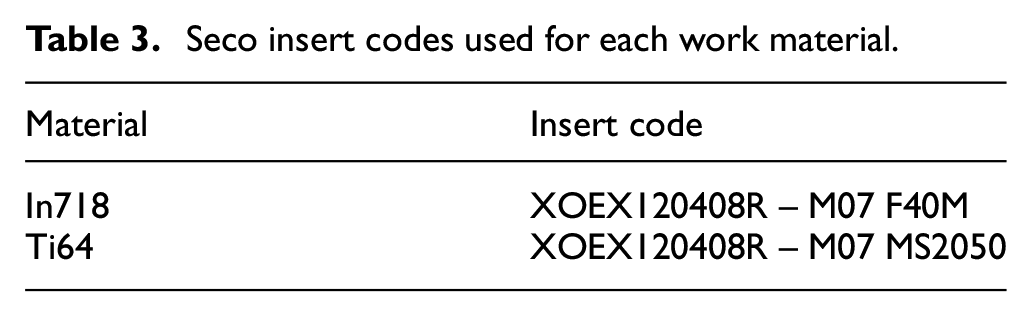
Seco Tools coated cemented carbide ‘turbo’ cutting inserts were used with the different work material variants as per Table 3. A 50 mm diameter milling tool holder, code R220.69-0050-12-5AN (Figure 1(b)) was utilised which supplied coolant through the holder (known as ‘through-tool’ or TT) then through three fixed nozzles of approximately 1 mm diameter, aimed at the milling insert rake face. Only one of the nozzles would be used due to the single insert used. Fluid was also supplied through the spindle via external flood nozzles as per Figure 1(c). Inserts had an axial rake angle of 8°, radial rake angle of 5.8°, helix angle of 15° and a corner radius of 0.8 mm.
Seco insert codes used for each work material.
Milling in this project was carried out using a 3-axis vertical CNC machine, DMG Mori-Seiki NV5000α1. Machining involved a shoulder milling process, down milling (climb milling) at 2 mm axial and 2 mm radial depths of cut, with a feed rate 0.11 mm/tooth with one insert. Surface speeds were dependent on the work piece machined – Ti64: 160 m/min and In718: 80 m/min, with the speed selection process highlighted in Section 3.1. The tool performed a straight line cut through the work material, following common practice the tool entered the cutting pass in an arc to control chip form and forces on entry as shown in Figure 1(d).
To ensure fluid performance differentiation, the following experimental clause was implemented into the experimental methodology. Machine for 20 min and if after 20 min:
Max tool flank wear <0.2 mm, machine in 20 min intervals until max wear = 0.5 mm;
Max tool flank wear >0.2 mm, machine in 10 min intervals until max wear = 0.5 mm.
Twelve repeated machining trials were performed per fluid, per work material, until tool failure had been achieved (i.e. max flank wear, VBmax was equal to 0.5 mm).
Material hardness
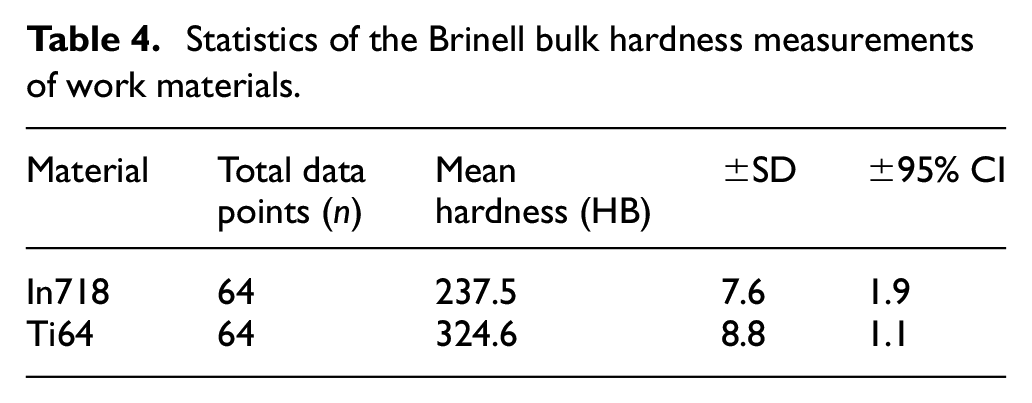
Both materials were tested for hardness using the Brinell bulk hardness measurement process, resulting in small variations between different faces of each respective block. The results are shown in Table 4, with Ti64 demonstrating a higher hardness. SD refers to standard deviation and CI refers to confidence interval, these are common statistics which evaluate the variation in a set of data.
Statistics of the Brinell bulk hardness measurements of work materials.
Cutting fluids
Five fluids were tested within this project. Fluid 1 was a commercially available aerospace MWF and was used as a suitable benchmark fluid. Fluids 2 to 5 were supplied by Italmatch Chemicals. Fluids 2 to 4 consisted of a base package which was top treated with a variant performance additive. However, Fluid 5 was a fully optimised formulation.
Fluid 1 – Aerospace approved commercial fluid (benchmark fluid);
Fluid 2 – Base package without extreme pressure additives;
Fluid 3 – Fluid 2 base package plus polymer lubricant;
Fluid 4 – Fluid 2 base package plus phosphate polymer;
Fluid 5 – Fully formulated fluid based on phosphate polymer.
All fluids were supplied in two 20 L pails each, which would then be diluted on site to give 10 vol% oil-in-water emulsion. Pressure gauges indicated that the TT coolant pressure was 30 bar and the total flow rate (TT plus flood) was 66 ± 2 L/min.
Tool life testing
An ISM-PM200 digital microscope fixed to a stand was used for measuring flank wear on the cutting tool inserts as shown in Figure 2(a) The device was calibrated against a glass etched measuring scale. Wear was measured after specific intervals of time, which varied depending on the time taken for a complete length of cut with the given cutting parameters. The time intervals varied from 1.43 to 20.56 min. For a single cut, the time varied from 1.43 to 7.34 min. Tool wear was measured on the flank face of the cutting edge, focusing on the corner radius (CR) feature of the tooling insert. Previous work dictated that this region was in cutting contact and would wear out in the shortest time, and was therefore the area of interest. Images were repeatedly taken until tool failure (maximum measured wear >0.5 mm) or until the pre-determined time in cut had been reached for the repeat testing. Five measurements were taken at different time intervals per tooling insert as shown in Figure 2(b). However if the failure level of tool wear was not captured within the five measurements, a final sixth reading would be taken.
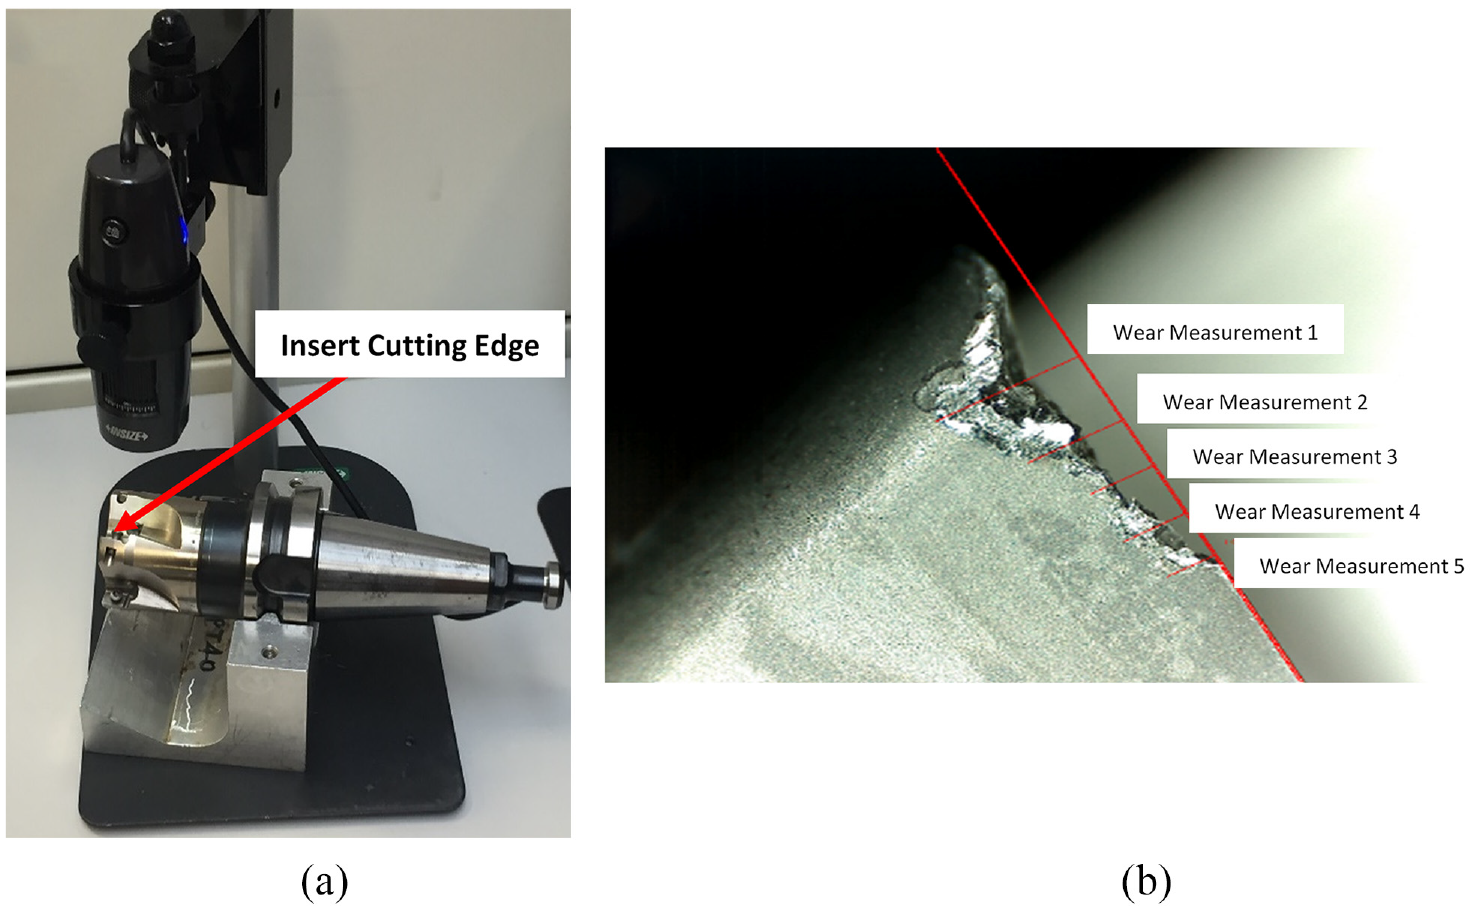
(a) USB (ISM-PM200) digital microscope set up to take cutting insert flank wear images and (b) example of where five tool wear measurements were taken on the flank face of the cutting region of the insert.
Experimental control methods
Cutting tool inspection
Previous work indicated that the condition of supply of the cutting inserts could differ greatly between or within batches. It was shown that this affects cutting forces and tool life and it is therefore important to check the condition of supply. 19 An Alicona SL high-resolution 3D imaging system was used to check the condition of supply of the inserts and to eliminate any anomalous cutting edges.
Tramp oil contamination
Several different lubricants are used within machine tools to provide lubrication to machine tool components and keep interacting metal surfaces apart. These oils can eventually end up in the coolant sump and contaminate the MWF causing multiple issues linked to the repeatability of fluid performance. 20
Visual inspections of the machine sump gave an indication of tramp oil contamination as well as of the sump fluid level. As a rule of thumb, a full surface layer of oil indicates greater than 2% tramp oil concentration relative to the total bulk fluid composition. The machine tool was known to have a linear guideway stage and a low lubrication dosage rate. In these trials tramp oil was inspected for twice daily. Repeat tests undertaken over a 2-week period showed no variation in tool life, indicating a stable cutting fluid performance.
MWF concentration
MWFs are tailored to work within a specific concentration range, which is determined by the manufacturer for optimal performance to assure product quality and maximum cutting tool life, as well as for health and safety reasons.20,21
Bulk MWF concentration was measured twice daily using a refractometer to ensure concentration was maintained at 10 ± 0.5%. Most days, higher-than-range concentration and low sump fluid volume levels were observed in the morning due to water loss, and concentration was maintained by topping up the water content of the sump and mixing using the MWF delivery pumps.
Pre-screening dynamics analysis
The Seco 50 mm tool holder used within this project was tap tested in the machine spindle using a PCB modal hammer and accelerometer. This gave the ability to identify the vibration frequencies and regions of dynamic stability with the most productive and chatter-free cutting conditions. 22 A frequency response function (FRF) was obtained and a stability lobe diagram was calculated using MetalMax TXF software. The radial depth of cut was fixed to 2 mm and the feed per tooth was set to 0.11 mm.
The plots in Figure 3 show the real and imaginary parts of the tap test FRFs in two horizontal tapping directions, x and y. The axis of the spindle and tool is in the z direction.
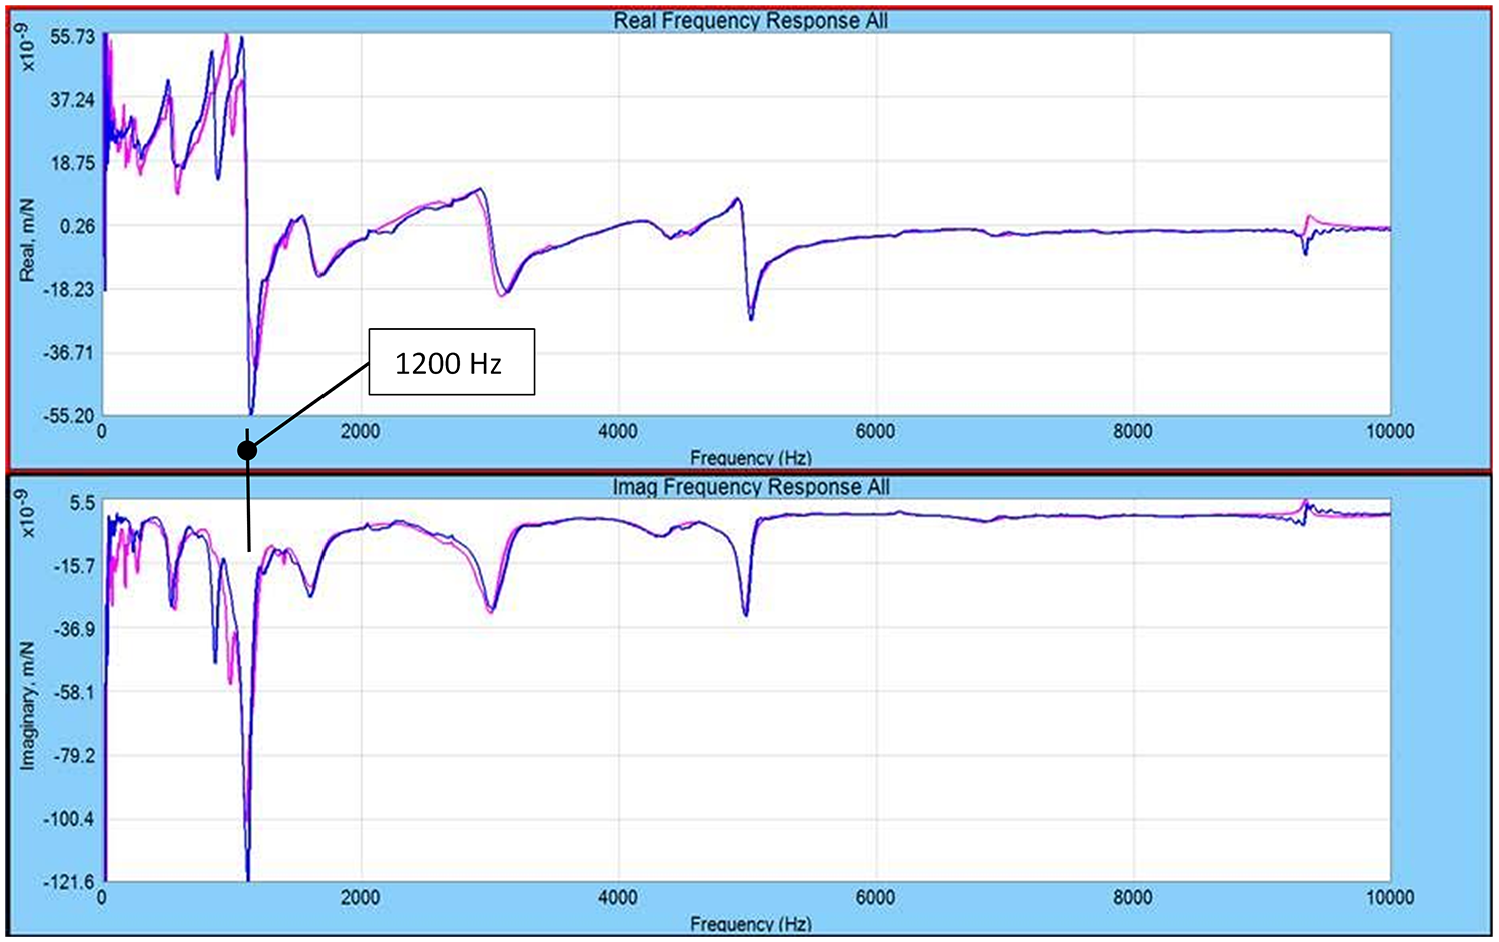
FRFs for the real (above) and imaginary (below) parts of the tap test in the x (blue trace) and y (pink trace) directions.
From the FRFs measured it was possible to extract stability lobes for different materials. These lobes demonstrated what maximum axial depth of cut (mm) could be used in conjunction with what spindle speed (rpm). Any axial depth of cut above this threshold would likely cause unstable vibrations.
An example of a stability lobe diagram for a nickel alloy is shown in Figure 4, the graph indicates that milling cuts of up to 110 mm axial depth could be taken before any regenerative vibrations would occur. For titanium alloy milling cuts up to 200 mm axial depth could be taken before vibrations would be observed. For this project, cuts of 2 mm axial depth were taken, so for both materials the cut was well within the stable cutting zone. This result, however, did not exclude resonant vibrations (stable forced vibrations) which could still take place at the machining parameters used. The plots in Figure 3 indicated that the tool assembly and spindle system had a natural frequency at about 1200 Hz. This would therefore possibly result in a forced vibration at 72,000 rpm with a single point cutting operation, however, this spindle speed far exceeds the speed used for this project. The machine tool itself was limited to 14,000 rpm.
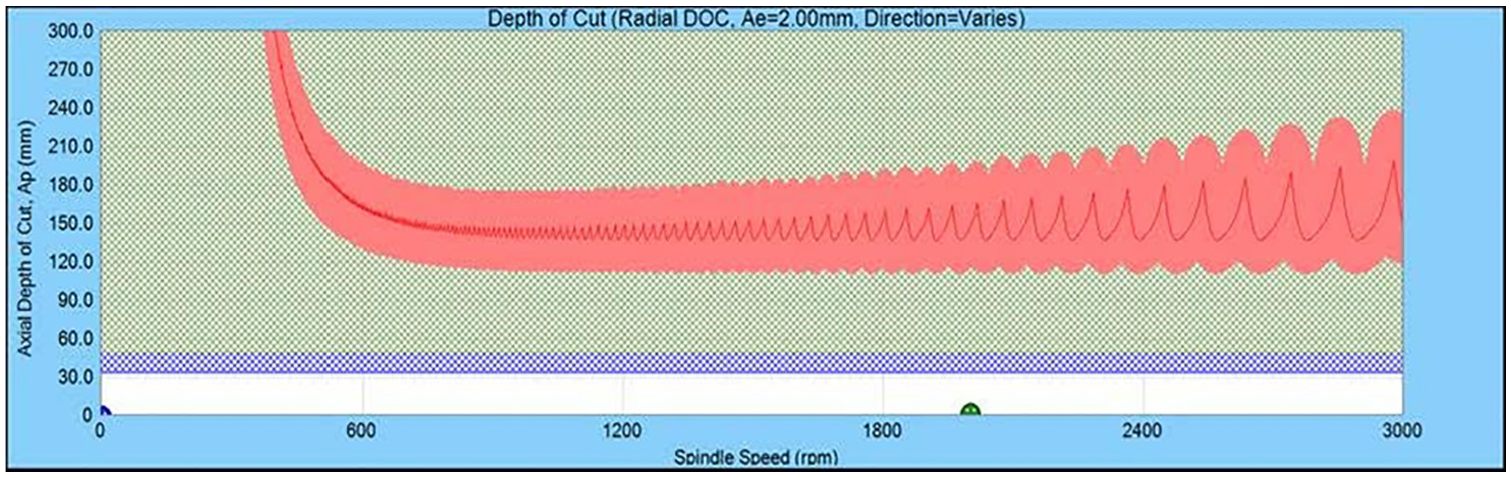
Stability lobe example for a nickel alloy.
Results
Tool life curves
Insert tool life was evaluated at a range of surface speeds with the two material variants. The resulting tool life versus surface speed data was consistent with a logarithmic relationship in all cases. This logarithmic relationship between speed and tool life is commonly referred to as a Taylor curve, pioneered by Taylor in 1907. 23 Tool life data was used in this work to select a suitable machining surface speed for both materials for the different test fluids.
Milling Ti64
To create tool life curves using fluid 1 (the baseline fluid) with Ti64, four speeds (140, 150, 160 and 180 m/min) were tested in 20 min time intervals until the maximum tool wear limit (0.5 mm) had been reached. These speeds were chosen based on previous data collected (exploratory speeds) with the objective of achieving a tool life of approximately 20 to 40 min. A tool life graph was plotted (Figure 5) taking into account the average tool performance (average of three repeats) at each speed, with 95% CI level error bars. From the tool life graph the general trend was that with increasing surface speed, the average tool life decreased. For a surface speed 140 m/min, life ranged between 47 and 53 min, while a surface speed of 180 m/min gave ranges between 16 and 19 min.
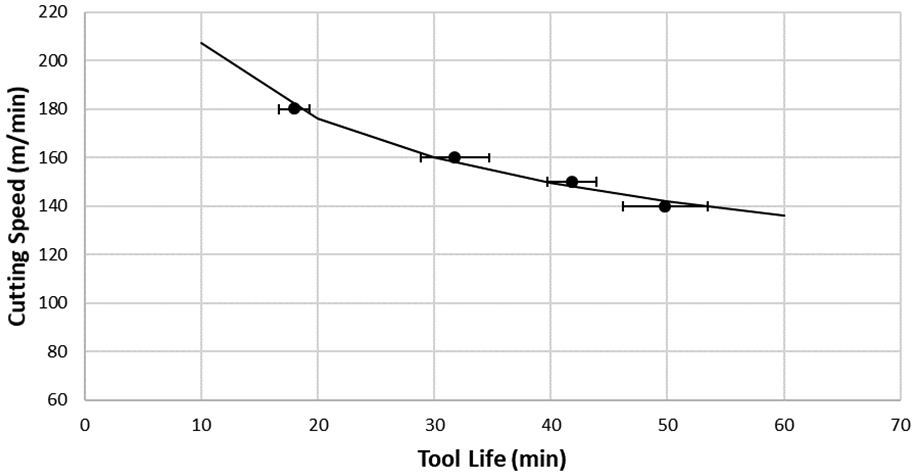
A tool life plot of cutting surface speed versus tool life for fluid 1 on Ti64, with 95% CI.
From performing various repeated speed trials for fluid 1 and the construction of a tool life graph, a speed of 160 m/min was recommended which was selected to be used for all test fluids with Ti64, based on the target of achieving a tool life of between 29 to 35 min.
Milling In718
As with Ti64, four different surface speeds were tested with three repeats at each speed with In718 and fluid 1. The speeds were 70, 80, 85 and 90 m/min. The tool life graph (Figure 6) demonstrated a general linear behaviour where tool life reduced with higher surface speeds, however there was a high variation in repeat tool life with this material in contrast with Ti64. From this data a recommended surface speed of 80 m/min was selected to be used for all test fluids with In718, based on the performance of achieving a tool life of approximately 34 min.
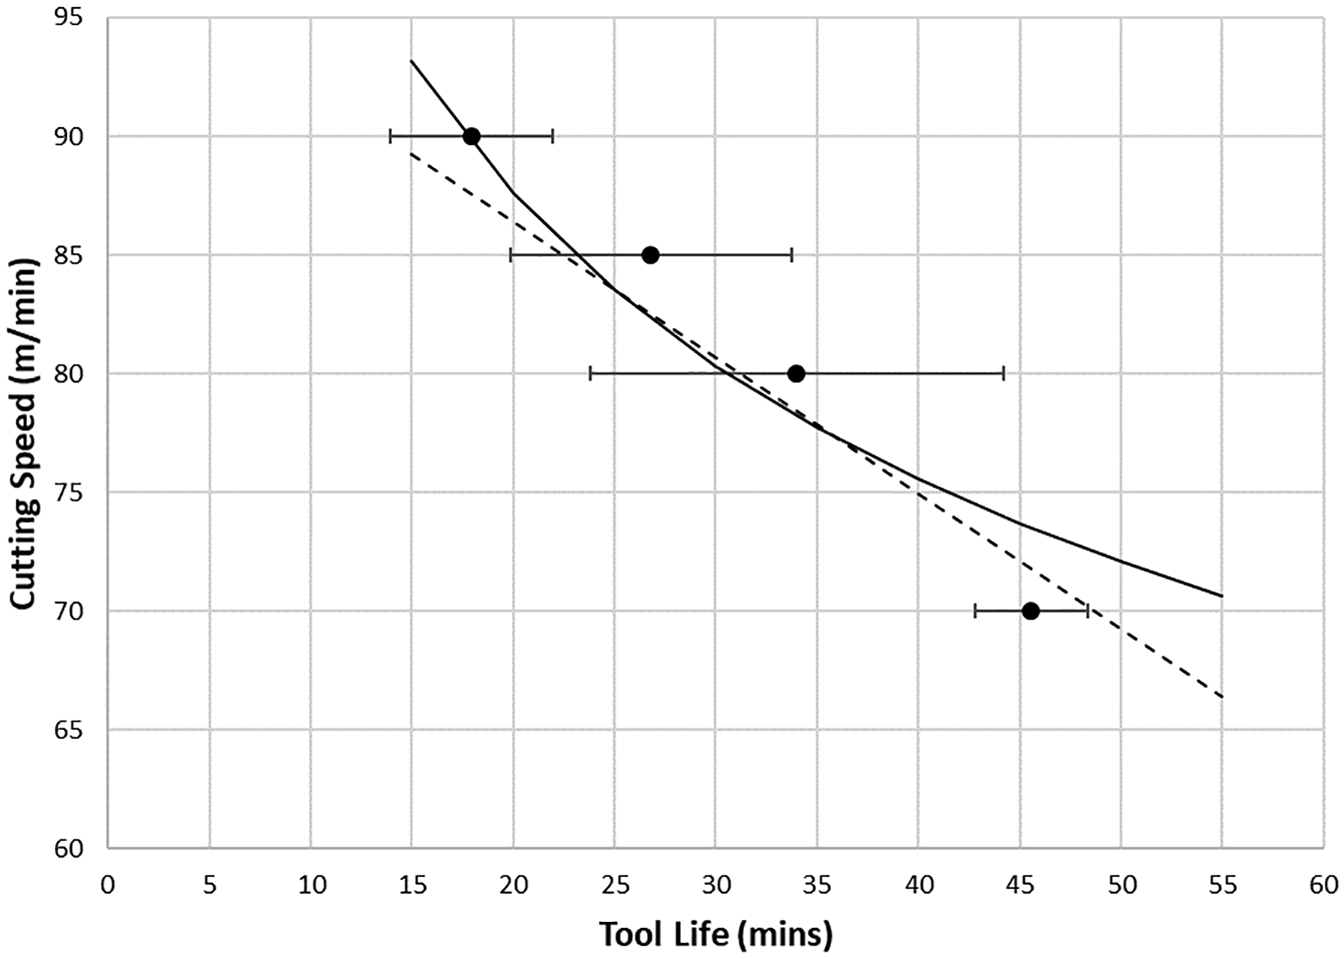
A tool life plot of cutting surface speed versus tool life for fluid 1 on In718, with 95% CI, showing both linear and power trend lines.
The two selected speeds for the material variants allow for better and poorer performing fluids to be represented and differentiated under the machining conditions.
Fluid relative performance results
Figures 7 and 8 present the tool wear versus time data for fluids 1, 2, 3, 4 and 5 for Ti64 (160 m/min) and In718 (80 m/min) milling, respectively. The machining parameters highlighted in sections 2.1 and 3.1 were used. Twelve tool life tests were performed with each fluid to address any experimental variation.
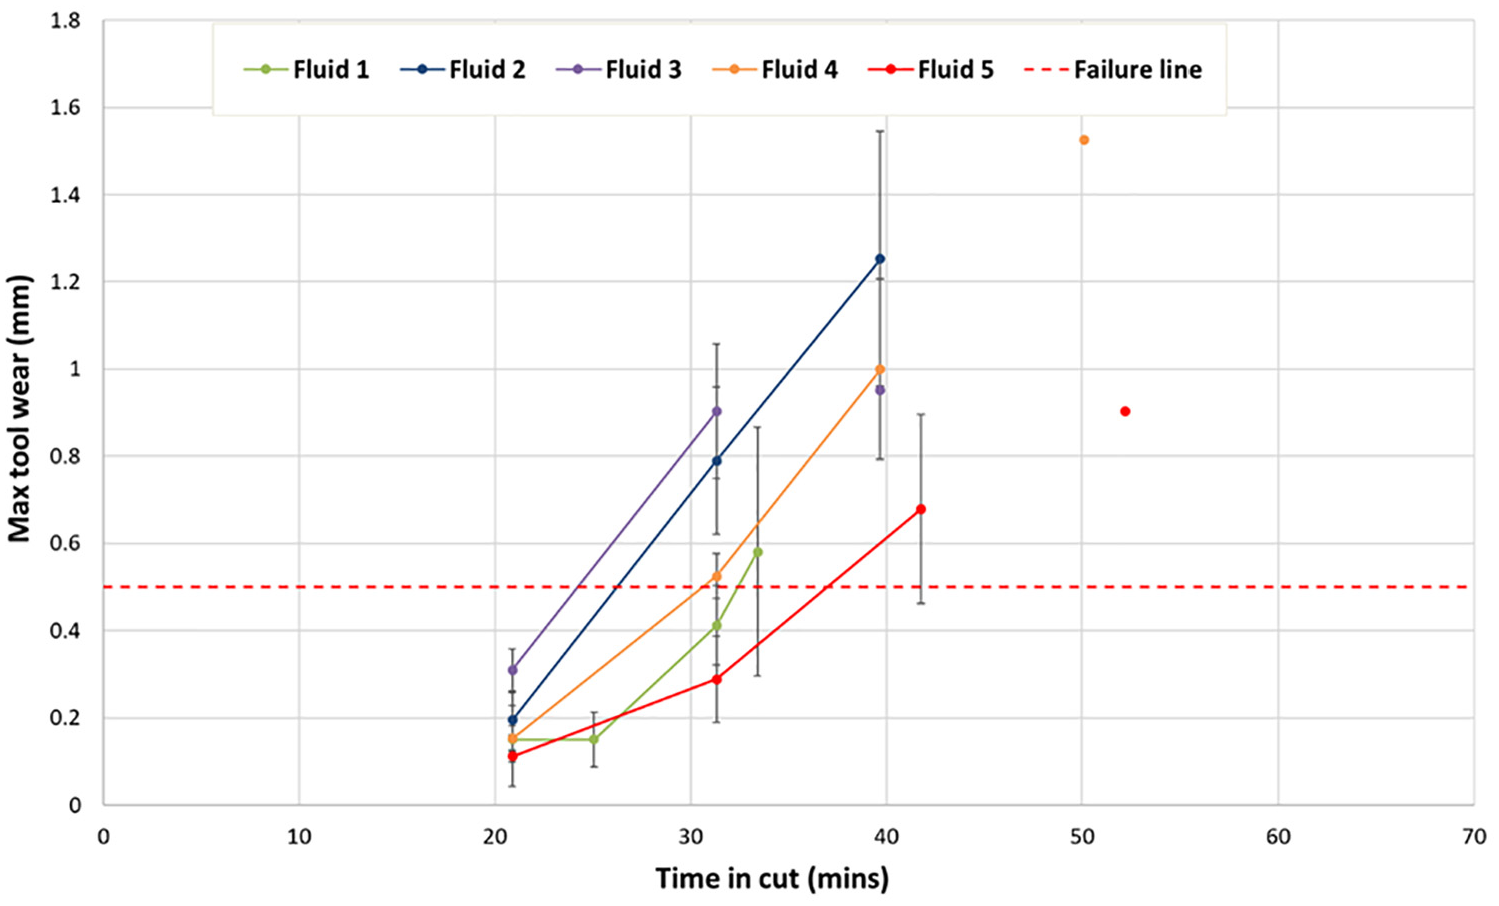
A tool wear versus time plot for fluids 1, 2, 3, 4 and 5 for machining Ti64 at 160 m/min, with 95% CI.
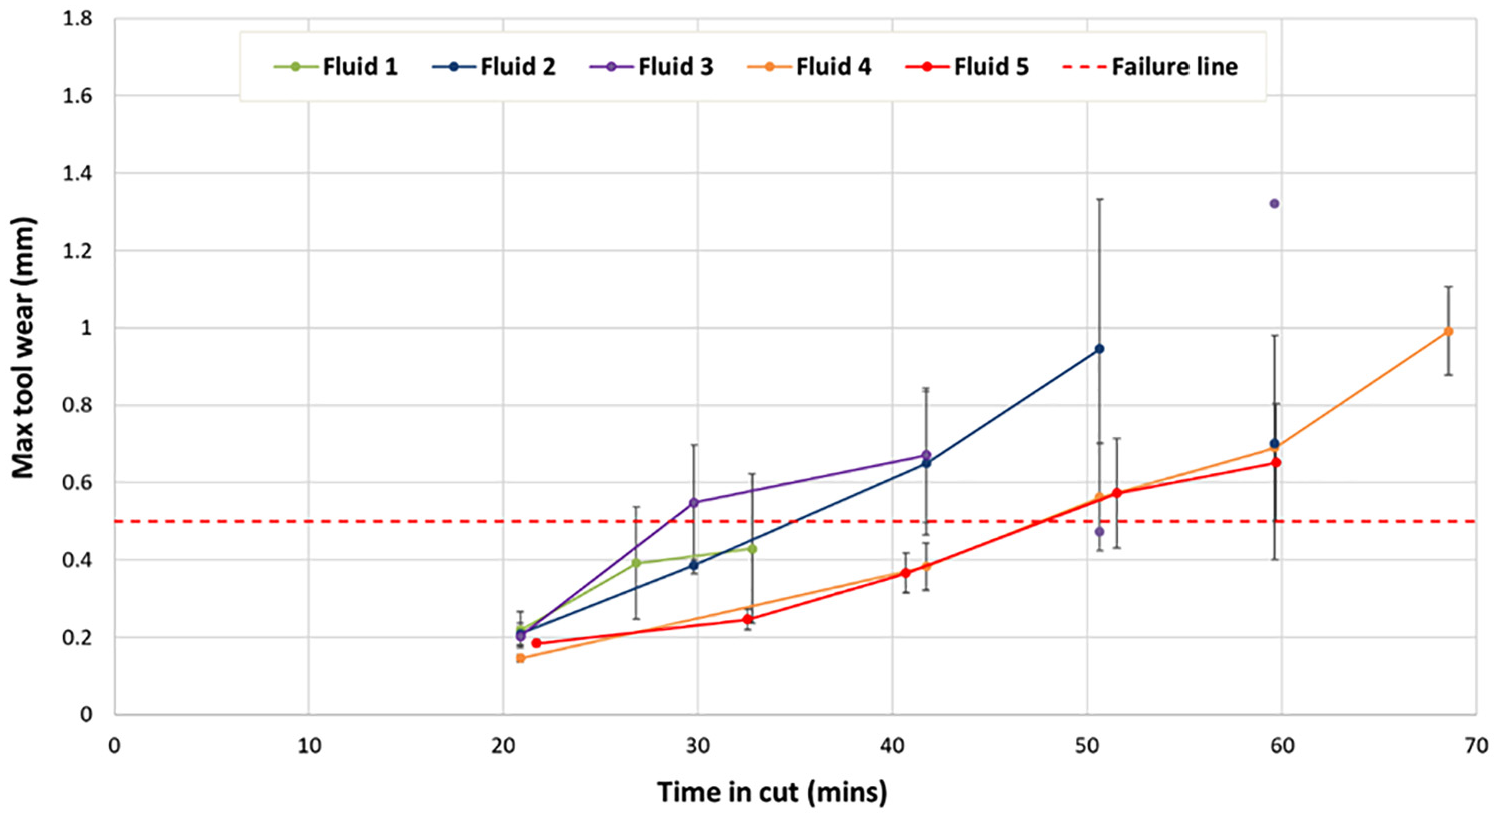
A tool wear versus time plot for fluids 1, 2, 3, 4 and 5 for machining In718 at 80 m/min, with 95% CI.
Figure 7 illustrates the visible differentiation in flank wear during the machining of Ti64, with Fluids 2, 3, 4 and 5 all displaying a monotonic increase in tool wear over time, and with the size of error bars generally increasing over time. The majority of inserts experienced tool failure after approximately 30 min of machining. However with fluids 2 and 4, trials did extend to over 30 min for some cases, with a single insert lasting over 50 min for fluids 4 and 5. Fluid 5 demonstrated the lowest tool wear over time and an average tool life of 37.1 min, compared to fluid 3 which had the highest tool wear rate and lowest average tool life (24.3 min). Based on average results, for Ti64 the fluid performance from best to worst was ranked to be fluid 5, 1, 4, 2 and then 3.
In all cases a monotonic increasing relationship between tool wear and time was observed with fluids 2, 3, 4 and 5 and In718 as per Figure 8. However, the gradient of the linear change was much more gradual compared to Ti64 (Figure 7). Anomalous behaviour was apparent with a single data point being captured for fluid 3 at 50 min (wear = 0.47 mm) which then was run to 60 min (wear = 1.32 mm). Moreover, errors bars did not exhibit a clear trend with respect to growing or narrowing as time elapsed. Fluid 4 and 5 showed wear behaviour which was indistinguishably similar within the bounds of repeatability, and the highest average tool life (47.5 min), whereas fluid 3 showed the lowest average tool life (28.7 min). For In718, based on average results the ranking order (best to worst) was fluid 5 and 4 (being very similar) followed by fluids 2, 1 and then 3.
Figures 7 and 8 show that significant differentiation in fluid performance could be observed for both alloy material variants. Figure 9 demonstrates the typical appearance and evolution of tool wear behaviour over time. A and B are images captured for the inserts used for machining Ti64 with Fluid 3, as can be seen visually there is a large difference in wear after 20 min of machining compared to after 30 min. The behaviour observed was representative of the typical behaviour of these inserts with fluid 3, resulting in a steep positive gradient between 20 and 30 min (Figure 7). Images C and D in Figure 9 capture the wear of the inserts used for machining In718 at 80 m/min after 20 and 30 min with fluid 3. These results have been summarised in Figures 7 and 8.
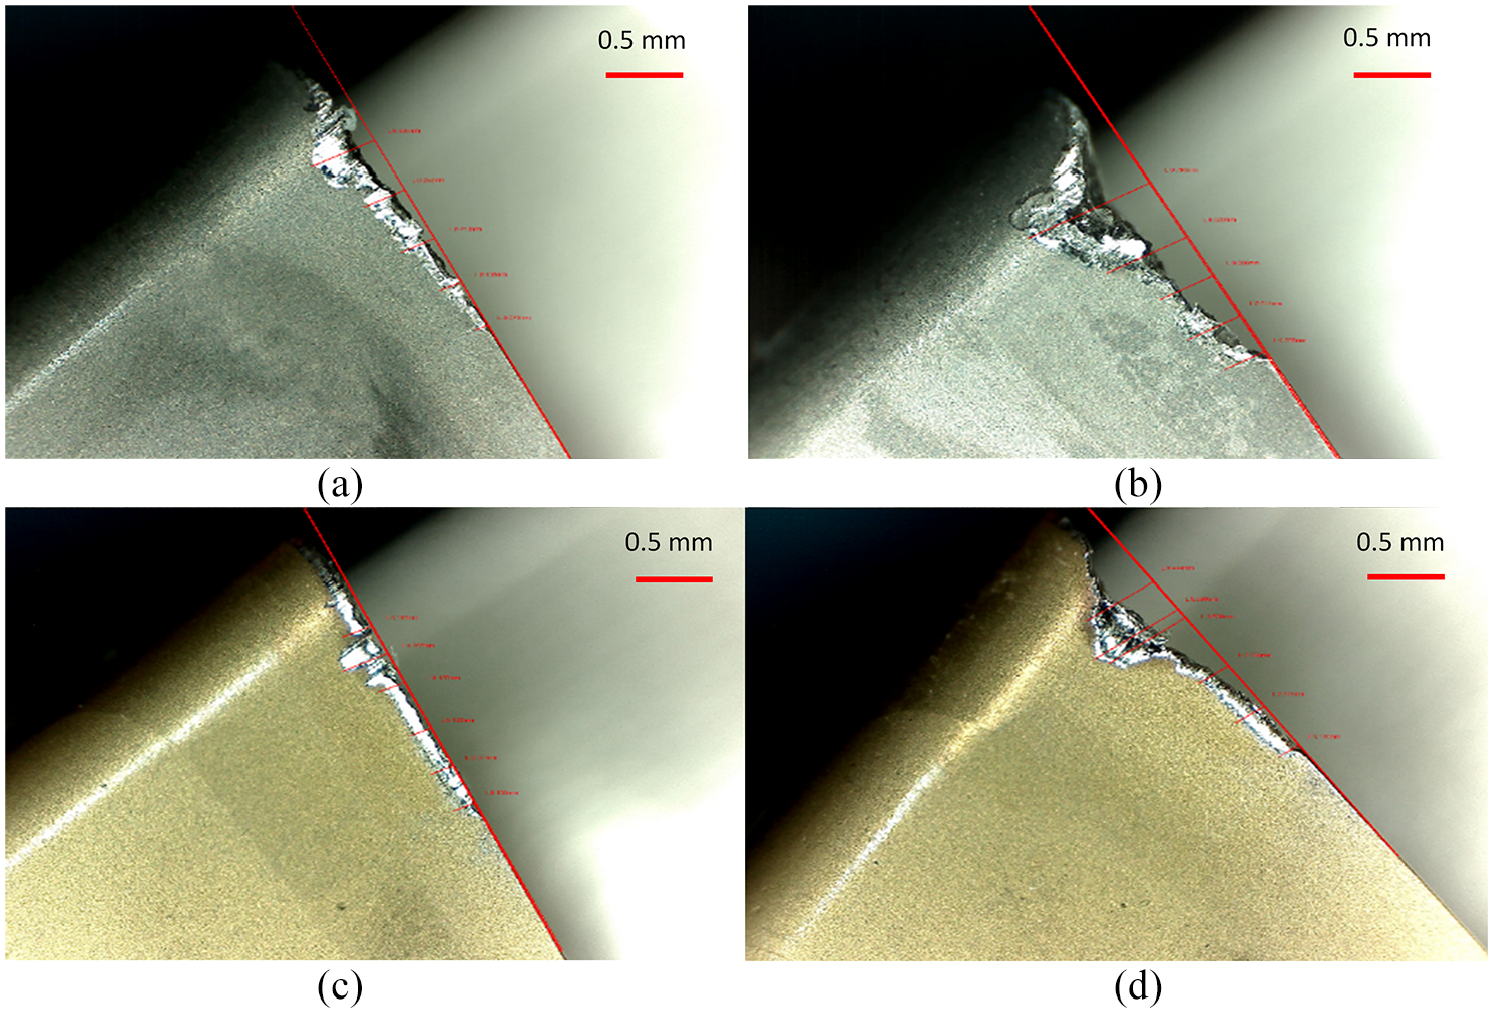
Images showing the evolution of tool flank wear for fluid 3, with Ti64 at 160 m/min: (a) after 20 min, (b) after 30 min of machining. Evolution with In718 at 80 m/min: (c) after 20 min, (d) after 30 min of machining.
Discussion
The SPM process showed itself to be a fast and inexpensive method of testing fluid performance in milling. To improve repeatability and reduce variability of the test procedure single point inserts were used. The use of a solid carbide tool with multiple flutes would increase the variability in results as the tolerances of each flute and cutting edge varied to a certain degree. 24 Carrying out dynamic analysis on a full tool assembly allowed the selection of an acceptable cutting depth and spindle speed to ensure machining was maintained in a region of dynamic stability and chatter vibrations were avoided.
Four speeds were selected to be used to construct a tool life graph for Fluid 1 for both Ti64 and In718. Figure 5 illustrates the tool life graph constructed for Ti64 machining. The error bars are all relatively small and provide confidence in the data collected, and the behaviour demonstrated for cutting Fluid 1 and Ti64. In718 (Figure 6) generally followed the same trend (increased speeds result in a lower time in cut); however overlaps are demonstrated in the data, at 85 and 80 m/min. These trends were not a great surprise, due to the well referenced machining behaviour of Inconel material. The high strength and low thermal conductivity of nickel alloys can mean cutting fluids cannot penetrate the chip-tool interface and reach the high temperature zone. In some cases the fluid evaporates at high temperatures during cutting and creates a high temperature blanket over the cutting zone, which may lead to a further increase in hardness of the nickel alloy below 650°C.2,25,26 This difficulty to machine Inconel plays a role in the more stochastic behaviour found when investigating different surface speeds.
The selection of surface speeds to test the cutting fluids for both materials (In718 – 80 m/min and Ti64 – 160 m/min) aimed to achieve tool life between 30 and 35 min, which allowed testing until failure without taking a significant amount of machine time and cost to complete. Shorter testing periods could reduce the time and cost to test a fluid, but acceleration of testing eventually leads to more stochastic tool wear and stochastic failure behaviour. 17
Strict experimental procedures were implemented to ensure a high level of repeatability and to achieve fluid behavioural differentiation. With the insert wearing at a slower rate (max wear < 0.2 mm after 20 min of machining), taking flank wear measurements in 20 min intervals captured the steady linear wear behaviour. With inserts wearing at a faster rate (max wear > 0.2 mm after 20 min of machining) taking flank wear measurements in 10 min intervals allowed for a higher resolution of the wear-time curve and thus captured behaviour of the tool wear near to failure.
For both materials (Figures 7 and 8) it was clear to see that fluid performance in terms of tool wear could be assessed and compared. Five different cutting fluid variants were utilised and the testing parameters were able to demonstrate clear differentiation of performance. Through the use of a range of fluids where an existing base package was top treated with a performance enhancing additive variant, it was expected that a wide range of performance behaviours would be observed and this was the case. Using the additive present in Fluid 4, Fluid 5 was manufactured so that the base oil was optimised for this particular additive to achieve synergistic and better performance. This was observed with Ti64 trials where Fluid 5 outperformed the alternatives, however with In718 the performance of Fluids 4 and 5 were almost identical but this may be due to the difficulty of machining In718 at high repeatability, already discussed above.2,25,26 Overall, for both materials clear performance differentiation (up to 65%) was observed between the best and worst performing fluids with up to 95% confidence or greater. The next stage of this testing procedure would include analysis of other fluid performance factors such as impact on the machined surface quality, which would provide additional information to support fluid behaviour trends derived from tool wear measurements.
On both alloy materials, Fluid 5 out-performed the commercial baseline fluid. Fluid 3 performed the worst when machining both alloy materials – the polymer lubricant additive tested was not effective for this particular application.
Conclusion
The aim of this study was to develop a lab based machining test, which would allow the assessment of metalworking fluid (MWF) performance and differentiation when milling aerospace alloys. The key conclusions drawn from the work are:
The single point milling experiment can confidently be used as a simplified laboratory style machining performance test to screen cutting fluid variants on Inconel 718 (In718) and Ti-6Al-4V (Ti64).
The use of a single milling insert in tool life testing reduces the material consumed per test, reduces trial variability and improves repeatability. Difficulty with machining In718 reduced the ability to assess and compare fluid performance, relative to when milling Ti64. The more stochastic behaviour for In718 led to a wider uncertainty in repeat tool life relative to Ti64.
MWF performance additive packages can impact milling machinability trials significantly in terms of tool life. There was a 65% and 53% performance difference in tool life behaviour between the best and worst performing fluids with In718 and Ti64 respectively.
Under the conditions tested, a fully formulated MWF based on phosphate polymer was the best overall performer, whilst an MWF containing a base package and polymer lubricant was the worst overall performer.
Footnotes
Acknowledgements
The authors would like to thank Italmatch Chemicals – Lubricant Performance Additives for funding this study.
Declaration of conflicting interests
The author(s) declared no potential conflicts of interest with respect to the research, authorship, and/or publication of this article.
Funding
The author(s) received no financial support for the research, authorship, and/or publication of this article.