
Abstract
In this study, a functionally graded composite (FGC) technique is proposed to produce an electrical contact material made of W/Cu alloy. The prepared composite was sintered and subjected to high-voltage vacuum arc erosion. The composite properties and microstructure are carefully studied based on SEM images before and after exposure to vacuum arc discharge. According to the necking phenomenon observed in the electron micrographs and the quantitative analysis of the particle size, it is evident that the intermediate layer of W/Cu FGC has been in the final stage of the sintering process. The present porosity of FGC samples was less than mono-layered composite (MLC) samples, and the minimum porosity was observed in the three-layered FGC that composed of W70/Cu30 in the first layer. The average hardness of FGC samples was 4% higher than that of MLC samples with an identical composition. The results of the erosion behavior assessment were used to determine the possible arc erosion mechanism. The weight loss was diminished upon erosion when the W/Cu alloys had more than one layer, especially in four-layered FGC. The result also revealed that FGC samples, especially the four-layered composite, had improved heat transfer and prevented heat concentration on the contact surfaces due to higher content of Cu particles in the successive layers and consequently reduced the surface damage.
Keywords
Introduction
Functionally graded composites (FGCs) are heterogeneous materials with a gradually changing composition and a subsequent property gradient. The structural features of the materials are due to their unique microstructure and the position dependence of the chemical composition.1,2 FGCs are able to reduce the mechanical and thermal stress concentration in numerous structural components developed for specific applications. 3 According to the W/Cu binary phase diagram, the elements are insoluble in each other. Therefore, the combination of W and Cu leads to the formation of the W/Cu composite. Almost every mixture of W/Cu has found extensive application as electrical contact materials and plasma-facing components (PFCs).3,4 FGCs have a smaller thermal expansion coefficient, higher hardness, a higher melting point, and a smaller vapor pressure than traditional W/Cu composites.3,5 The fabrication of FGCs is challenging due to significant differences in melting points and hardness values of W and Cu. 6 To date, various approaches based on the particulate processing, preform processing, layer processing, and melt processing have been used to fabricate FGCs.
Yarrapareddy et al. 7 investigated the slurry erosion behavior of Ni/WC functionally graded materials fabricated by laser-based direct metal deposition (LBDMD) on a 4140 steel substrate. Their results suggested that the LBDMD process was able to deposit defect-free Ni/WC FGMs with a uniform distribution of tungsten carbide particles in a nickel-based matrix. In another research, Huang et al. 8 investigated the effects of the rigid constraint body thickness on the mechanical properties and densification of aluminum alloy green compact produced by the hot isostatic press (HIP). In 2018, Madec et al. 9 fabricated alumina-titanium FGCs using the SPS method. In this study, the joining conditions of alumina (Al2O3) and titanium (Ti) were studied to produce relatively light materials with a high level of hardness and ductility at ambient temperature. They observed that SPS process could facilitate the synthesis of dense samples of alumina with a fine grain size(0.7 μm) and high hardness. Chiu and Yu 10 proposed a method for an FGM objective design, stating that the material properties of an FGM part could be determined more objectively with sufficient consideration of all design requirements. Nayak et al. 11 investigated the effect of the sintering method on the ultimate properties of a material. They used two distinct methods of microwave and conventional sintering to fabricate a steel tool. According to the results, microwave sintering offers significant technical benefits compared to conventional sintering methods.
Electrical contacts are components with wide applications in electrical products. They play a crucial role in connecting and breaking circuits. These parts can be subjected to a mechanical force, being capable of withstanding the high-temperature arc erosion. Therefore, the electrical contact materials (ECMs) need to have excellent combinational properties such as acceptable mechanical properties, thermal conductivity, and wear resistance to be practically reliable. 12 W/Cu alloys are extensively used in different electronic devices such as circuit breakers and switches due to their outstanding properties such as high sputtering resistance, high electrical and thermal conductivity and excellent resistance to arc erosion.13–15 In a circuit breaker, the contact material must be able to bear ultra-high-voltages, while conventional W/Cu contacts cannot fulfill this requirement. Therefore, extensive studies have been undertaken to improve and develop the mechanical and electrical properties of W/Cu contact materials.16–20 These studies have focused on enhancing the properties of W/Cu composites by optimizing their composition and preparation methods.21–24
Kong et al. 25 proposed a new method for fault-influencing factors analysis of high-voltage switchgear using the machine learning algorithm based on traditional analysis methods. They managed to provide an important reference for high-voltage switchgear operation maintenance. Wei et al. 26 focused on the surface melting layers of W/Cu samples in vacuum. In vacuum breakdown tests, they observed the occurrence of cathode spots on the Cu phase during the first breakdown. After calculating the work function and experimental tests, they found that the first vacuum breakdown probably occurred in the Cu phase. Dong et al. 27 investigated the arc erosion behavior of W70/Cu30 ECMs with an additional graphene content. They observed that adding a third phase like graphene to the W/Cu base material could enhance breakdown strength. In their research, breakdown strength was strengthened up to about 45.5%, with an absolute value of 8.5 × 10⁶ V/m.
The bulk of above studies have focused on the thermal and mechanical properties of ECMs, preparation methods, and the effect of introducing additives to components. However, little attention has been paid to the arc erosion behavior of W/Cu composites in a multi-layer configuration, especially for FGCs. In the present study, a two, three, four, and nine-layered W/Cu functionally graded composite along with two mono-layered composites with micron-sized particles are manufactured utilizing the vacuum sintering. The microstructure of sintered samples and FGCs are investigated before and after the arc discharge process using scanning electron microscopy (SEM). Finally, the possible arc erosion mechanism is proposed.
Experimental procedures
Tungsten (purity 99.9%, particle size <10 µm) and copper (purity 99.9%, particle size <45 µm) powders were purchased from Germany and used as received. Table 1 shows the operating conditions under which the samples were prepared. Table 2 shows the composition and the number of layers in W/Cu blocks. In this study, two mono-layered composites (MLCs) and four FGCs were made. The design and choice of layers in FGC samples were based on previous studies with a special focus on the first wall of a fusion reactor.3,28 Figure 1 shows the X-ray diffractogram (XRD) patterns of starting tungsten and copper powders before composite production. As clearly seen in the pictures, only peaks related to copper and tungsten are seen for the pure powders. To fabricate FGC and MLC samples, the initial powders were mixed with different weight ratios in a planetary ball mill (PM2400). For the milling process, the ball to powder ratio was 10:1 wt% and the powders were milled for 2 h at 250 rpm. In addition, 0.5 wt% pure ultra-fine starch was applied inside a mold 70 mm in height and 20 mm in in inner diameter as the lubricant.. As illustrated in Figure 2(a), the prepared mixtures were poured into the mold separately. As a result, each layer would have a specific thickness after being hydraulically pressed for 15 min. Cold-compression method was used to produce composite samples due to its simplicity and low cost and then the samples were sintered using a tube furnace under argon atmosphere. The ultimate dimensions of samples included a height of 3 mm and a diameter of 20 mm. In other words, the thickness of each layer in a three-layered FGC was 1 mm. For FGC samples, layers with different weight ratios were stacked into a mold. Before vacuum arc discharge, the composite compacts were sintered using a tube furnace under argon atmosphere. The temperature rose from 25°C to 350°C at a rate of 10°C/min, and was preserved at this temperature for 30 min. In the following stage, with the same heating rate, the temperature was increased to 900°C and then the samples were furnace-cooled to room temperature. Figure 2(b) demonstrates the pictures of assemblies as well as the SEM image of the cross-section in the three-layered W/Cu FGC. The composition of W from A to C layer was 70–50–30 wt%. The tungsten and copper proportions are shown in gray and orange, respectively.
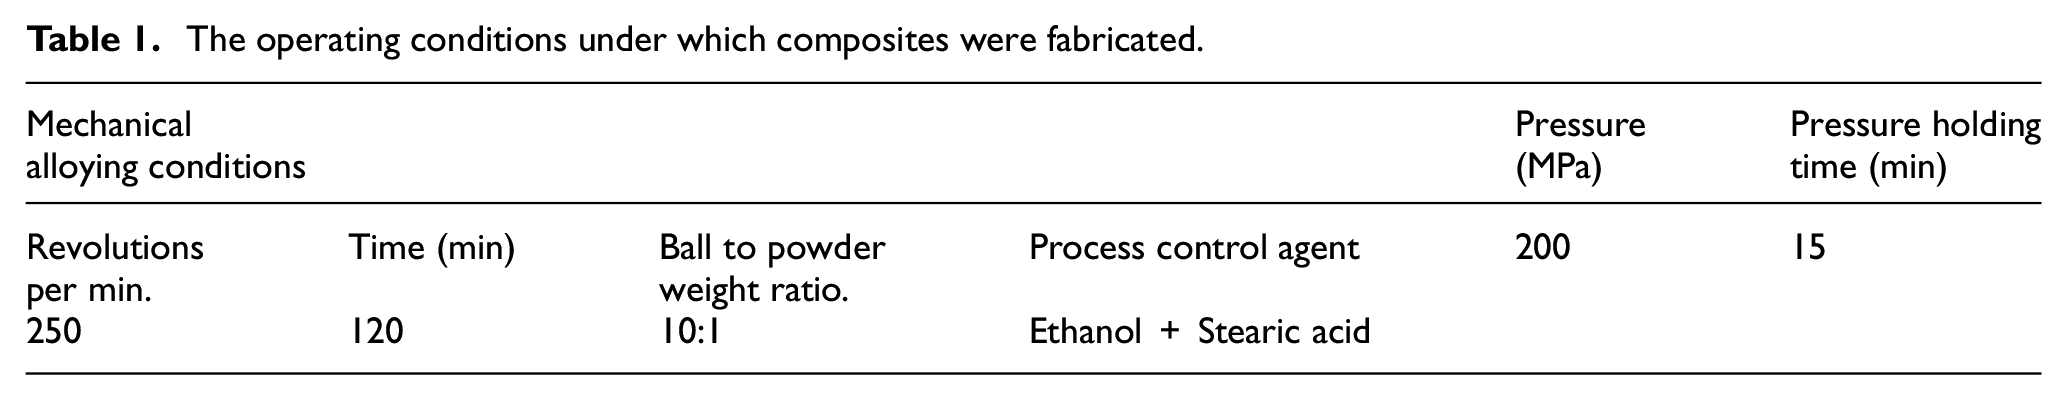
The operating conditions under which composites were fabricated.
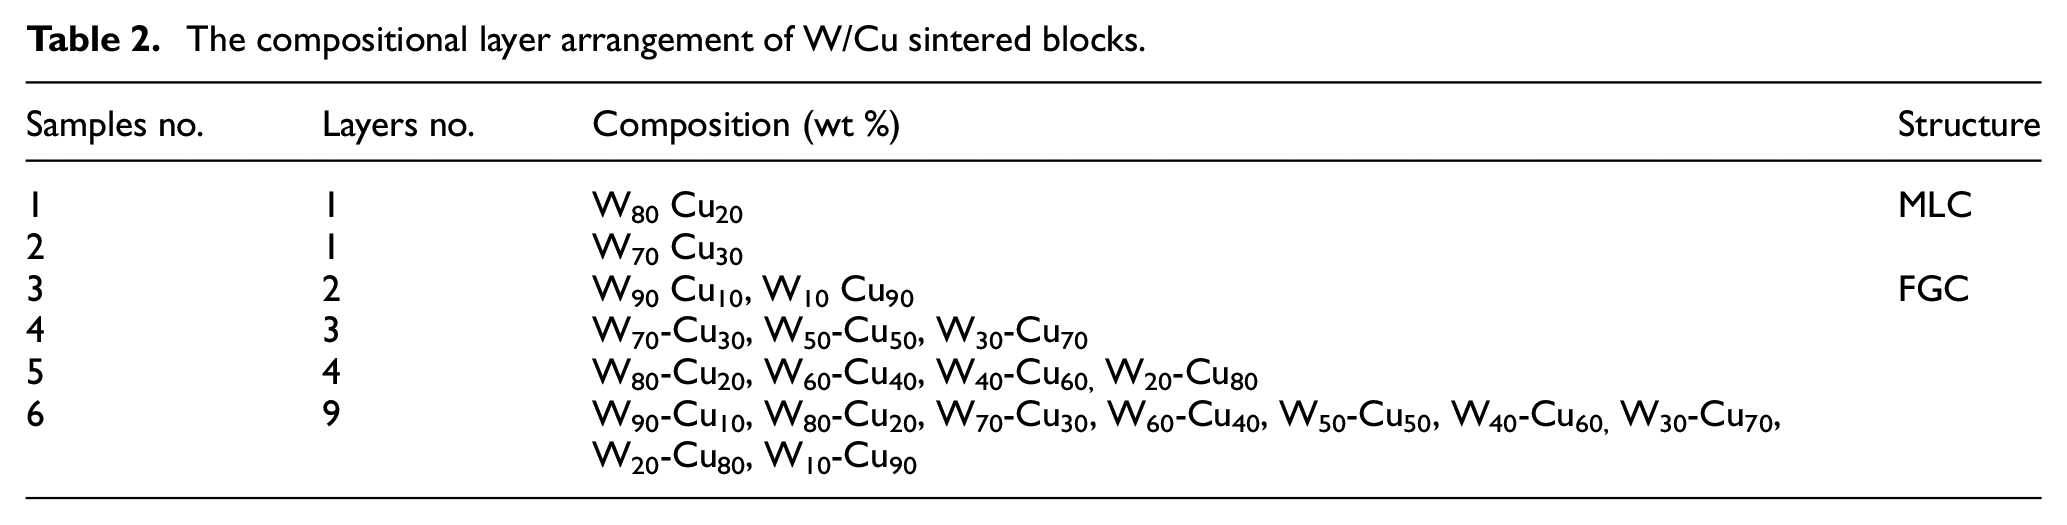
The compositional layer arrangement of W/Cu sintered blocks.
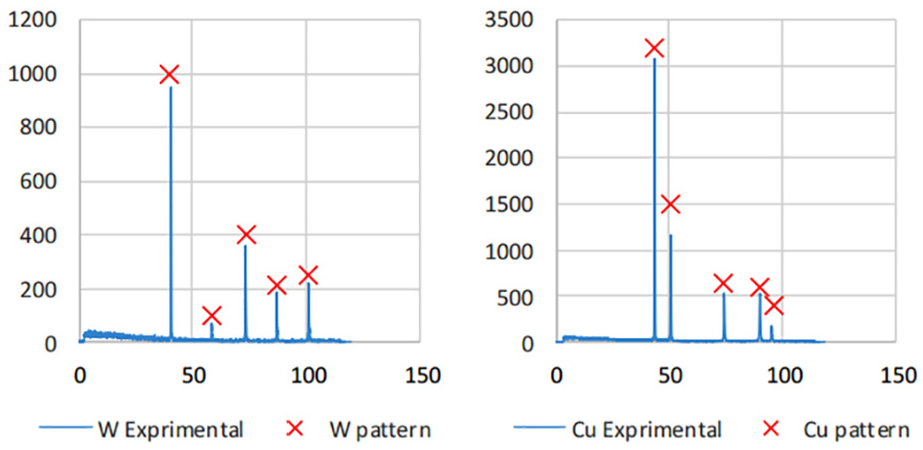
XRD patterns of starting powders before pressing.
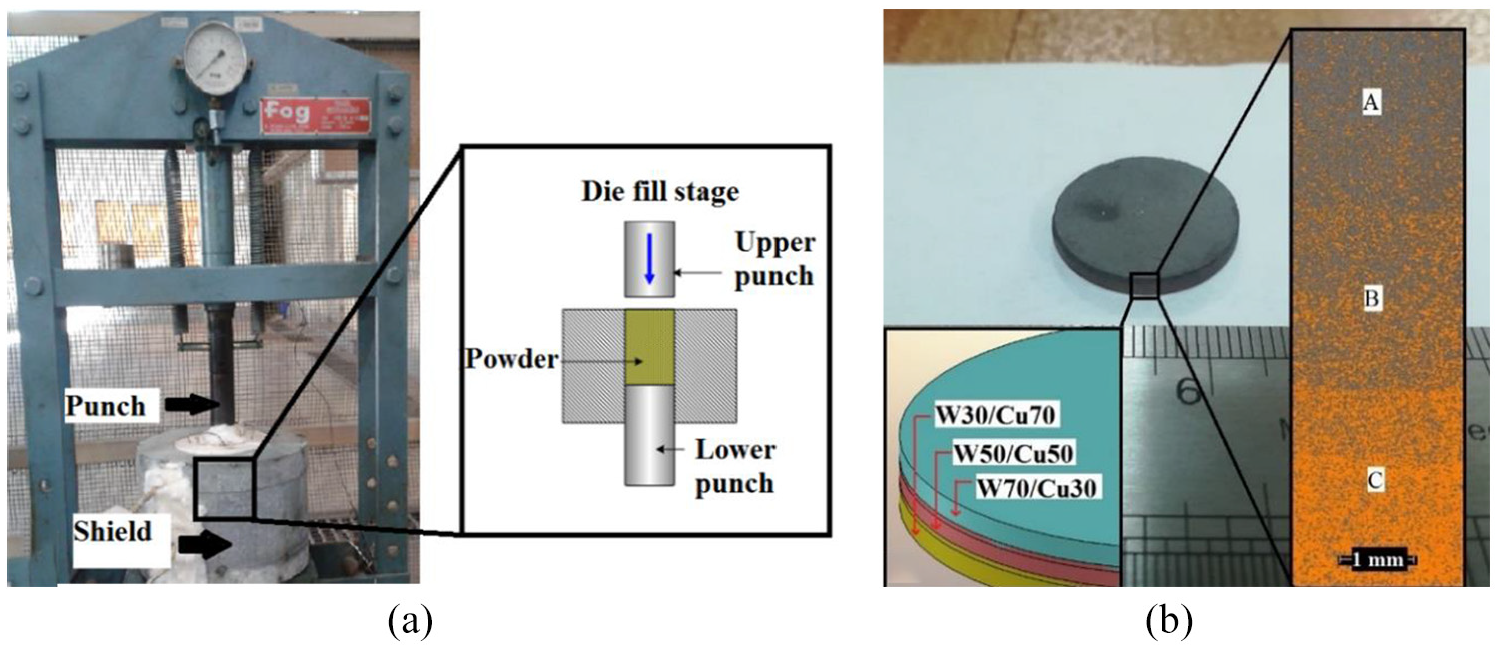
(a) The experimental setup used to fabricate FGCs, and (b) the cross-section of the three-layered FGC (W 70% on the upper side and Cu 70% on the lower side).
As illustrated in Figure 3, plasma focus device (PFD) was utilized to perform the arc erosion process. In this system, samples placed at the central electrode with an outer diameter of 40 mm acted as the anode surrounded with six cathodes, each with an outer diameter of 10 mm. While the chamber was evacuated to 10−3 Torr, a capacitor of 90 μf was charged to a voltage of 7 kV. This vacuum arc discharge test was repeated 30 times following the arc extinguishing stage. The experimental weight loss of the ECM after arc erosion was measured by an electronic balance (Pioneer TM OHAUS) with a resolution of 0.1 milligrams. The surface morphology and XRD of the electrical contact were characterized using scanning electron microscopy (SEM, CamScan MV2300 model) equipped with an energy dispersive spectrometer (EDS, BRUKER Xflash6L10) and XRD (Rigaku UITIMA 4) with an incidence angle of 2°, respectively. The electrical resistivity and hardness were tested by a GW INSTEK GOM-802 mili-ohmmeter and the Vickers hardness (HV10 instrument), respectively.
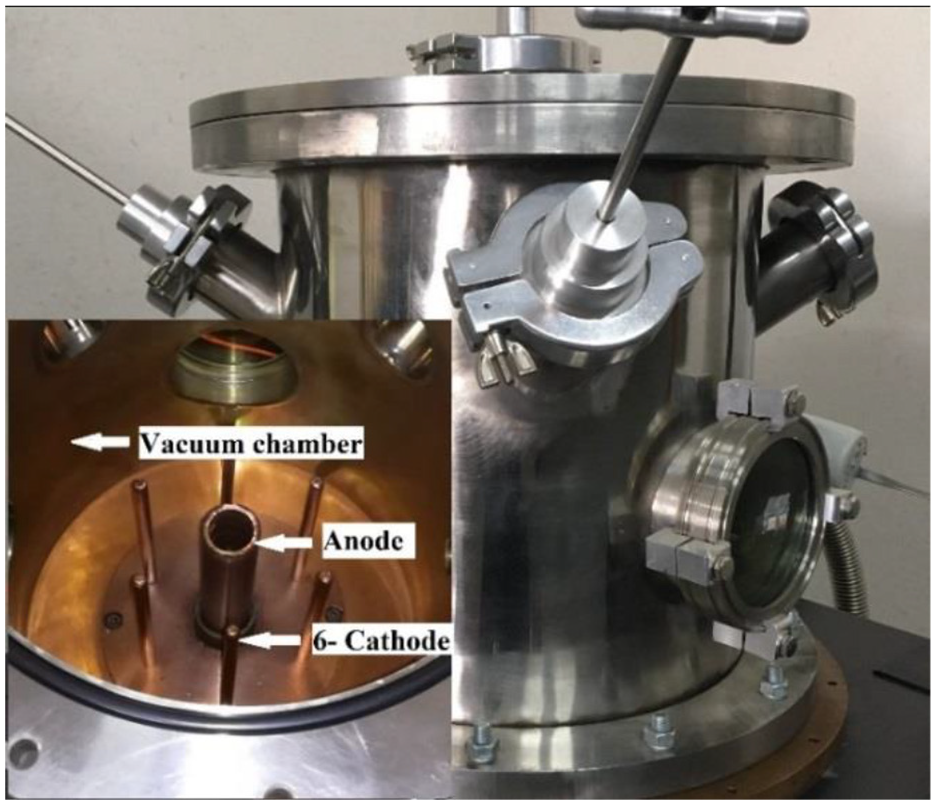
PFD arcing test system.
Result and discussion
Sintering of FGC and MLC before vacuum arc discharge
Figure 4(a) and (b) show the morphology images of three-layered FGC and W70/Cu30 milled powders, from which it can be seen that all the composite powders are relatively uniformly mixed and some copper particles disperse on the surface of tungsten particles. Furthermore, the homogeneous distribution of the particles in the milled powders were obvious. Homogeneity is important for improving the properties of W/Cu composites, such as the hardness and electrical conductivity. According to Figure 4(a) and (b), the average particle size of milled powders are about 4 and 2 μm, respectively. Figure 5 shows the SEM images of the three-layered FGC (W70/Cu30 wt.%) before being exposed to the vacuum arc discharge. As illustrated in this figure, all-composite powders had a uniform distribution of copper particles in the tungsten matrix. This image was subjected to the quantitative analysis to determine different phases. Tungsten, copper, and surface porosity are distinguished in yellow, red, and gray, respectively. The weight percentage of each phase is also shown in images. According to Figure 5, it is clear that tungsten and copper contents of the composite (70.12 and 25.41 wt.%) align well with their nominal values (W70/Cu30 wt.%). The measured value of porosity (4.47%) can be attributed either to impurity or insufficient bonding and mutual solubility between W/Cu and W/W particles, which lead to some particles detachment from the surface during polishing stages.
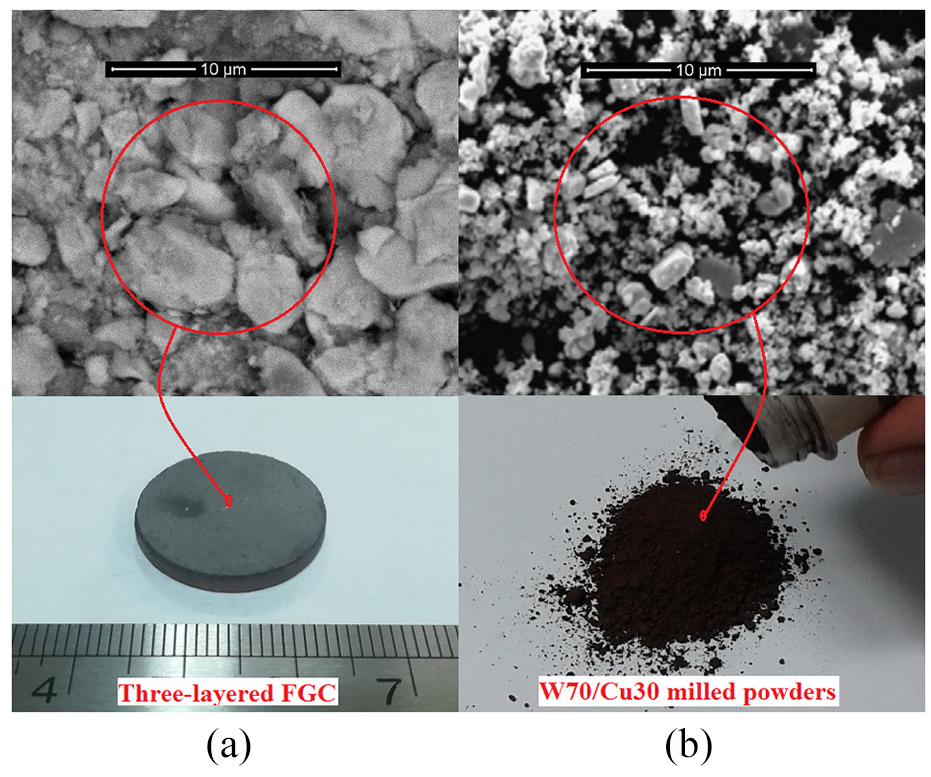
SEM images of (a) top layer in three-layered FGC, and (b) W/Cu milled powders.
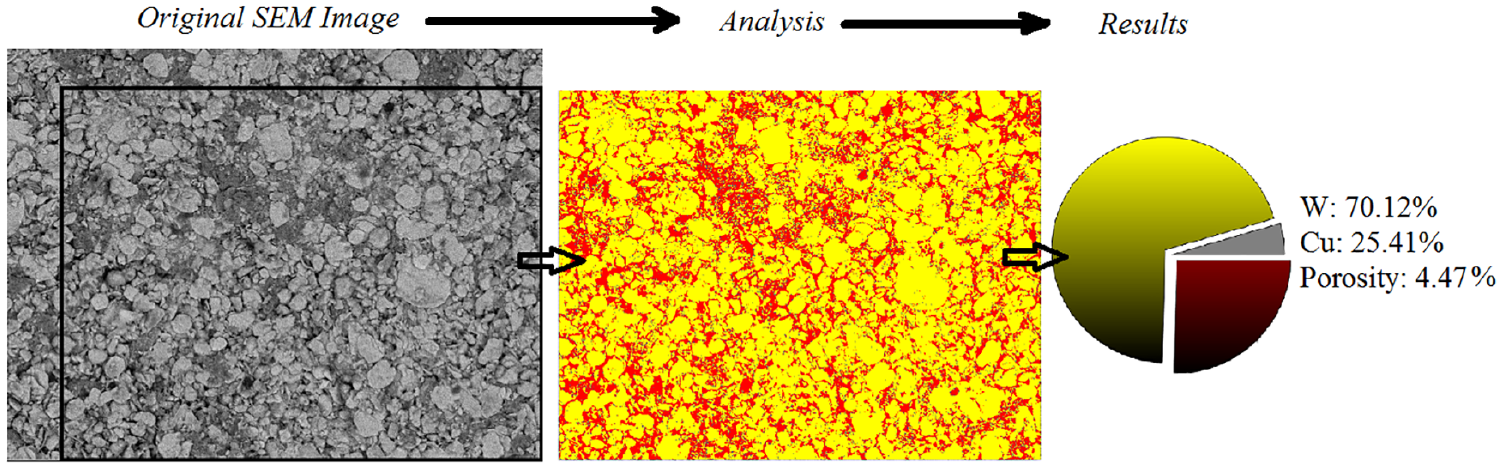
SEM analysis of the three-layered FGC (W70-Cu30 %) after sintering.
Figure 6 illustrates the SEM image of the intermediate layer in the three-layered FGC sample. According to Figure 6(a), the sintering process can be broken down into three stages, initial, intermediate, and final sintering. To control the accuracy of the sintering process, quantitative image analysis was used to measure the particle size and neck size. The average circular diameter of three particles (A, B, C) shown in Figure 6(b) was D ∼ 9.5 µm, and the neck size of A and B particles (blue lines) was ∼5.1 µm and ∼5.6 µm, respectively. It is worth noting that the neck size was more than one-half and one-third of the particle, proving that particles were in the final sintering stage.
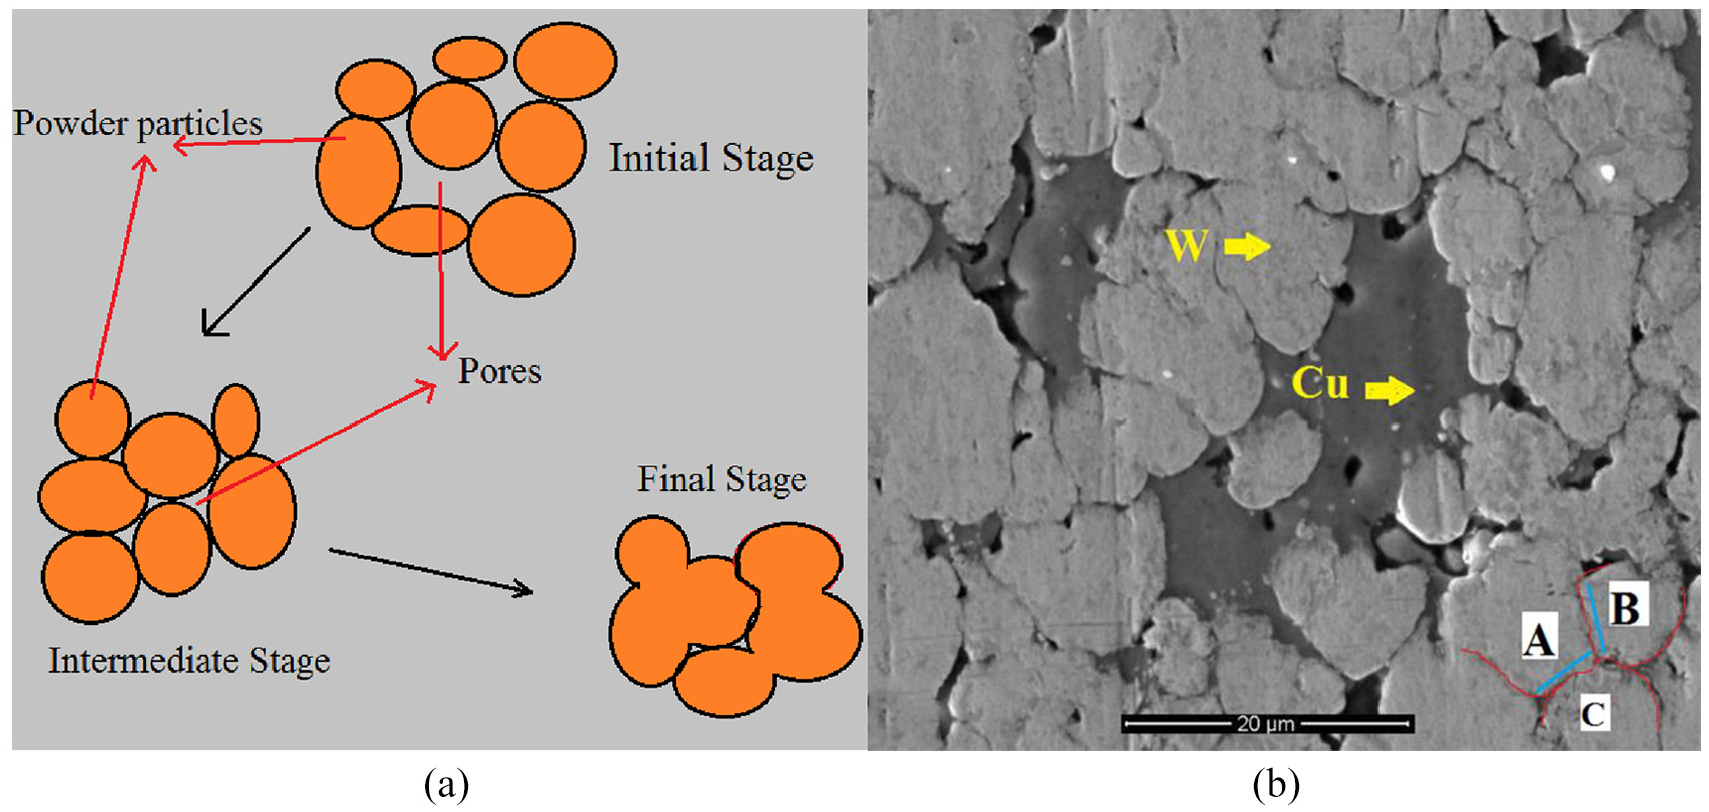
(a) The sintering process with a focus on changes in the pore structure, and (b) image analysis of the intermediate layer in the three-layered FGC.
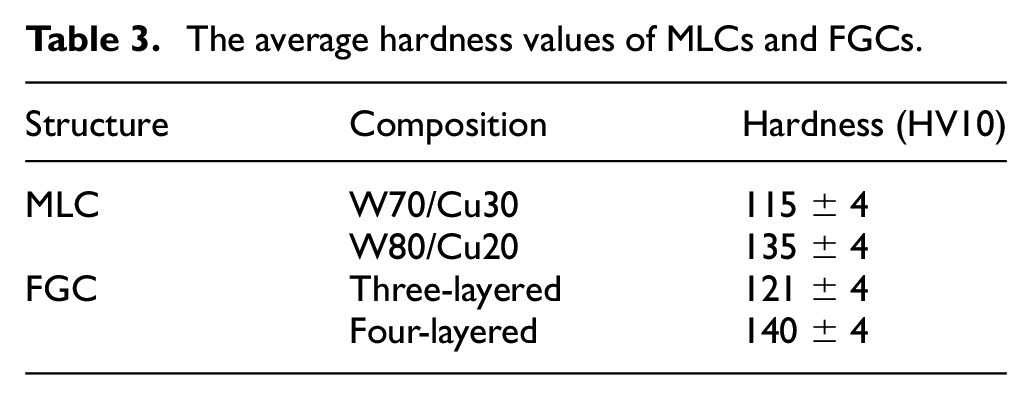
The Archimedes’s method was applied to measure the porosity percent and density of samples, as ASTM B962-14 standard.29,30 Then, the porosity of the sample was calculated based on theoretical density calculations. Figure 7 shows the abundance of porosities in each composite sample based on the experimental measurement under investigation. As reported by Yusefi et al., 29 minimum porosities were observed in the layer with W70/Cu30 composition, through composition change increased the porosity abundance. According to Figure 7, the minimum porosity belonged to three-layered and four-layered FGCs, which were about 4.47% and 4.65%, respectively. This indicates the neck growth during the sintering process (Figure 6(b)). The hardness of composite samples were measured using the ASTM E384 standard test method, with an indentation load of 10 kg and the dwelling time of 10 s. The hardness measurements were repeated three times for each sample. The hardness values of MLCs and FGCs are shown in Table 3. The average hardness of the four-layered FGC (140HV10) was 3.5% higher than that of the MLC sample with the same composition (W80/Cu20 MLC – 135HV10), whereas the average hardness of three-layered FGC (121HV10) was 5% greater than that of the MLC sample (W70/Cu30 MLC – 115HV10). As mentioned earlier, FGCs have higher hardness values and a higher melting point than traditional W/Cu composites. Therefore, the results of the present study can be ascribed to the unique structure of FGC materials, the proper sintering process under Argon atmosphere and the lower porosity content.
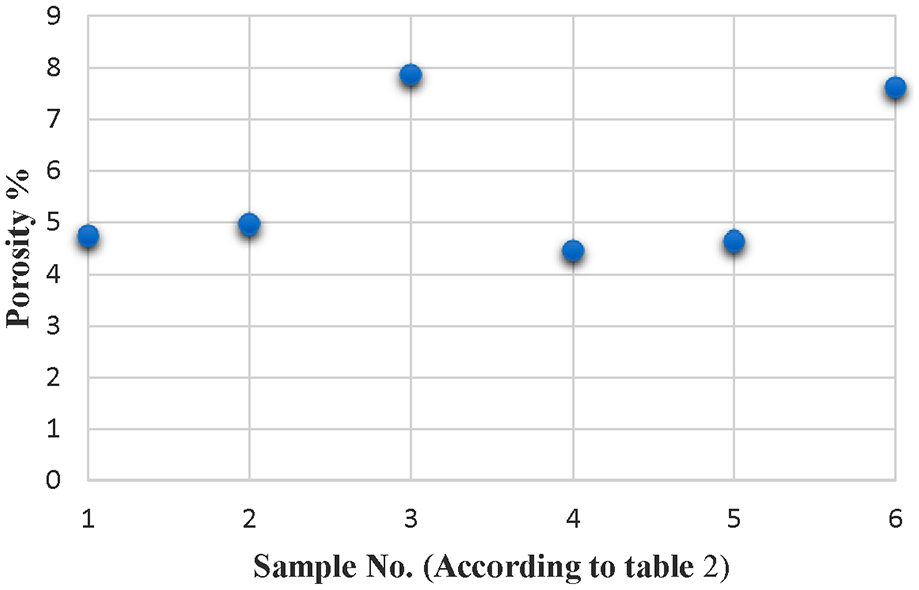
Porosity abundance of composite samples (according to Table 2).
The average hardness values of MLCs and FGCs.
Erosion morphology of MLC and FGC following vacuum arc discharge
Figure 8 depicts the SEM images of a two-layered FGC that serves as an ECM. Figure 8(a) and (b) show the surface morphology of samples experiencing 30 arc discharge cycles at 40× and 500× magnification, respectively. As illustrated in Figure 8(a), the surface morphology is uneven, and there are large areas of pick and gully with several bulges of varying sizes at the arc zone distributed over the ECM surface. Following arc discharge, the bonding copper was melted and evaporated due to its low melting point. Meanwhile, tungsten recrystallized due to its high melting temperature, leading to the ablation of W/Cu contact. As reported by Yusefi and Parvin W and Cu have no mutual solubility and there is no overlap of their sintering temperature ranges. 3 Therefore, every mixture of W and Cu forms W-Cu composite. Moreover, combination of W and Cu as a metal matrix composite or as FGC have recently been of extensive usage as PFCs in fusion reactors and electrical contact material (ECM). According to Figure 8(b), as Cu melts, W droplets with a higher temperature enter the Cu melt and form W particles in the solidified Cu area. Moreover, several apparent cracks with a width of 2 to 3 µm can be observed on the surface of W skeleton (as shown A–C). For two-layered and nine-layered FGC contacts, the first layer (W90-Cu10 wt.%) was tungsten rich, and spraying tungsten droplets on the surface of contact forged an inappropriate bonding between the particles. The magnetic field and the pressure of the plasma sputtered around the exterior are responsible for the cracks. Figure 8(c) shows EDS mapping of the surface morphology in Figure 8(b). The red zones in Figure 8(c) represent Cu distribution, and the yellow and green areas indicate the distribution of W and O, respectively. As can be seen, the W/Cu powders were homogenously mixed after the ball milling process.
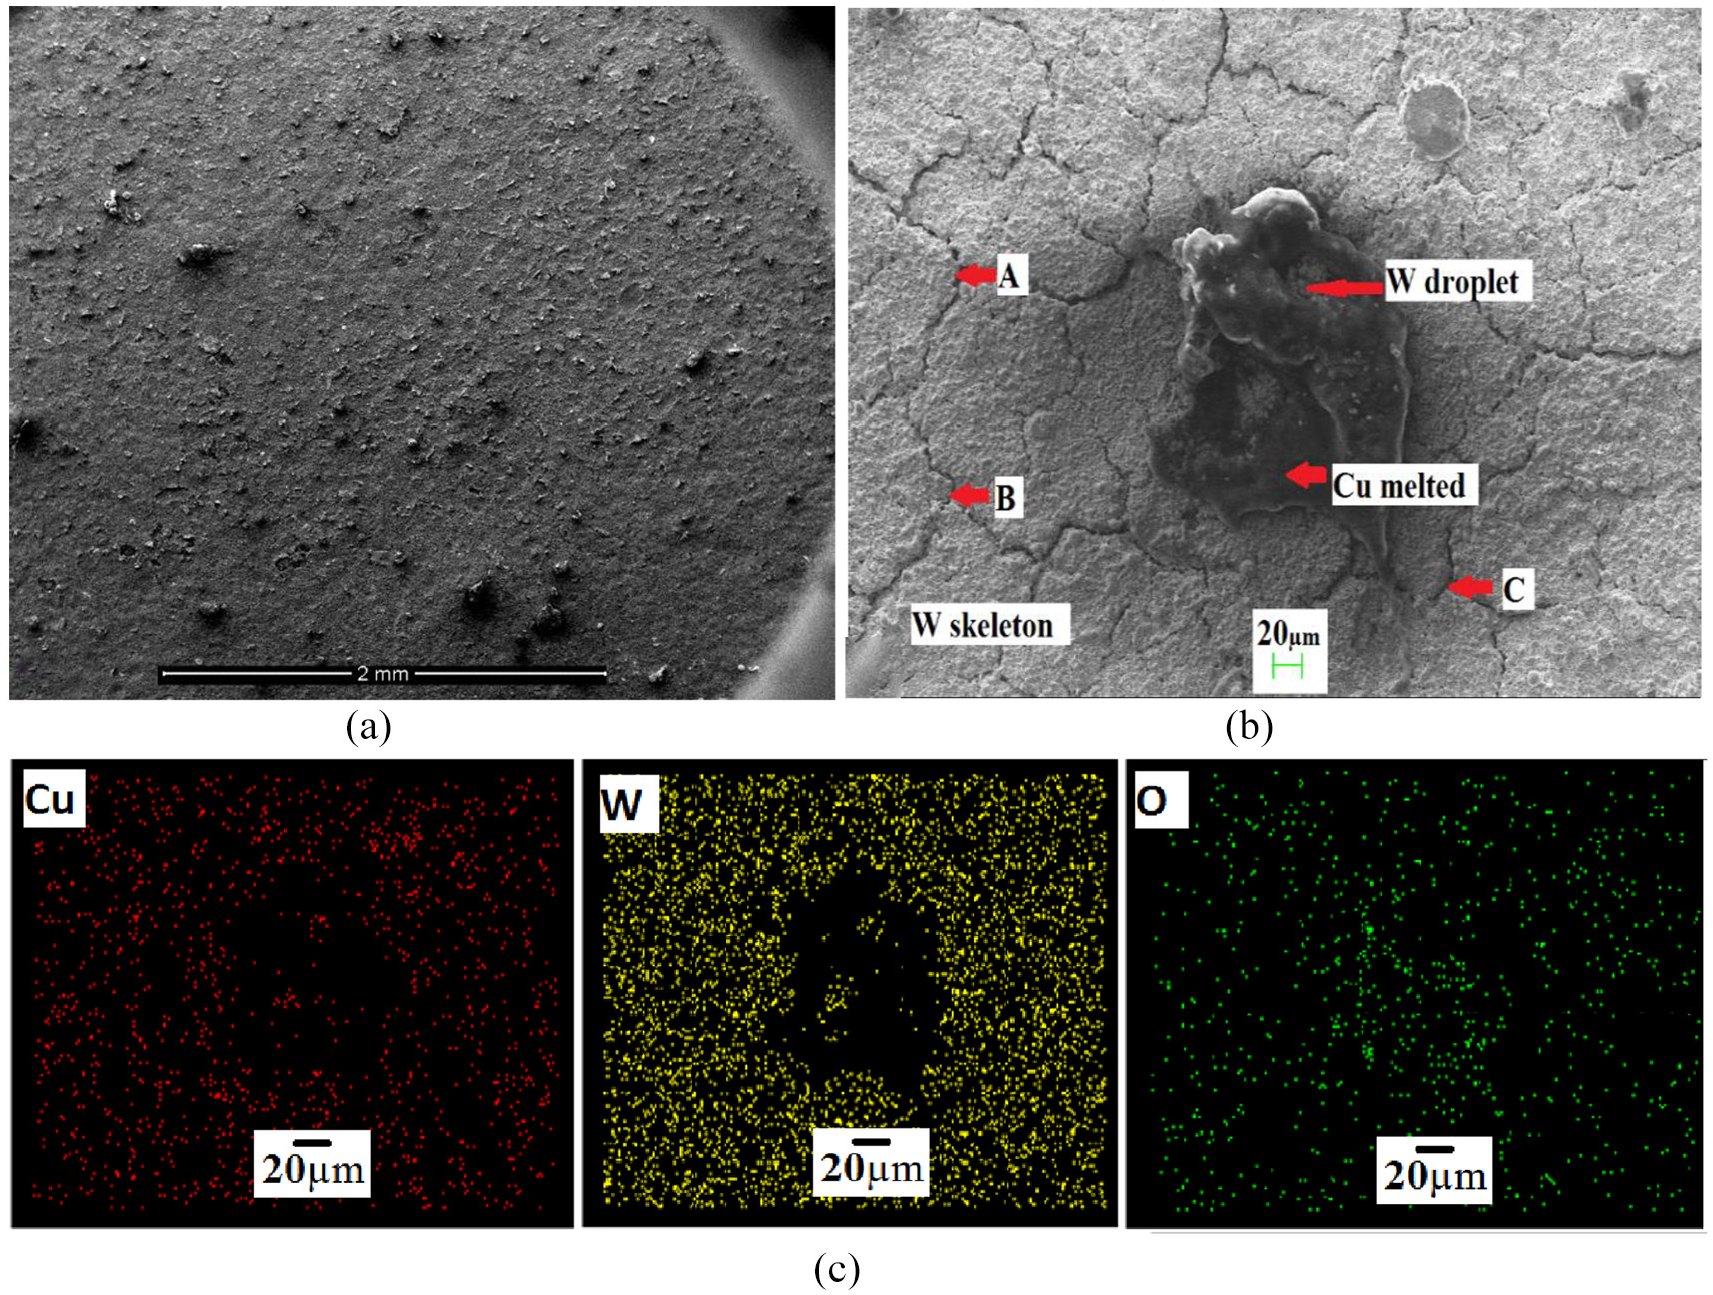
SEM and EDS images of the two-layered FGC: (a) surface morphology at 40×, (b) W droplets and Cu melted on theW skeleton at 500×, and (c) EDS mapping of the surface morphology in Figure 8(b).
Figure 9 shows the SEM images of the three-layered FGC contact after 30 vacuum arc discharges. Figure 9(a) demonstrates the erosion area at the central region below the arc discharge. A part of the arc erosion area corresponded to the coral figure (Figure 9(a1)). The coral structure was formed within the arc discharge process where the splash of a little molten Cu droplets around the tungsten skeleton created small holes. At the end of the discharge, the temperature fell, and molten droplets were cooled. Finally, irregular particles were deposited on the tungsten skeleton and formed small holes that shape the typical coral structure.
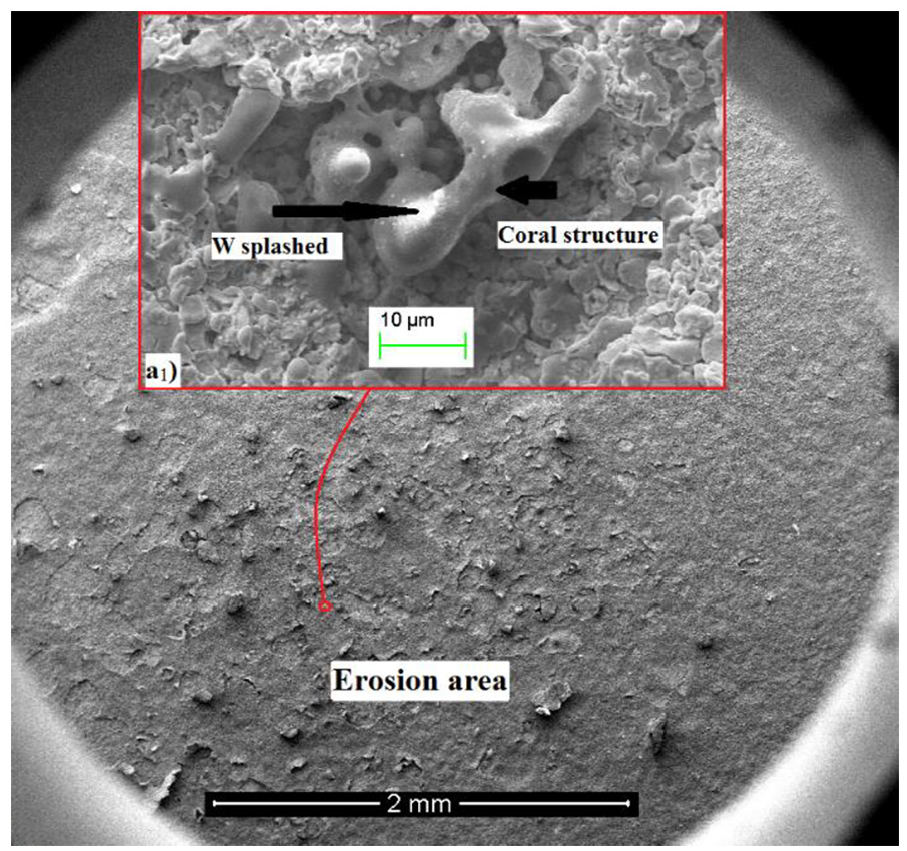
SEM images of the three-layered FGC contact: (a) surface morphology at 30×, and (a1) the formation of coral structure.
Figure 10 shows the SEM image of characteristic parts at 2500× magnification after 30 arc discharges. The red rectangles (denoted by A, B, and C) in Figure 10, which indicate zones with noticeable morphological differences, were elementally analyzed. Table 4 shows the elemental composition of specified zones in Figure 10. According to this table, Cu content in zone A (26.90 wt.%) resembled its nominal weight percent whereas the weight percent of copper in zone B and C were significantly lower than their nominal value. This could be attributed to higher vaporization, and oxidation during sintering and arc discharge processes, as well as the sputtering of copper particles, which lead to the transfer and mass loss of Cu.
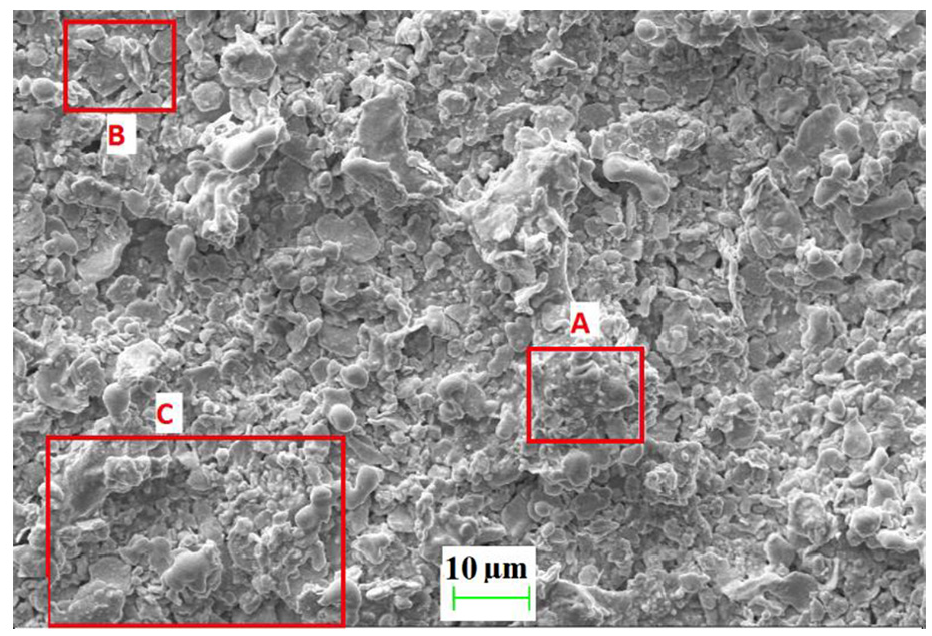
SEM image and chemical composition of the impacted area after 30 arc discharges.
Chemical composition of specified zones in Figure 10.
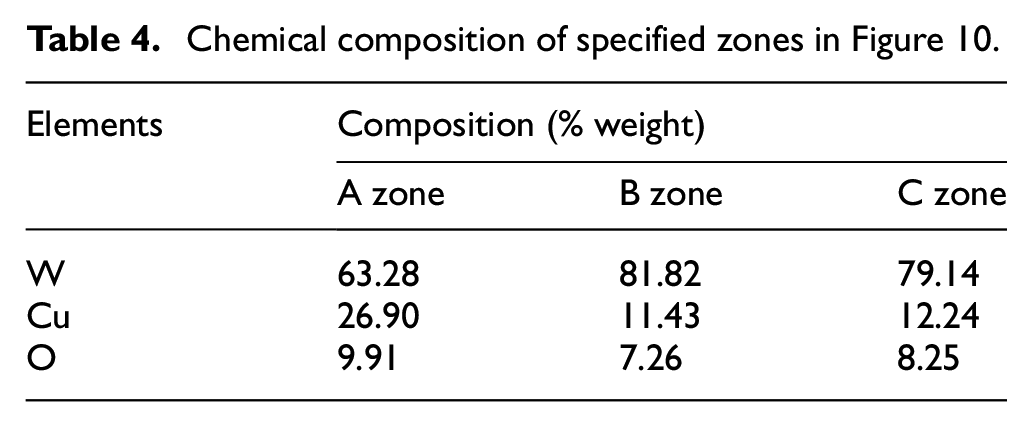
Figure 11 shows the surface morphology of W80/Cu20 MLC after 30 vacuum arc discharges. As marked by A and B points, several bulges of different size have emerged on the surface and increased the contact resistance. The mechanism leading to the formation of pores on the surface contact was the initial melting of the surface caused by the plasma. A rise in increasing temperature, tungsten and copper were evaporated, and the gaseous oxides were confined by molten metals. Once molten droplets were cooled, the gaseous oxides trapped in molten droplets form pits and pores on the surface (as shown by C and D). Likewise, surface morphology studies exhibit the formation of particulate oxides within the microstructure due to the preferential oxidation of Cu. It is clear that Cu begins to evaporate at temperatures above 2000°C and it penetrates through porosities and grain boundaries. Therefore, Cu can react with oxygen and subsequently condense pores and bulge surfaces in the form of oxides (as shown by black circles).
SEM images of W80-Cu20 MLC: (a) low magnification image, and (b) high magnification image of the eroded surface layer.
Erosion behavior and electrical properties
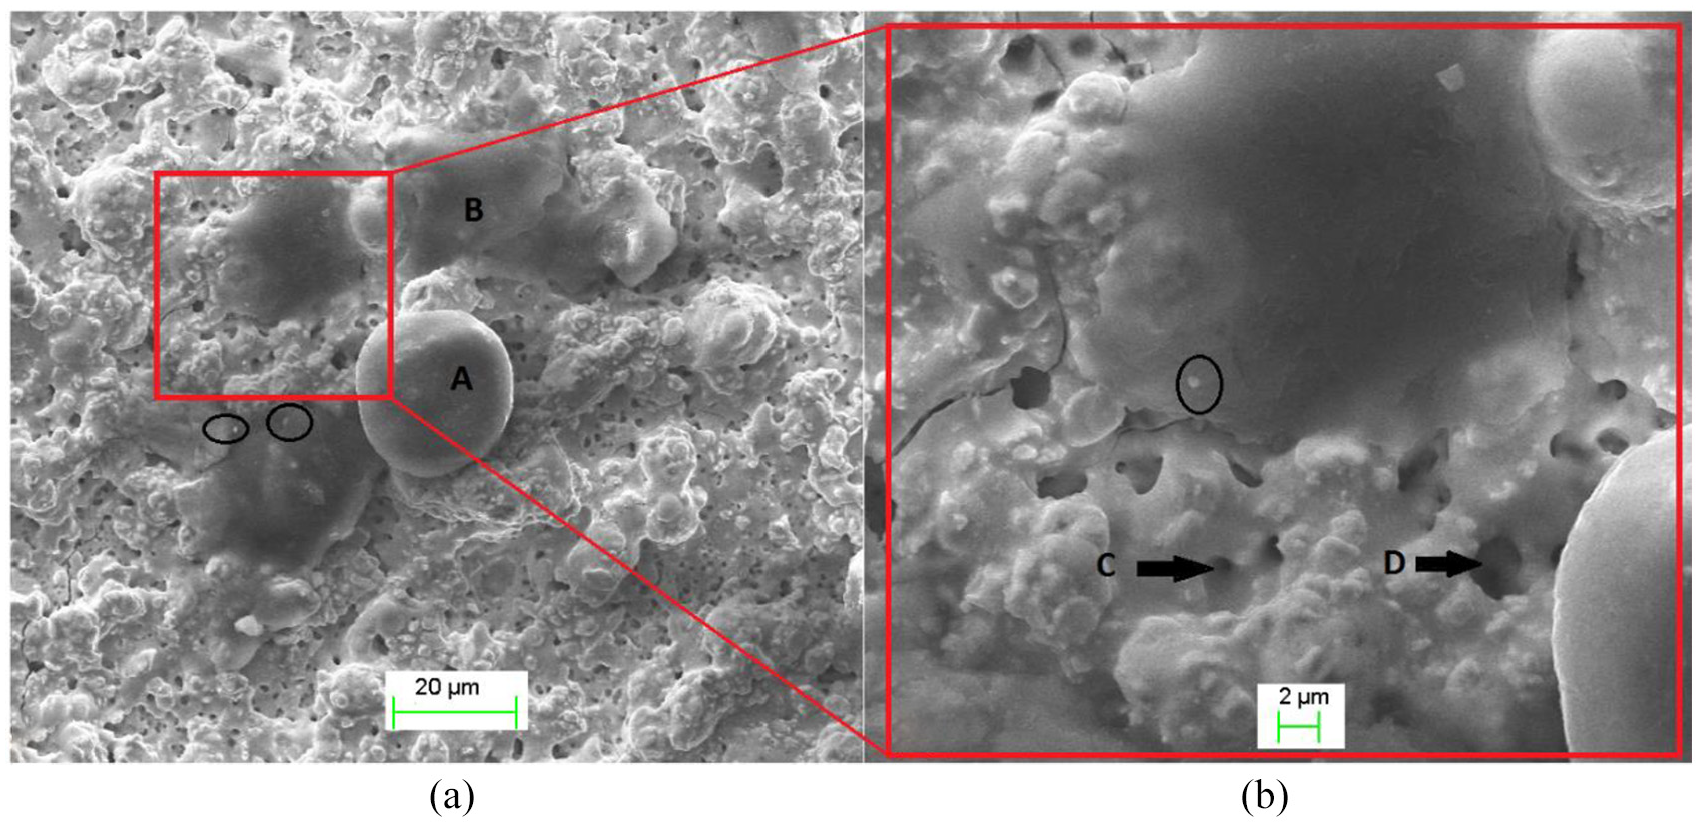
Generally, the arc erosion rate is related to the performance parameters such as hardness, thermal and electrical conductivity, work function and the surface state. Figure 12 shows the electrical resistivity and weight loss of MLC and FGC samples that were subjected to 30 vacuum arc discharges at 7 kV. It can be seen that the electrical resistivity of W/Cu FGCs has risen with the number of layers and W content. The minimum and maximum electrical resistivity belongs to the two-layered (∼55 mΩ.m) and nine-layered (∼610 mΩ.m) FGCs, respectively. The average electrical resistivity in four-layered FGC (∼330 mΩ.m) was 9% lower than MLC samples of the same composition (W80-Cu20 MLC – 360 mΩ.m). This can be attributed to the decreased W content and increased Cu content in successive layers. Additionally, the erosion-induced weight loss increased significantly with the number of arc discharge. This behavior is chiefly due to the appearance of sharp edges, microcracks, areas with peeled off materials and burrs on the surface of composites, which were bombarded with electrons. According to Figure 12, the weight loss of W80/Cu20 and W70/Cu30 MLC samples was equal to 1.5 and 1.8 mg, respectively. The weight loss for the two, three, four, and nine-layered FGC samples were 0.9, 1, 0.7, and 2.1 mg respectively. The minimum weight loss belonged to the four-layered FGC sample, which exhibited the highest resistance to erosion due to its rich tungsten layers and relatively high thermal and electrical conductivity. For FGC samples, the weight loss dropped when the initial MLC samples with different compositions developed into FGC samples (most notably in the four-layered FGC). It can be stated that a larger number of Cu particles in the successive layers improves heat transfer and reduces the electrical resistivity. As a result, the maximum heat energy is applied to the entire surface instead of local domains. Hence, the results suggest that in the FGC structure, the layer arrangement and W/Cu content play a significant role in thermal and electrical properties of an ECM.
Variation of mass loss and electrical resistivity of W/Cu composites with the number of arc discharge cycles.
To explore the arc erosion evolution of FGC and MLC contacts in vacuum, the microscopic structure of different samples, as shown in Figure 13, were studied to compare the surface morphology. Figure 13(a) and (b) show the SEM images of the three-layered and two-layered FGC contacts at 200x, respectively. As can be seen, after 30 vacuum arc discharge cycles, the erosion area expanded to the whole surface area of samples. The peeling phenomenon, which is displayed as the dark area in Figure 13(a), is also distinguishable. The results closely align with those obtained for weight loss rate and electrical resistivity (Figure 12). According to Table 4, the average amount of oxides was 8.47%, and a portion of it representing the existing Cu oxides. As illustrated in Figure 13(a), due to the higher Cu content in the first layer (Cu 30 w%), greater amounts of Cu droplets were distributed on the whole surface. It appears that almost all arc discharges occurred in the copper phase and W/Cu boundaries, where copper was intensely sputtered. In Figure 13(b), the first layer of the two-layered FGC was rich in tungsten (90 wt%), and due to inappropriate bonding between W particles and Cu matrix, numerous cracks and erosion areas may appear (as marked by points A and B) on the whole surface following the repetition of arc discharges. Figure 13(c) and (d) show the surface morphology of the four-layered FGC and W80/Cu20 MLC samples, respectively. According to Figure 13(c), due to low Cu content in W80-Cu20 layer (the first layer), the Cu ablation and evaporation require less heat energy. Therefore, the heat would be concentrated on the W phase, leading to the melting of W-rich particles. Afterwards, the molten W is cooled rapidly after the arc is extinguished. When the arc discharge restarts, the surface covered by W particles will become more resistant to erosion and erosion regions would be smoother than other samples. As shown in Figure 13(d), the number of bulges and uneven regions are greater than samples with the FGC structure (Figure 13(c)). This can be attributed to the heat concentration and relatively low heat transfer in MLC structures.
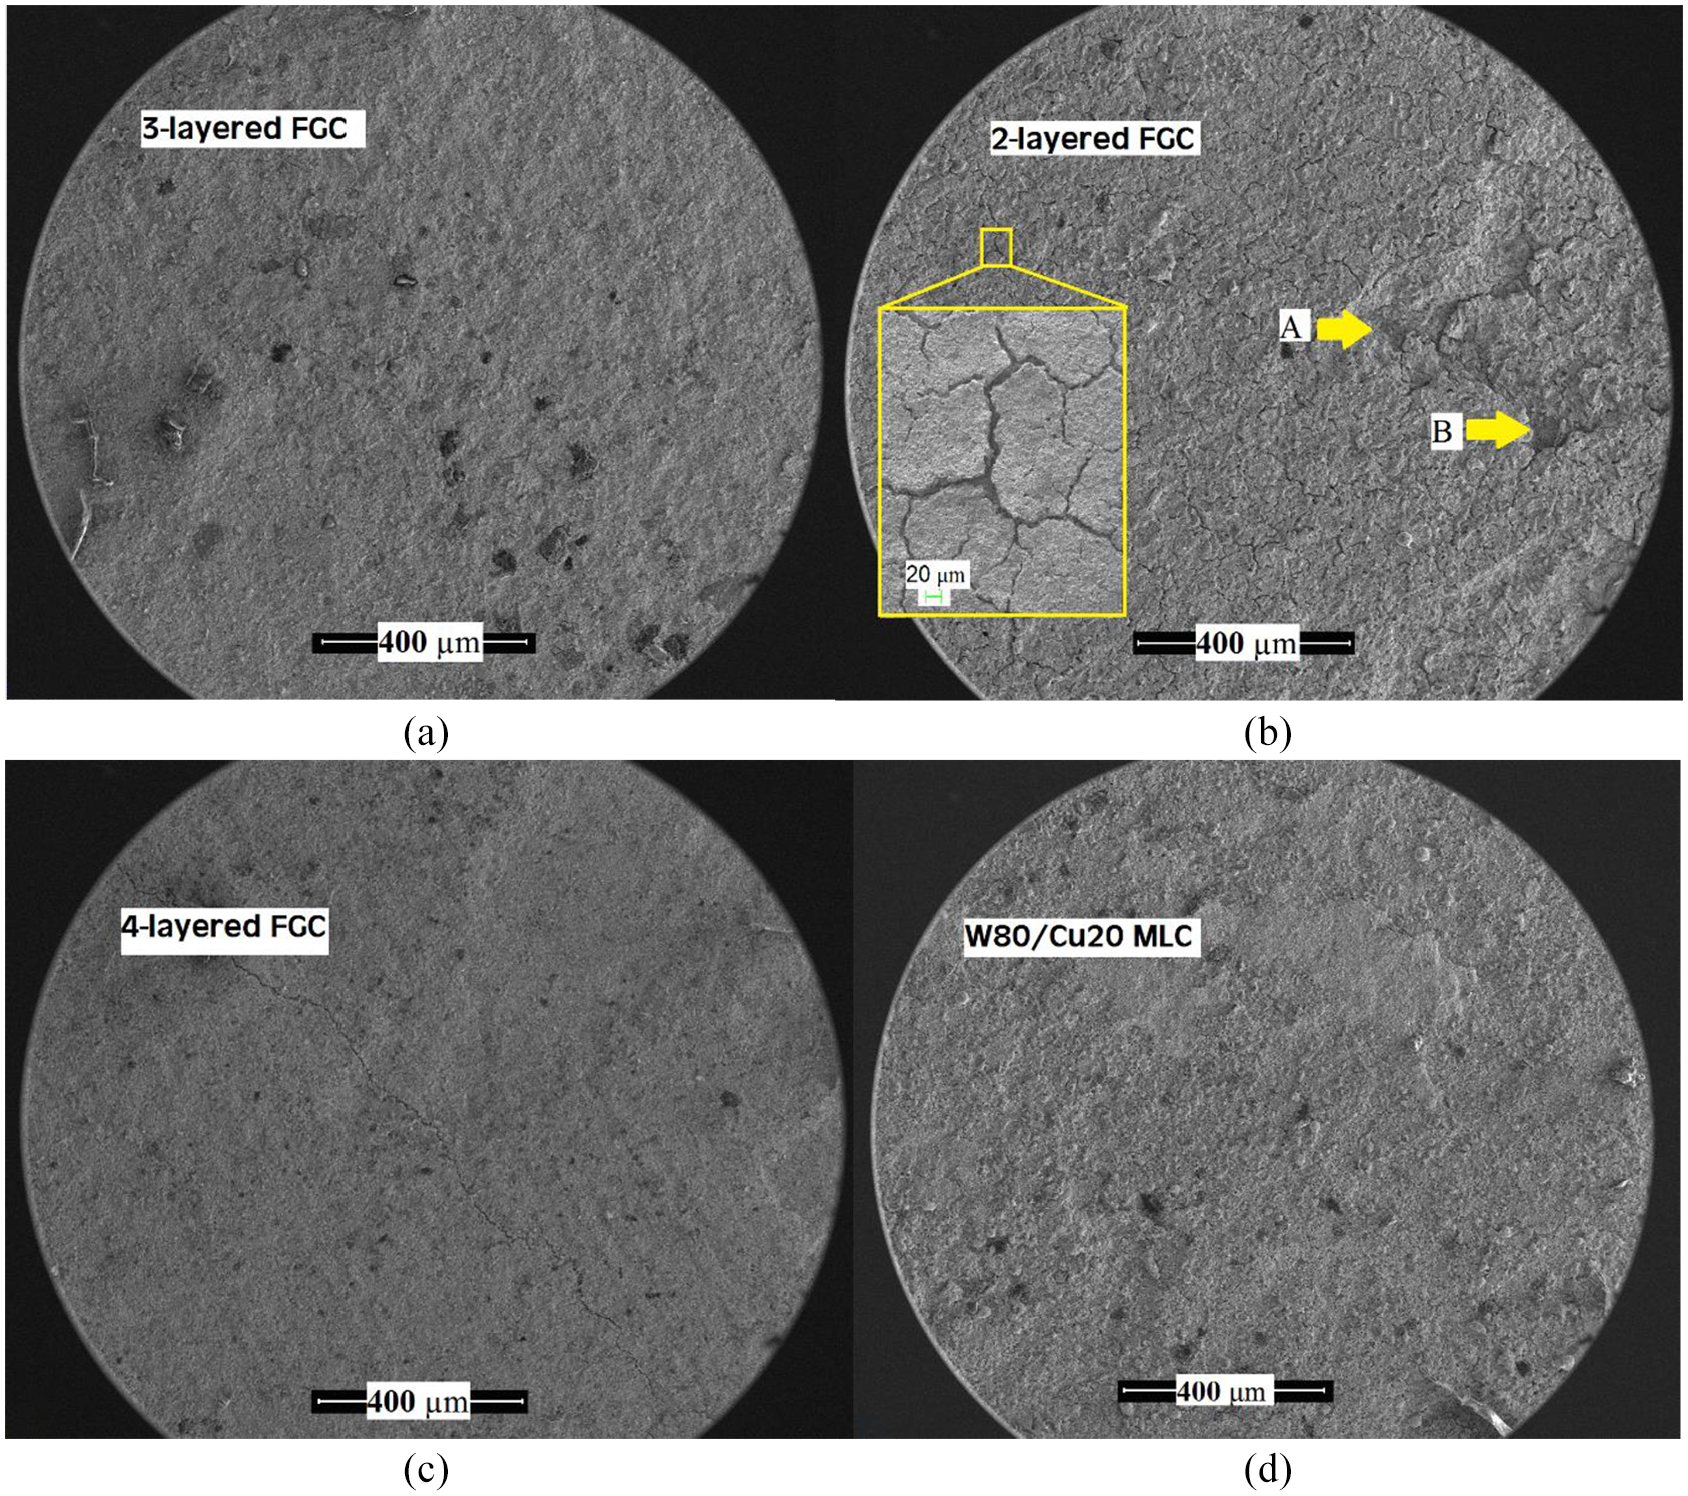
The surface morphology after 30 vacuum arc discharge cycles in: (a) three-layered FGC, (b) two-layered FGC, (c) four-layered FGC, and (d) W80/Cu20 MLC.
Figure 14 depicts an X-ray diffraction pattern of four-layered FGC contact before and after vacuum arc discharge. According to this pattern, the peaks of the close-packed plane of Cu (111) (marked by b) and W (110) (marked by a) had the highest intensity before the vacuum arc discharge. The above diffraction peaks retained relative intensity after the vacuum arc discharge. As reported by Wei et al., 26 the work function of Cu element is lower than that of W and the vacuum arc discharge is more likely to take place in the Cu phase of W/Cu alloys. During the vacuum arc discharge process, the work function (ϕ) represents the energy required to immediately remove an electron from the solid surface to a point in the vacuum outside the solid surface. 31 According to the principle of field and thermionic emission, the number of electrons escaping from the surface is estimated by Richardson’s equation as follows:
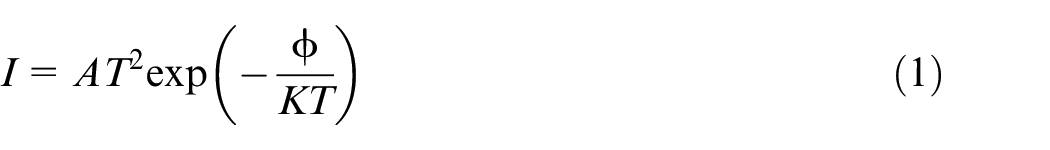
where I is the electron density, ϕ is the work function, T is temperature, K is thermal conductivity, and A is a constant. The work function of the close-packed plane Cu (111) was 4.58 eV, which is smaller than that of a close-packed (110) plane in W (5.18 eV). According to equation (1), the number of electrons liberated from the surface of Cu (ICu) is larger than IW (ϕW > ϕCu). Hence, when the arc discharge commences, electrons initially flow from the Cu phase with the highest number of electrons escaping from the surface. As a result, the vacuum arc discharge mainly occurs in the Cu phase. Consequently, one of the possible arc erosion mechanisms can be the difference between the work function of W and Cu. In addition, (200) diffraction peak of Cu (as shown by c1) has a lower intensity compared to the corresponding diffraction peak before vacuum arc discharge (as shown by c). This can be attributed to the preferred directional growth of the Cu phase after the arc discharge.
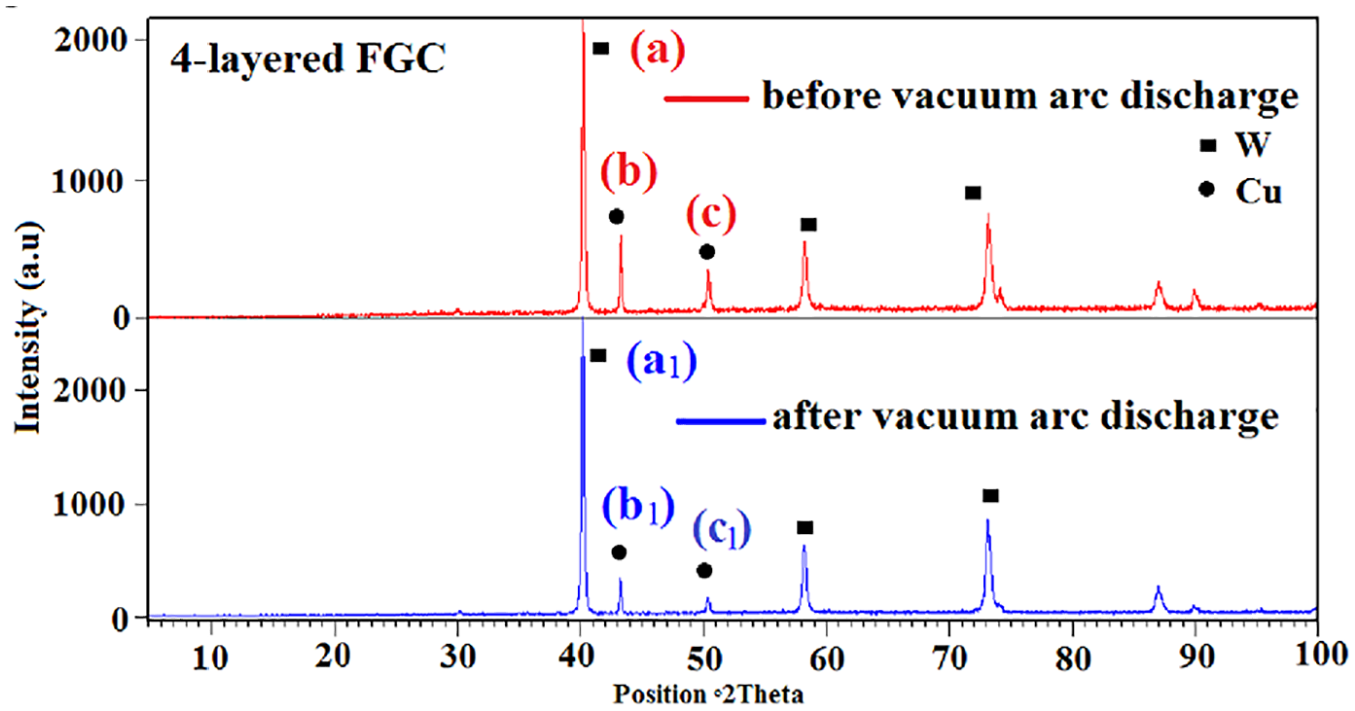
X-ray diffraction patterns of the four-layered FGC.
The characteristics and mechanism of arc erosion are highly complicated. Among parameters of electrical, mechanical and environmental, the material parameters exert an obvious effect on arc erosion of contacts. As revealed by the contact surface morphology after arc erosion, the heat and energy generated by the arc are intensively released on the surface and near surface layer of contacts. Therefore, for contact materials of W/Cu FGC, the ability of arc erosion resistance is closely linked to its microstructure and properties. Figure 15 shows the arrangement of layers as well as the heat flux behavior in W80/Cu20 MLC and four-layered FGC. According to Figure 15(a) and (b), when the arc power was transmitted to the contact, the power flux (Pi) was displaced alone the radial and z-oriented channels paths. The radial transport process involves mechanisms that gather radiation and thermal energy equally in all directions such as thermal energy and radiation. The channel transport process entails mechanisms that transport energy toward the contact. According to Figure 15(a1), the heat energy was channeled to the neighboring regions by Cu particles and passed through W/Cu particles. However, due to low Cu and high W content in the whole contact (20 and 80 wt.%), the increased electrical resistivity was higher than that of the FGC structure (most notably in three and four-layered FGCs). Therefore, the heat transfer was reduced and the heat was concentrated on the surface contact instead. As illustrated in Figure 15(b1), for the four-layered FGC, a higher Cu content in successive layers appears to improve thermal and electrical conductivities, and the heat flux (Q) can pass more conveniently through the intermediate layers. Hence, it can lead to a lower concentration and subsequent surface damage. Therefore, the results of this research exhibited that in a properly sintered FGC structure (especially four-layered FGC), the microstructure can be improved, and the splash of liquid Cu and the W/Cu contacts can be significantly diminished.
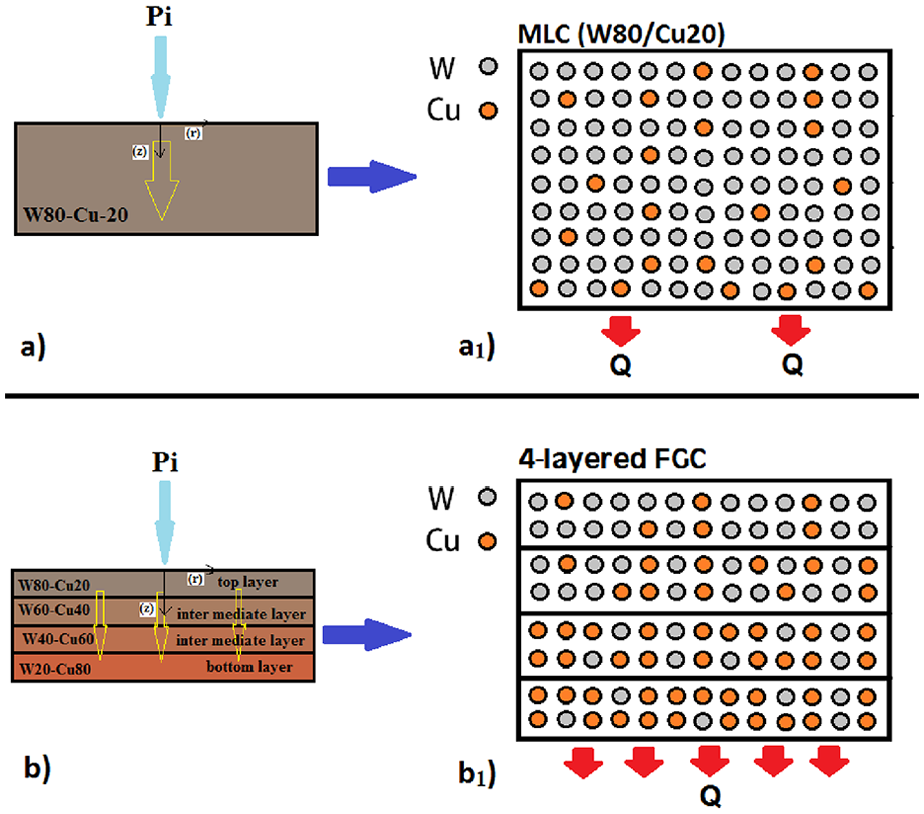
The arrangement of layers as well as the heat flux behavior in MLC and FGC structures.
Conclusion
In this study, mono-layered and FGCs were fabricated by powder metallurgy. The porosity abundance in FGC composites dropped compared to MLC composites due to sintering process in a tube furnace under argon atmosphere. Then performed an experimental investigation of the vacuum arc erosion behavior of W/Cu alloys with MLC and FGC structures. Before vacuum arc erosion testing, the microstructure evolution, which reflected improvement due to the sintering process, was studied through SEM images. After testing and analyzing specimens, the possible arc erosion mechanism was investigated, and the following results were obtained:
The tungsten and Cu contents of composites were in close agreement with their nominal values, which can be ascribed to the efficient sintering process in the tube furnace under the argon atmosphere.
The mechanism of arc erosion can be the difference in the work function of W (110) plane, and Cu (111) plane. In addition, it was concluded that the vacuum arc discharge of W/Cu initially occurred in the Cu phase.
A mechanically alloyed W/Cu with FGC structure can significantly improve the solid-state sintering behavior without creating any obvious cracks, or producing an intermetallic compound.
In the FGC structure, the arrangement of layers and W/Cu content play a significant role in thermal and electrical properties, and it has a prominent effect on decreasing the weight loss of arc erosion in W/Cu composites.
The minimum porosity occurred in three-layered and three-layered FGCs, which was due to the neck growth during the sintering process.
In the FGC structure, especially in four-layered FGCs, the heat transfer was improved and the heat concentration on the surface contacts was diminished due to higher contents of Cu particles in the successive layers and subsequently higher thermal conductivity.
For FGC samples, the weight loss declined in FGCs, most notably in four-layered FGCs. The lowest weight loss (0.7 mg) was related to the four-layered FGC sample.
The surface of the four-layered FGC sample was smoother and more even. The erosion areas were also smaller, exhibiting anti-erosion behavior compared to other FGC and MLC samples.
Therefore, the findings of this experimental study revealed that FGC samples, especially the four-layered FGC composite, had improved heat transfer and prevented heat concentration on the contact surfaces and consequently reduced the surface damage. It can provide a certain reference for selection and design of ECM.
Footnotes
Declaration of conflicting interests
The author(s) declared no potential conflicts of interest with respect to the research, authorship, and/or publication of this article.
Funding
The author(s) received no financial support for the research, authorship, and/or publication of this article.