
Abstract
Many carbon fibre reinforced polymer composite parts need to be edged trimmed before use to ensure both geometry and mechanical performance of the part edge matches the design intent. Measurement and control of machining induced surface damage of composite material is key to ensuring the part retains its strength and fatigue properties. Typically, the overall surface roughness of the machined face is taken to be an indicator of the amount of damage to the surface, and it is important that the measurement and prediction of surface roughness is completed reliably. It is known that the surface damage is heavily dependent on the fibre orientation of the composite and cutting tool edge condition. This research has developed a new ply-by-ply surface roughness measurement methods using optical focus variation surface analysis and image segmentation for calculating areal surface roughness parameters of a machined carbon fibre composite laminate. Machining experiments have been completed using a polycrystalline diamond edge trimming tool at increasing levels of cutting edge radius. Optical surface measurement and µ-CT scanning have been used to assess machining induced surface and sub-surface defects on individual fibre orientations. Statistical analysis has been used to assess the significance of machining parameters on Sa (arithmetic mean height of area) and Sv (areal magnitude of maximum valley depth) areal roughness parameters, on both overall roughness and ply-by-ply fibre orientations. Empirical models have been developed to predict surface roughness parameters using statistical methods. It has been shown that cutting edge degradation, fibre orientation and feed rate will significantly affect the cutting mechanism, machining induced surface defects and surface roughness parameters.
Keywords
Introduction
The use of carbon fibre reinforced polymer (CFRP) composite materials has increased radically in automotive and aerospace industries. Yet, fully cured manufactured components often still require edge trimming operations to achieve final net shape. During cutting of carbon fibre surfaces, machining induced defects are often generated including delamination, surface roughness, fibre pull-out and un-cut fibres. These machining induced defects are not acceptable in production parts for industrial applications and could reduce surface integrity and performance of components.
Previous research has shown that induced surface roughness in a milling and edge trimming operation is significantly affected by ply orientation and tool cutting edge radius (CER).1–5 Cutting parameters and un-cut chip thickness have additionally been shown to have a critical effect on machining induced surface quality and pitting magnitude.6–8 Chen et al. 9 have compiled a thorough analysis of the different types of cutting mechanism for the 0°, 45°, 90° and 135° fibre orientations, using micro textured tools in a composite milling process, and shown how fibre orientation will influence the machined surface quality. Specifically, in composite machining, it has been shown that ply orientation will significantly dictate the machined surface topography, cutting mechanism and defect types.10,11 A representation of the different material cutting mechanisms in relation to fibre orientation for a fibrous composite machining process is shown in Figure 1. When this diagram is extrapolated to a multidirectional edge trimmed surface it can then be inferred that there will be a through thickness variation in ply by ply cutting mechanism and ply-induced machining defects, which has been verified by the literature. 1
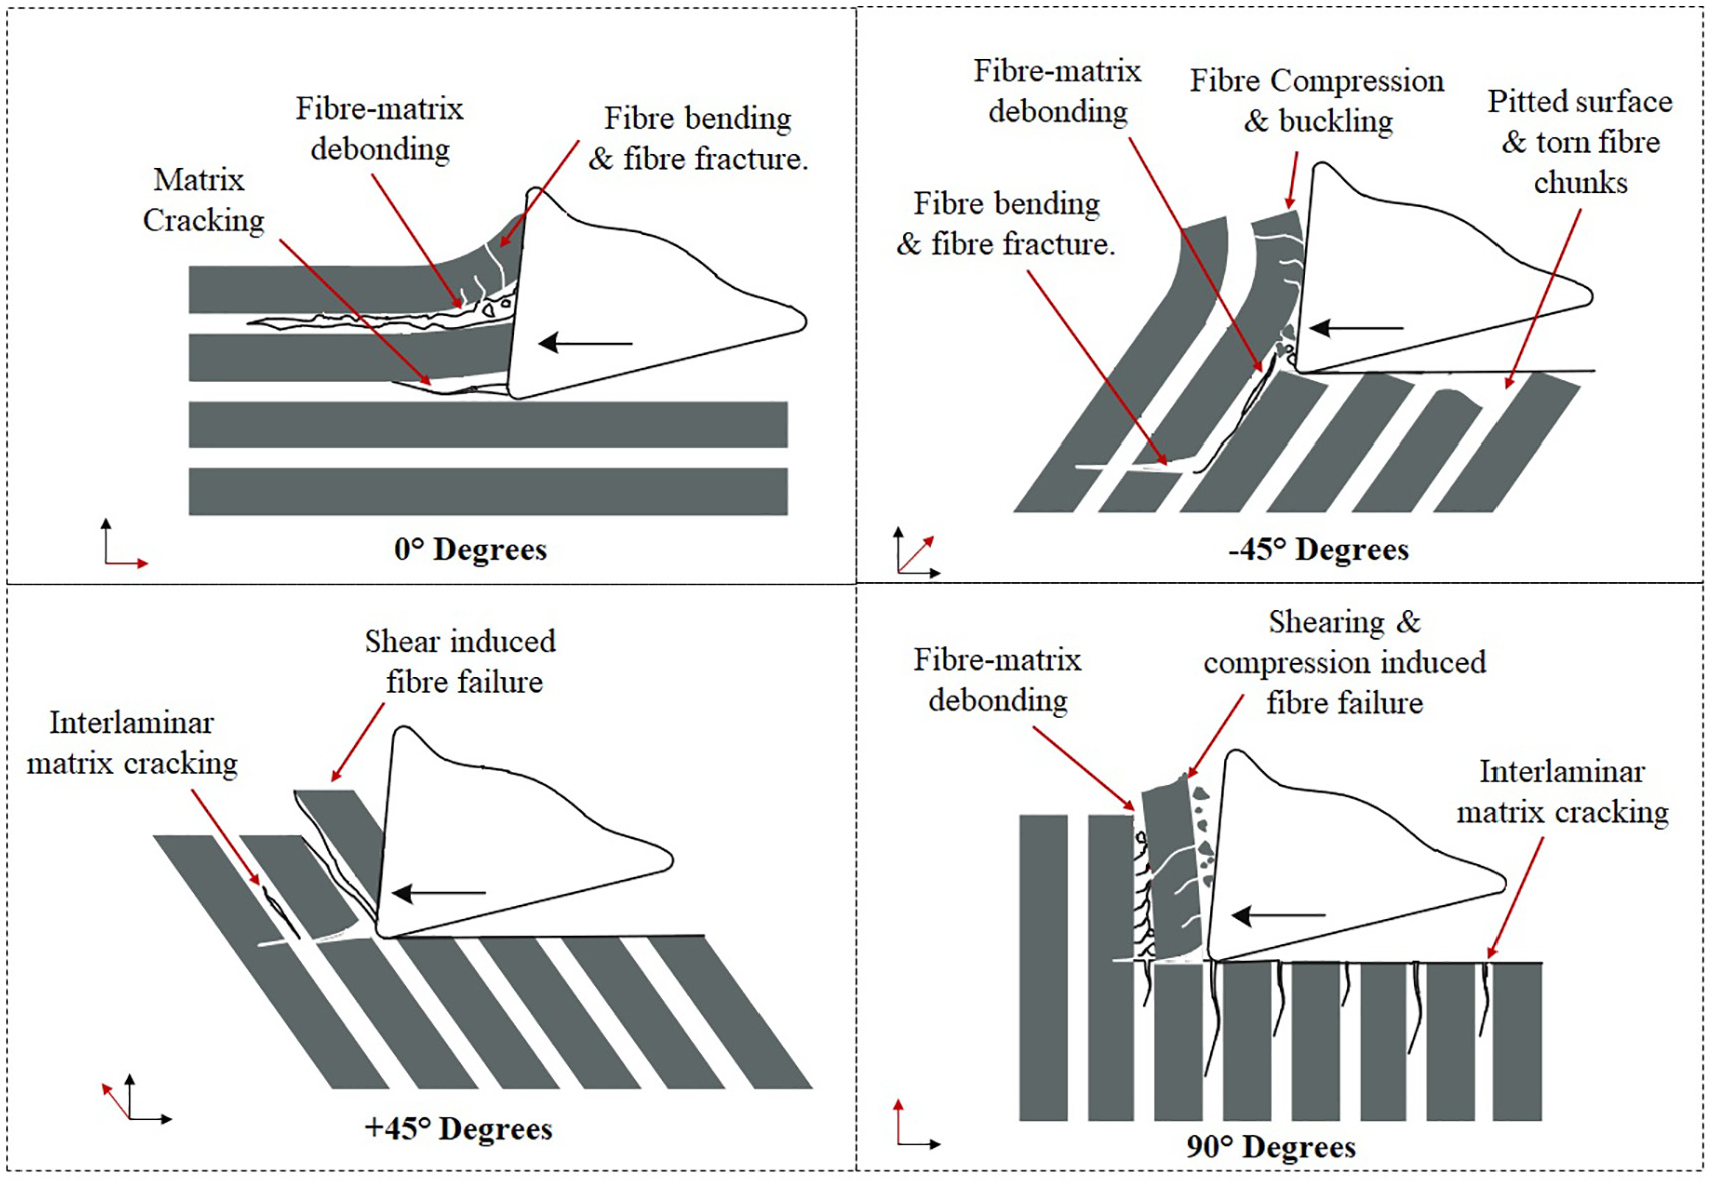
Fibre orientation effect on machining induced material failure mechanisms for a composite laminate. 1
Previous studies have indicated that surface defects and machining induced surface roughness can affect the mechanical performance of composite material.12–14 It has been shown by Haddad et al., 15 that the cutting speed will have a significant effect on surface roughness. Further research indicates that surface roughness will play a role in reducing inter-laminar shear strength in IMS/977-2 composite samples. 13 Haddad et al. also showed that in a thermoplastic toughened T700/M21-GC composite that the surface roughness and the material mechanical properties were less affected by machining.
Other research has shown that cutting parameters and thermal effects generated by machining can affect optically measured surface roughness parameters.16–18 Sheikh-Ahmad et al. 19 showed that surface topography will be dependent upon local fibre orientation and machining parameters. Reducing chip effective thickness (which is a function of feed and cutting speed) produced an improved surface quality, which was shown using the RZ (10 point average) roughness parameter.
Review of state-of-the-art measurement methods and statistical modelling for heterogeneous materials
It has been shown that standard surface roughness metric Ra (arithmetic mean height of profile line) measured using a stylus may not give a fully reliable representation of a machined composite surface.6,8,20 A machined multidirectional composite surface has been shown to have a non-homogeneous surface: this has been shown in the literature using various methods, including computed tomography (CT), scanning electron microscopy (SEM) and optical focus variation measurement techniques.11,12,16,21 Other researchers have used advanced techniques to assess sub surface damage including terahertz imaging and epiflourescent microscopy.22,23 Wang et al. 24 have used a new image subtraction method to quantify the extent of delaminated fibres on an edge trimmed edge using an image subtraction method. SEM imaging, scanning acoustic microscopy and surface roughness measurements have also been applied to assess novel processes for cutting fibre composites such as laser cutting. 25
Material non-homogeneity will affect surface roughness measurements; it has been highlighted in the literature that stylus measurements can suffer from a number of issues. These include errors caused by the narrow width of the sampling region with a stylus and the uncertainty caused by measuring in either the parallel or in the transverse direction to the laminate ply direction. Teicher et al. 26 have compared confocal, focus variation and tactile methods for measurement of surface roughness. They have used the Ra, Rz, Rmax and Rt to compare surface roughness parameters along three different positions on the sample. Their work has been exemplary in comparing the three different measurement methods and has concluded that the Ra parameter is a poor predictor of surface roughness in a composite surface. Yet, they have not accounted for the effect of fibre orientation in the directionality and position of their measurements, which is difficult to obtain using profile line parameters.
Another problem with stylus measurements is that the contact of the stylus with the workpiece may cause scratching or wear of a soft workpiece like a composite. Additionally, un-cut fibres may push or stick to the stylus leading to uncertain results. As a consequence, non-contact methods, including focus variation and areal surface roughness parameters have shown promise as improved methods of characterising defects, surface topography and machined surface roughness. Geier and Pereszlai 27 have compared focus variation device and stylus profilometer for the measurement of surface roughness of a uni-directional composite. Their results have shown a good comparison between the two measurement methods for three different tool types, however they have not compared the two measurement methods on a multidirectional composite which has a non-homogeneous surface structure. Shyha et al. 28 have applied Sa surface roughness measurements for measurement of internal hole quality in drilled CFRP. They have shown that there was a variation in hole quality around the hole circumference, especially at the −45° fibre orientation – where there was greater damage and fibre spring-back. Interestingly the authors have also shown that hole entry and exit delamination defects can be reduced by maintaining the peel-ply on the ply outer surfaces.
Advanced statistical methods have also been applied to assess machining of composites. Abhishek et al. 29 have used a statistical method multi-performance characteristic index (MPCI) to convert three measured process responses (material removal rate, surface roughness and tool tip temperature) into an equivalent single response. Non-linear regression has then been used with Fuzzy logic to model the effects of process parameters on this single overall response and compared against Taguchi method. They have measured surface roughness using tactile methods in three positions and then taken an average. Other researchers have used neural networks and genetic algorithm for predication of surface roughness in composite materials. 30 Gara and Tsoumarev 31 have created predictive models for surface roughness measured in the longitudinal and transverse directions on a machined multidirectional woven composite. They have produced samples using fine, medium and coarse cutting teeth with knurled cutting tools. It has been shown that the surface roughness will be different in the longitudinal and transverse directions using the profile line parameter Ra.
As described above, previous research has made attempts at characterising the machining induced damage of composite surfaces using surface roughness measurements. However, attempts have not been made to account for the effect of cutting parameters on specific ply defects of different fibre orientations and the capabilities of roughness models to predict defects and surface roughness in a multidirectional laminate. They have also predominantly focussed on profile line parameters, which have limitations for a composite surface, rather than areal roughness parameters (like Sa and Sv). Consequently, reliable methods to predict, assess and limit machining generated surface defects and surface roughness can be developed further to improve characterisation specifically for machined multidirectional laminated composite materials, with non-homogeneous through thickness defects.
This research introduces new image analysis methods and statistical methods to characterise surface roughness and surface defects on an individual ply-by-ply scale. This has used a combination of advanced optical focus variation imaging equipment and image segmentation methods. This aims is to improve upon the surface analysis methods used to extract meaningful indicators of surface quality in machined composite surfaces and capture whether desired surface quality has been achieved in a machining process given varying fibre orientation specific defects. These surface analysis methods can also be used to compare surface quality of existing cutting removal processes like edge trimming with novel techniques such as water jet guided laser cutting of fibrous composites with a higher degree of accuracy. 32
Subsequent improvements in the methods for surface roughness characterisation applied to the identification of defects and the prediction of surface topography will have impact in future manufacturing practises of CFRP components to improve accuracy, reliability and confidence in surface quality and machining-induced damage detection. This can prevent rework of manufactured aerospace parts and improve the performance of in-service components by the use of more reliable techniques to detect surface defects, like pitting and fibre pull-put. These methods can also be put to further application for automated on-machine inspection and process monitoring techniques to be able to capture a better understanding of machining performance in real-time. Better methods and algorithms for prediction of surface roughness measurements can be implemented to reduce operator time spent on post-machined surface quality analysis and increase the reliability of topographical information which is revealed by these measurements.
Experiment
CFRP specimens were manufactured from prepreg material, cut into squares of 600 mm x 600 mm for individual ply orientations, manually laid up and vacuum debulked every 4 plies during layup. The ply book is made of uni-directional plies which have been stacked in a sequence as shown by Table 1. The full laminate was then vacuum bagged and autoclave cured. The material was cured in the autoclave at 7 Bar and 180°C for a dwell time of 120 min, being ramped at 1°C to 2°C per min and cooled at 2°C to 5°C per min. The constituent CFRP epoxy matrix and carbon fibres have properties which are shown by Table 2. Each of the CFRP specimens are 10 mm thickness, 160 mm length and 25 mm width. During each test the 160 mm long edge was trimmed in two 80 mm sections.
CFRP stacking sequence.
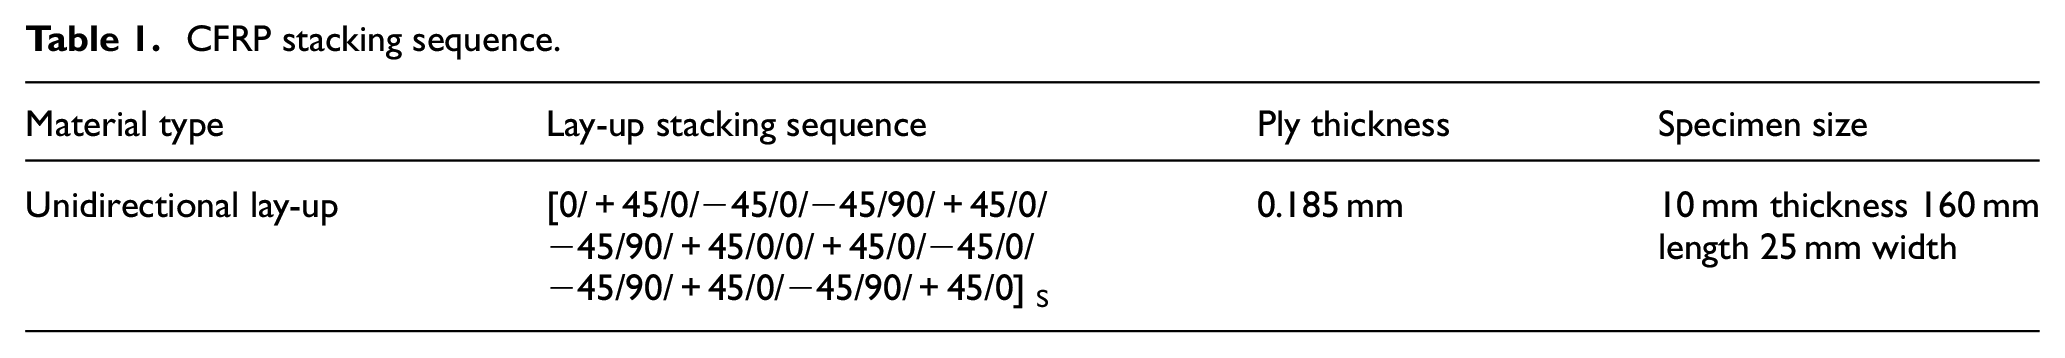
CFRP properties.
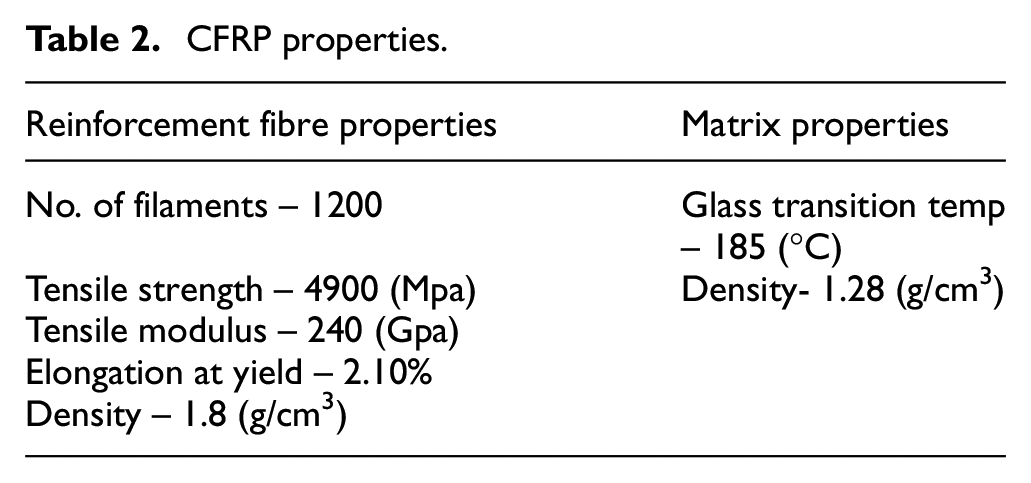
Machining tests were completed on 5-axis MAG Cincinnati CNC machine tool (Model: FTV-2500). The CFRP laminates have been clamped to a Piezoelectric Kistler force dynamometer (Model- 9255C) using a fixture, as is shown in Figure 1(a). This dynamometer is used to measure forces in the feed and transverse directions (Fx and Fy, respectively).
Experimental milling set-up: (a) an example of a CFRP sample clamped to the dynamometer ready for milling and (b) dynamometer and CFRP sample attached to CNC machine tool bed.
The test set-up and machining directions are shown in Figure 3. The feed force (Fx) is parallel to the direction of feed while the thrust force (Fy) is normal to the workpiece cut surface. Two new, three fluted, laser cut Polycrystalline Diamond (PCD) cutting tools have been used in the cutting tests, as shown in Figure 3(b). A PCD cutting tool was chosen due to its high hardness, wear resistance and sharp cutting edge. These properties give PCD a superior cutting performance which is often applied in industry to machine abrasive fibre composite materials.
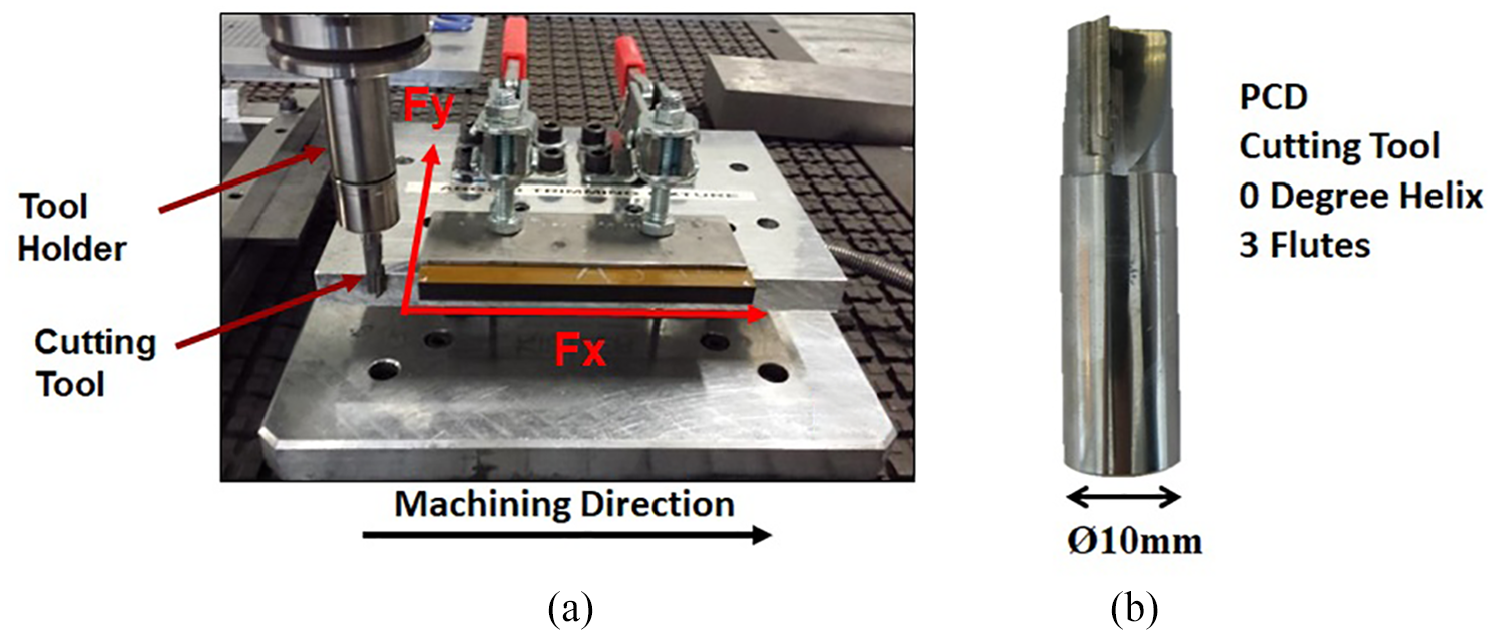
Test set-up: (a) Feed force (Fx) and thrust force (Fy) and (b) PCD Cutting tool.
During the edge trimming operation, oil-water emulsion (Houghton, Hocut 4260) has been applied into the cutting region by flood coolant from the spindle head. The cutting fluid has been applied to remove abrasive chips from the cutting region and to promote heat-dissipation.
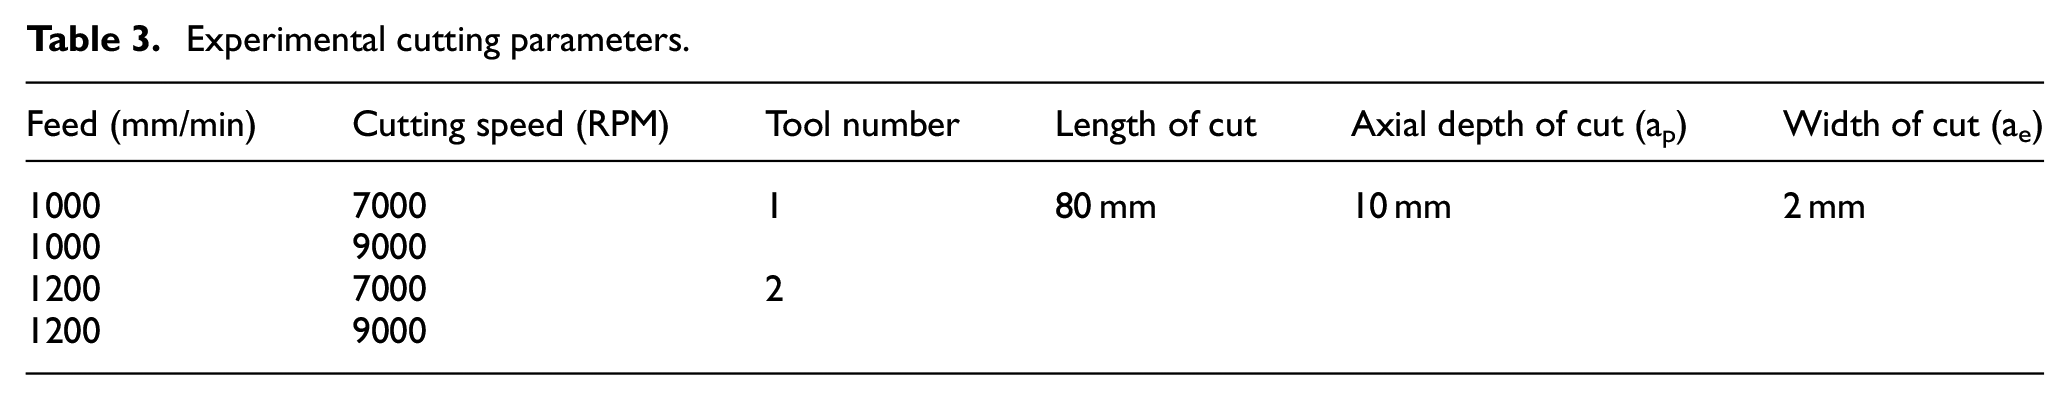
CFRP specimens have been edge trimmed using two different levels of feed rate and cutting speed. Two new cutting tools have been used as a repeat. The radial and axial depths of cut and the cutting length were kept constant for each test. During cutting, the cutting tools gradually become worn, this was measured optically at set intervals. The design of the experiment is shown in Table 3, each condition was repeated 10 times with progressively increasing levels of tool wear and will therefore capture the effects of increasing CER on machined surface topography. Thus, a total of 40 unique tests were completed on separate CFRP specimens. The test design has been applied intentionally so that the effect of increasing CER is not confounded with the other parameters and the effect of each parameter can be assessed independently. The CER will be tracked in real-time in the experimental design.
Experimental cutting parameters.
Surface topography measurements have been performed using an optical surface analysis system which is commercially available from Alicona (Infinite Focus SL). 33 This system can capture surface colour and height information using a focus-variation technique to create a 3D image of the surface with colour information. This system was used both to quantify tool wear of the PCD cutting tools, as shown in Figure 4, and optically measure surface damage to CFRP specimens.
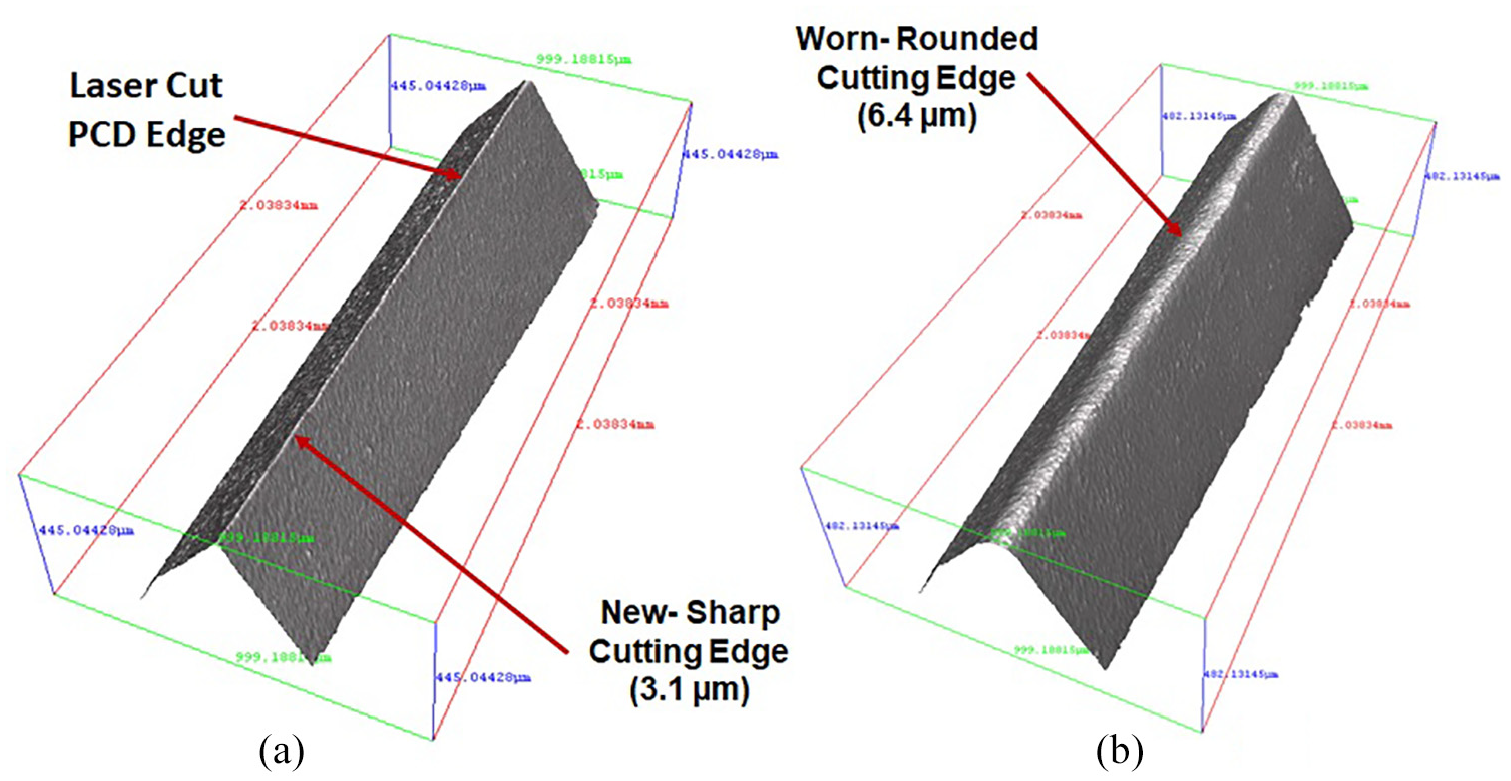
Optically measured cutting edge radius (CER): (a) New tool and (b) Rounded cutting edge.
In order to reduce the uncertainty in the measurement of surface roughness parameters the machined surfaces of the CFRP specimens were imaged optically in two positions (for each test level) as shown in Figure 5. A full laminate thickness of the surface (10 mm) has been incorporated, with a 2 mm scan width, to make sure that the full representative topography of all fibre orientations and laminate has been incorporated in roughness measurements. The two surface topography images have then been used to calculate roughness parameters across each individual fibre orientation by the method described in the next section. Two large measurement regions on each sample have been used to ensure the effects of sampling region do not substantially influence the measurement of the non-homogeneous surface profile.
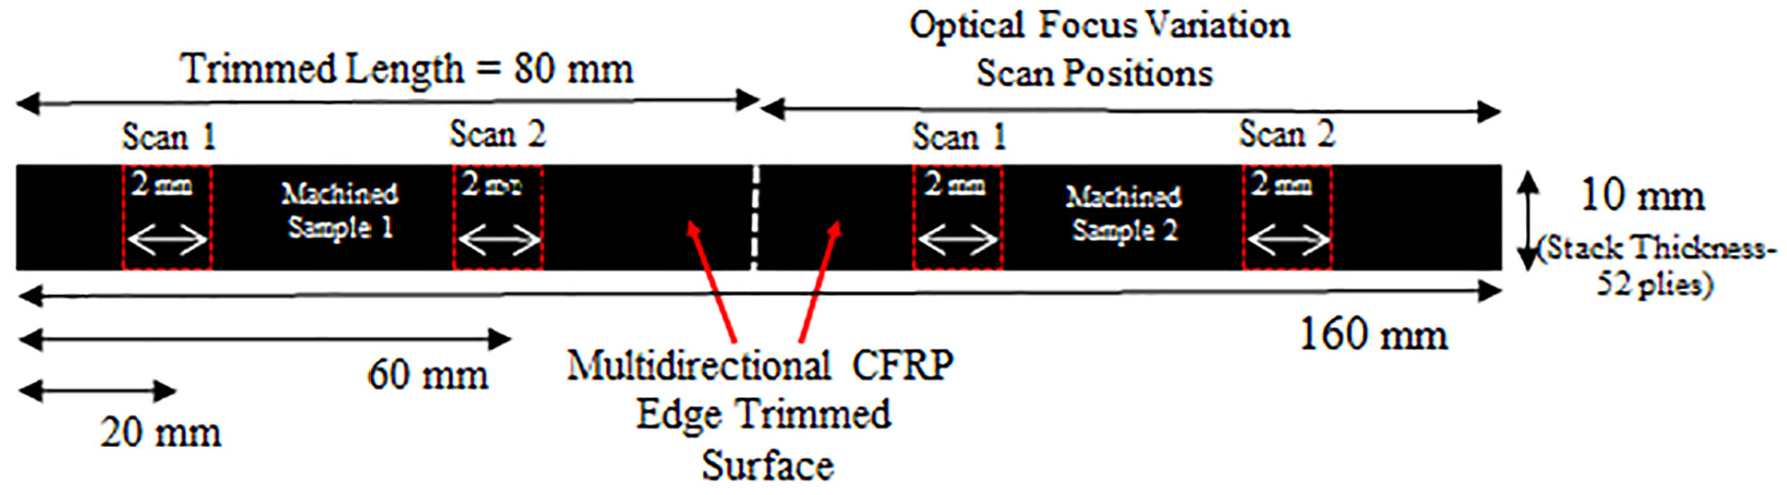
Optical surface scan positions on machined sample surface.
Micro-CT scanning of machined specimens has been used, to analyse the machined CFRP specimens post machining. A Nikon Metrology XTH X-Ray scanner, with a three-dimensional resolution of 8µm, was used to image the specimens. This gives a high-resolution image of the CFRP samples below the machined surface. The data can be used to check for any defects, delamination or cracks propagating into the material sub-surface.
Image segmentation
A segmentation program, written in python3, is used to split the surface topography images into individual plies. Although the surface topography images encode both the colour (red, green, blue values) of the surface and the depth in .al3d format, this program works exclusively with the colour information. However, as one pixel relates exactly to one depth measurement, the resulting map of ply orientations can also be used to segment the depth information.
The program has several steps: firstly, the mean brightness value for each row of the image is found. These are used to roughly segment the image by fitting a set of equal, flat lines to the brightness data. As the mean brightness of the plies are different depending on the fibre orientation, the best fitting set of flat lines approximately fits a single line to each ply.
Each of these segments is then rotated and the rotation angle which produces the greatest standard deviation in the row’s brightness is then taken as the angle of the ply in the image. The limits of this rotation can be set by the user, but no input is required for a set of similar images.
A set of rows is then selected to give the smallest standard deviation of row means possible. This step finds a window of rows which are all on the same ply, the size of the window as a proportion of the height of the ply can be set by the user. The coordinates of this window are then transferred back to the overall image coordinates. This map is then used to find the required roughness parameters from the relevant part of the depth data.
Lastly, in order to assign ply orientations to the roughness measurements, small sub images from the centre of each ply are Gabour filtered with a variety of kernels. This process encodes the ‘texture’ of the sub images as a small number of features. All of the filtering from the combined plys in the image are then clustered into groups by k-means clustering. The most likely line of symmetry in this list of groups is found and this is used to relate the groups to the ply orientations.
Results
µ-CT scanning
Machining experiments were completed at increasing levels of tool wear and have generated different surface profiles as affected by a change in input machining parameters. To look at the extent of damage in the machined surface and sub-surface then µ-CT images were analysed. Cross-sections, such those shown in Figure 6, have been taken at progressing intervals up to 0.04 mm in depth from the machined edge. Past this point then no visible defects or valleys were in evidence. This method has been used to find the extent and maximum depth of defects have which have propagated or been mechanically torn from the machined edge. It was found that there were some pitting defects and torn fibre chunks on specific ply regions, as shown in Figure 6. The deepest pitting defects were approximately 40 µm below the machined surface. These measurements have been verified using the Sv parameter using the optical focus variation method. It has been shown that µ-CT scanning has highlighted surface pitting on specific ply regions but it has not indicated the presence of any substantial sub-surface delamination or propagating cracks below the machined surface.
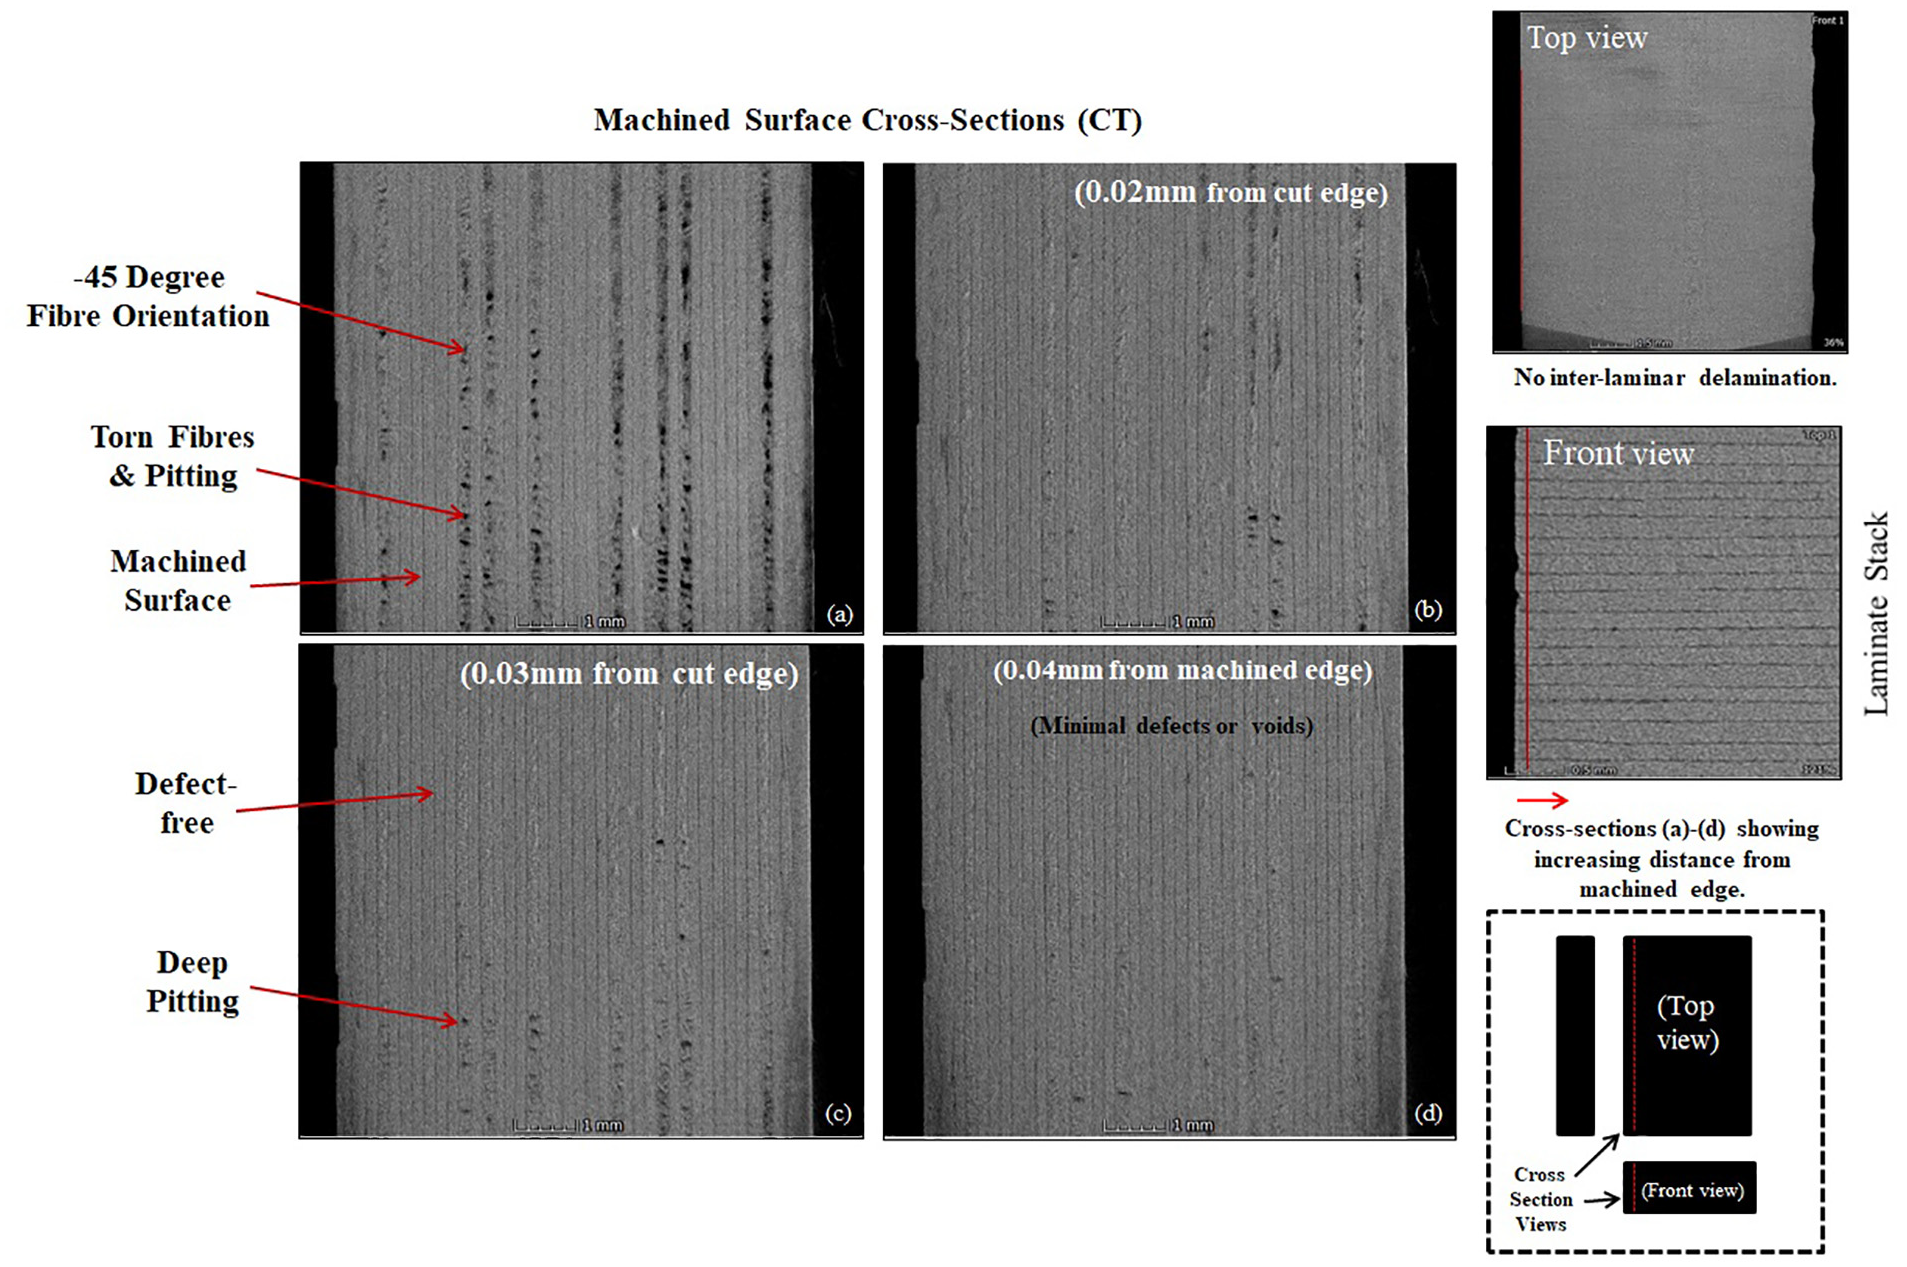
Cross-sections of CT images from the machined surface region of CFRP samples: (a) 0.01 mm, (b) 0.02 mm, (c) 0.03 mm, and (d) 0.04 mm from machined edge.
The experimentally applied machining conditions presented in this study did not induce extensive sub-surface damage (as shown by µ-CT scanning), therefore the focus variation surface topography technique was used to take optical surface measurements. It is worth indicating, however, that more aggressive machining parameters or extensively worn cutting tools could produce greater machining induced surface damage and sub-surface damage than presented in this work.
Optical surface topography
Machined surfaces have been scanned using an Alicona focus variation system and examples of typical surface topography images are shown in Figure 7. As shown, there are typical differences in machining-induced topography across different plys due to the effect of fibre orientation. Pitting defects and torn fibres are predominantly observed for the −45° fibre orientation plys. An example of a segmented image for a machined CFRP surface, labelled with ply-orientations, is shown in Figure 8. The automated selection of individual ply layers has been completed using the image analysis program described previously. The image analysis was applied across all topography images and then the surface roughness of the individual plys has been extracted.
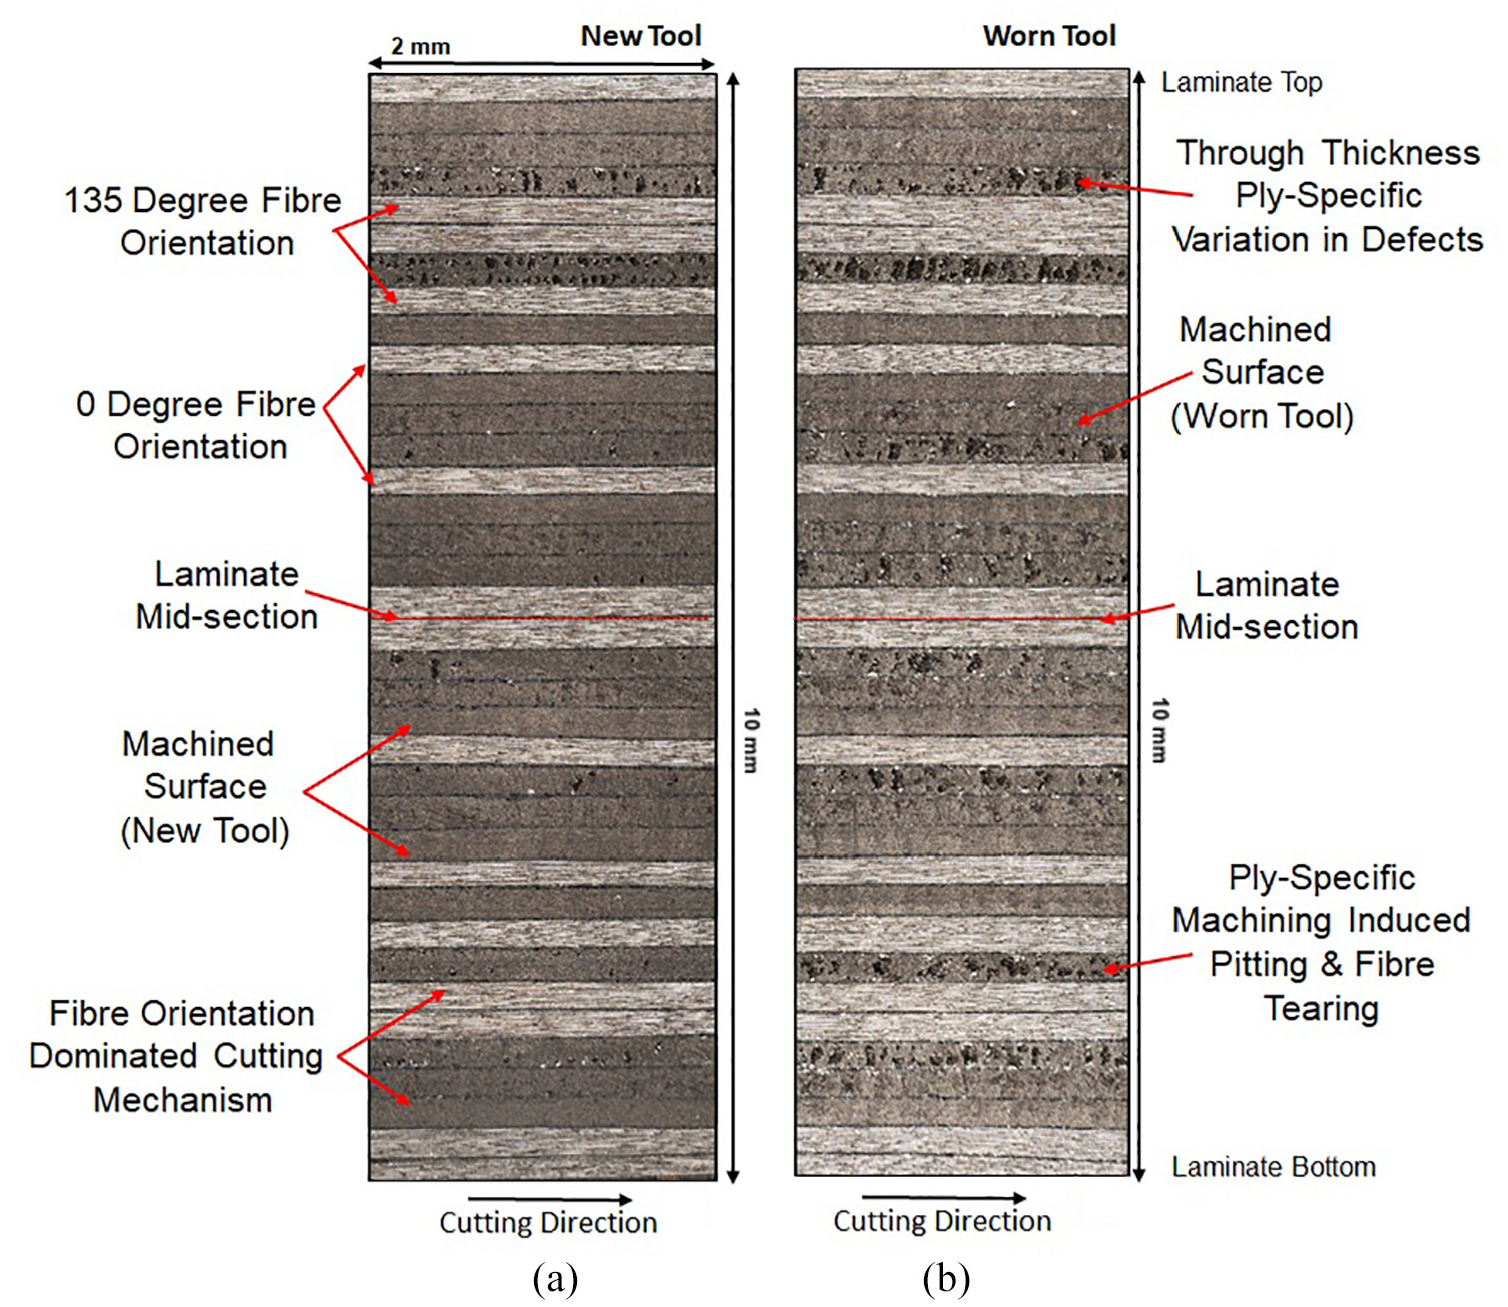
Optical surface scan of machined surface showing full laminate through-thickness: (a) new cutting tool and (b) worn cutting tool.
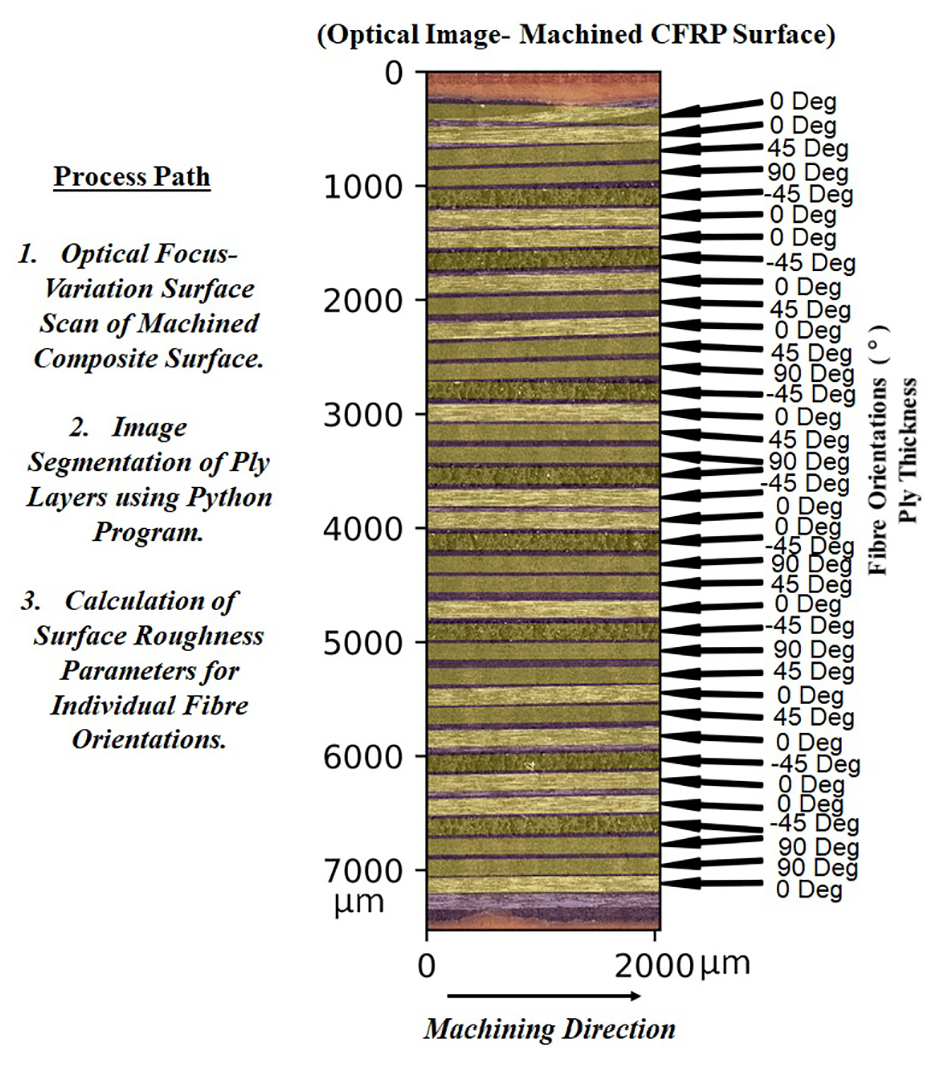
The results of the segmentation program on a single machined surface image.
Areal surface roughness measurement (Sa)
The arithmetic mean height of area (Sa) roughness results from all of the samples are plotted against fibre orientation and CER in 9a and 9b, respectively. Plots of the remaining primary factors (Cutting speed and Feed rate), –separated by ply orientation, are shown in Figure 9(b) and (c) respectively. Figure 9(a) shows the mean response of the surface roughness data versus fibre orientation, with the quarter percentiles and outliers shown. Figure 9(b) shows the data response of the surface roughness versus increasing cutting edge radius, grouped by different colour for each of the fibre orientations. As shown in Figure 9(a) and (b) the ply orientation is the dominant factor which distinguishes the data, as the 0°, 45° and 90° orientations show significantly smoother surfaces than the −45° orientation. The effect of cutting speed and feed rate does not show as pronounced effect on the surface roughness as fibre orientation. This discrepancy in roughness is caused by the different chip removal mechanism between each of the different fibre orientations, (even though they have been machined with the same cutting parameters). It is found that this effect is highly prominent for the −45° fibre orientation which is dominated by a fibre bending and ploughing cutting mechanism and thereby introduces large pitting defects on the surface. The machined surface has been found to be significantly non-homogeneous and fibre orientation has been shown to be a critical factor in generated roughness and machining induced defects. Therefore, the effect of individual parameters on the surface roughness and the predictive capabilities of new models will be assessed statistically in the next section.
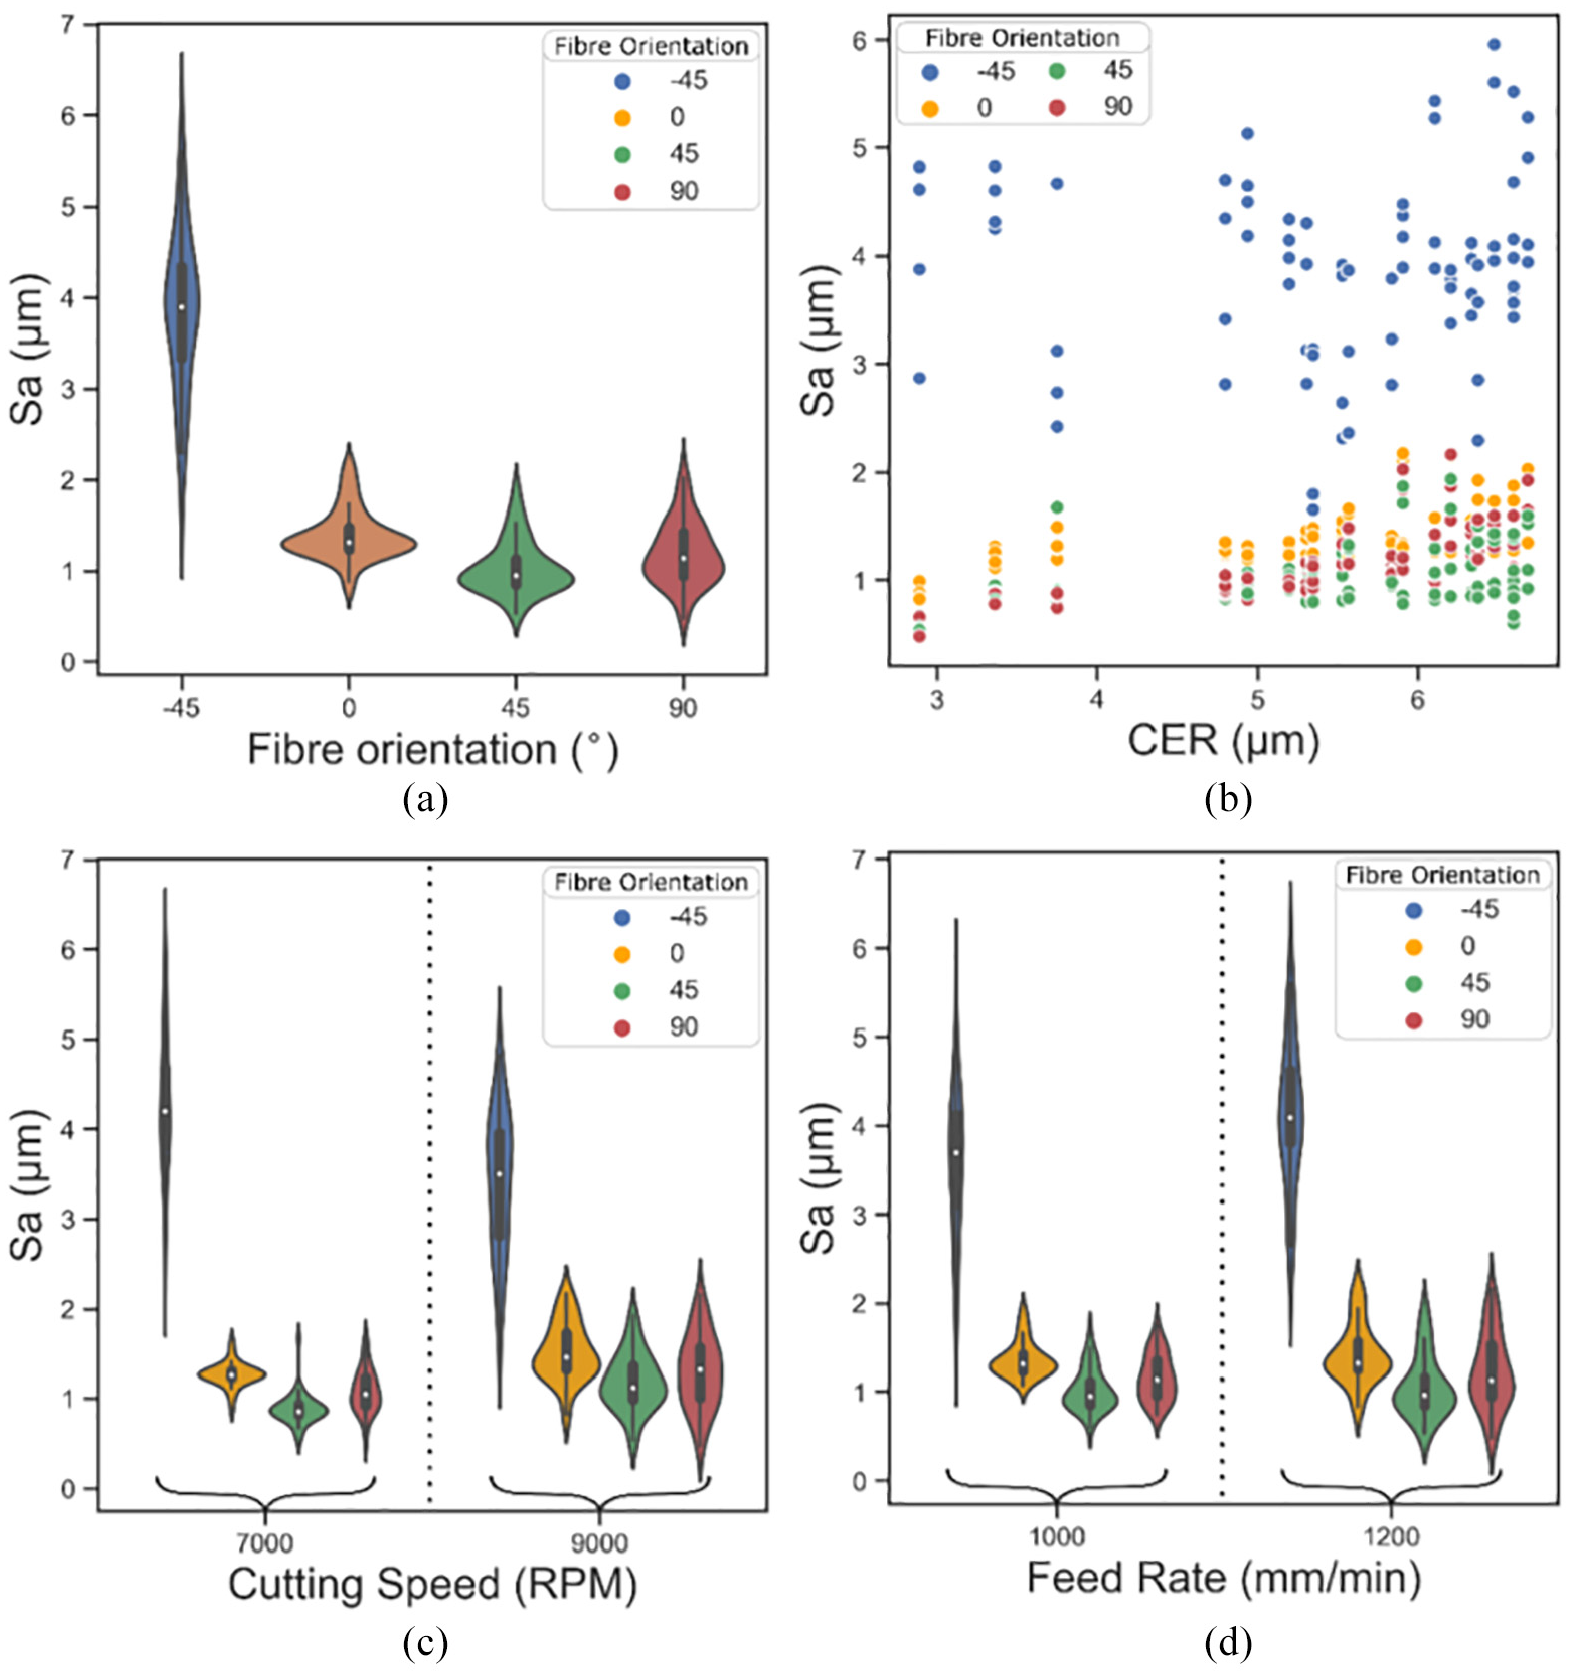
(a) Violin plot showing the distribution of roughness (Sa) measurements for each fibre orientation, (b) Scatter plot showing each roughness result against the CER of the cutting tool, (c) Grouped violin plot showing the distribution of roughness results for each cutting speed and fibre orientation and (d) Grouped violin plot showing the distribution of roughness results for each feed rate and fibre orientation.
Cutting forces
The cutting forces were calculated and the effect of feed, cutting speed and CER has been compared against the Fx and Fy cutting forces. It was found that the Fx (Feed force) and Fy (Thrust force) both increased significantly with an increase in CER, as shown by the positive slope in Figures 10 and 11, respectively. When the cutting tool wears there is an increase in friction and contact area, between the cutting tool and workpiece, which will promote a ploughing and tearing cutting mechanism, and also has corresponded with a poorer surface quality. The Fx cutting force has also shown a relatively small increase with feed.
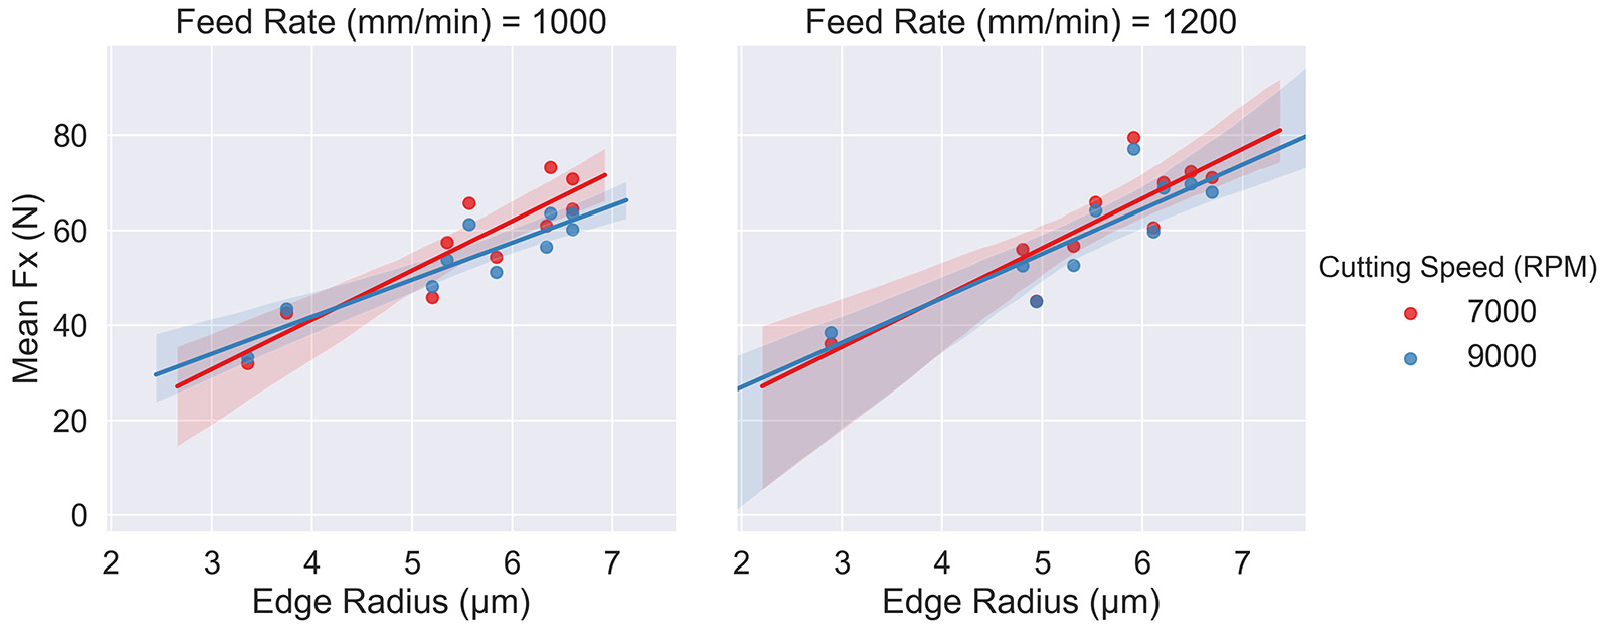
Fx-Feed force versus cutting edge radius (grouped by feed and cutting speed).
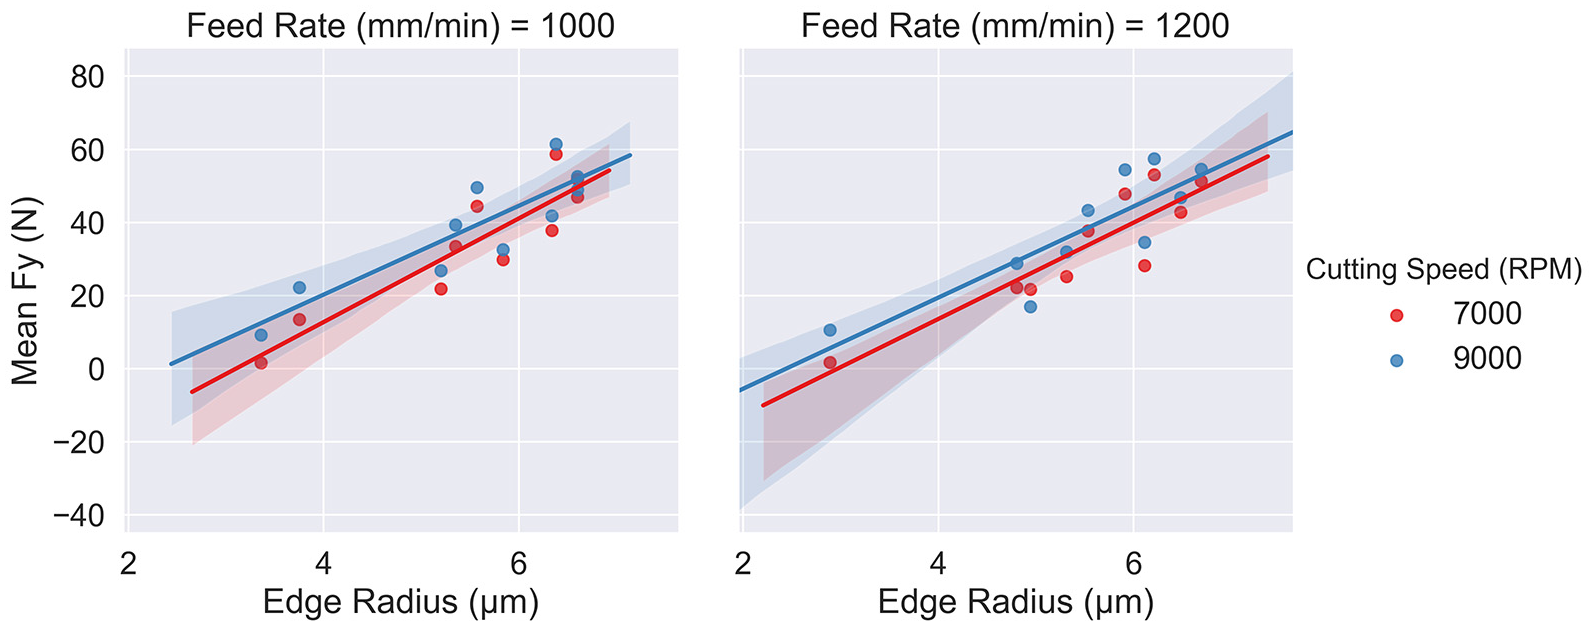
Fy-thrust force versus CER (grouped by feed and cutting speed).
Maximum defect valley depth (Sv)
It has been shown by SEM imaging that pitting defects (in the form of valleys) characterise the most severe damage on the machined CFRP surface. The Sv parameter (which gives an absolute indication of the magnitude of profile valleys) has therefore been assessed across the test samples for each of the four fibre orientations. The Sv parameter was calculated across all specimens using the image segmentation method and the maximum defect depth was found to be −36 µm. This maximum valley correlated with a higher CER and feed rate which was applied in these machining experiments. A maximum defect depth of ≈ 40 µm was qualitatively imaged by µ-CT scanning which agrees with these measurements and can be used to verify the capability of the µ-CT scanning method.
In Figure 12 the results for the Sv parameter are shown against fibre orientation, feed rate, CER and cutting speed. The defect maximum valley depth is shown to be most significantly affected by fibre orientation (shown in Figure 12(a)) and the largest pitting defects are found when the CER is at a maximum Figure 12(b). It is hypothesised that the largest defects depth is caused by two contributing parameters: namely an increase un-cut chip thickness (by increasing feed), and a resulting ploughing, bending and fracturing cutting mechanism which is attributable to a rounded cutting edge and larger cutting forces. The most significant pitting defect regions are also highly impacted by the fibre dictated bending phenomenon (while machining of the −45° fibre orientation), which has resulted in significantly higher defect magnitudes than in the other three fibre orientations. Therefore, to minimise the maximum defect depth then a sharp cutting tool should be applied at a lower feed rate. The effects of machining parameters on machining induced surface roughness shall be quantified in the next section using statistical models.
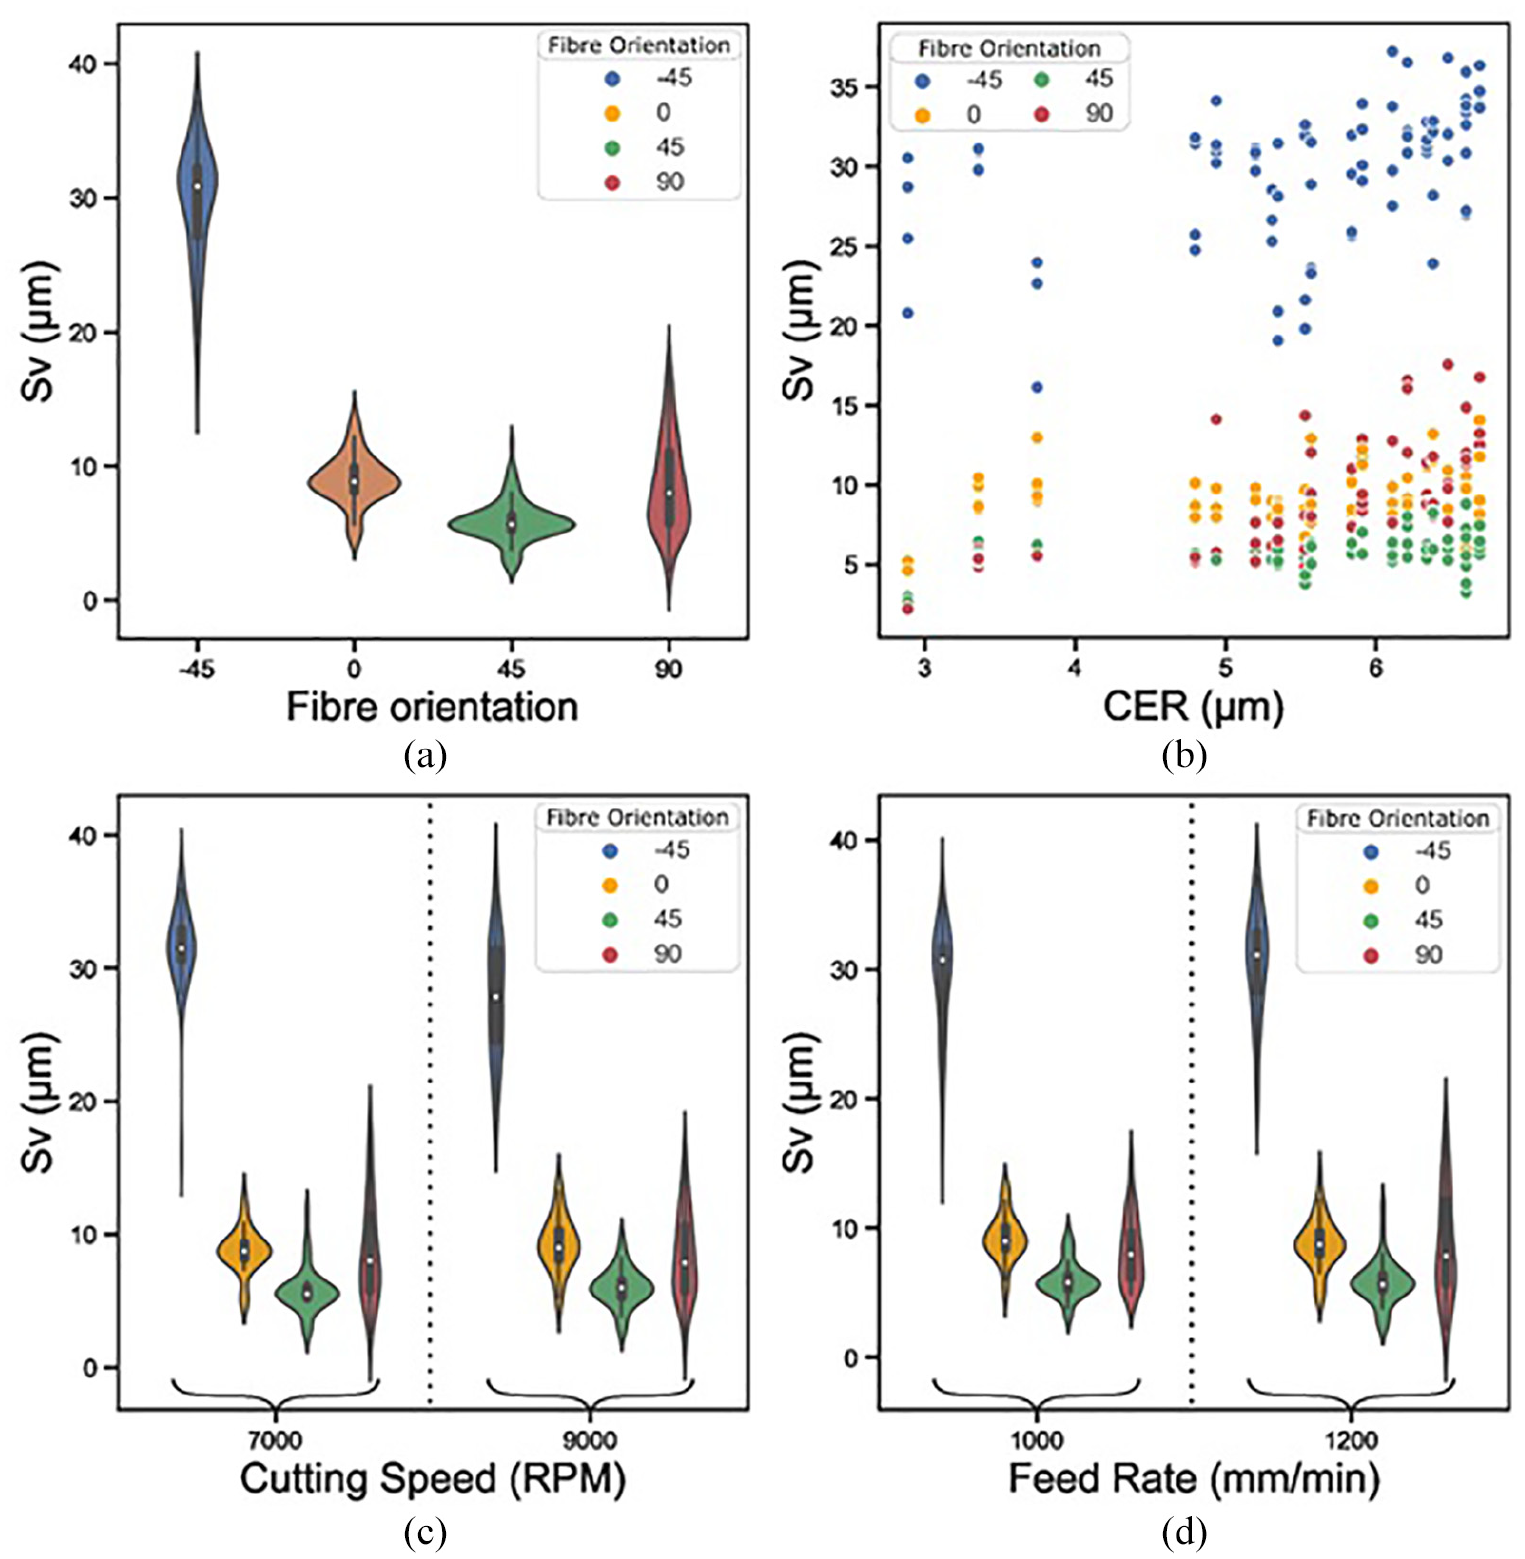
(a) Violin plot showing the distribution of roughness (Sv) measurements for each fibre orientation, (b) Scatter plot showing each roughness result against the CER of the cutting tool, (c) Grouped violin plot showing the distribution of roughness results for each cutting speed and fibre orientation and (d) Grouped violin plot showing the distribution of roughness results for each feed rate and fibre orientation.
Statistical model of surface roughness
In the following section, statistical models have been used to assess the effects of machining parameters on the Sa roughness parameter. The effects of each of these machining factors on Sa has been investigated statistically by fitting ordinary least squares linear models to the data and then generating predictive models. Before fitting the numerical factors have been min-max normalised to a scale of 0 to 1. Thus, the relative importance of the effects within this measurement range can be assessed. There is a nonlinear effect of fibre orientation, which is caused by the different cutting mechanism between each – especially the −45° which is characterised by bending, fibre tearing and fibre fracture. Consequently, two different methods have been compared: introducing the effect of fibre orientations as a categorical variable on the overall surface roughness; the second method has calculated the surface roughness for each fibre orientation as an individual regression equation using data from each individual ply. Models have been calculated for both the Sa (mean absolute deviation) and Sv (minimum-valley deviation) roughness parameters. First order interaction terms between the machining variables were also investigated and retained in the model if they showed statistical significance.
Fibre orientation categorical model
Two different models have been assessed which have introduced the effect of individual fibre orientations and machining parameters on the machining induced surface quality. The first model, which assesses the overall surface roughness, has introduced each fibre orientation as a contributing variable on the overall surface roughness; while the second model has predicted the roughness for each fibre orientation individually. In the first model, the fibre orientation is included as a categorical variable because its effect on surface roughness has been found to be strongly nonlinear in this measurement range. This allows a separate coefficient to be calculated for each fibre orientation and allows for the effect of non-linearity from each fibre orientation to contribute to the overall roughness calculation. A summary of the model, fitted to results for ply orientations averaged across each scan, is shown in Table 4. Coefficient terms indicate the size of the effect while the p-value gives the probability that the effect is the result of chance variation in the data. It should be noted that a small p-value doesn’t indicate a strong or important effect, simply one that is unlikely to be a false positive due to chance variation. In this case, P-values which are less than 0.05 are interpreted as being statistically significant. The coefficient of determination (R2) and adjusted coefficient of determination (R2 Adj.), (which is adjusted for the number of terms in the model), have been included in Table 4 to verify the strength over which the regression model has fit the data. A similar table showing the results of fitting to the Sv parameter is given in the additional material.
Regression results for fibre orientation grouped as a categorical predictor.
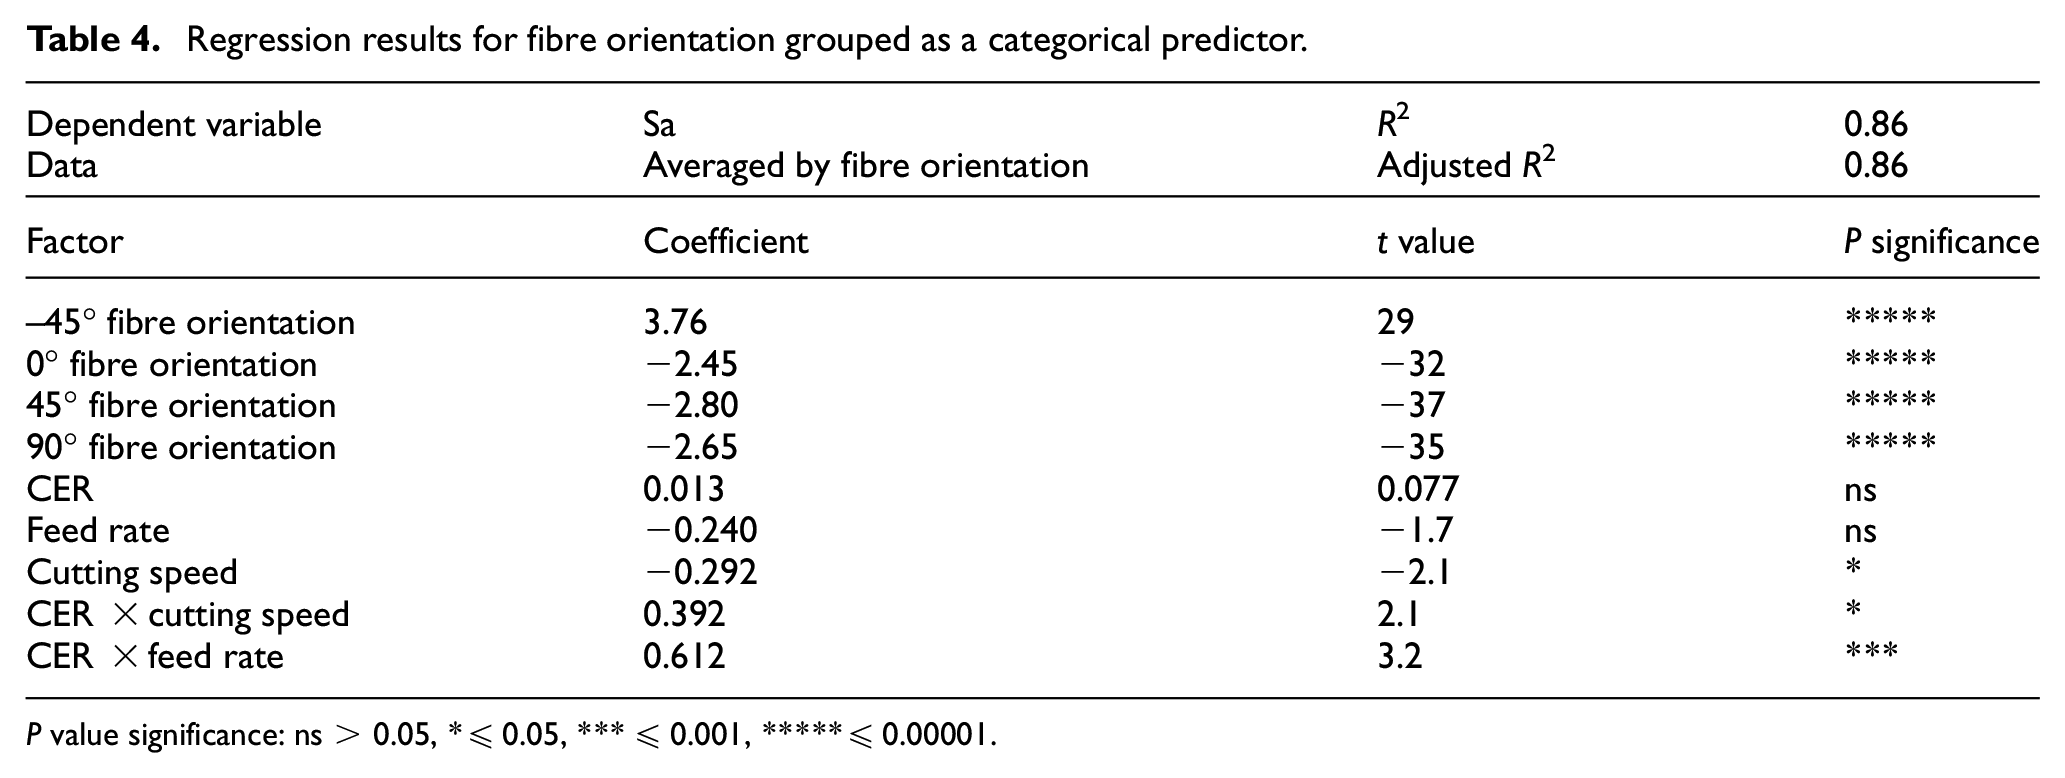
P value significance: ns > 0.05, *≤ 0.05, *** ≤ 0.001, *****≤ 0.00001.
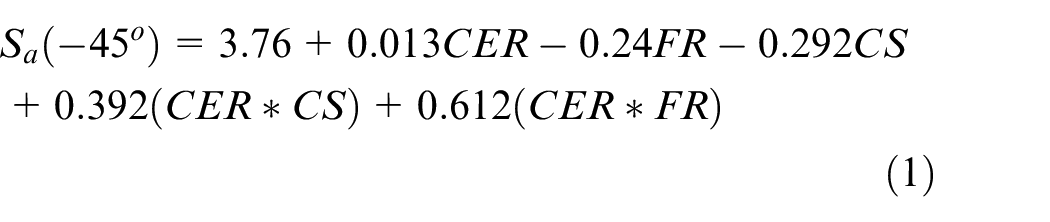
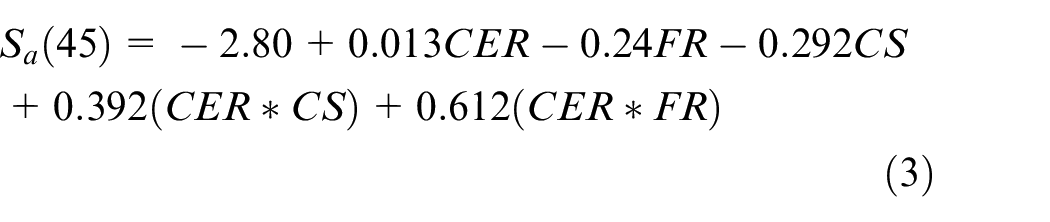
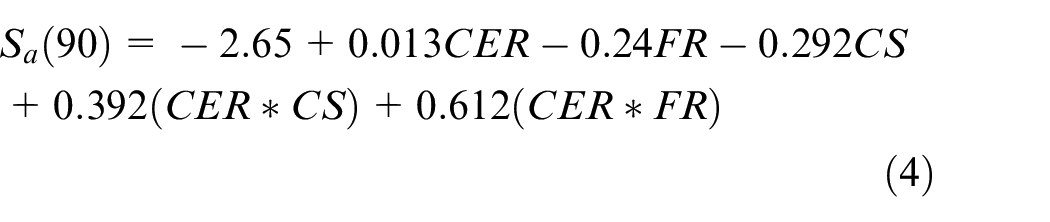
The regression equation for the overall surface roughness which implements categorical effects for the surface roughness is shown in equations (1)–(4). Where CER is the cutting edge radius, FR is the feed rate and CS is the cutting speed.

In Table 4 it is shown that when all of the fibre orientations are grouped, that the effect of fibre orientation gives the strongest overall effect on Sa. Increasing either of the first order interaction effects (CER*(Cutting speed or Feed rate)) was also significantly correlated with an increase in surface roughness. This is an interesting result because it shows that the interaction between the current tool condition and machining parameters can have a strongly significant and negative effect on machining induced defects. This can be explained fundamentally because as the CER increases, by abrasive wear mechanism of the tool, then the cutting edge loses its sharpness and the cutting mechanism changes –from a fibre cutting and shearing mechanism into a ploughing and tearing mechanism; because there is a contribution between CER and feed rate. This means that as the tool wear increases then the effect of the feed rate on machining induced pitting will become more pronounced. This effect was also shown by the increase in mean Fx and Fy mean cutting forces by up to 100%, when the cutting edge radius increased from 3 to 6 µm. Finally, a higher cutting speed was significantly correlated with a lower surface roughness, however this effect was less than that compared to the interaction between cutting speed and CER, thus it likely only holds for sharp tools.
The basic naïve model, which was used here, fits single coefficients for each of the numerical factors and a coefficient term for each fibre orientation. This is equivalent to fitting to the overall surface roughness and adjusting by constants to give different predictions for each fibre orientation, therefore allowing for the non-linear effect of each fibre orientation variable. The measurements versus predictions plot for this model, shown in Figure 13, indicates that the model achieves a high R2 value due to the large difference between the fibre orientations. Therefore a better predication of the non-linear effects of fibre orientation on ply-by-ply surface roughness and surface defects has been generated using this method combined with Sa roughness parameters.
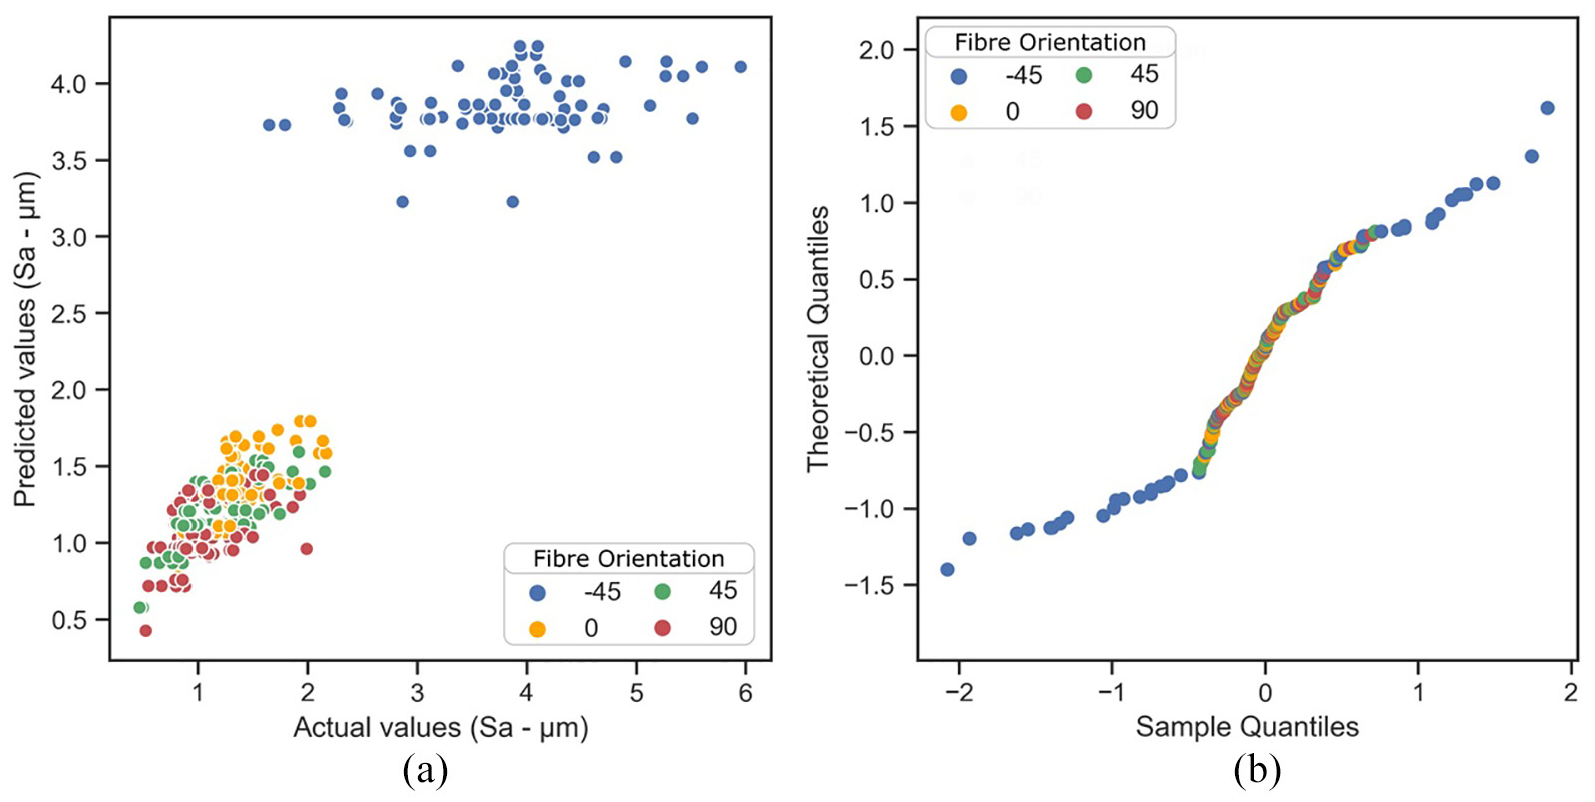
Regression model fit- fibre orientation as categorical predictor: (a) predicted versus actuals and (b) QQ plot.
Predictions of the effects of individual parameters within a single fibre orientation are however poorer, especially for the roughest orientation (−45°). This is indicated by the QQ plot (Figure 13(b)) which shows that the model residuals are non-normal, indicating that there are missed effects in the model for this orientation. It is hypothesised that this may be a consequence of the larger scatter within the surface roughness data for the −45° fibre orientation: due to the inherent variability in surface profile; the effect of material variation and material non-homogeneity on machined surface roughness. Also, this model does not account for the different effect of parameters (feed, CER, cutting speed and interaction terms) on each separate fibre orientation, the effect of each parameter is calculated for the surface as a whole and each fibre orientation term has its own coefficient. Thus, a second model was also developed which calculates regression equations for the effect of parameters on the Sa surface roughness for individual fibre orientations, and is presented next.
Individual fibre orientation models
In the second model, individual equations have been created for each fibre orientation, with each model containing the three primary factors and first order combination terms between parameters. Surface roughness parameters have been calculated for each individual ply and then used to calculate effects of cutting parameters, each individual ply therefore acts as a separate data point. Summaries of these models are shown in Table 5. Each row shows a different regression model for each of the four fibre orientations, while each column shows the coefficient calculated for each parameter effect. The R2 terms have been compared between the second and first models in the 8th and 10th column, respectively.
Separate regression models for individual ply orientations.
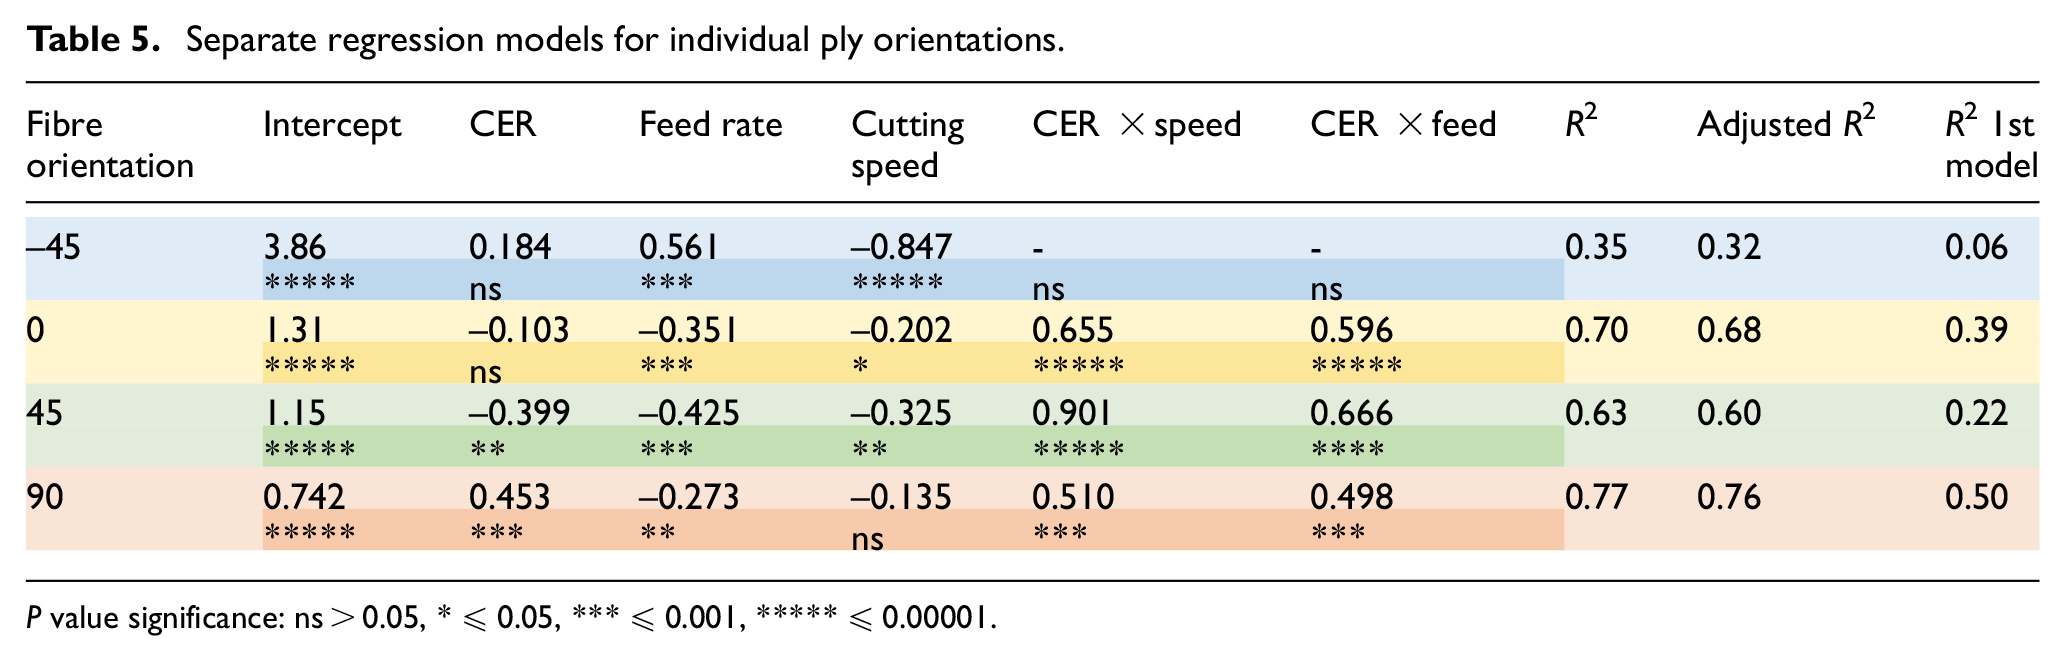
P value significance: ns>0.05, * ≤ 0.05, *** ≤ 0.001, ***** ≤ 0.00001.
Comparing Tables 5 (individual models) to 4 (overall model), it is found that the effects of parameters on the surface roughness for the 90° orientation follows the same trends as observed for the surface as a whole. For the 90° orientation increasing the CER and the interactions between CER, Feed and Cutting Speed have an increasing effect on surface roughness. However, the −45° orientation has a different behaviour. In Table 5, for the −45° orientation, a high cutting speed and a low feed rate are correlated with a smoother surface. The interaction effect between CER*Feed and CER*Speed have not been found to be statistically significant for the −45° fibre orientation alone.
In Table 5 it is shown that the −45° fibre orientation model fits the data relatively poorly (R2 = 0.35). Yet, the R2 values for the individual models show that the predictions of the effect of machining parameters are more accurate within each orientation than in the overall model. The overall R2 for the first model is 0.86, which has shown a good prediction of the effect of fibre orientation on the overall surface roughness. However, the first model does not have the capability to infer whether there are any different effects of parameters on individual plies with different fibre orientations.
However, it has been found that the surface roughness in each smaller region or ply is better described by the R2 values when each fibre orientation is fit with a separate regression model and individual coefficients for each parameter. This is because the effect of machining parameters and interaction terms on surface roughness do not have consistently the same effect between each of the different fibre orientations. Therefore, localised ply-by-ply roughness will be affected differently by machining parameters than overall surface roughness.
QQ plots for the individually fitted models, shown in Figure 14, show more normally distributed residuals compared to the overall model, shown in Figure 13. Thus, the second model shows a greater predictive capability to understand the effect of individual parameters on each fibre orientation individually than the overall model. This model has indicated the importance of understanding the effect of contributing interactions between machining parameters on individual effects of fibre orientations and fibre cutting mechanism on machining induced surface roughness. Both models have shown an improvement in predictive capabilities over models which do not account for fibre orientation as a variable in surface roughness. The second model does not represent the surface roughness over the whole surface structure. The first model (using categorical predictor terms for fibre orientations) has shown an excellent capability to predict overall surface roughness with an R2 of 0.86 and can be usefully exploited to give a better prediction of machining induced surface roughness. The second model has shown the greatest accuracy to predict the surface roughness for the 0°, 45° and 90° plies, as shown by the small distribution between points in the predicted versus actual values in Figure 14(a), compared to the −45° fibre orientation. The methods which have been employed to generate these models could be generalised to other fibrous composite materials like glass fibre reinforced polymer (GFRP) and other cutting operations such as drilling and turning. The same ply-by-ply method could also be used to generate models with additional terms like cutting tool type, for instance with CVD or carbide cutting tools other than PCD.
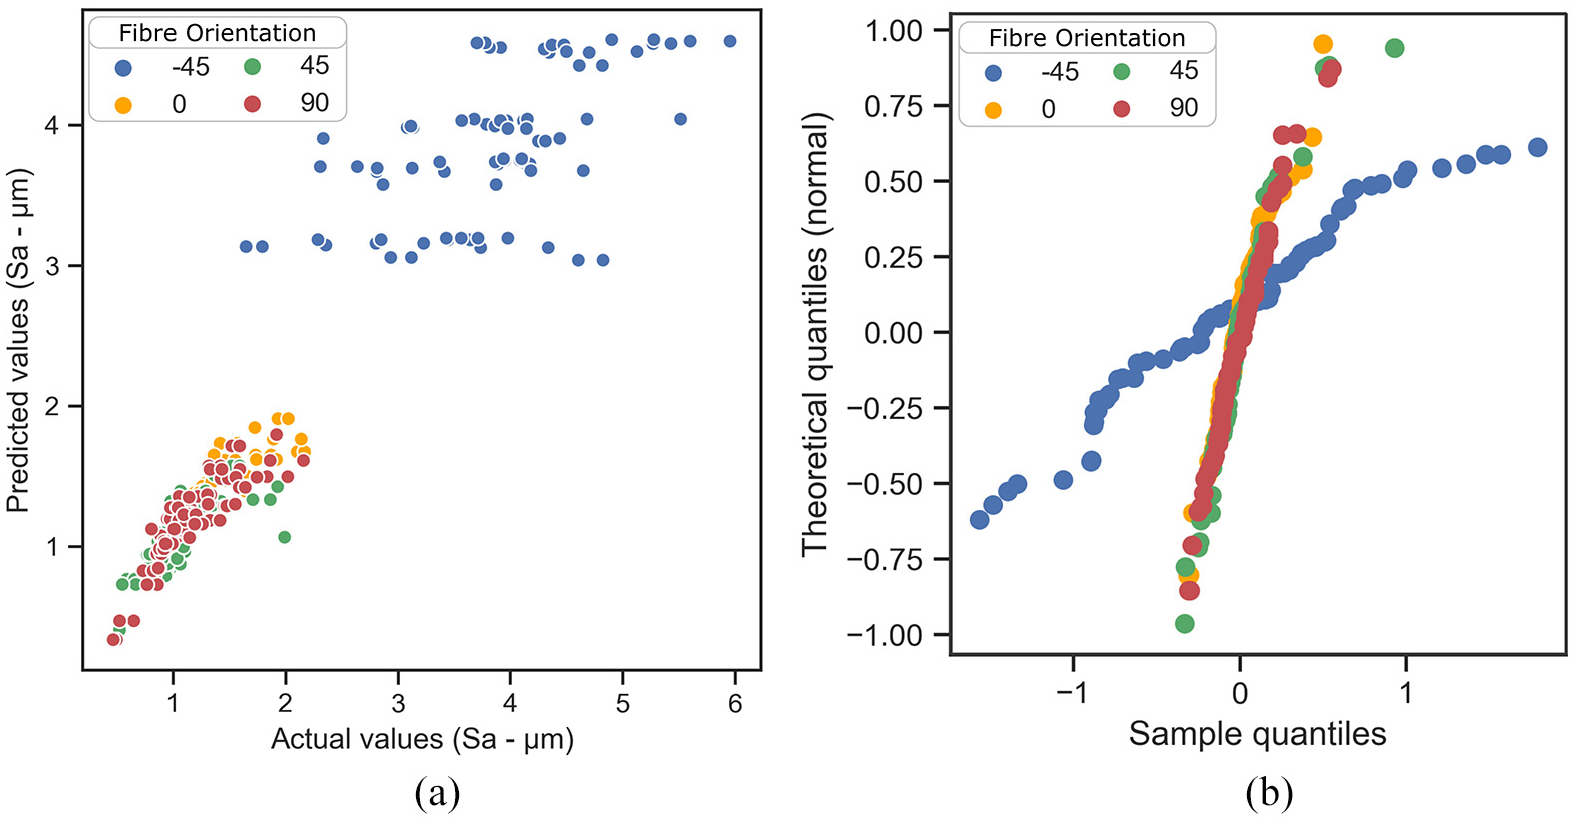
Model fit for individual fibre orientation model- regression model: (a) predicted versus actuals and (b) QQ plot.
In Table 5, the interaction between CER*Feed has shown a significantly increasing trend on the surface roughness of the 0°, 45° and 90° orientations. This may be caused due to the interaction between chip thickness and a blunt cutting tool: which will tear and fracture fibres, rather than a sharper cutting edge which will reduce cutting forces and cleanly shear smaller chips. For the −45° fibre orientation in Table 5 it is shown that reducing the feed and increasing the cutting speed will tend towards a lower Sa surface roughness. It is reasoned that reducing feed and increasing cutting speed has likely shown an improvement in surface quality because of the reduction in un-cut chip thickness, as verified by other researchers. 5
Conclusion
A new statistical categorical model has been generated implementing image segmentations with a python imaging script for assessing surface roughness parameters in a PCD edge trimmed multidirectional CFRP laminate. The script has calculated areal roughness parameters on individual ply regions which have been measured using optical focus variation method and areal roughness parameters to characterise machining induced surface damage. This measurement technique has allowed the effect of cutting parameters on roughness to be investigated on single plies or across groups of different fibre orientations. The effect of increased tool wear, using CER metric, on machined CFRP surface roughness has been evaluated for individual ply orientations using a developed image segmentation method and statistical analysis. The statistical significance of input machining parameters, including cutting forces, feed rate, cutting speed and CER, on different areal surface roughness indicators has been quantified for a machined multidirectional laminate. Results have shown that the effect of machining parameters on the surface quality will be highly influenced by the fibre orientation and fibre cutting mechanism. It has been found that the effect of changing fibre orientation shows a highly non-linear effect on surface roughness parameters.
Two different regression models have been used to predict Sa and Sv surface roughness parameters using grouped (categorical) and individual fibre orientation models. The categorical method takes into the account the individual effects of different fibre orientations on overall surface roughness and was able to make an excellent prediction of overall Sa machined surface roughness with an R2 of 0.86. The individual fibre orientation method was able to make an improved prediction of individual parameter effects on ply-by-ply surface roughness, rather than characterising the surface as a homogeneous layer. This has shown that the effects of machining parameters on surface roughness are unequal across each fibre orientation. In addition, areal roughness parameters (Sa and Sv) have been found to be advantageous over profile roughness parameters for characterising surface quality in machined composite laminates.
The statistical models have shown that both CER and feed rate both have a significant statistical effect on the machined surface quality and have a detrimental effect on surface quality. It has also been shown that there is an interconnected correlation effect between feed rate*CER which can have a strongly detrimental effect on surface quality.
The research has shown a new method for characterising surface damage of individual ply regions which enhances the information representing surface topography. Micro-CT scanning has been applied to an edge trimmed CFRP surface and has highlighted the torn fibre chunks and pitting defects on −45° plies. The maximum pitting defect depth has been verified using optical focus variation Sv measurements, with maximum defects at a depth of 36 µm. The maximum pitting defects were correlated with the highest CER (tool wear) and an increased feed rate. This work has demonstrated that improvements can be made in the accuracy of characterising machining induced surface topography of fibrous composite surfaces by using statistical models which incorporate the measurements of surface roughness on individual plies with areal roughness parameters. Further work can apply these models to optimise the effect of machining parameters and different cutting tools on machining induced surface quality and material mechanical performance.
Footnotes
Acknowledgements
The authors would like to acknowledge the following grant for funding this project EP/I01800X/ which was part funded through the EPSRC Industrial Doctorate Centre in Machining Science and Rolls-Royce. The authors would also like to thank staff and technicians at the University of Sheffield and Advanced Manufacturing Research Centre (AMRC) for their contributions.
Declaration of conflicting interests
The author(s) declared no potential conflicts of interest with respect to the research, authorship, and/or publication of this article.
Funding
The author(s) disclosed receipt of the following financial support for the research, authorship, and/or publication of this article: This work was also funded, in part, through the EPSRC Programme Grant ‘Friction: The Tribology Enigma’ EP/R001766/1