
Abstract
Application of Micro-Nano scale Electrical Discharge Machining is rapidly growing in manufacturing of metal products irrespective of its hardness having geometric features in range of micrometer to nanometer scale. To achieve such small geometrical features, smaller dimensional tool electrode is required. However fabrication of this tiny electrode with desired dimension and also handling of such tiny electrodes is a primary aspect that needs to be investigated systematically to use the Micro-Nano scale EDM in batch production of micro parts. In this work authors investigate the application of electrochemical etching process for fabricating EDM electrodes smaller than 10 µm. While the smallest electrode fabricated with the optimized parameter is 3.33 µm, their performance as electrode in micro-EDM has been studied systematically. To the best of authors’ knowledge such studies are not reported in the published literatures. However, the fabrication of such smaller size features by applying alternating current in ECE has been attempted previously but not for micro-EDM applications.
Keywords
Introduction
Electric discharge machining (EDM) is among the earliest non-conventional manufacturing processes which was first invented in 1943 in Union of Soviet Socialist Republic (USSR), and widely used in tool rooms after 1980 with the advent of computer numerical control (CNC). 1 It is a noncontact micromachining process, where the precisely controlled electric spark occurred between the tiny electrodes, used to erode the material from electrically conductive workpiece. 2 A pulse generator provides the discharge energy and a CNC motion controller ensures the advancement of the tool to maintain the desired spark gap. 3 Moreover, the motion controller is responsible for retracting the electrode, if short circuit happens. According to the global market forecast for electrical discharge machines to be worth some $8.5 billion in the near future. 4 Application of the Micro-Nano scale EDM is rapidly growing in manufacturing of metal products having geometric features in the range of micrometer to nanometer scale due to its machining capability on any kind of conductive or semi-conductive materials irrespective of their hardness. 5 In addition to that, it is a burr-free process which can produce a good surface finish with desirable accuracy and repeatability. This machining is mainly used to produce micro-dies, molds, surgical tools, ultra-fashioned jewelry and finishing parts for aerospace and automotive industry.6,7
Micro-nano scale tool electrodes are required to produce the high resolution feature size. However, these micro electrodes would find several other industrial applications such as sharp point tip fabrication for field ion microscopy (FIM), scanning tunneling microscopy (STM) and extensively used as a source of electrons for other various types of electron microscopy. 8 In bio medical industry micro electrodes are required for various applications. 9 However, fabrication of such microelectrode (typically below 10 µm in diameter) is a challenging task. In commercial market, the larger electrode diameters are available, which in turn directly not satisfy the user requirement. Therefore, development of a process technology that enables batch scale fabrication of Micro EDM electrodes smaller than 10 µm is one of the current research challenges. Over the years, the following methods have been developed by various researchers to fabricate Micro electrodes.
Hourmand et al. 10 presented a detailed state of the art review on micro electrode fabrication used for micro EDM drilling and milling. In this study most of the micro electrode fabrication processes were discussed. The most common way to make such tool electrodes by utilizing the WEDG (Wire Electrode Discharge Grinding) or BEDG (Block Electrode Discharge Grinding) techniques. 11 The other popular methods include hybrid machining process of LIGA, focused ion beam (FIB) milling with electrochemical etching, vibration-assisted micro-EDM, electrochemical etching with WEDG, turning µEDM and moving electrode block µEDM etc.12–15 Weng et al. 16 proposed the method of multi EDM grinding process to fabricate the microelectrodes of 20 µm with aspect ratio of 300 from 0.15 mm job dimension. Researchers demonstrated the method of fabrication of multiple electrodes and high aspect ratio micro electrodes by the reverse EDM process.17,18 However the above mentioned processes are expensive and batch scale manufacturing of smaller electrodes is remained as a challenging task for researchers. Though micro EDM or micro ECM (Electrochemical machining) is a very slow process, it is very useful as no masking is required to obtain micro-nano scaled features. 19 In addition to that very hard materials also can be machined as long as they are conductive or even semi-conductive. However, in order to get better productivity, multiple types of machining were investigated. Melmed et al. 8 reported that the electrochemical etching process can be used for sharpening the tool electrode used in Micro EDM. Benilov et al. 20 proposed the necking process to fabricate a very sharp tool below 10 µm. Mithu et al. 21 applied the electrochemical etching process to get below 50 µm tip diameter by using tungsten carbide electrode as a job. Das et al. 22 produced cylindrical micro tools with 50 µm diameter using micro electrochemical form turning operation. Xu et al. 23 proposed another novel approach based on wire electrochemical machining to fabricate the micro electrodes. Egashira et al. 14 reported the least electrode diameter of less than 1 µm by using electrochemical etching process followed by the WEDG process.
The aforementioned literatures portrayed that the electrochemical etching process shows its immense potential for making the sharp tool electrode. Additionally it is to be mentioned that handling of the produced tiny electrodes are another challenging task. Therefore a system is required which can simultaneously perform ECE for tool fabrication and micro EDM with the produced micro electrode without any human intervention. In order to make the system automated, optimization of process parameters is essential. Though the submicron range of the electrode diameter had been achieved by the researchers but the proper systematic parametric study of the electrochemical etching process is quite untouched. In order to incorporate such parametric study some related literatures are discussed below.
Recently various traditional and non-traditional optimization techniques are used to solve highly complex, multi-dimensional real life problems with limited available data. Ball et al. 24 used L27 orthogonal array (OA) to model a complex Electro hydrodynamic inkjet phenomenon (a kind of additive manufacturing) using soft computing based approaches. Tahmasebipour et al. 25 applied Taguchi methodology to optimize the STM/FIM nano tip aspect ratio. Recently Charak et al. 26 performed a theoretical analysis on Electrochemical discharge machining using Taguchi method. Therefore according to above mentioned literatures Statistical design of experiment (DOE) is one of the modern techniques that make proper plans of the experiment. In this study, experiments had been conducted according to L9 OA using Taguchi methodology.
However, application of the electrochemical etching process to fabricate below 10 µm tip diameter for batch scale production as well as application of those produced micro electrodes to create micro scale features using Micro EDM is the key novel part of this study. In this context, a detailed parametric study had been conducted to determine the relationship between the resultant electrode diameter and material removal rate (MRR) with the various process parameters. The analysis of variance (ANOVA) had been performed to identify the significant process parameters and their corresponding contributions on the output responses. The Taguchi methodology had been adapted to achieve the optimal condition for attaining the least possible electrode diameter as well as larger MRR. In addition to that, the reproducibility of the produced micro electrode had been statistically assessed. In order to evaluate the performance, the resultant micro electrodes were used to create micro features by using Micro EDM phenomenon. However, it is to be mentioned that to the best of authors’ knowledge it is the first attempt to optimize the electrochemical etching process to achieve the least possible electrode diameter as well as the corresponding larger MRR by using Taguchi methodology.
The remaining part of this paper is organized as follows. In Section 2 the experimental setup along with the design of experiment, parameter selection and experimental design have been described. Results with confirmation test, characterization of electrodes through FESEM image, EDX analysis and evaluation of the performance of produced micro electrode in Micro EDM have been elaborately illustrated in Section 3. Some concluding statements are made in Section 4.
Materials & methods
Experimental setup
The entire experimentation had been performed in an in house developed system. Figure 1 discloses the schematic diagram of the full experimental set up. Three primary hardware components named chemical system, electrical system and motion control system were used to design the whole experimental setup. The details of the three subsections are described as follows.
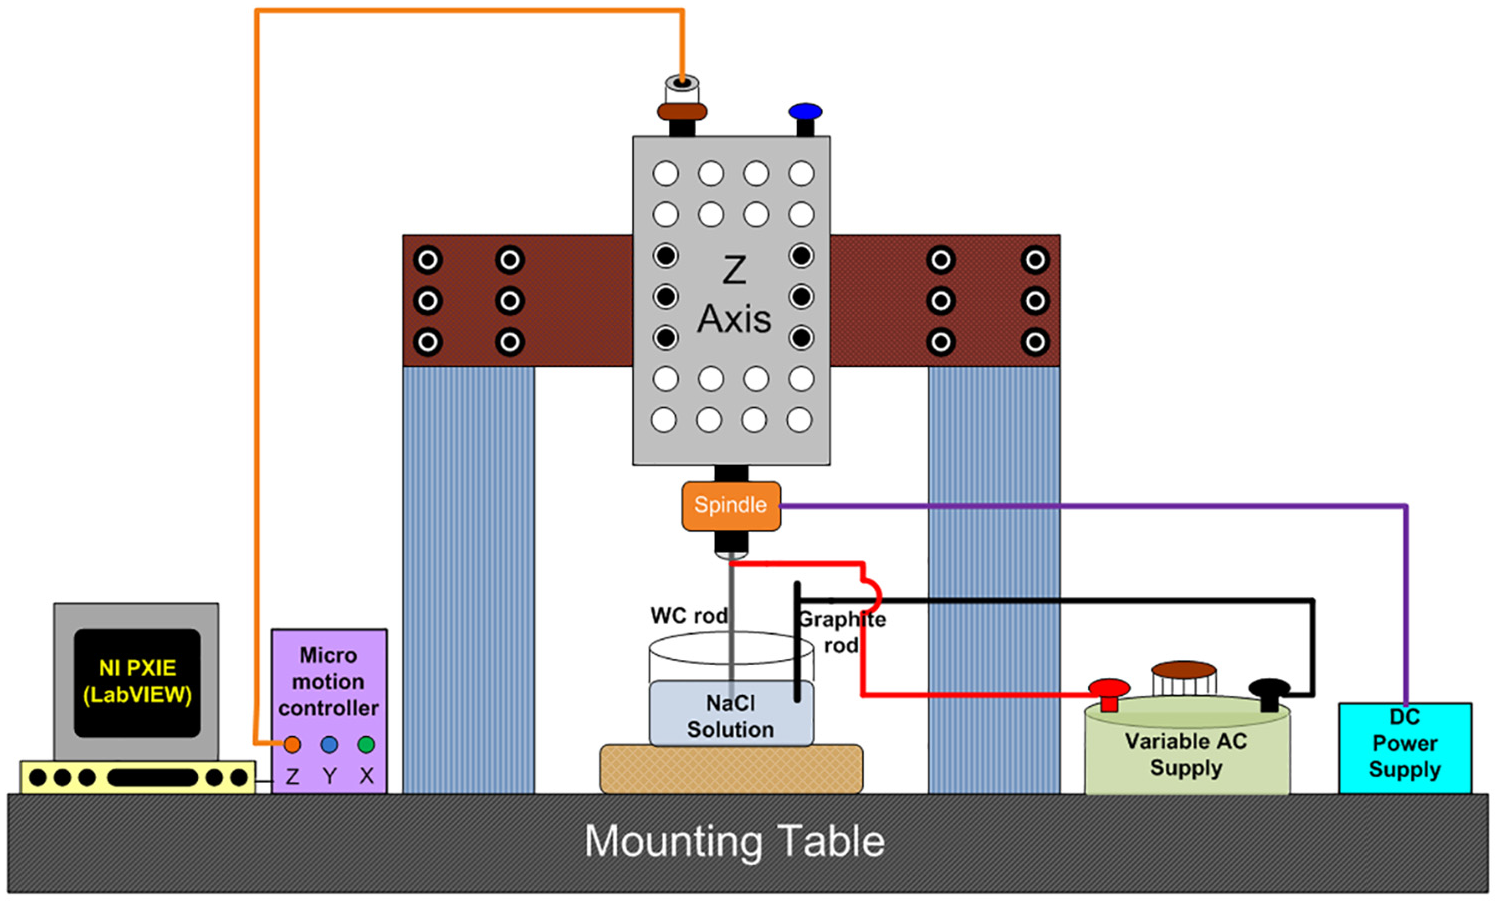
Schematic diagram of experimental set up.
Chemical system
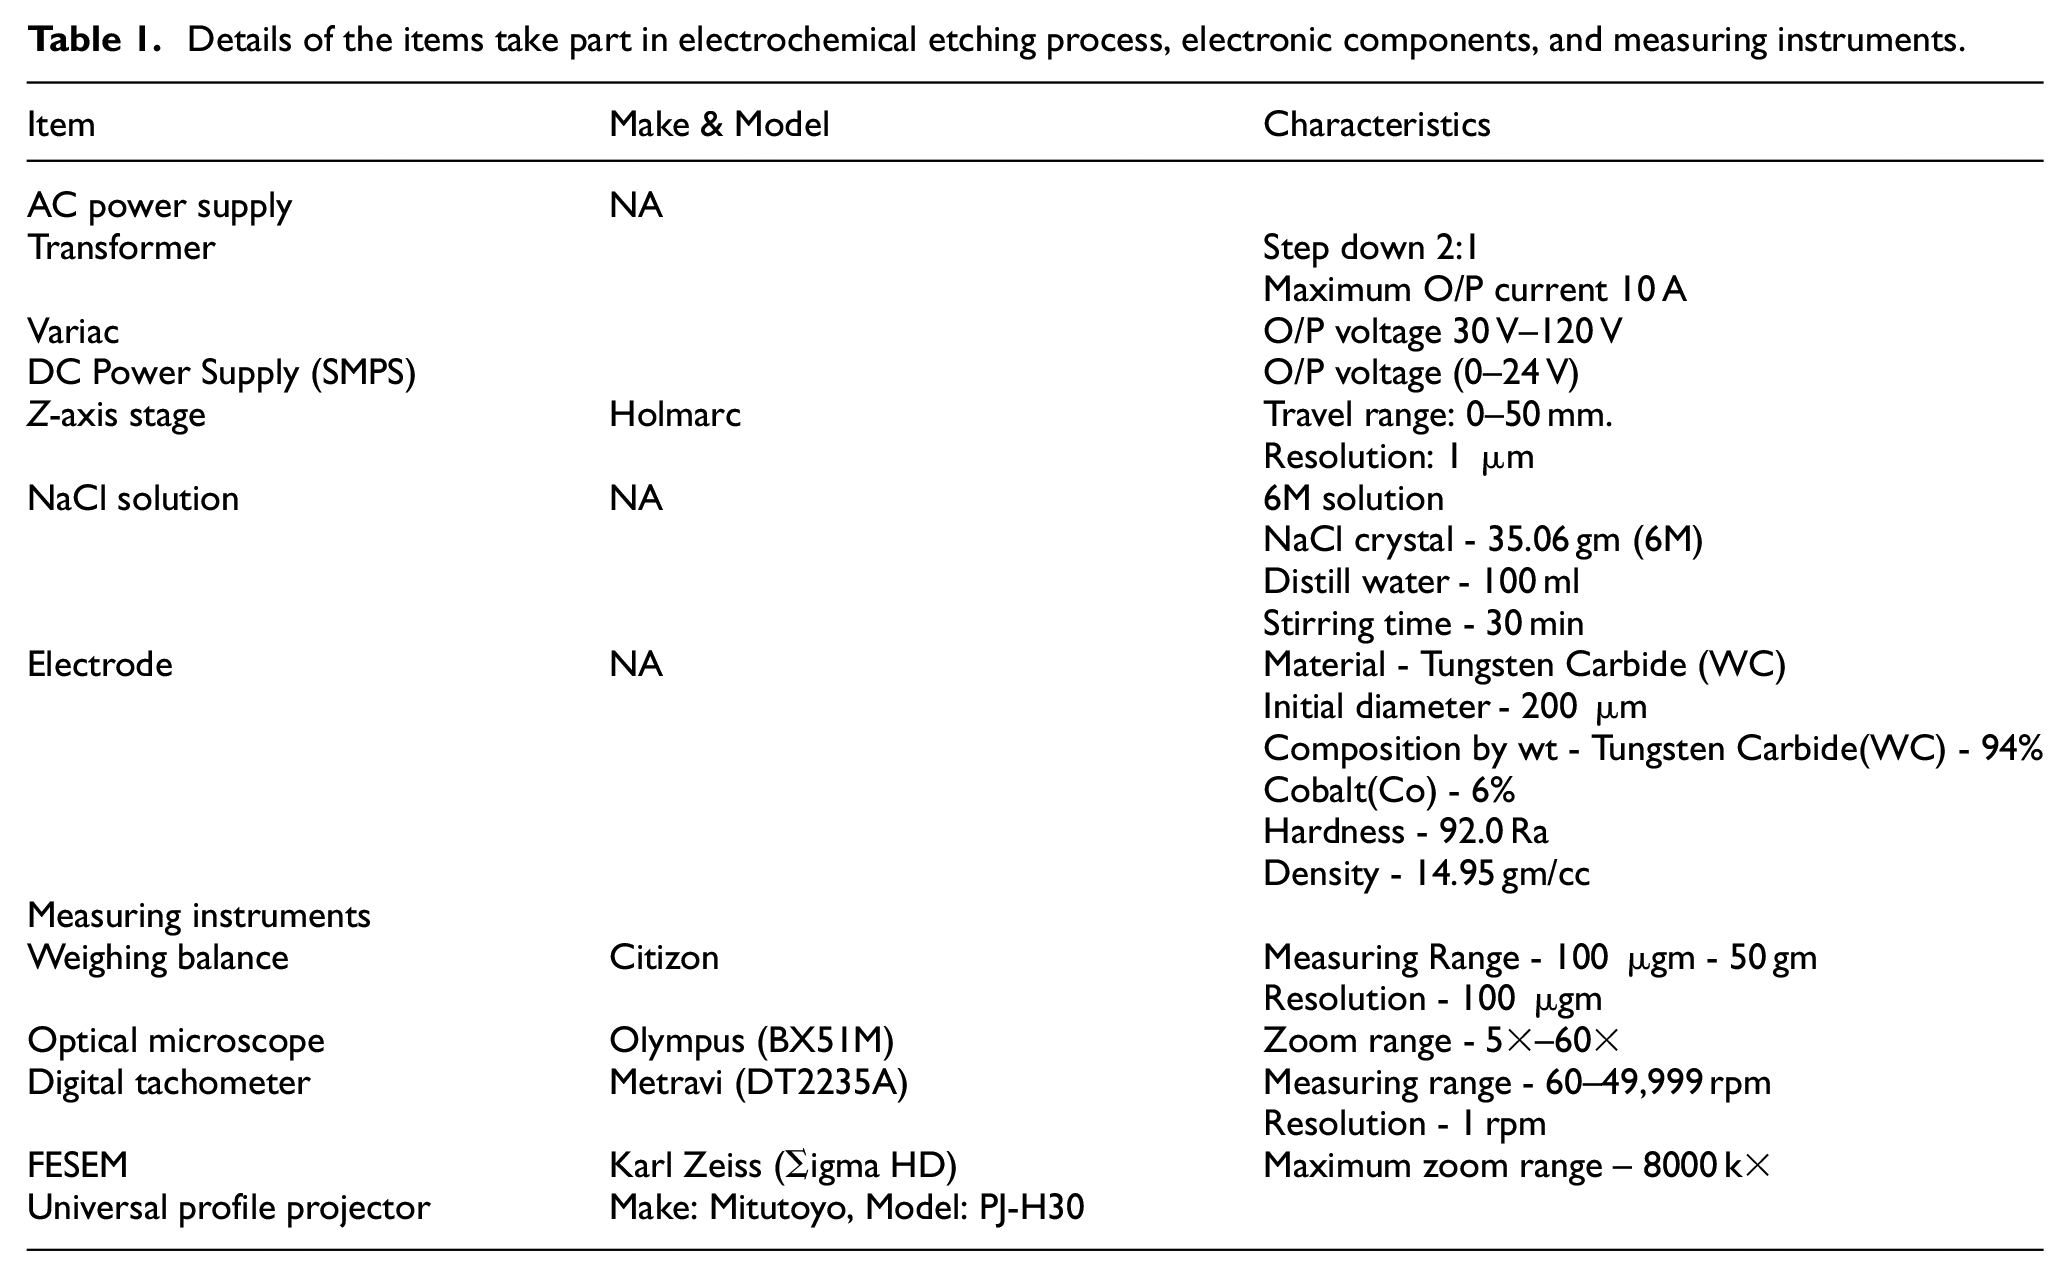
In order to perform a better electrochemical etching, selection of a suitable electrolyte (along with its concentration) and electrode material play a crucial role. Generally WC and Co both the components are dissolved in the alkali or acid based solutions, which are used as electrolytes to fabricate the tungsten carbide micro tool.19,27 However, these electrolytes may cause chemical burns, permanent injury in the contacts of unprotected human body. Therefore working with these types of chemical components needs an extra attention and expertise. Henceforth an environment friendly and low-cost electrolyte, aqueous NaCl solution was used to overcome the aforementioned limitations. In this experiment a brine NaCl solution (6M) was used as an electrolytic solution. To make a 6M NaCl solution, 35.06 gm of NaCl crystal was mixed with 100 ml. of distilled water. Then the mixture was mixed in a magnetic stirrer at 1000 RPM for 30 min in room temperature.
While a wide choice of noble materials is available (such as platinum and its alloys, tungsten and its alloys and also some super alloys), tungsten carbide (WC) was selected for this experimental study due to its high rigidity, better wear resistance and hardness. 28 On the contrary graphite rod was chosen as another electrode due to its inert characteristics in the electrochemical process. Details about electrolytes and electrodes are specified in Table 1.
Details of the items take part in electrochemical etching process, electronic components, and measuring instruments.
Electrical system
The electrical system consists of two type of power supply. (i) AC power supply was used to carry out the ECE process and (ii) DC power supply was used to rotate the spindle. A step down transformer (with 10A current O/P) along with a variable AC power supply (variac) was used to provide the variable AC voltage. Similarly the rotational speed of the spindle was controlled by varying the voltage of the dc power supply. From the previous trial experiments it was experienced that if the DC power supply is used for electrochemical etching process, the tool becomes contaminated with surface oxide (WO3) and an insulation layer is formed due to WO3. Consequently, the ECE process performance found to be deteriorated. Furthermore, it was very important to remove the contamination after a regular time interval. To solve these difficulties, if the reversed potential is applied with periodical interval (AC power supply) the contamination becomes lesser than applying the DC voltage, as natural circulation of polarity occurs between the electrodes. 29 The chemical equations ‘of ECE process is described as follows. 30
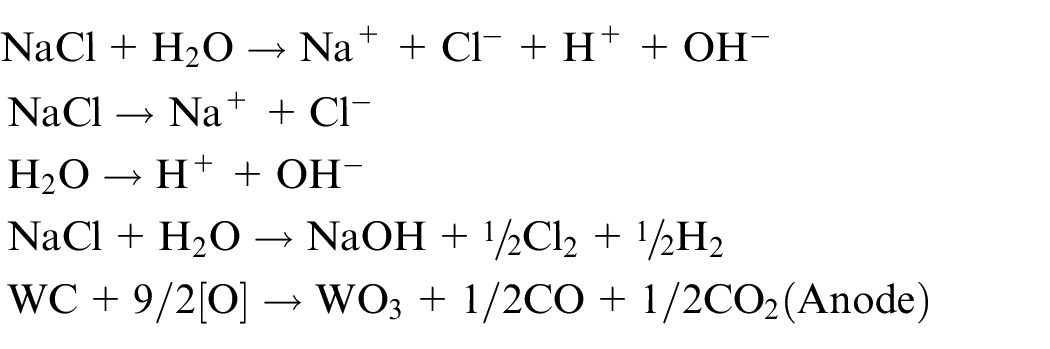


From the above mentioned reactions it can be stated that if the AC source is used, the WC rod acts as anode and cathode alternatively. When it acts as anode it forms some surface oxide (WO3) which acts as an insulator. On the contrary, in the next half of the cycle when it acts as cathode it forms sodium tungstate (Na2WO4) and it is soluble in water. Therefore the impurity which forms during the positive half cycle of the AC supply are removed in the negative half cycle. Henceforth AC source was applied to mitigate the issues of applying DC power supply in this context. Bhattacharyya et al. 31 applied pulsed power supply with 5A current rating for ECE and accordingly in this study an AC power supply capable of providing maximum 10A current was used. More detailed information about both the power supply is furnished in Table 1.
Motion controller
Duration of electrode immersion in the electrolyte, length of immersed portion of the electrode, time interval between two successive immersions etc. are very important factors for controlling the ECE process. Hence vertical axis movement had been controlled by using a linear stage with a resolution of 1 µm. A tool electrode of 25 mm length was mounted in the spindle attached with the vertical Z-axis. A GUI (Graphical user interface) had been developed using LABVIEW platform to regulate the motion of the tool electrode. The setup was configured in such a way that the travel of the tool electrode was done by using a standard Computer Numeric Control (CNC) (G & M codes); which controlled the dropping and releasing of the electrode from the electrolytic solution.
Experimental procedure
The experimental set up is the combination of the three sub sections which is discussed in the previous section. A glass beaker filled with saturated NaCl solution was kept under the tool electrode (WC). A graphite rod was fixed in the NaCl solution, served as a complimentary electrode. For each experimental trial, 8 mm. length of the electrode (total length 25 mm.) was immersed in and released from the electrolyte solution for forty times with a regular time interval. These forty times again was divided into four parts, the time interval between the subparts were maintained as 60 s. A pictorial representation of the time division is given in Figure 2. The CNC coding was written in such a way that each subpart (10 times dipping and releasing) would take 30 s. Consequently the total machining time required for each trial was 5 min. A massive heat was produced during the dipping of the tool electrode. Hence a specific time interval was imposed between the sub parts to restore the electrolyte solution after a certain gap. After successful completion of each trial run the electrode was unmounted and rinsed properly using the distilled water. This step helped to remove the deposited salt from the electrode surface. Figure 3 reveals a bird’s eye view of the original experimental setup.
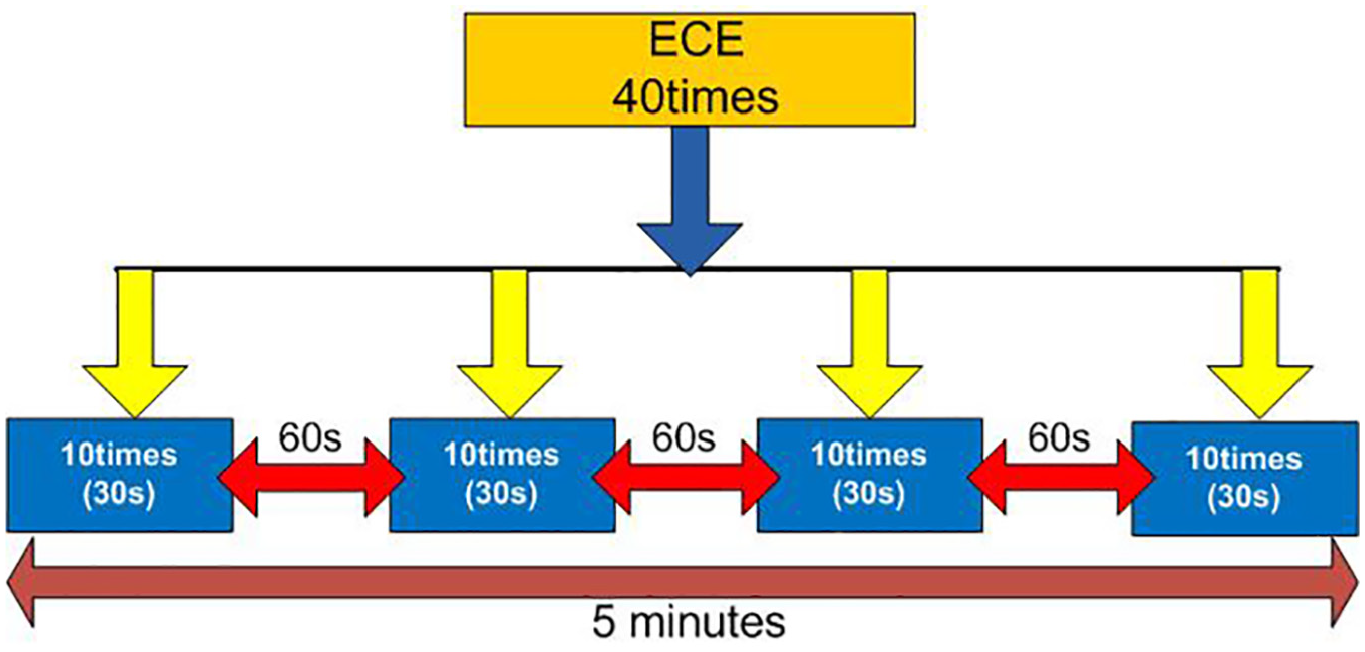
Time division of ECE process.
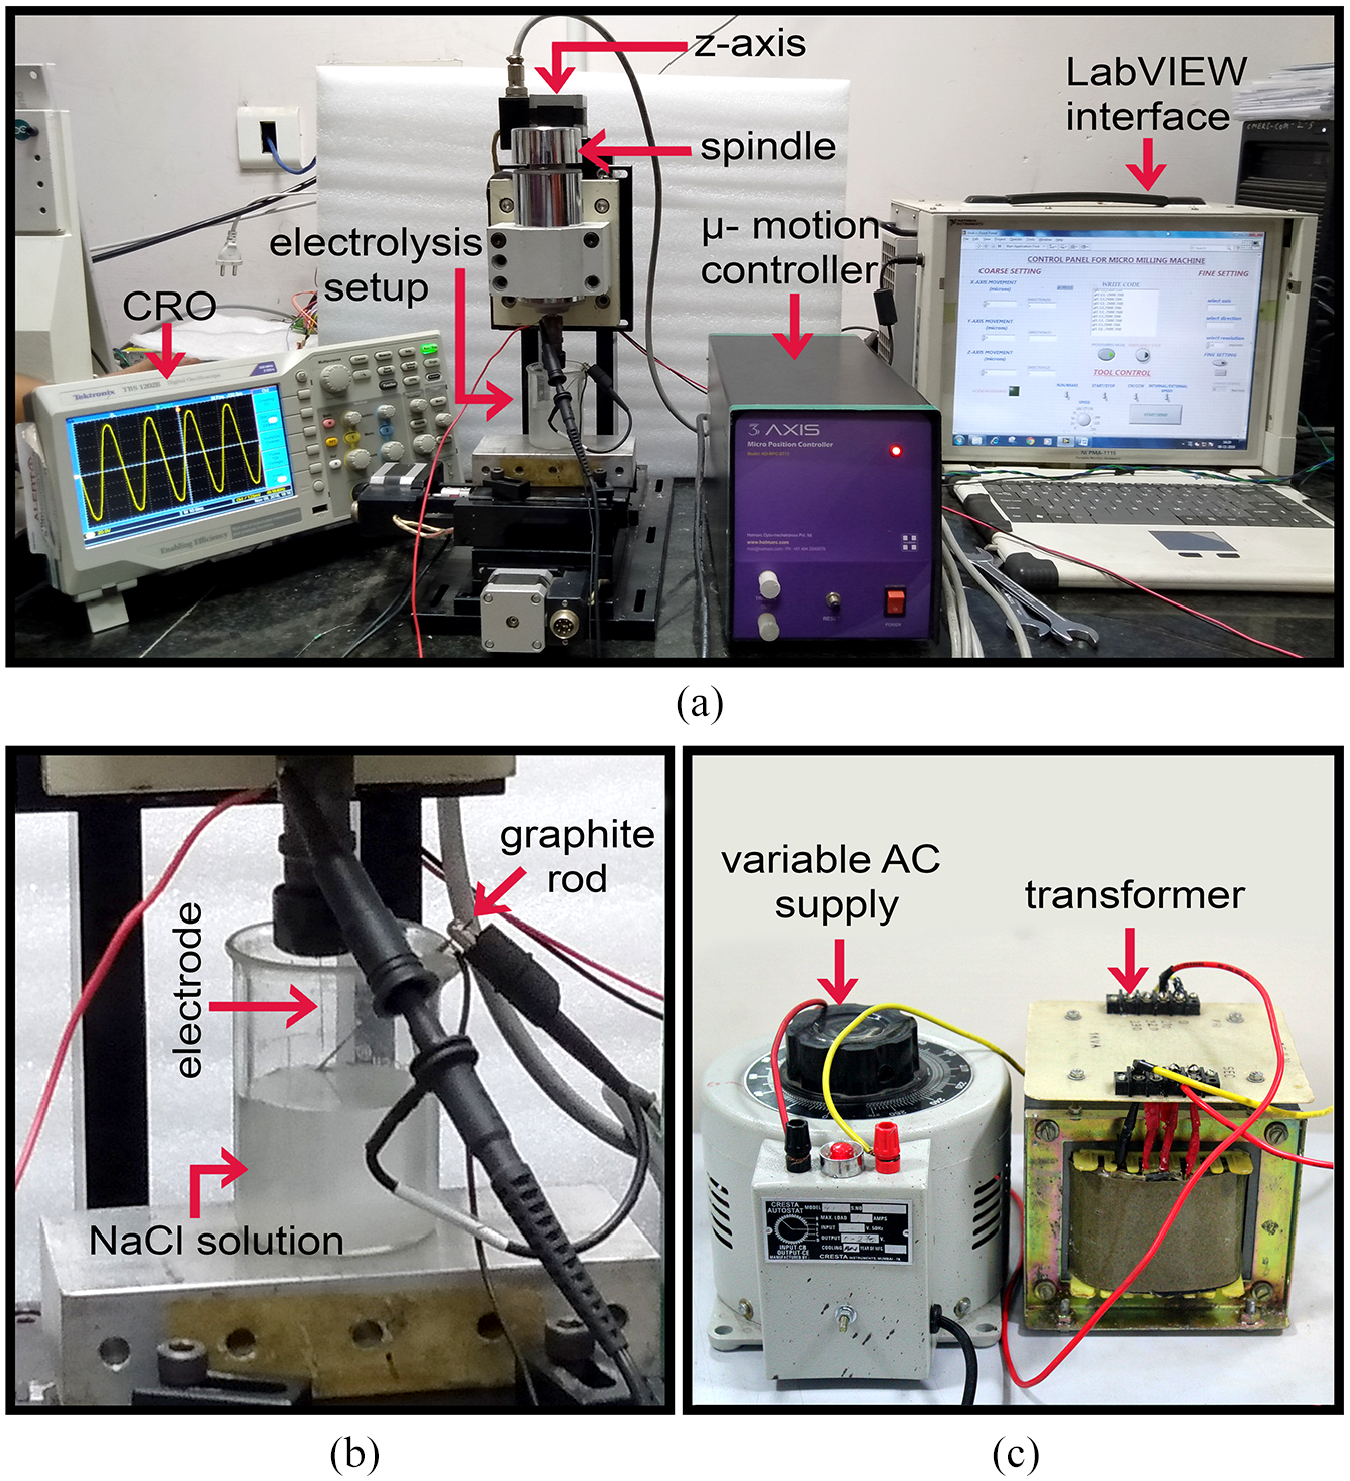
(a) A bird’s eye view of the experimental setup, (b) Zoomed version of electrolysis setup and (c) AC power supply unit for the electrolysis process.
Design of experiments using Taguchi methodology
Design of Experiments was primarily developed in earlier 20th century, and since, these statistical methods are applied to optimize the different process conditions to get the desired outputs. These methods include the full factorial, fractional factorial design, central composite design (CCD) which are not very simple to be used by industrial people. Increased number of process parameters lead to increase the number of trials to be conducted. To obtain the desired output with minimum number of trials, a robust design methodology was proposed by the Japanese scientist Genichi Taguchi, is called Taguchi method. 32
Loss function is one of the important terms in Taguchi method and it can be described as the deviation of the experimental result from the desired result. Further, it is converted to SNR 33 which is considered as the primary quality characteristics of the output response. In a simpler way, SNR is defined as the ratio between signal power to the noise power, and it is often expressed in decibels (dB). In Taguchi method, Signal to Noise (S/N) ratio is used as the primary measurable variable to get the quality characteristic. Instead of analyzing standard deviation, SNR was used as the primary measurable element due to the direct proportional relationship between mean and standard deviation. SNR determines the level of the desired signal under different noisy conditions. However, the higher value of SNR reveals the higher concentration of desired information than noisy data. 34 The major advantages of the concept of SNR are improvement of the quality of the product by reducing the variability and also improvement in the measurement.
The primary objective of this experiment is to obtain the tool electrode with a smaller diameter as well as the larger MRR. Therefore, to minimize the diameter of the electrode, “smaller is better” and to get larger MRR “larger is better” quality characteristics had been chosen for this investigation. 35 Table 2 represents the mathematical form of three quality characteristics.
Taguchi quality characteristic and their corresponding parameters.
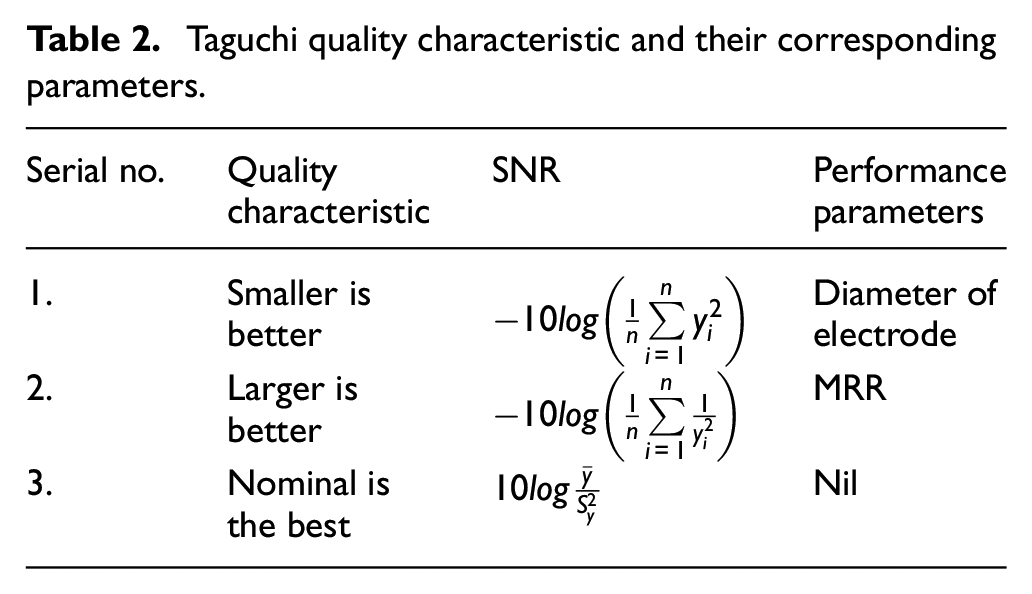
Where n: number of replication of each experiment; yi : i
th
observation;
Selection of parameters
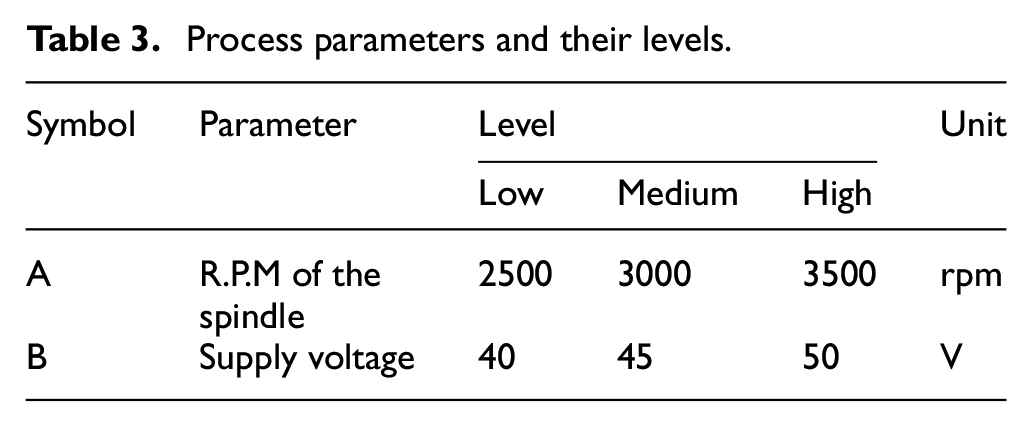
According to some previous studies R.P.M of the spindle (A) and AC Supply voltage (B) were considered as the two control parameters.3,15,22 With the limited DC voltage of 24V, the maximum achievable spindle speed of 3500 rpm was selected as the upper limit and a trial and error method was adopted for determining the lower limit of factor A. After a few trial run it had been decided that the feasible working range of the supply voltage (factor B) remains between 40VAC to 50VAC. During the entire experimental process, the concentration of electrolytic solution, speed of the electrode immersion, duration of electrode immersion, length of dipped portion of the electrode and all other parameters were unaltered. Each experimental run was replicated for twice. The input process parameters and their corresponding levels along with the unit are given in Table 3.
Process parameters and their levels.
Experimental design
One of the prime factors in Taguchi method is to use an orthogonal array (OA). 36 Selection of an appropriate OA is a pivotal step to reduce the experimental runs systematically. In this study, depending on the number of factors and their levels, Taguchi L9 OA had been chosen to carry out the experiment. Table 4 reveals all the combinations of L9 OA.
Design of experiments.
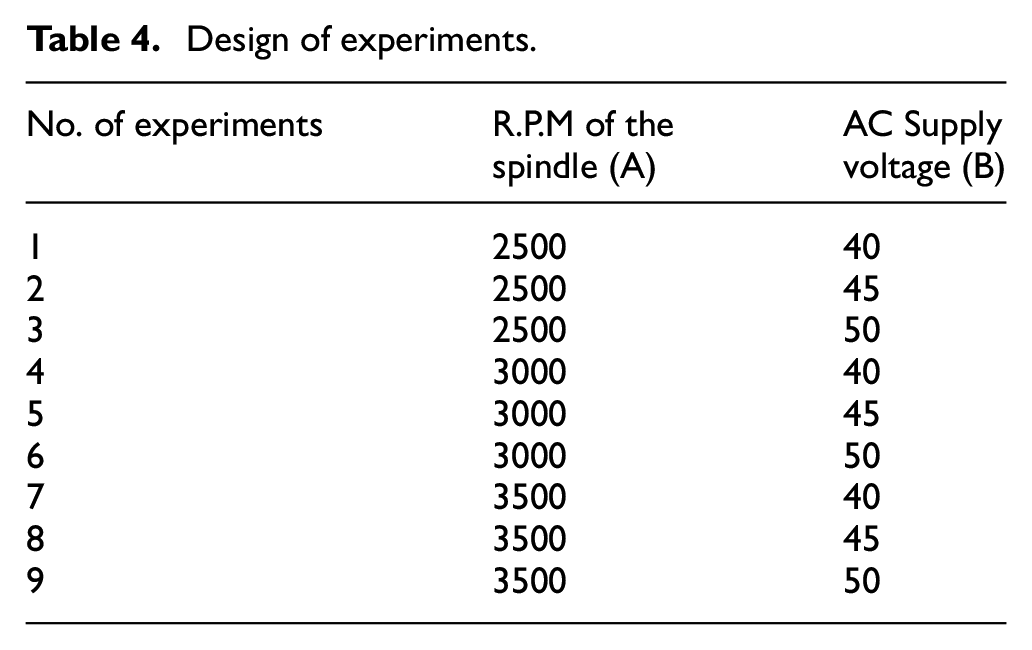
It is to be mentioned that all the trials were performed arbitrarily.
Analysis, results and discussions
Measurement and analysis of diameter of electrode
The mean value of the resultant electrode diameter was obtained after replicating each of the experimental run twice while keeping other operating conditions unaltered. Diameter of the Electrode was measured using the optical microscope. To validate the results, some of the electrodes were measured using FESEM. The responses were measured for every input combination, and the optimal conditions were determined by SNR. Achieving least resultant electrode diameter is the key objective of this experimental study. Therefore, “Smaller is better” quality characteristic had been chosen for computing the SNR. The resultant diameter of the electrodes, average of two replications along with their SNR for each experimental run is given in Table 5 and few microscopic images of the produced microelectrodes are shown in Figure 4.
Experimental result and their corresponding SNR values.
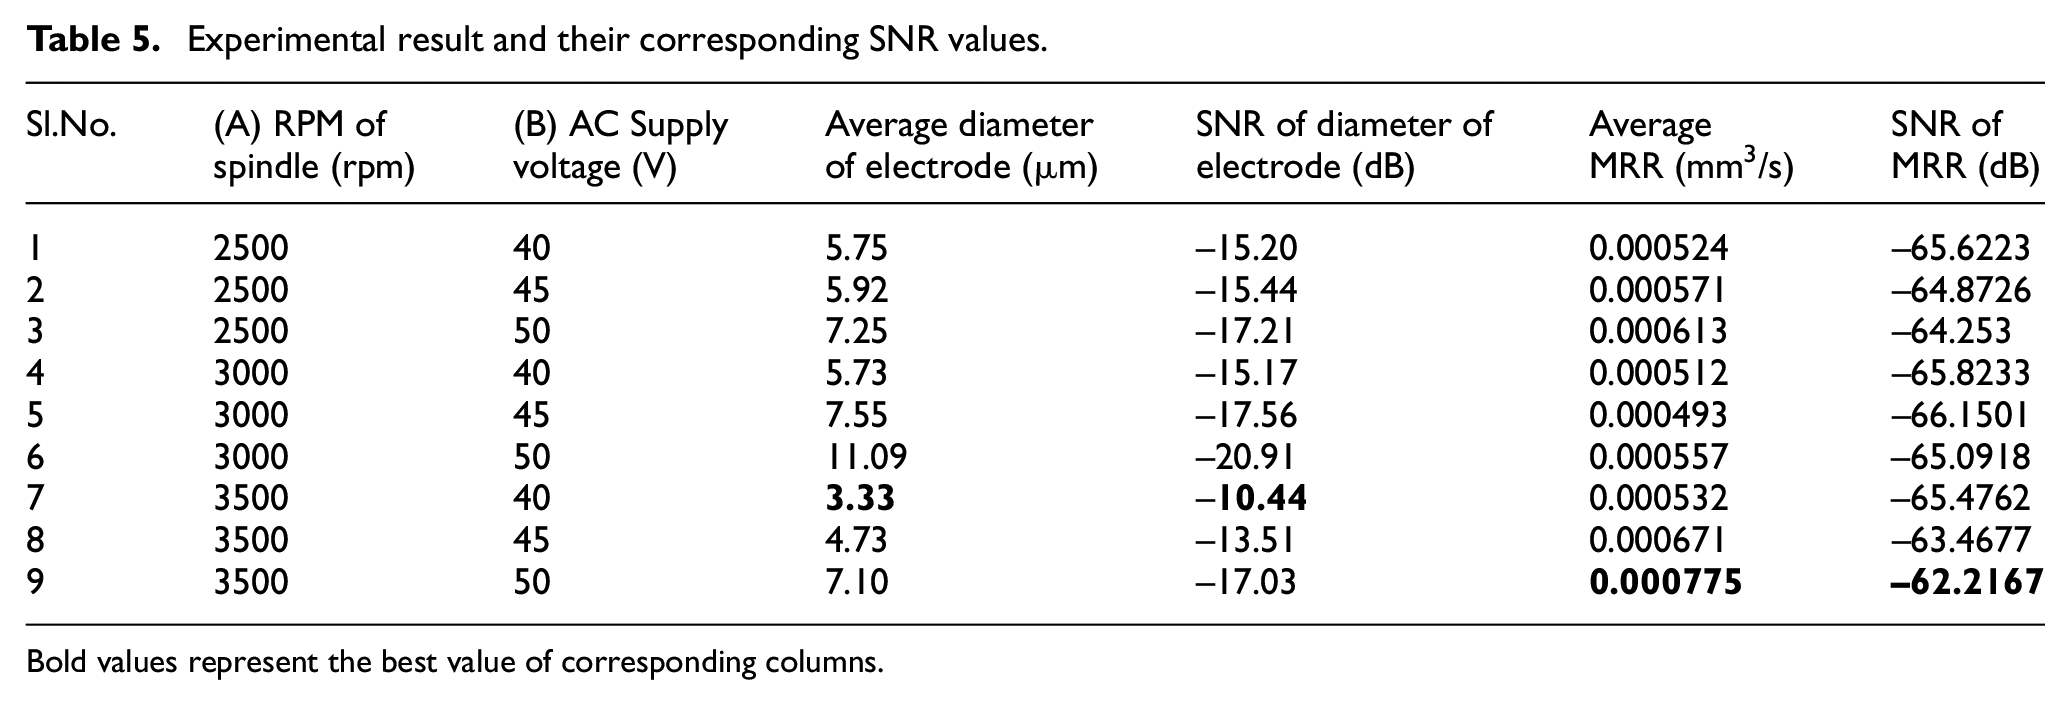
Bold values represent the best value of corresponding columns.
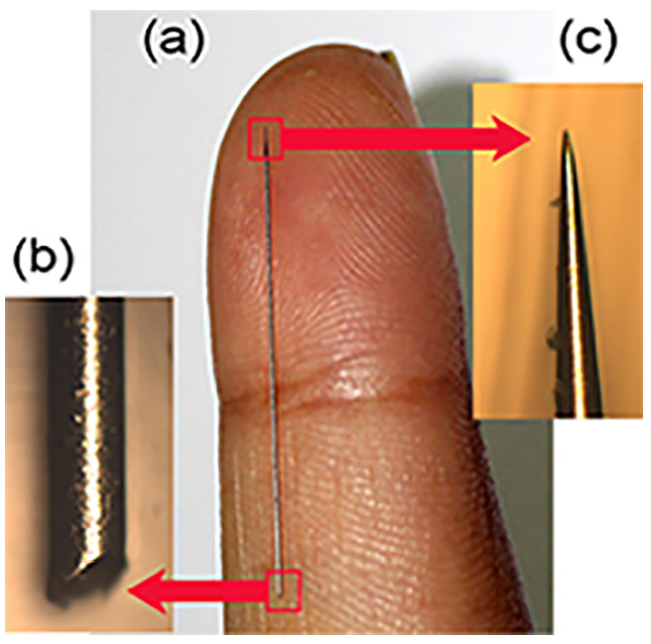
(a) Solid cylindrical WC electrode of ϕ = 200 µm, (b) Microscopic (10×) image of the sharp portion (machined) of the electrode, and (c) Microscopic (10×) image of the unmachined part of the reference electrode.
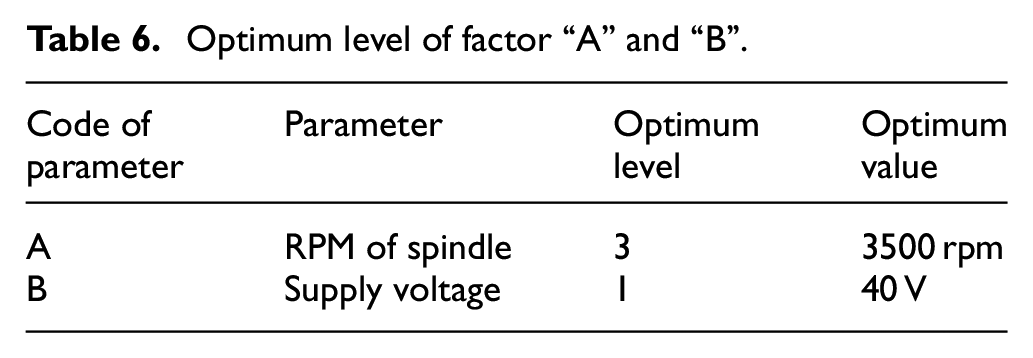
Main effects plot for parameter “A” and “B” are shown in Figure 5(a) and (b) respectively. From Figure 5(b) it can be observed that as the supply voltage increases the SNR declines accordingly. Since the “smaller is better” approach was taken to characterize the output response, it is obvious that the response is inversely proportional to the supply voltage in this region. As seen in Figure 5(a), initially the SNR value of the RPM of the spindle deteriorated up to the mid-level value and then again started to improve and reached to the best possible value. Both the mean and SNR analysis depicted that the level 3 of spindle RPM (A3) and level 1 of supply voltage (B1) are optimal. The optimal value of process parameters are represented in Table 6.
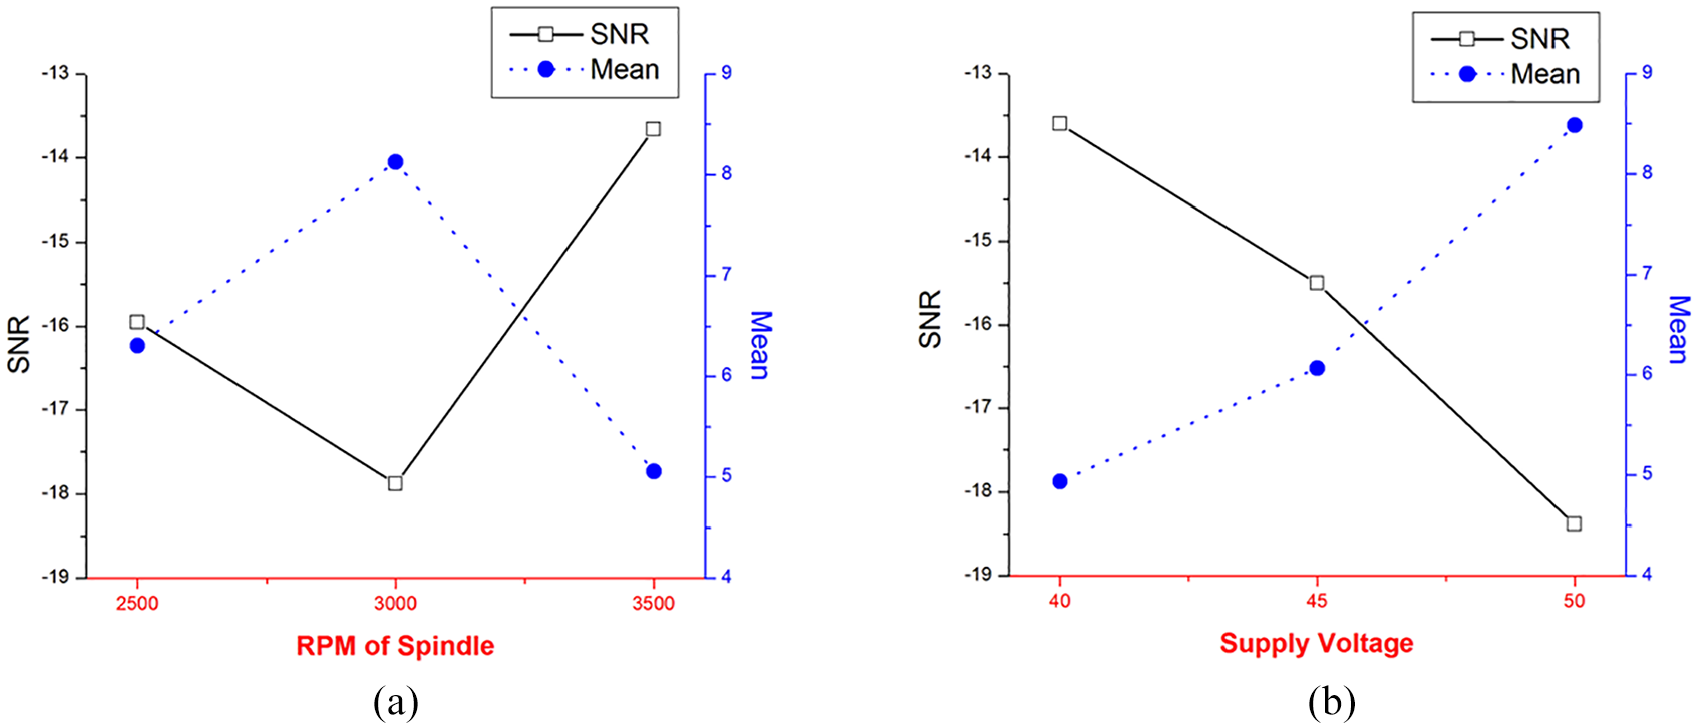
Effect of the control factors on the mean and SNR for: (a) RPM of spindle and (b) Supply voltage.
Optimum level of factor “A” and “B”.
Analysis of Variance (ANOVA) gives the contribution of each factor on the output response. Here ANOVA was performed for these two control parameters to get the contribution of each level of the input factors and quantify their significance on the diameter of electrode as shown in Table 7. Here the ANOVA was performed with 90% confidence level. Degrees of freedom (DOF), Total sum of squares (SS), Variance and F-ratio are defined below.

ANOVA table of SNR for factor A, B with 90% confidence level; Tabulated F-ratio at
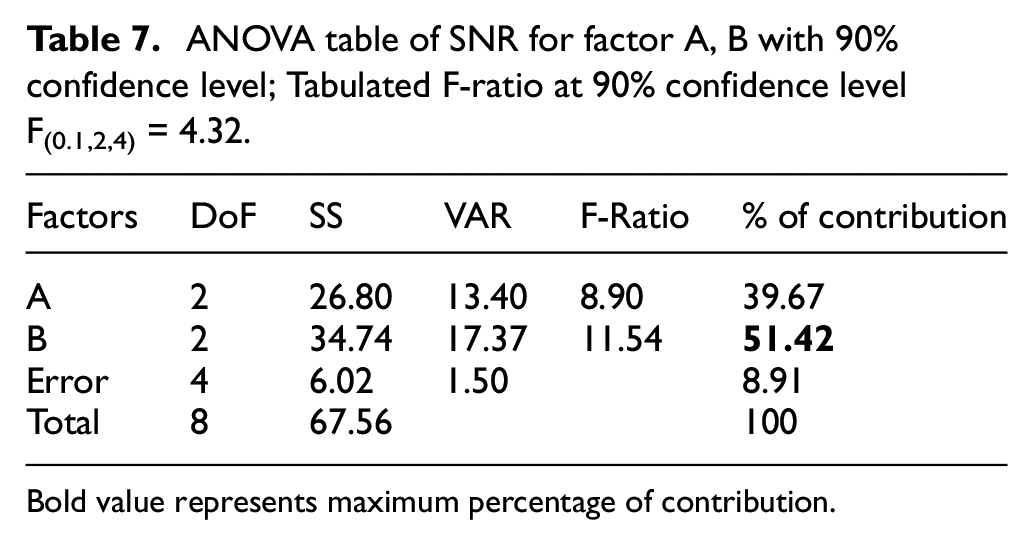
Bold value represents maximum percentage of contribution.
where Yi = SNR of the ith observation, n = no. of observation, y′ = Average of the SNR of the n observations.
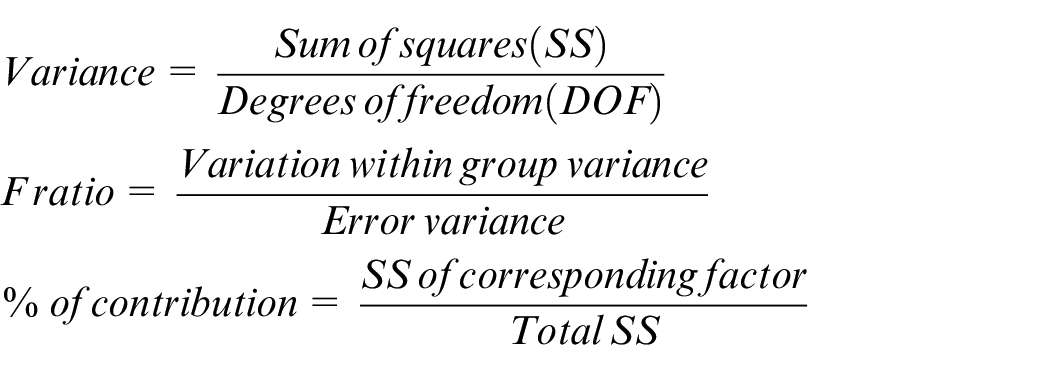
From the mathematical point of view, it can be stated that superior F- ratio defines more contribution to the output response. If the F-ratio of a given process parameter is more than the critical F-ratio value, then that process parameter is considered to have a significant contribution on the output response. Critical F-ratio value was calculated from a standard F-distribution table with F(0.1,n1,n2). As the ANOVA was determined with 90% confidence interval, F-ratio would be calculated at (1–0.9 = 0.1) significance level, n1 signifies the DOF for the corresponding factor and n2 signifies the DOF of the error term.
In this case, the F-value for parameter “A” and “B” are 8.9 and 11.54 respectively which are more than the critical F- value given in standard F table (F(0.1,2,4) = 4.32). Therefore, it can be inferred from F-ratio analysis that each parameter has significant influence on the response. Factor “B” i.e. supply voltage had been revealed as the most significant factor with 51.42% of contribution followed by factor “A” with 39.67% of contribution. However, it is to be mentioned that the analysis had been carried out with 90% confidence level based on the data obtained from Table 4.
Effect of supply voltage on diameter of electrode
It has been observed that in the particular range of supply voltage, the minimum supply voltage is more suitable for getting the least electrode diameter. In this regard Lim et al. 10 reported that the desired conical shape of electrode can be achieved at the lower level of the supplied voltage. More intense sparking phenomena are observed with the higher applied voltage. It triggers the oxidation process due to temperature rise. Since the oxidized form of tungsten (WO3) acts as an insulator, higher applied voltage is not a favorable condition in this context.
Effect of spindle RPM on diameter of electrode
Though supply voltage is the primary contributing factor, RPM of spindle also has the significant contribution on the output. This rotational motion helps to flush out the electrolyte properly, prevents the formation of hydrogen bubbles and helps to maintain the uniform shape of the electrode. A lower diameter of the electrode was obtained with the gradual increment of RPM at a constant supply voltage. Over and above the higher value of RPM prevents the formation of hydrogen bubble more efficiently and avoids junk deposition.
Measurement and analysis of Material removal rate
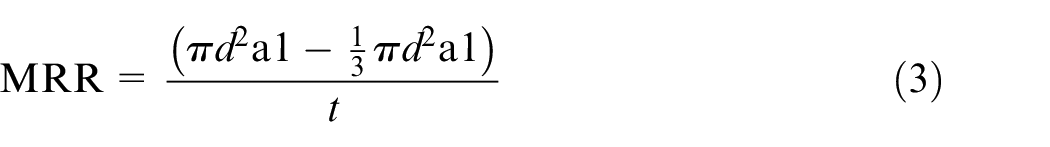
A schematic diagram along with the original image of the machined micro electrode taken by using universal profile projector is seen in Figure 6. Here a1 is the conical length. c1 is the length at which point the diameter of the electrode is 20 µm and b1 is the half length of the c1. The electrode was initially cylindrical in shape. While doing ECE the front portion of tool electrode was dipped into the NaCl solution and the etching was started from there. Though the same length (8 mm from the front tip) of the electrode was dipped into the electrolytic solution, the conical length became different based on different values of process parameters. The material removal rate (MRR) was calculated as the difference between the volume of PQRS cylinder and PQX cone in unit time. The relation is described in equation (3). Where d denotes the diameter of the reference electrode (200 µm), a1 represents the conical length of the electrode and t is the etching time (5 min).
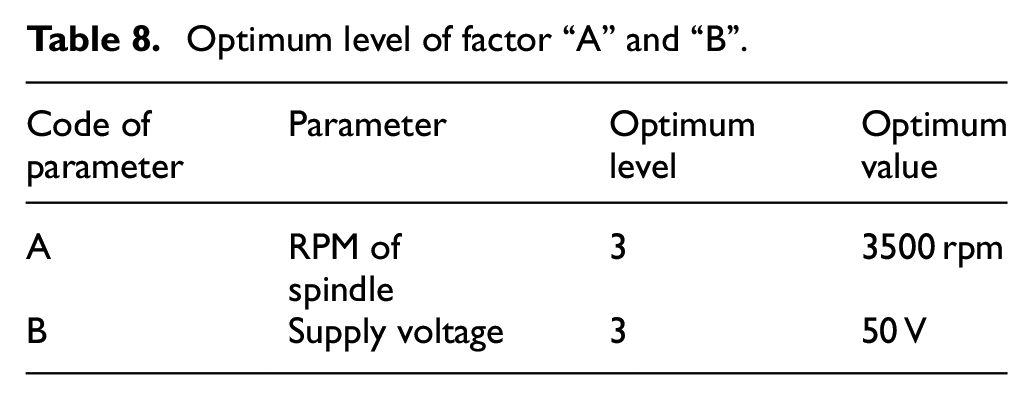
Main effects plot for parameter “A” and “B” are shown in Figure 7(a) and (b) respectively. From Figure 7(b) it can be observed that as the supply voltage increases the SNR also increases accordingly. Since the “larger is better” approach was taken to characterize the output response, it is obvious that the response is directly proportional to the supply voltage in this region. As seen in Figure 7(a), initially the SNR value of the RPM of the spindle deteriorated up to the mid-level value and then again started to improve and reached to the best possible value. Both the mean and SNR analysis depicted that the level 3 of spindle RPM (A3) and level 3 of supply voltage (B3) are optimal. The optimal value of process parameters are represented in Table 8.
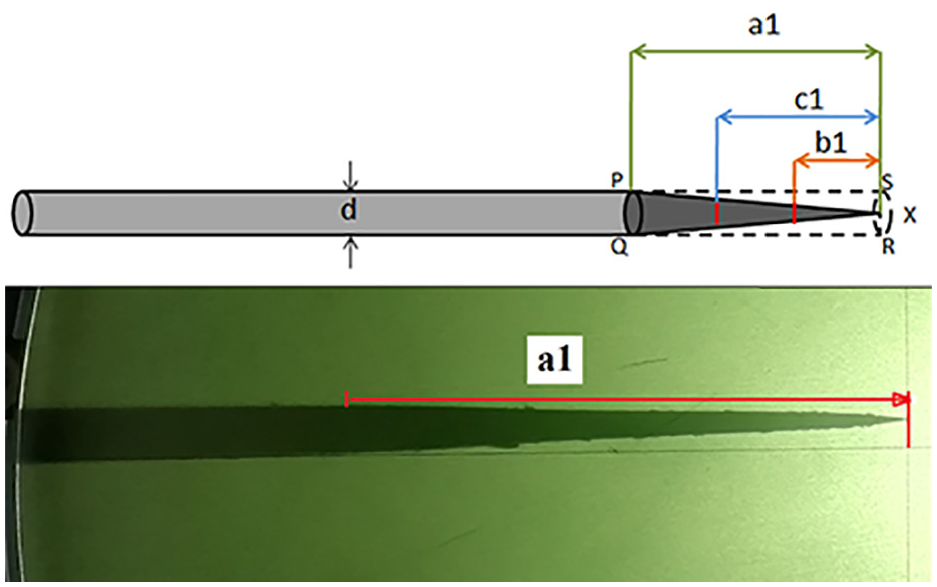
Schematic diagram and original image of micro electrode in profile projector.
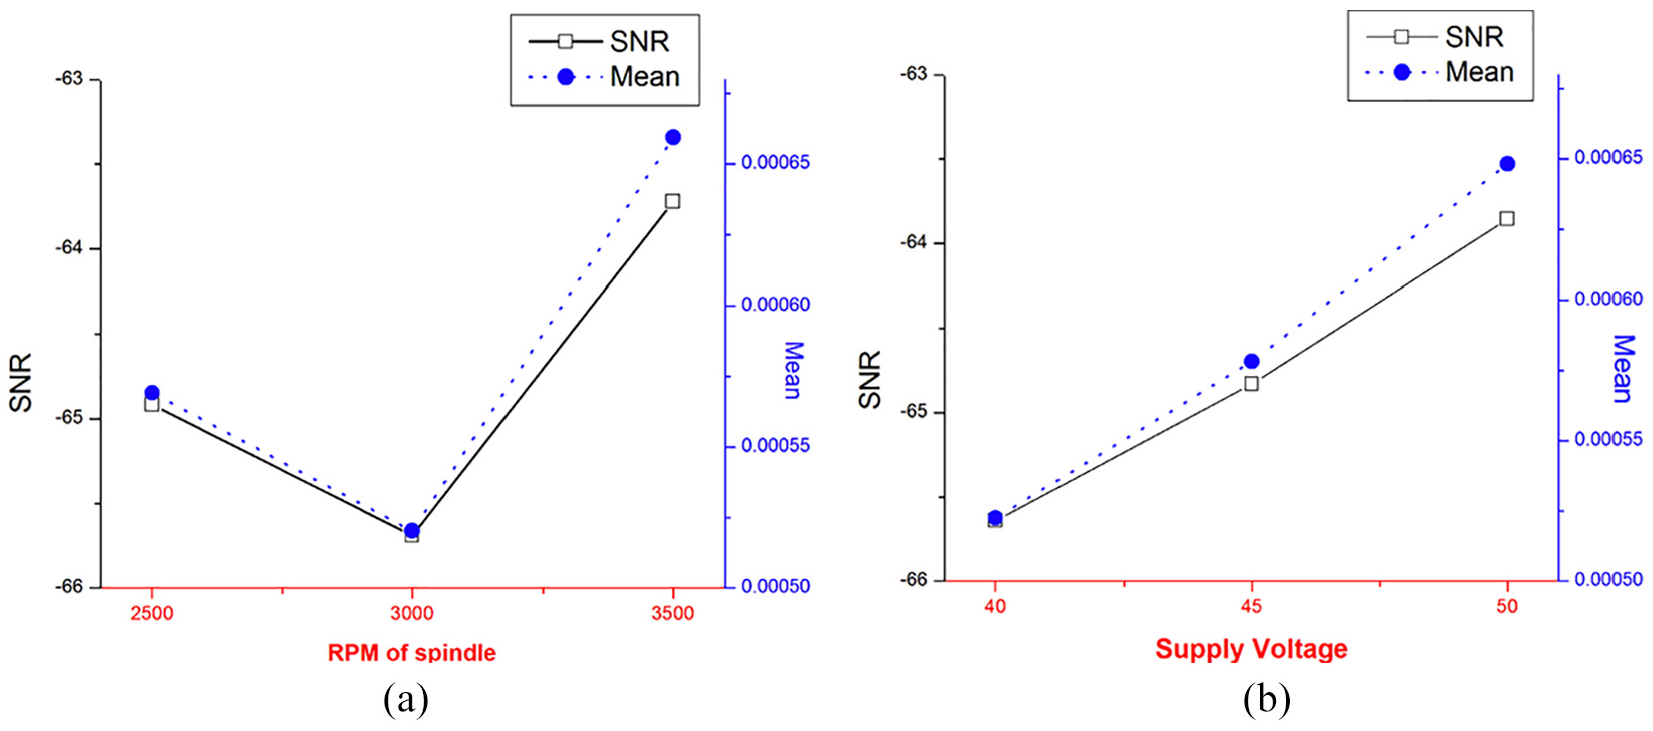
Effect of the control factors on the mean and SNR for MRR analysis: (a) RPM of spindle and (b) Supply voltage.
Optimum level of factor “A” and “B”.
In this case, the F-value for parameter “A” and “B” are 5.533 and 4.504 respectively which are more than the critical F-value given in standard F table (F(0.1, 2, 4) = 4.32). Therefore, it can be concluded from F-ratio analysis that each parameter has significant influence on the response. Factor “A” that is, RPM of spindle had been revealed as the most significant factor with 45.97% of contribution followed by factor “B” with 37.42% of contribution. However, it is important to mention that the analysis had been carried out with 90% confidence level based on the data obtained from Table 4.
Effect of supply voltage on MRR
From the above discussion it is revealed that the MRR is increased with the increment of supply voltage. According to equation (3), MRR is a function of a1 (conical length). The motion controller was used to maintain a constant immersed length of 4 mm throughout all the trial runs. Based on different combinations of the process parameter, different conical length of the immersed electrode was obtained. The main effects plot for supply voltage (Figure 7(b)) depicts that the conical length of the micro electrode was increased with increment of the supply voltage as a result of more materials removed from the electrode surface. According to Faraday’s first law of electrolysis “The chemical deposition or material removal due to the flow of current through an electrolyte is directly proportional to the quantity of electricity (coulombs) passed through it”, 37 that is,

where m = mass of deposited or removed material, Q = quantity of electricity and Z = electrochemical equivalent of the substance and

where Q: quantity of electricity; C: capacitance: and V: applied voltage.
From the above two equations it can be stated that if the applied voltage is increased with a fixed capacitance, quantity of electricity will be increased accordingly (as per equation (5)) and consequently the mass of the deposition/removal will also be increased (as per equation (4)). Thus the enhancement of MRR with the increment of applied voltage satisfies the Faraday’s first law of electrolysis.
Effect of RPM of spindle on MRR
Similarly, from the mean and SNR analysis of RPM of spindle (Figure 7(a)) shows that MRR also has an incremental effect with the increment of RPM of spindle due to the proper removal of the material as found in the previous studies.38–40 Larger value of spindle RPM ensures the better prevention of hydrogen bubble formation and flushing out the material properly. However this RPM of spindle helps immensely to maintain the proper and uniform conical shape of the produced micro electrode.
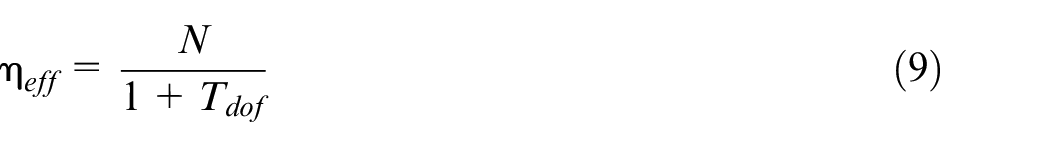
Prediction of output responses under the optimized condition
Applying SNR analysis as well as mean response characteristics on factor “A” and “B”, the optimal levels of control factors for both output responses were obtained. From the analysis, it was found that both the parameters had their significant contributions on outputs as seen in Tables 7 and 9. To approximate the least resultant diameter of the electrode as well as the larger value of MRR, considering the optimal condition the below equation (6) and equation (7) can be used respectively. 35


ANOVA table of SNR for factor A, B with 90% confidence level; Tabulated F-ratio at
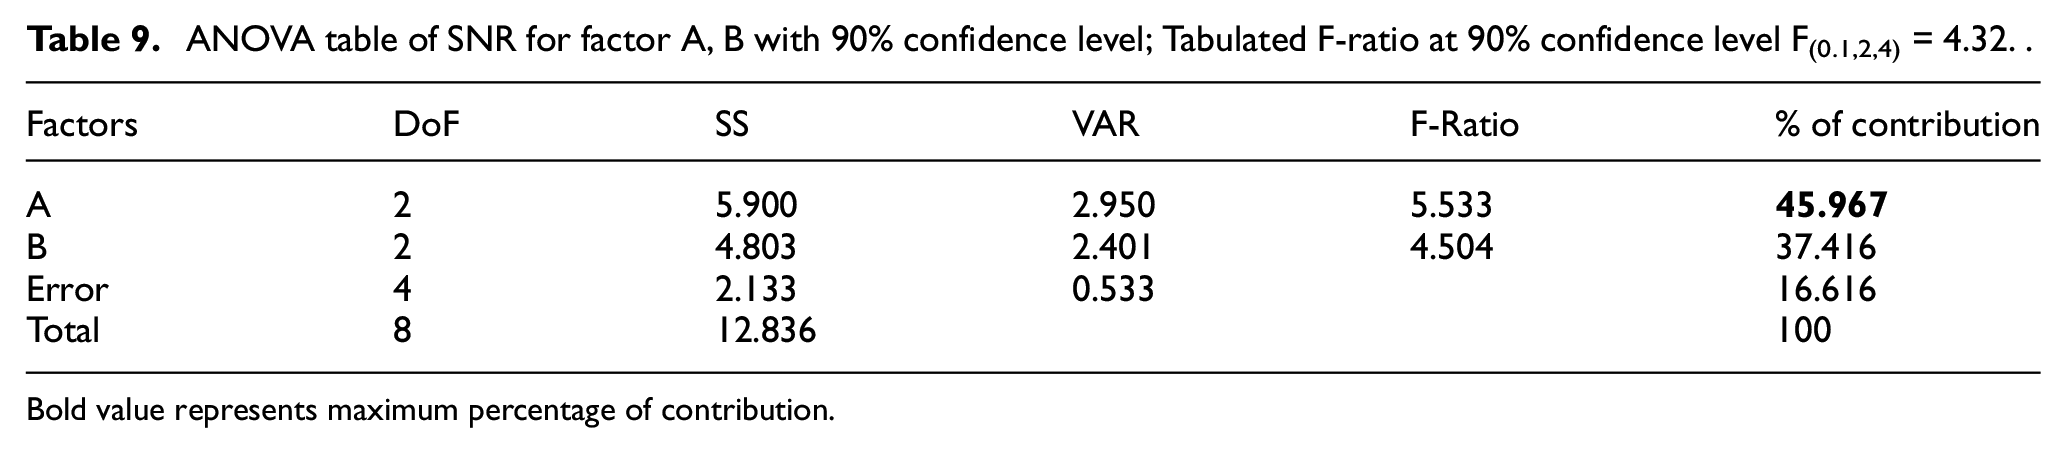
Bold value represents maximum percentage of contribution.
where ηopt1 and ηopt2 denote the predicted SNR of quality characteristics for diameter of electrode and MRR respectively.
Since,

Since,

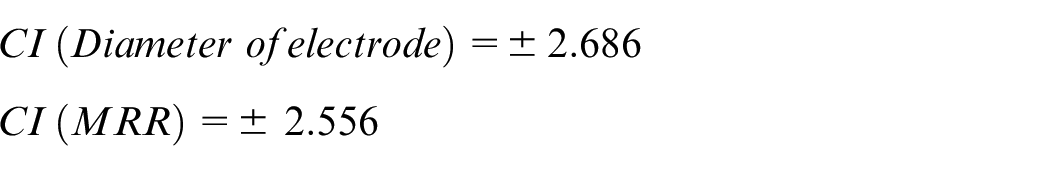
As the optimal condition is assumed to be at 90%; the confidence interval can be calculated by applying the following equations.27,28
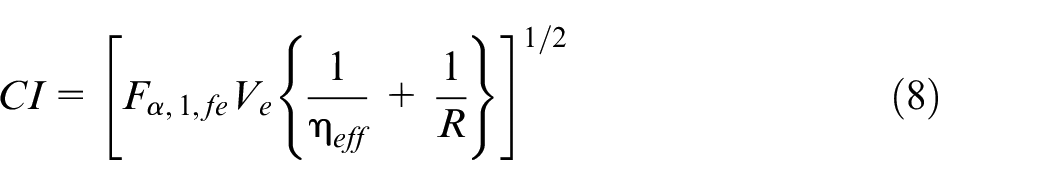
and
Substituting all corresponding values
However the estimated optimal SNR of the electrode diameter is
Conversion of predicted results from SNR to its original units
Since the analysis of this study is based on the SNR unit (dB). Therefore, the Estimated average electrode diameter (
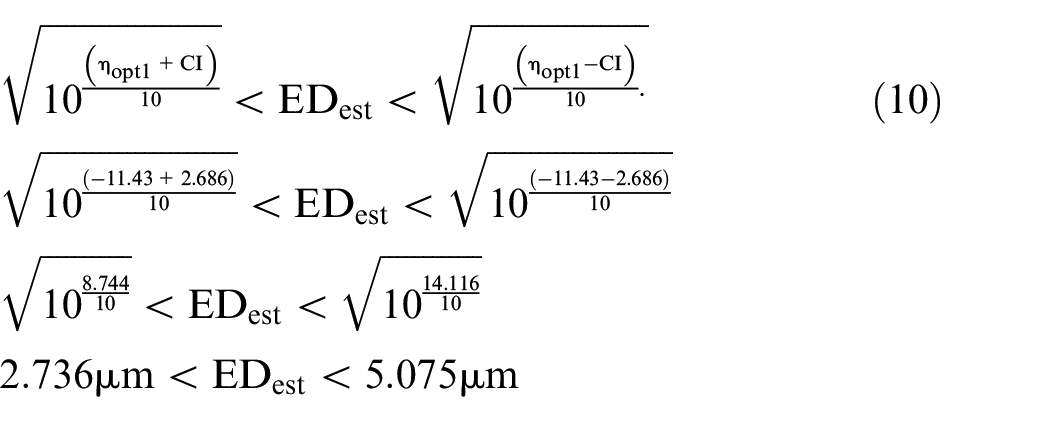
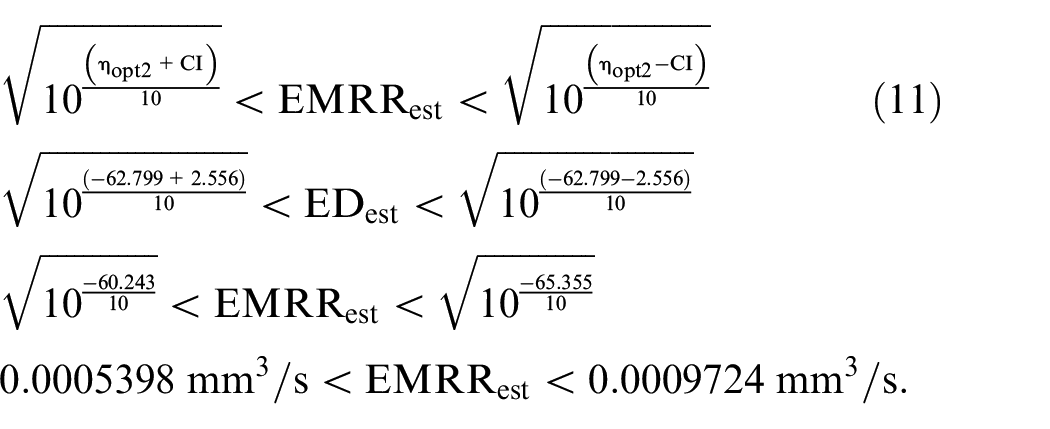
The estimated MRR at optimum level should be lied in between the following range.
Confirmation tests
Since the Taguchi optimization methodology was applied to obtain the optimal condition, a confirmation test is required to validate the results attained at the optimal condition. As the experiment was conducted by applying the full factorial design, the outcome of the experiments at the optimal level was considered for the confirmation run. The average electrode diameter at the optimal level was found to be 3.33 µm which lied within 90% confidence level of predicted optimal range as mentioned in equation (10).
In addition to that the average MRR at the corresponding optimal level was found to be 0.000775 mm3/s which is absolutely lain within the predicted optimal range as mentioned in equation (11). Hence confirmation tests revealed the successful optimization.
Reproducibility of produced micro electrode
In order to evaluate the reproducibility of dimensional and geometrical accuracy of the tool produced by ECE, an experiment had been conducted. Since the tool electrodes are very expensive and more data is required for statistical analysis of reproducibility, a part of experimentation had been performed. According to the reported result the least electrode diameter had been achieved applying 40V AC supply voltage with 3500 RPM of spindle speed. The least diameter obtained was 3.3011 µm. To examine the reproducibility, keeping the above parameters unaltered ECE process had been carried out thirty 30 times repetitively to produce the micro electrode. The diameter of the tip of the produced electrode had been measured using optical microscope maintaining the previous method.
It is to be mentioned that all the measurements of the tip diameter lie in between the estimated range of electrode diameter applying Taguchi methodology in equation (7). After some literature survey it is found that the reproducibility can be measured in terms of standard deviation of the sample set or standard deviation of mean. 41
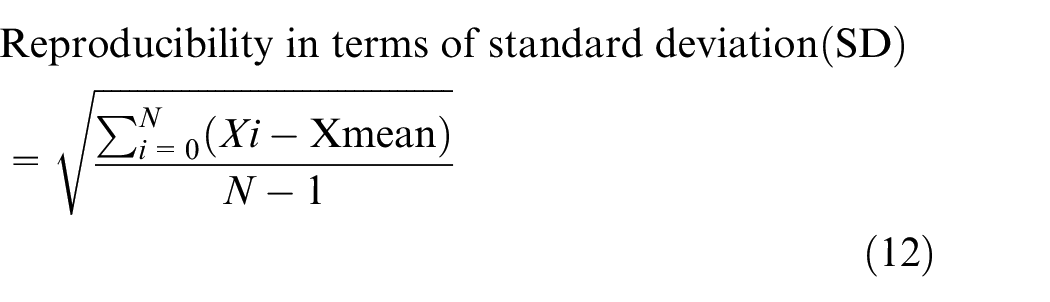
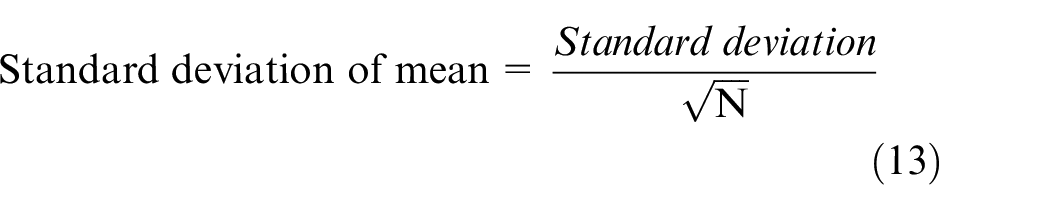
where Xi: value of ith observation; Xmean: mean value of all the observation; N: Number of trial run (30 times).
Substituting all the values of electrode diameter in the above equation (12) and equation (13) the value of SD and SDM are 0.967 and 0.1825 respectively. According to the literatures, SD <=1 signifies the good reproducibility and value of SDM = 0 (zero) is considered to be ideal. The value of SDM closest to 0 is also considerable. 42 Henceforth, both the values are considered as significant. The histogram curve and probability plot of reproducibility of tool electrode at optimum condition is shown in Figure 8. From the histogram graph, it can be depicted that the most of the values are near to the mean value, so the data are normally distributed. Moreover, the p-value obtained from the probability plot with 95% confidence interval is less than 0.05 which indicates that the data are also statistically significant.
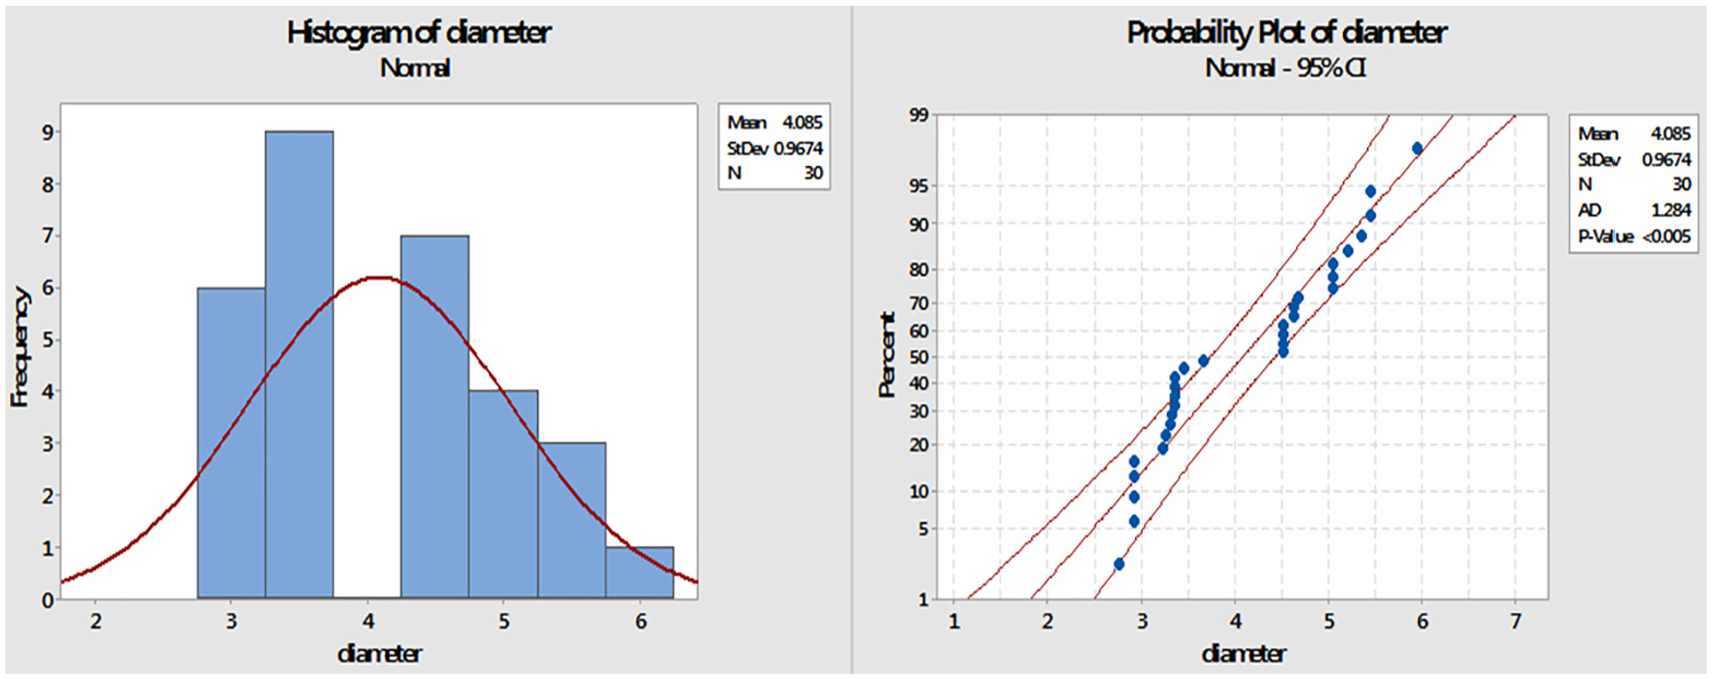
Histogram curve and probability for reproducibility of tool electrode at optimum condition (Mean = 4.085, SD = 0.967).
SEM image analysis
FESEM plays an important role to visualize the shape of the conical tiny electrode and to validate the results obtained from the optical microscope. Due to limited FESEM facility, one random sample from every repetitive run was selected for FESEM analysis and the results are depicted in Figure 9. It can be seen that the electrodes are almost in conical shape due to the rotatory motion of the electrode during the etching process. As the diameter of the electrode ranges between 1.5 µm and 12 µm, every individual image had been captured with different magnification factor for better visualization. There is no such pocket formation but some depositions of other materials are observed. Since the obtained tiny electrode handling and washing is very difficult, there is a possibility to trace some NaCl particle near the tip of the electrode. There are some evidences of tampering the tip of the electrode (see Figure 10) due to some error in handling of the same. The least reported tip diameter from FESEM image is 1.534 µm (Figure 9(g)). For better visualization the least electrode diameter (Figure 9(g)) was captured with highest magnification factor (21.09 kX) and the reference scale was fixed at 2 µm.
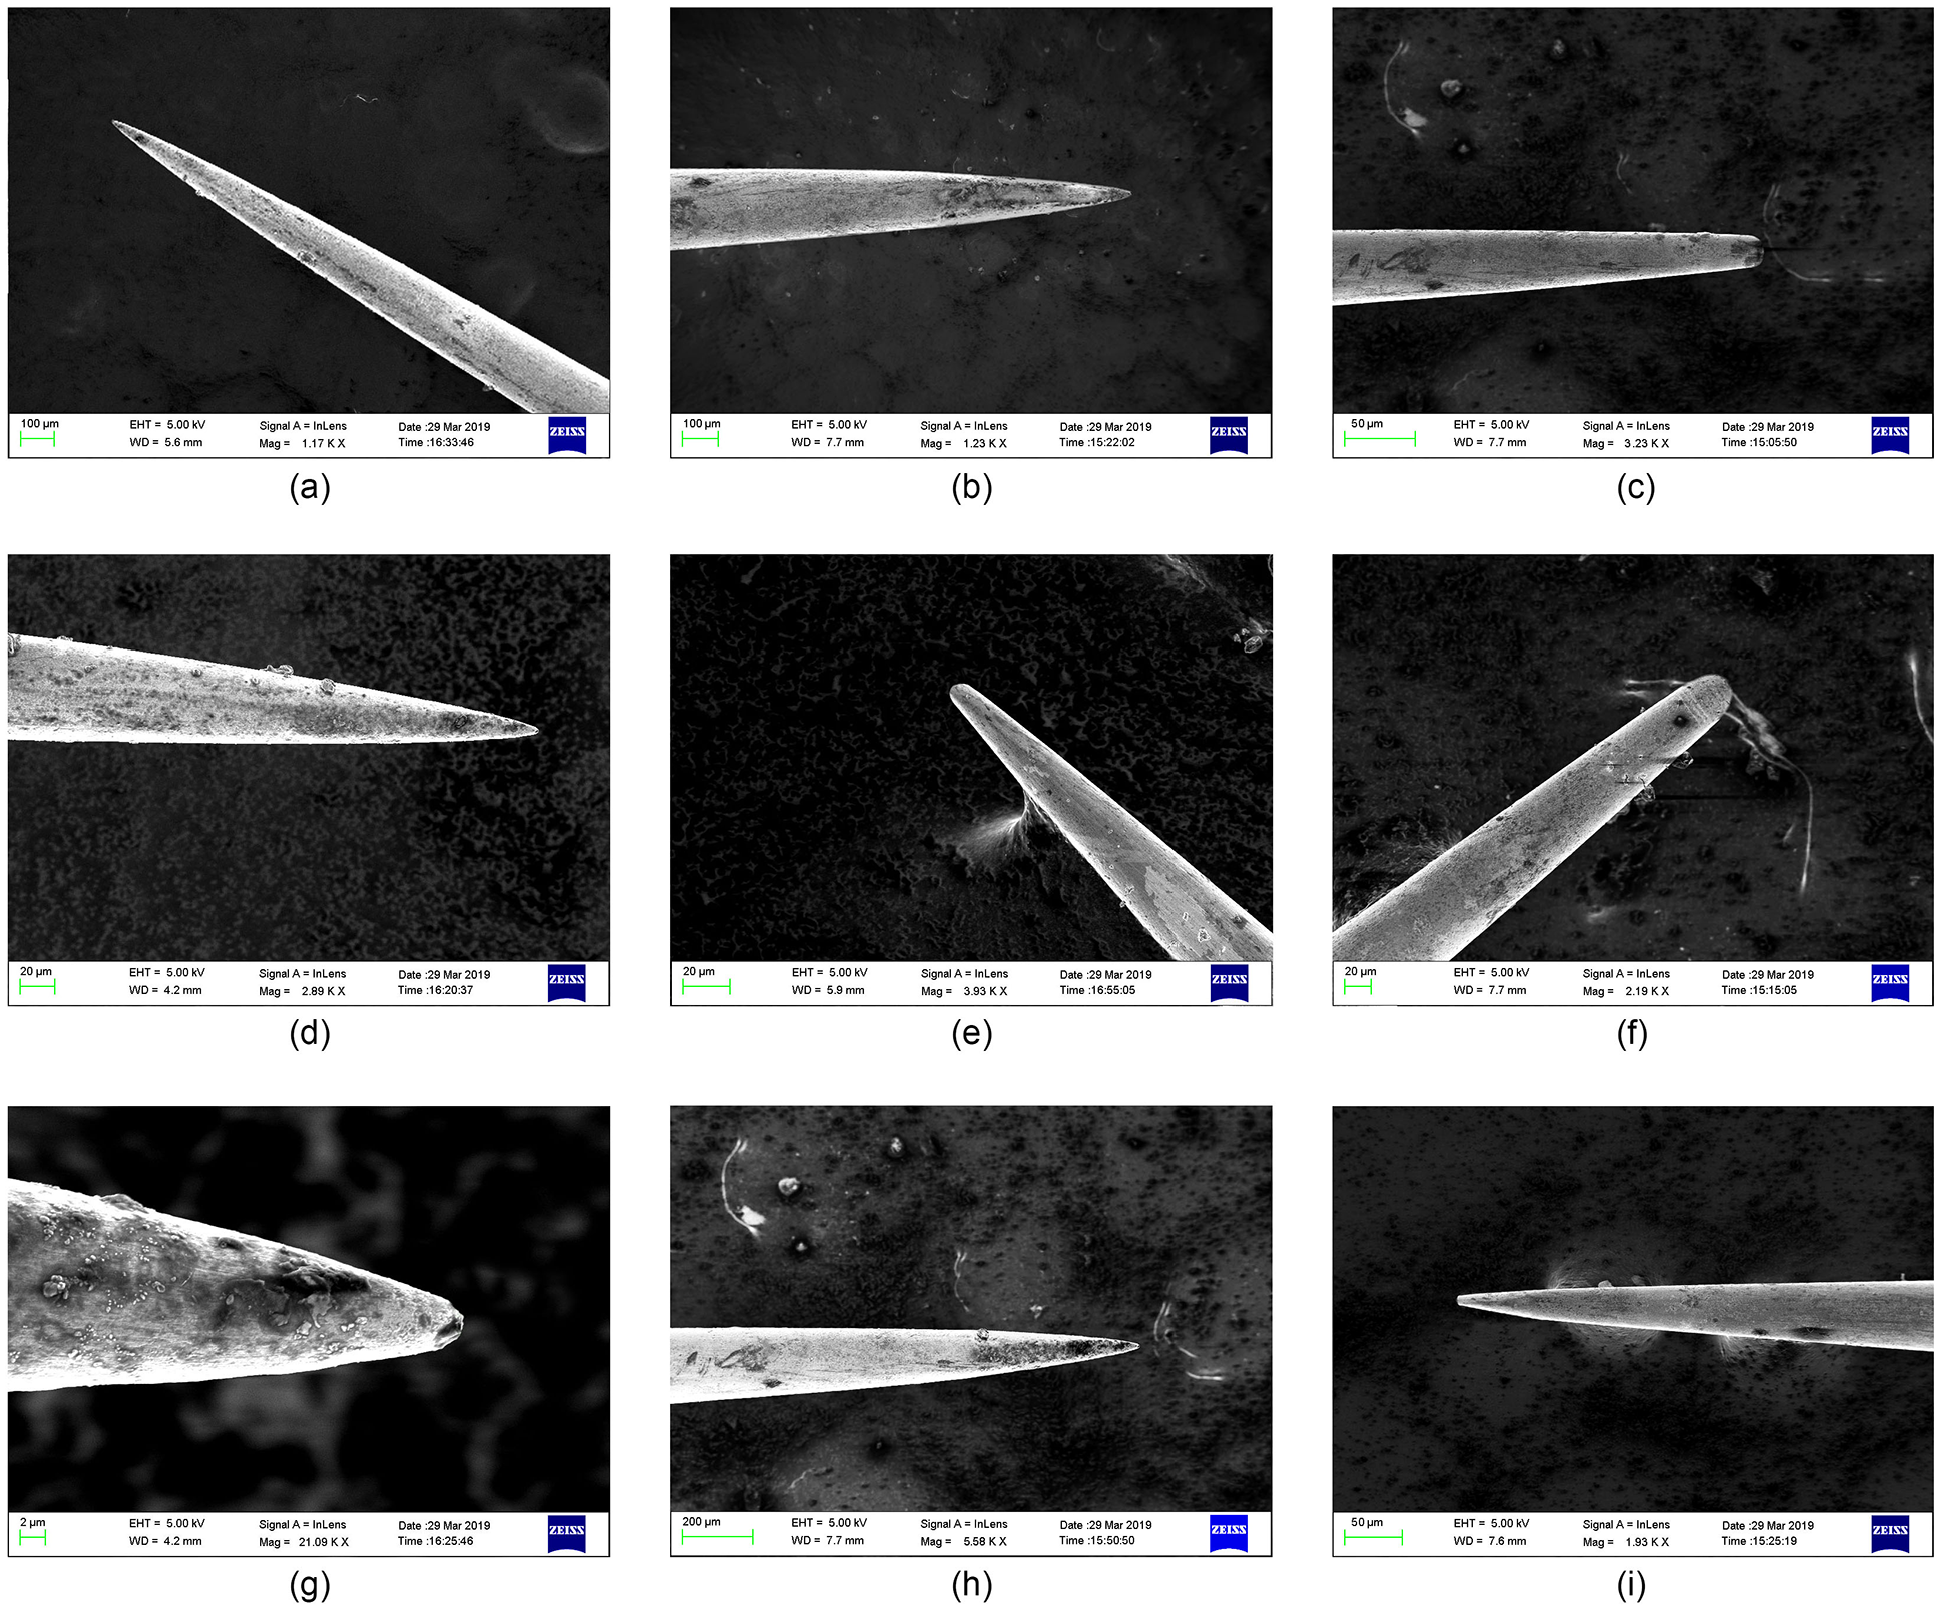
FESEM image of diameter of micro electrodes corresponding to Table 5: (a) 2500rpm/40V, (b) 2500rpm/45V, (c) 2500rpm/50V, (d) 3000rpm/40V, (e) 3000rpm/45V, (f) 3000rpm/50V, (g) 3500rpm/40V, (h) 3500rpm/45V, and (i) 3500rpm/50V.
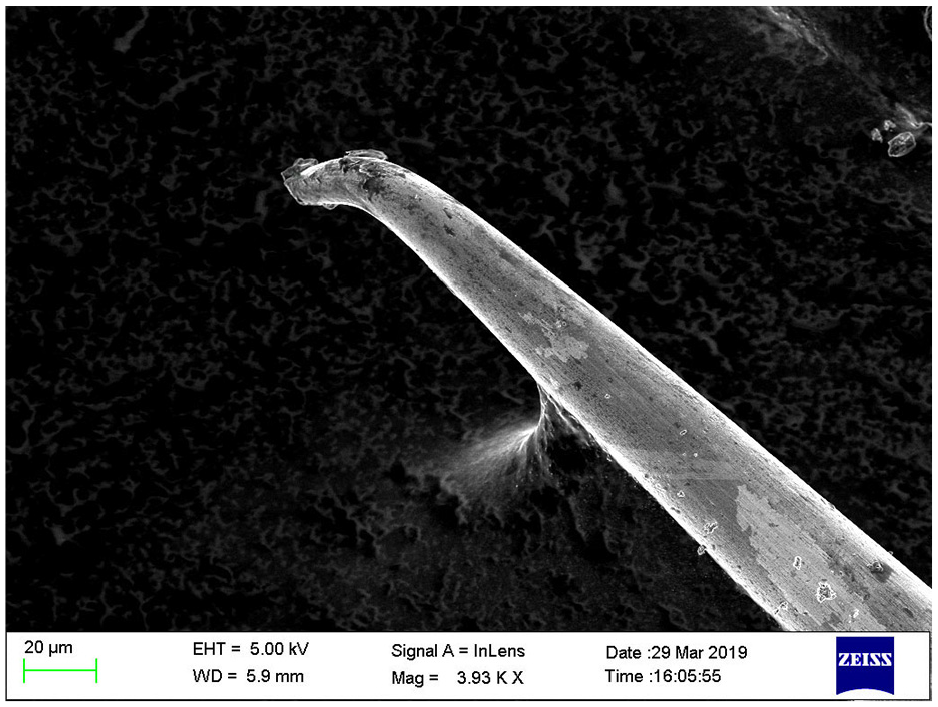
Tampered tip of the tool electrode.
EDX analysis
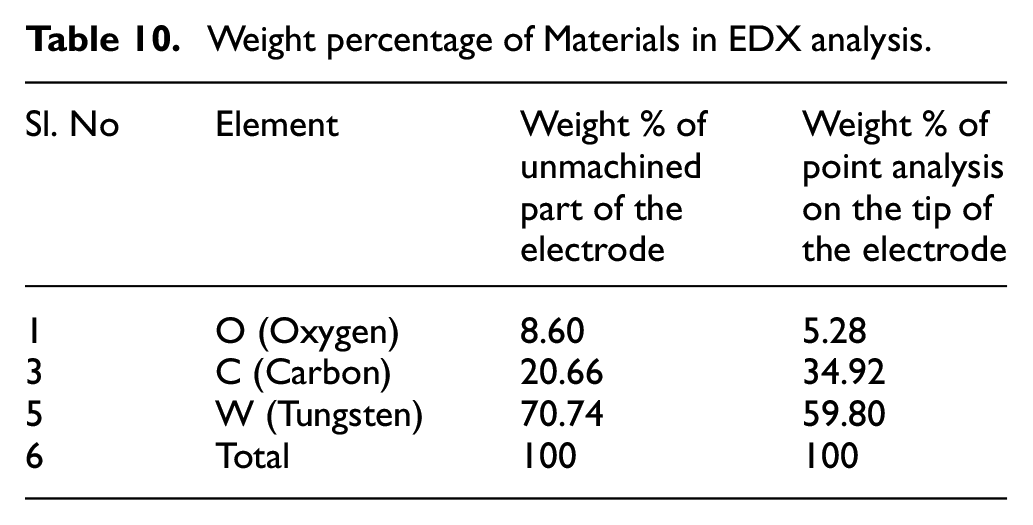
SEM analysis along with the Energy dispersive X-ray spectroscopy (EDX) has been extensively used for characterization of material properties in various fields. 43 Therefore, to analyze the material properties of the obtained electrodes the EDX analysis had been performed on some of the selected samples. The point analysis of the tip as well as the unmachined part of the electrode had been analyzed and shown in Figure 11. The spectrum analysis along with the weight percentage of the materials reveals that there is not a major change in material properties. The weight percentage of all elements for point analysis (i.e. analysis on a selected point region) of the tool tip as well as point analysis of the unmachined electrode is reflected in Table 10. Since AC power supply was used, no oxidation effect was observed near the tool tip. Amount of carbon component was little increased near the tool tip as compare to unmachined part. Consequently the tungsten was reduced substantially at the tip of the electrode.
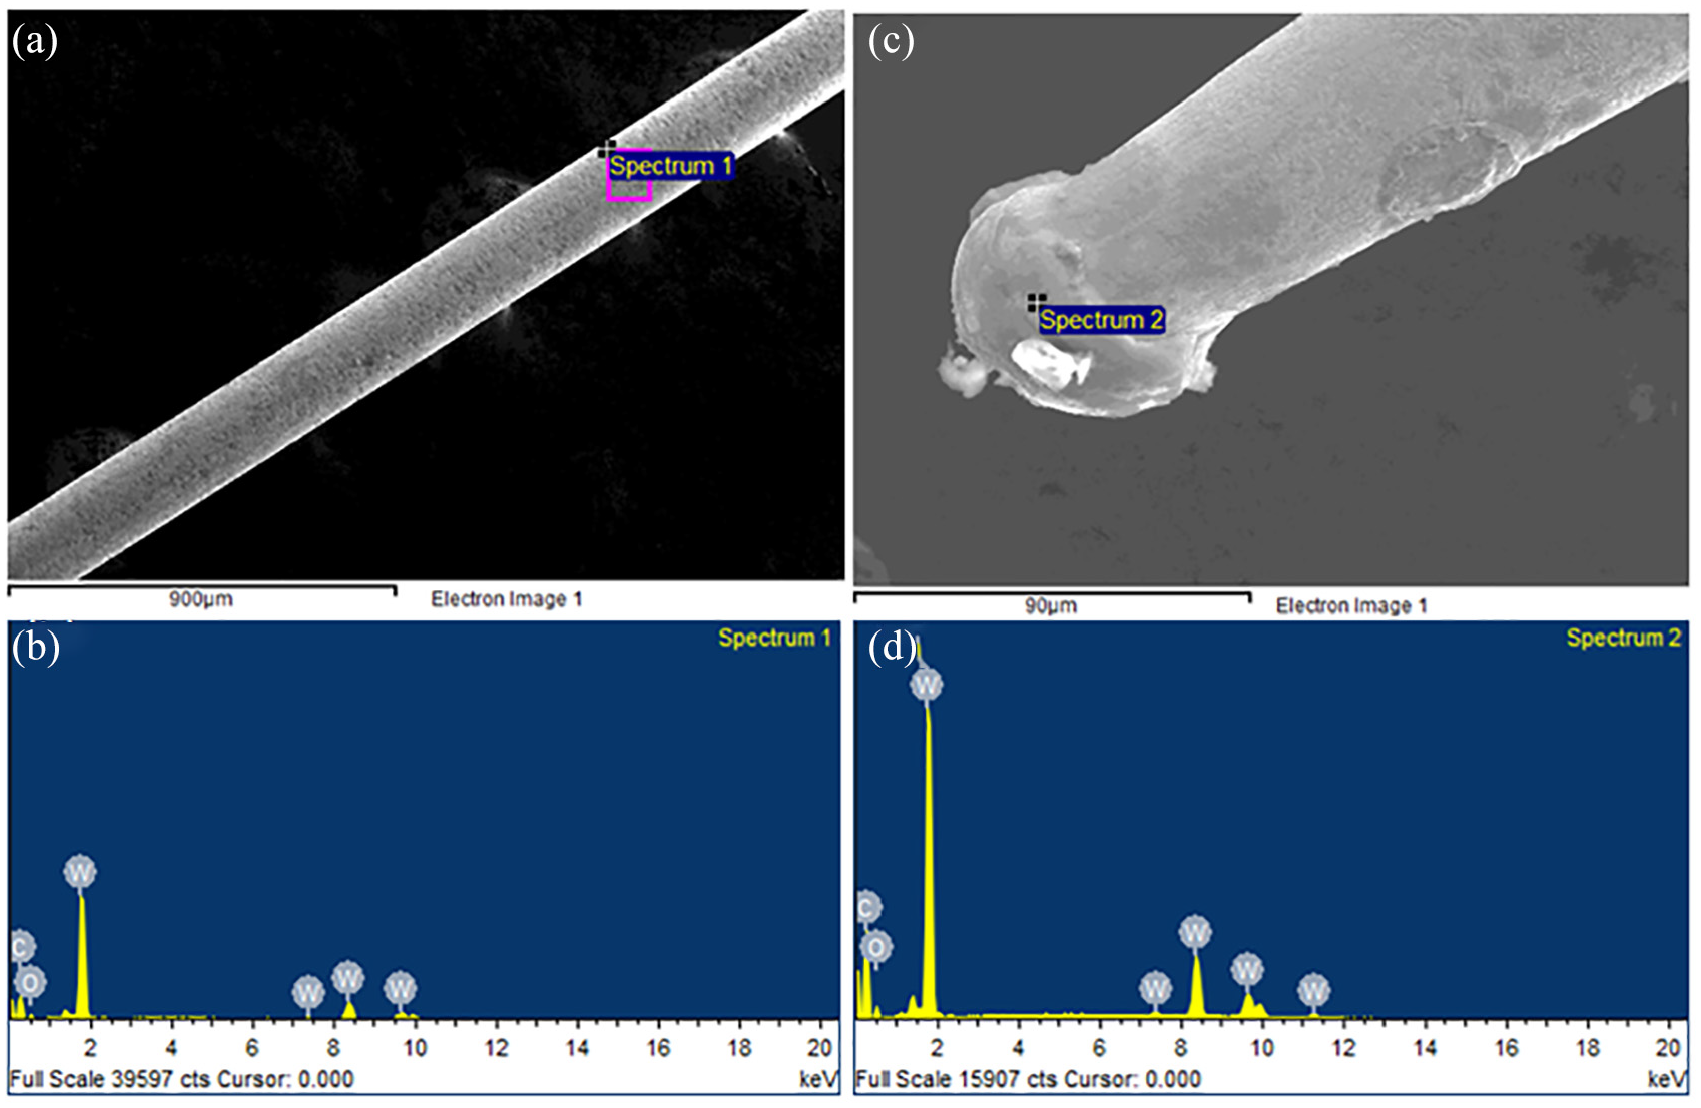
Result of EDX analysis: (a) Point analysis on the unmachined part of the electrode, (b) Corresponding spectrum analysis, (c) Point analysis on the tip of the electrode and (d) Corresponding spectrum analysis.
Weight percentage of Materials in EDX analysis.
Performance of the developed tool in micro-EDM
To evaluate the performance of the developed tool in micro EDM, an experiment of micro EDM had been conducted. It is known that, Micro EDM is mostly applicable for hard to cut materials such as platinum (Pt), iridium (Ir), Inconel, tungsten (W) Titanium (Ti) some super alloys etc. Among them Ti-6-Al-4V (super alloy of titanium and aluminum) had been chosen for this micro EDM operation. It is a very hard to cut material using conventional tool based machining process.
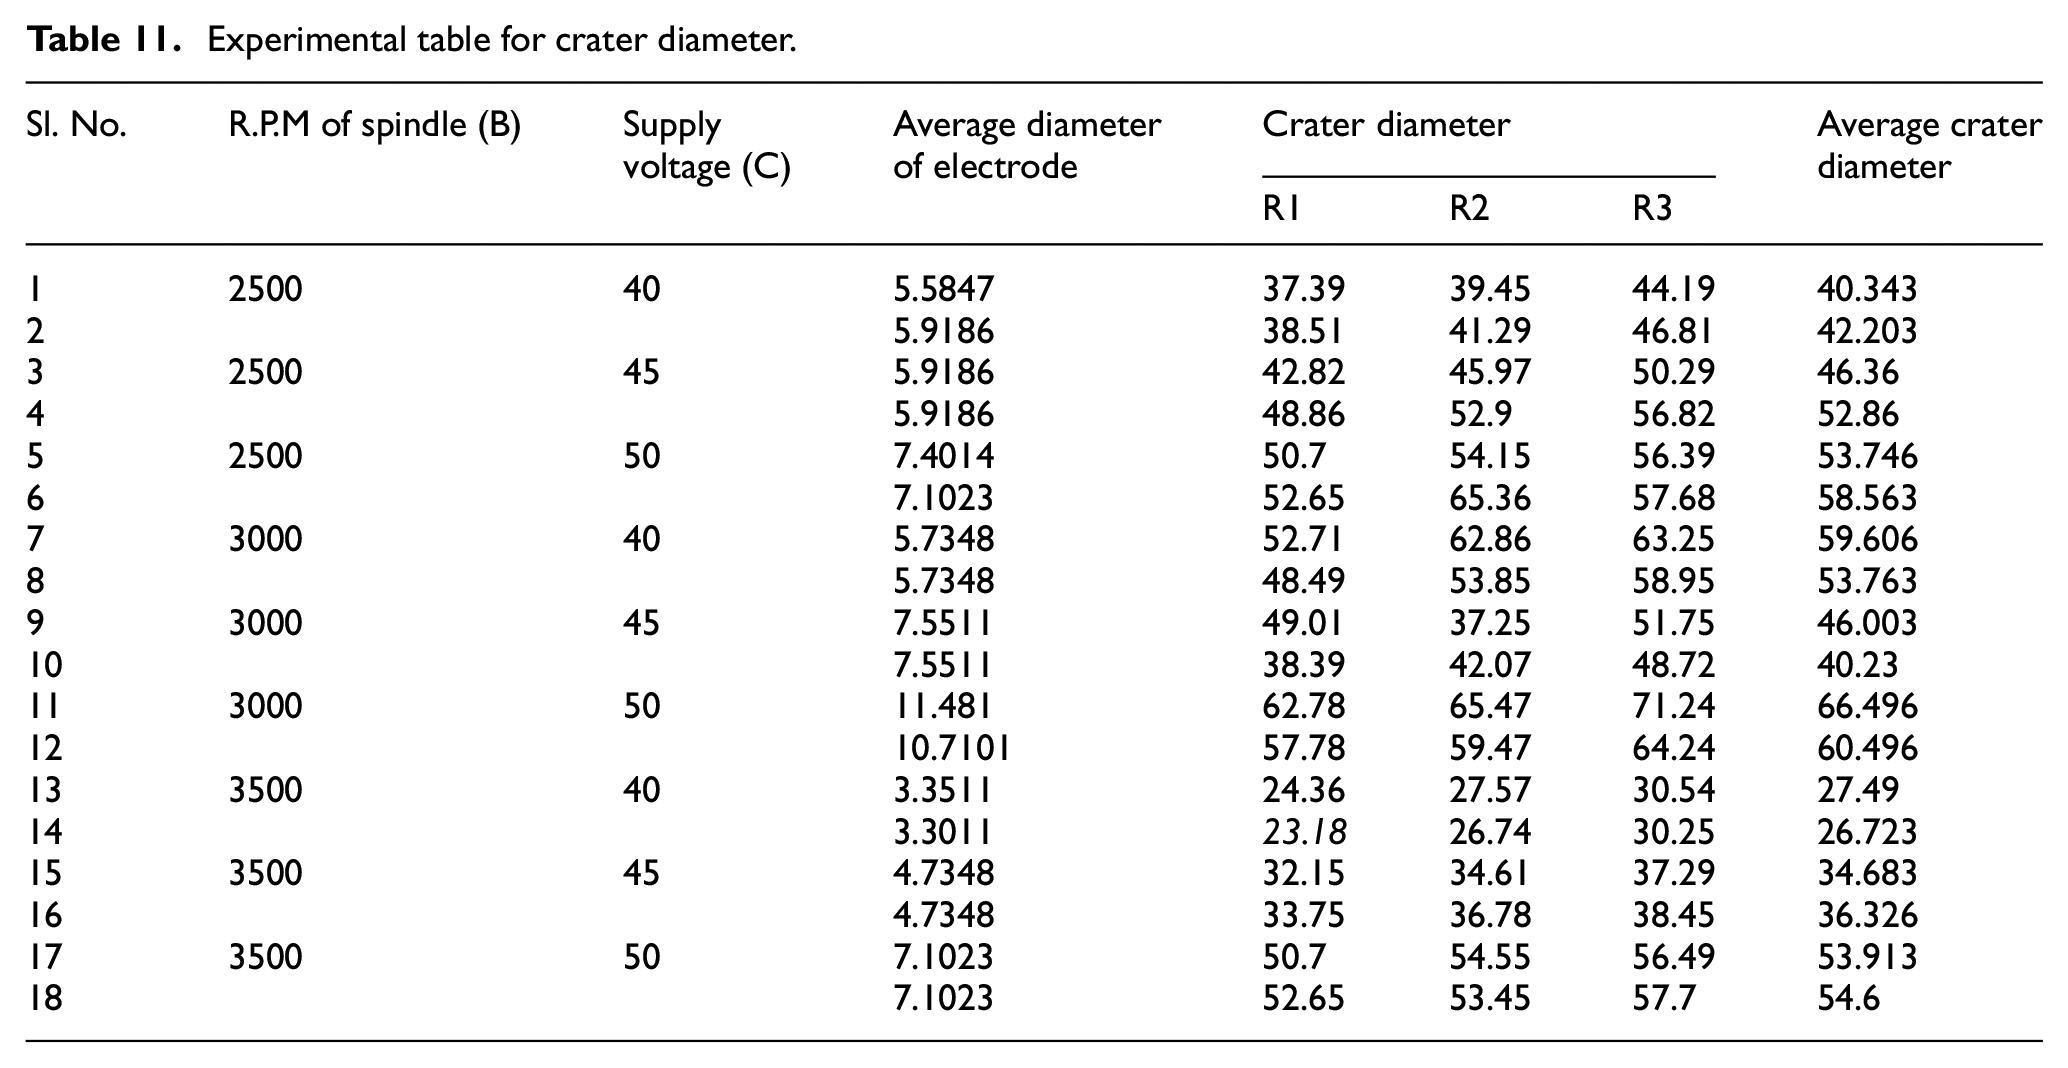
As discussed before total 18 experiments were carried out during the micro electrode fabrication. Consequently 18 micro tools were fabricated and using these 18 tools, micro EDM had been conducted. Using each tool, three consecutive craters had been formed and measured the diameter of the crater using optical microscope as well as FESEM. The measurement represented in Table 11 shows that the diameter of the craters varied according to the diameter of the tip of the electrode and the rows of the least crater diameter are represented in bold font. It is to be mentioned that the smallest crater diameter had been achieved during the application of smallest tool electrode tip. Some FESEM images of micro craters are shown in Figure 12.
Experimental table for crater diameter.
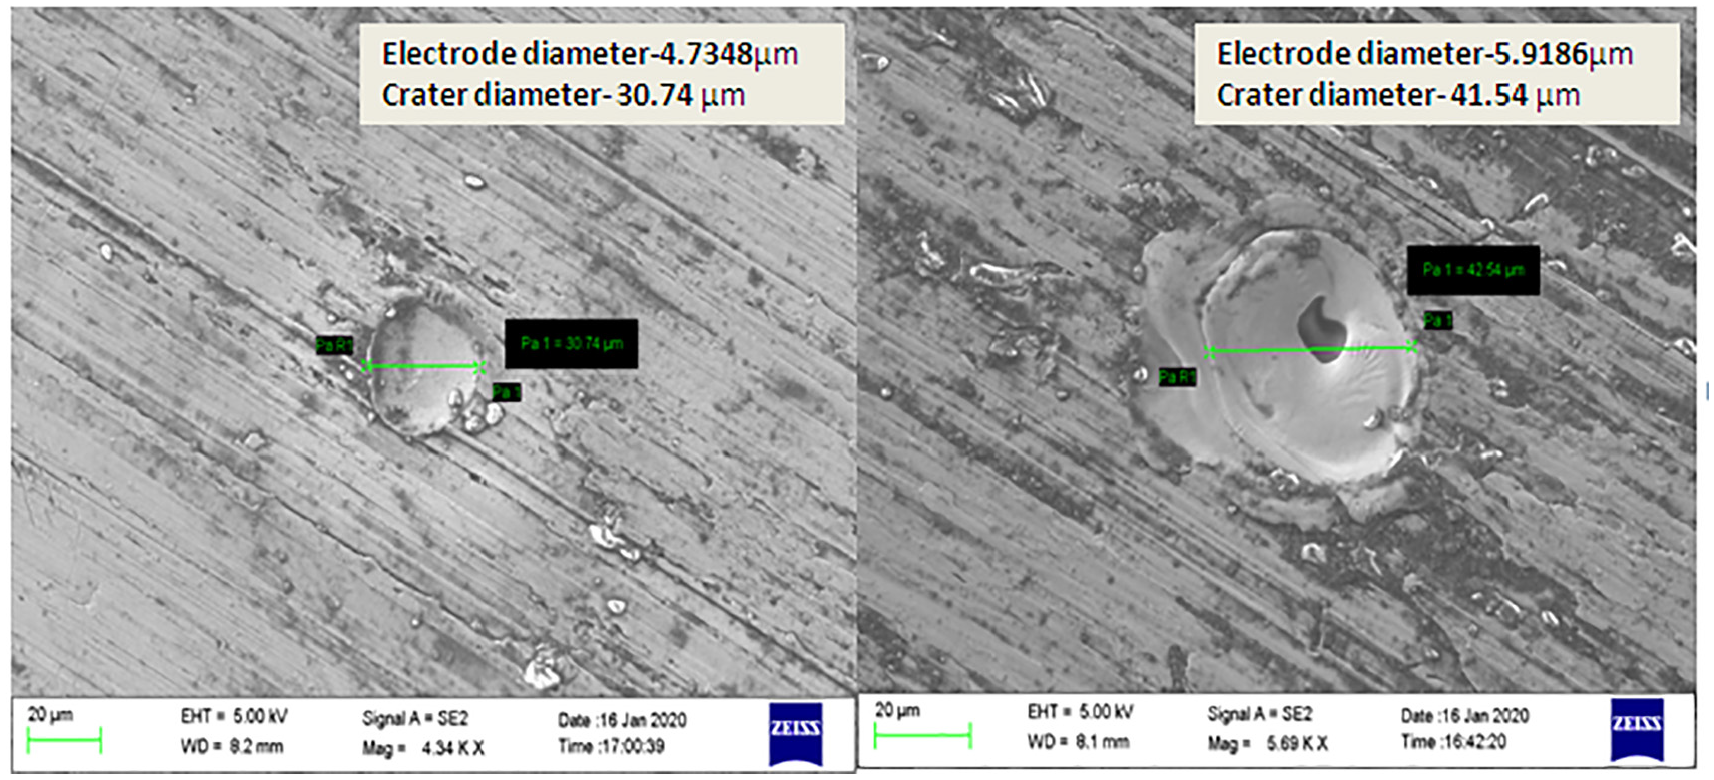
FESEM micrograph of micro craters formed by microelectrode.
Conclusion
The present study primarily focused on fabrication of the microelectrode with least possible diameter as well as larger MRR and optimization of the process parameters using Taguchi methodology. The ANOVA analysis had been applied for determining the influences of the process parameters on the output response. From the SNR graph, a gradual decay of the Electrode diameter has been reflected with the increment of supply voltage and a mixed effect for factor “A” that is, the rpm of spindle on Electrode diameter is revealed. The optimal value of the output response1 (diameter of electrode) is obtained at the combination of level 3 and level 1 of factor A (A3) and B (B1) respectively and for output response2 (MRR) it is obtained at the combination of level 3 for both factors A (A3) and B (B3). Based on the ANOVA outcome for resultant electrode diameter, it can be summarized that the supply voltage played a critical role with 51.42% of the contribution. However, the rpm of spindle shows a significant contribution of 39.67%. On the other hand the rpm of spindle shows the most effective contribution with 45.967% and also the factor “B” has significant contribution with 37.416% on the output response2. The predicted value of electrode diameter at optimum level lies inside the desired confidence interval (at 90% confidence level). The least reported tip diameter from FESEM image is 1.534 µm. From EDX analysis the weight percentage of the materials reveals that there is not a major change in material properties during electrochemical etching process except the oxidation reaction at the tip of the electrode. The outcome of the reproducibility analysis of the fabrication of micro electrode at optimum condition shows a good and statistically significant result. In addition to that micro EDM had been performed using the produced micro electrode to create the crater into Ti-6-Al-4V workpiece. The dimension of the micro feature created by the smallest diameter electrode is 23.18 µm.
Footnotes
Appendix
Acknowledgements
The authors would like to express their gratitude to the Director, CSIR-CMERI, Durgapur and the Director, AcSIR for their continuous support and encouragement to carry out the present research work. Furthermore, the authors wish to thank the Editor and anonymous referees for their valuable comments and recommendations, which have significantly improved the presentation and quality of this paper.
Declaration of conflicting interests
The author(s) declared no potential conflicts of interest with respect to the research, authorship, and/or publication of this article.
Funding
The author(s) received no financial support for the research, authorship, and/or publication of this article.