
Abstract
Nowadays, assembly tolerance analysis has become a challenging problem to predict the accuracy of a final assembly and examine whether specified tolerances satisfy assembly functional requirements (AFRs) for ensuring product assembly performance. Skin model shapes can be addressed to represent part geometric tolerances with manufacturing defects, thereby providing high fidelity surfaces that can replace nominal or ideal surfaces and significantly improve the accuracy and reliability of assembly tolerance analysis. However, their application in easy-to-use assembly simulation is limited by the level of detail required for manufacturing defect simulation and the complicated calculation process for integrating these defects into the tolerance analysis. Therefore, to overcome these issues in predicting assembly deviations in the early design stage, we propose a generic integrated approach of assembly tolerance analysis based on skin model shapes. First, two methods are introduced for modelling and generating skin model shapes according to different mate types of assembly key features. Second, a calculation method of assembly deviation propagation is developed by the integration of skin model shapes and stream-of-variation theory with accuracy and efficiency guarantees. Besides, a slightly modified relative contact positioning method is presented, based on different surface and progressive contact method, to obtain deterministic contact points and contact positioning errors between key mating joint surfaces. And then, the deviation values of AFRs are calculated, considering the inevitable manufacturing and assembly process errors. Finally, a typical mechanical assembly on assembly tolerance analysis is used as a case study to demonstrate the effectiveness of the proposed approach.
Keywords
Introduction
The performance of high precision mechanical products (HPMPs), which are mainly used in aerospace, marine, engineering machinery, and other fields, is derived from the integration guarantee of the design, machining and assembling of parts or components. With the rapid development of high precision CNC machine tools for precision and ultra-precision machining technology, the machining accuracy and consistency of product parts have significantly improved and reached a relatively high level. However, the assembly process of HPMP is playing a more and more important role in ensuring final assembled products performance. Therefore, to guarantee the final assembly performance of HPMP, the focus is shifting from the initial parts design and machining process to the assembly process, and the related research has received attention globally.1–3
In the implementation of the HPMP assembly technology, assembly tolerance analysis has always played an important role in manufacturing to ensure that specified tolerances satisfy assembly functional requirements (AFRs) and predict assembly accuracy for the HPMP when geometric dimensioning and tolerancing (GD&T) schemes have been assigned. Owing to the variations of parts from the manufacturing and assembly errors, assembly variations cannot be avoided completely in the dimensions and geometry of HPMP. Therefore, a suitable approach for assembly tolerance analysis can provide a guidance for manufacturing industries to optimize tolerance parameters in product design, and further enables an effective and accurate prediction of the effects of these part deviations on assembly key features (AKFs) for the AFRs of HPMP.4,5
To date, the two aspects of assembly tolerance analysis in the HPMP have always received considerable attention, i.e., tolerance model representation for parts and tolerance deviation propagation for assembly. Tolerance model representation is one of the important prerequisite of assembly tolerance analysis, which provides a sound representation of mathematical or physical models for manufactured workpieces using a specified GD&T scheme. In the past several decades, many approaches to tolerance model representation for tolerance analysis have been proposed, including topologically and technologically related surface (TTRS) model, 6 proportioned assembly clearance volume (PACV), 7 matrix model, 8 vector loop, 9 Jacobian model, 10 Torsor model, 11 Jacobian-torsor model, 12 GapSpace, 13 Tolerance-Map® (T-Map) model, 14 deviation space-based model, 15 Polytopes, 16 fractal dimension model, 17 envelope tolerance model, 18 and skin model/skin model shape model,19,20 which have been investigated widely as well-known tolerance models. Based on the afore mentioned tolerance models, some commercial Computer-Aided Tolerancing (CAT) tools have integrated these models successfully into CAD packages for tolerance analysis,21–24 such as CATIA.3D FDT and FT&A, Tecnomatix® Variation Analysis (VSA), CETOL 6 sigmaTM, 3DCS, MECAmaster, Mechanical Advantage, Analytix, and PolitoCAT/Poliitopix. However, a large amount of research on tolerance model representation only describe the position and orientation errors, but not the effects of form errors from the machined parts, which hardly conform to international standards for new-generation geometrical product specifications (GPS) and difficult to satisfy with the requirements of assembly tolerance analysis for HPMP. Among these tolerance models, the skin model shapes are well suited for a global representation of parts’ surfaces that achieve more realistic virtual model with high fidelity to mirror the physical mock-ups for HPMP.
The skin model shape paradigm, introduced into geometric variations modelling by Schleich et al., 25 provides an innovative method to represent parts’ surfaces in discrete geometry and allows a holistic geometric deviations management associated with product design, manufacturing, and inspection. These finite models express the specific geometric deviations from manufacturing-caused geometric imperfections by representation schemes, such as point clouds and surface meshes. With increased study on the skin model shapes in recent years, modelling geometric errors in the tolerance analysis and assembly simulation for HPMP is on demand, which has received attention from many researchers. For example, Zhang et al. 26 presented Markov Chain Monte Carlo (MCMC) and statistical shape analysis methods for the skin model representation and simulation. Yan and Ballu 27 proposed an integrated tolerance analysis using skin model shapes and linear complementarity conditions, considering form defects and assembly load conditions on the assembly simulation. Schleich and Wartzack 28 proposed two approaches for assembly simulation that considers geometric deviations with point-based skin model shapes by including constrained registration and difference surface method for the relative positioning. Liu et al. 29 introduced a novel tolerance analysis framework based on skin model shapes and a boundary element method, integrating the effects of form errors during the manufacturing phase and local surface deformations during the assembly phase. Liu et al. 30 presented an effective assembly tolerance analysis by a combined skin model shapes-Jacobian model.
Although these aforementioned methods generate skin model shapes for all surfaces through appropriate effective approaches, previous studies on skin model shapes in assembly tolerance analysis and simulation have not been fully developed. These current assembly simulation methods based on skin model shapes mainly provide relative positioning approach to determine the relationship between mate or contact parts, and use nonlinear optimization solutions (such as iHLRF 31 and sequential quadratic programming 32 ) to obtain optimization results for AFRs, which have quite complicated and inefficient analysis procedures for the HPMP when considering many parts and joints with high accuracy. Therefore, it is still difficult to predict and control the accuracy of final assembly of HPMP in the early design stage due to the lack of generic method in assembly deviation propagation based on skin model shapes.
In order to mitigate the aforementioned problems, a generic method of assembly tolerance analysis in this study has been proposed by integrating stream-of-variation (SoV) methodology and state space approach into skin model shapes in assembly simulation for HPMP. In addition, for simplicity of the whole assembly tolerance analysis process, three steady methods are discussed for the generation of skin model shapes based on mate or contact type of AKFs and the determination of relative positioning errors between mate or contact parts for assembly stability. The proposed integrated approach provides a generic solution for the quantitative expression of assembly accuracy prediction of HPMP, and inherits the advantages of each methods, which can realize available incorporation of different geometric deviations for manufacturing defects (mainly position, orientation, and form errors) and easily represent assembly deviation propagation following assembly process.
The rest of this paper is organized as follows. The methodology overview of this paper is illustrated in Section 2. Modelling and generation of skin model shapes with manufacturing defects are depicted in Section 3. The calculation of assembly deviation propagation is presented in Section 4, where the formation mechanism of mating surface errors and the progressive contact method integrating the skin model shapes model are addressed. Taking a typical mechanical assembly as an example, Section 5 elaborates the case study using three different methods and gives the results and discussion. Finally, the conclusion is presented in Section 6.
Methodology overview
Based on international standards for GPS, geometrical error sources of manufactured workpieces in mechanical products can be roughly classified into position, orientation, form, waviness, and roughness. The parameter of surface roughness is negligible in most tolerance analysis. As shown in Figure 1(a), the traditional product design specification uses a nominal CAD model, and tolerance elements are generally associated with the CAD model by means of non-geometric information annotation. Furthermore, considering the design requirements of part tolerance zone with position and orientation errors, part model is abstracted as variation parametric model and it remains an ideal surface-based model shown in Figure 1(b). The assembly variation analysis is further calculated based on the worst-case and statistical tolerance analysis method. Nevertheless, form defects are difficult to represent in both two models. Therefore, due to the inevitable manufacturing defects, the geometric surface model of part can be represented with a non-ideal model based on skin model shape simulation shown in Figure 1(c). Concerning the expression of manufacturing defects on part tolerance modelling and assembly deviation propagation, it will be more conductive to improve assembly quality and accuracy of HPMPs for assembly tolerance analysis.
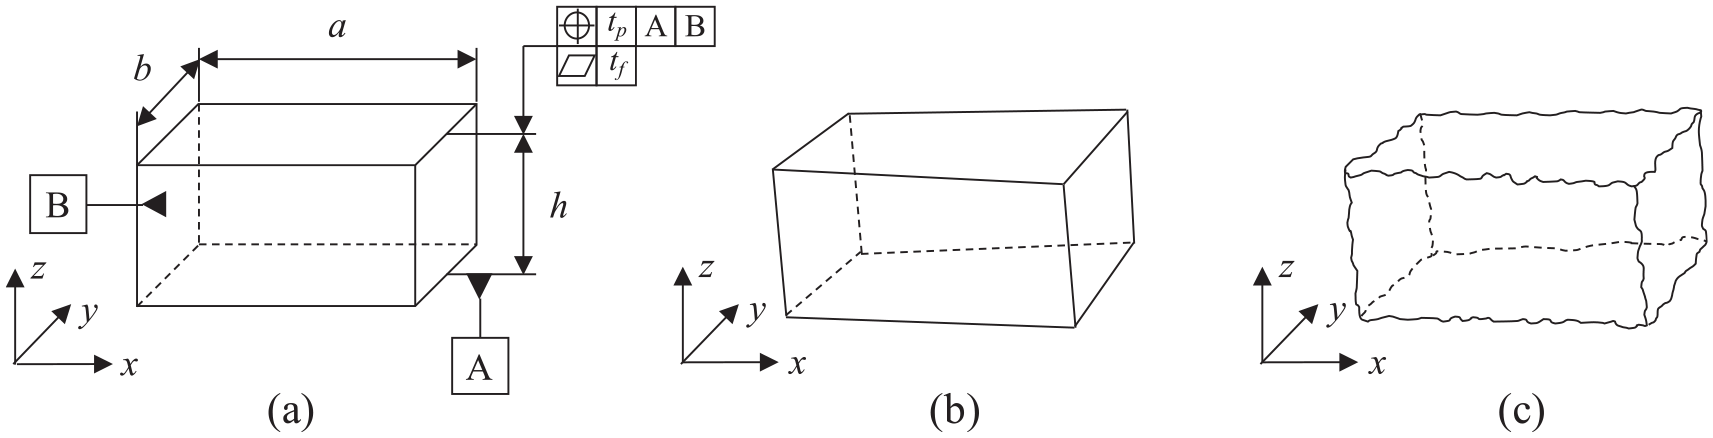
Schematic of part model under different representation: (a) nominal ideal model, (b) variation parametric model, and (c) non-ideal model.
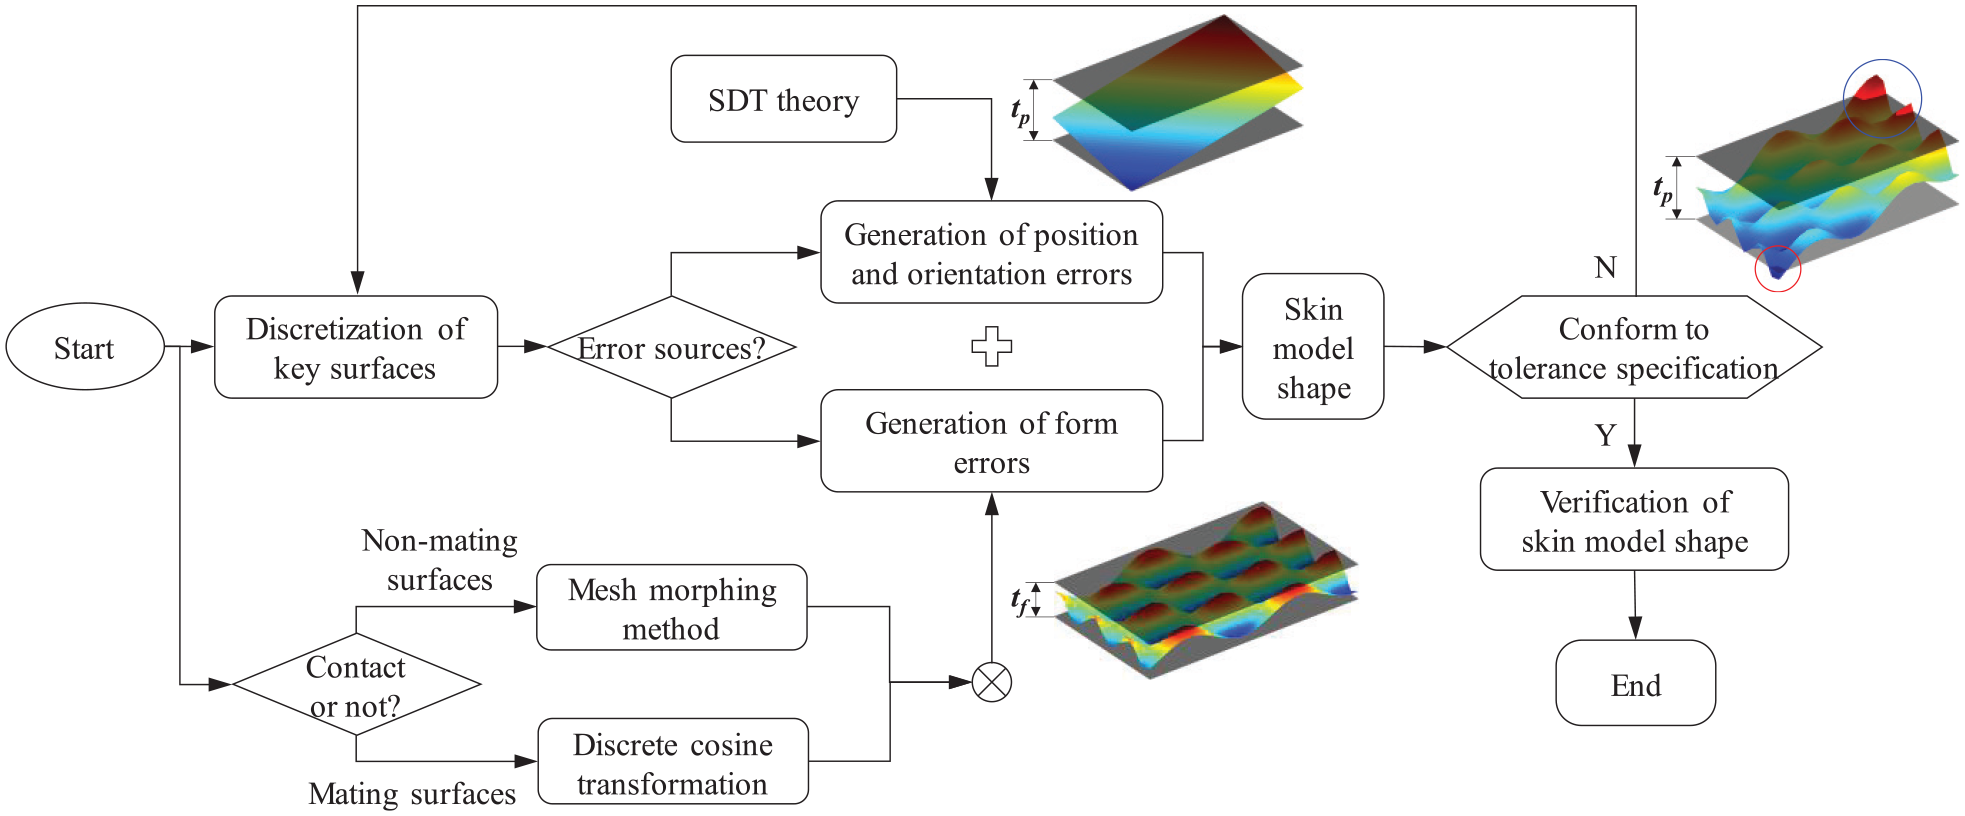
The procedure of the proposed integrated assembly tolerance analysis method is divided into four steps, namely pre-processing (Step 1), generation of skin model shapes (Step 2), calculation of relative positioning (Step 3), and assembly deviation propagation, accumulation and simulation (Step 4). As shown in Figure 2, the procedure involves a series of factors with the integrated consideration of the non-ideal surface generation of AKFs, the contact mating errors of relative positioning and assembly deviation propagation based on SoV for assembly process.
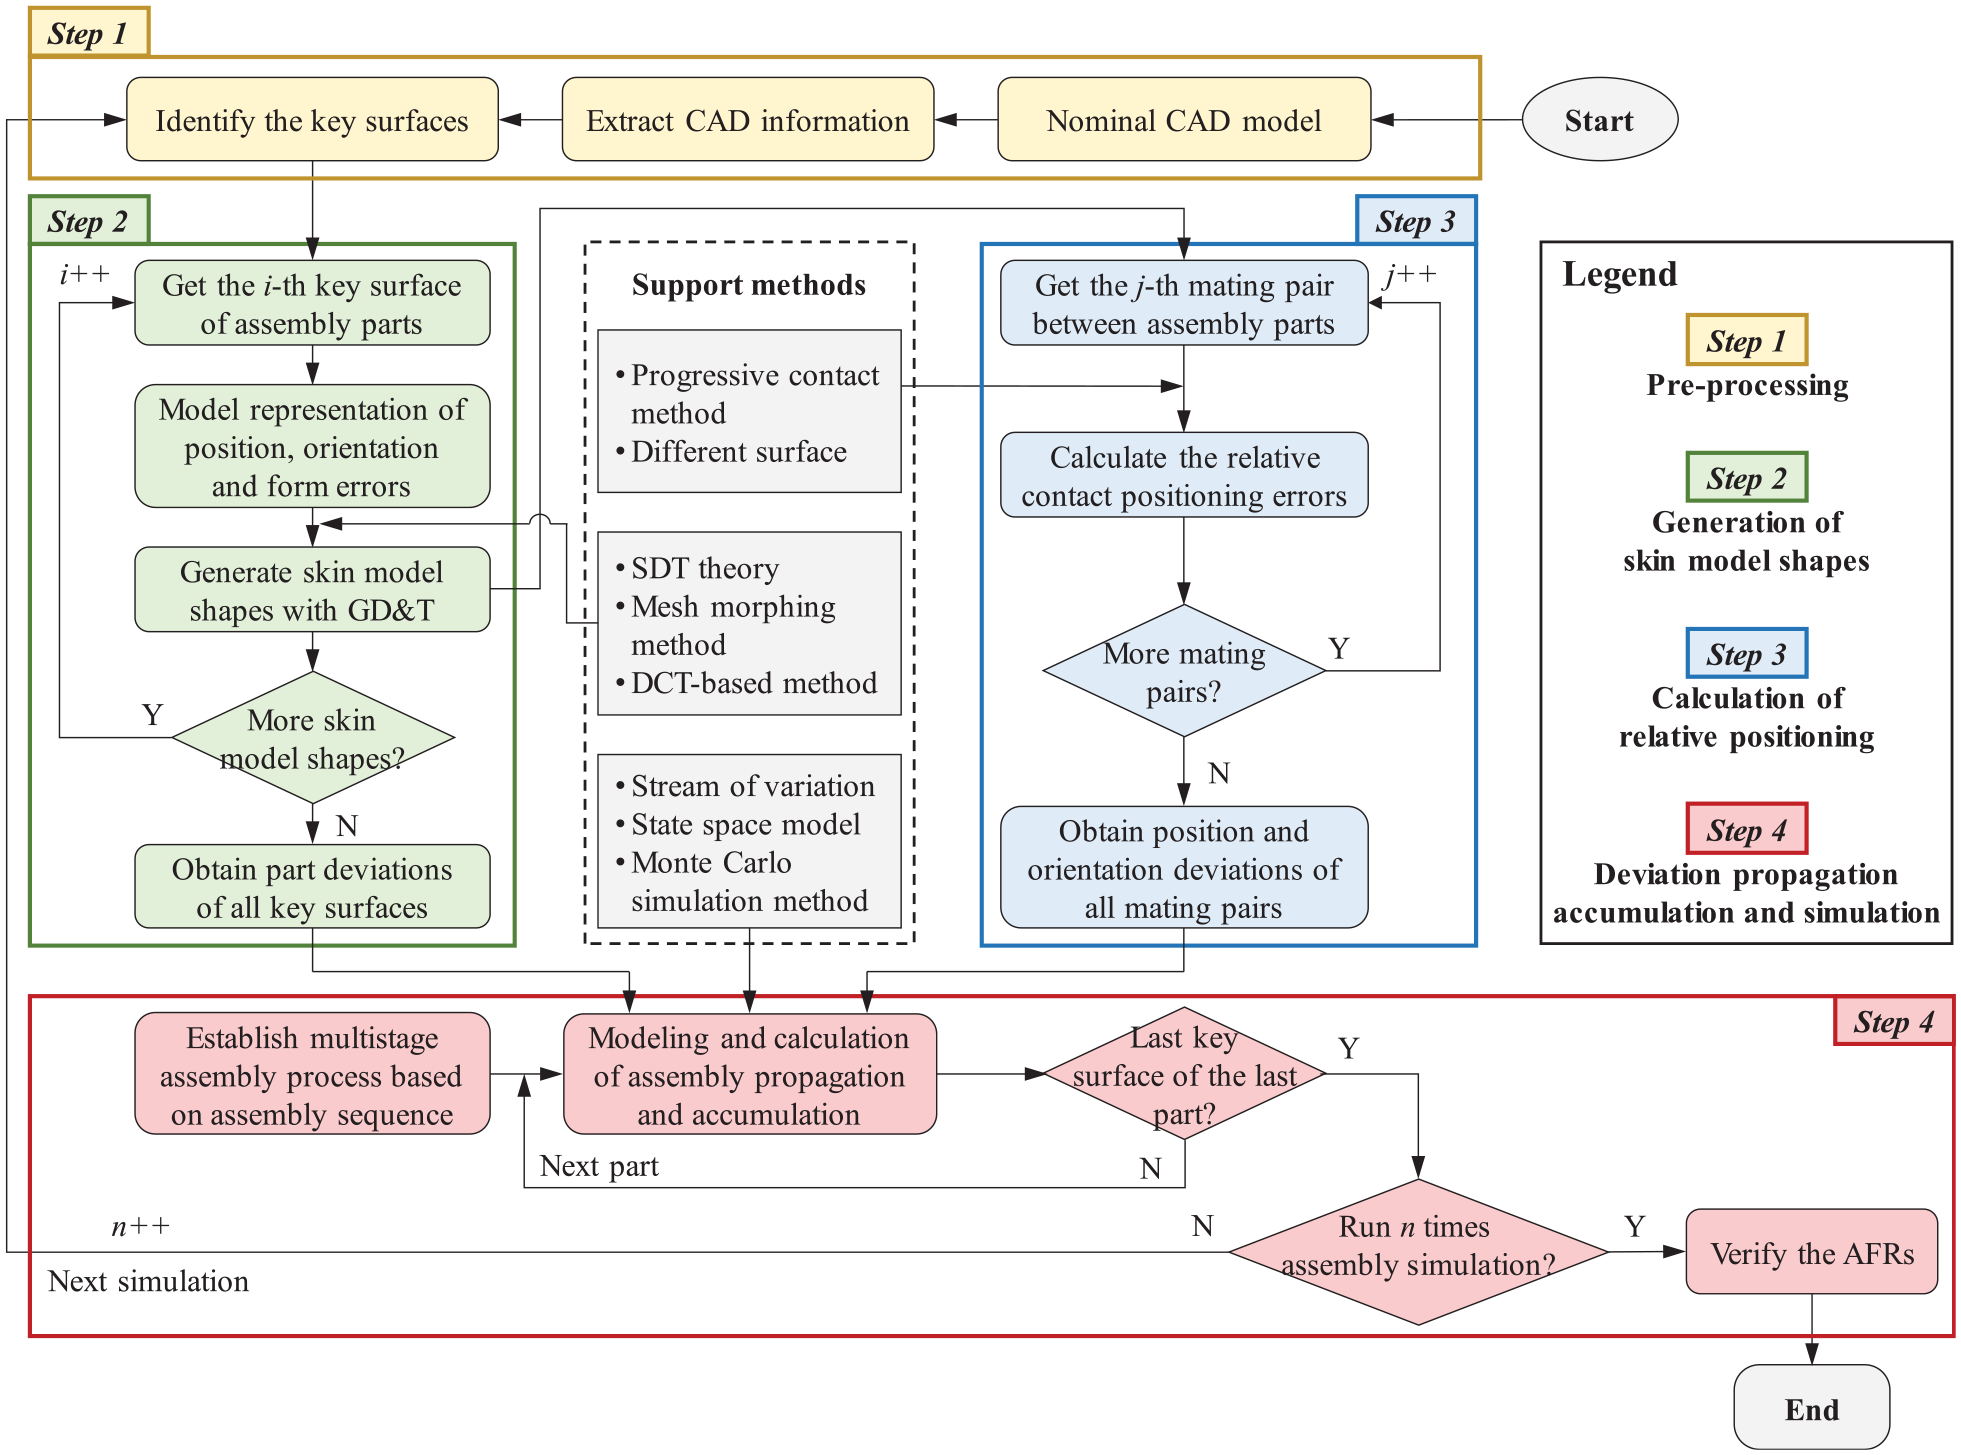
Basic procedure of the proposed integrated assembly tolerance analysis approach.
Step 1. The key surfaces of AKFs in a given assembly should be identified firstly. The general method is to obtain these key surfaces including mating surface and non-mating surface by extracting CAD information. Meanwhile, the specified GD&T scheme is also obtained from a three-dimensional (3D) assembly model.
Step 2. For the key surfaces obtained in sequence, their skin model shapes are generated sequentially with the summation of position, orientation and form errors. The model representation can be deduced through the integration of small displacement torsor (SDT) theory, mesh morphing method, and discrete cosine transformation (DCT) method. Each key surface is treated individually until all their deviations are obtained in all parts of assembly.
Step 3. After generating skin model shapes, the relative positioning errors between the mating pairs are easily obtained based on the progressive contact method of different surface taking form errors into account. Here, the contact points of mating pairs should be calculated, and accordingly, the relative contact positioning errors between the mating pairs can be derived.
Step 4. Through establishing a multistage assembly process (MAP) based on assembly sequence, a mathematical model of assembly deviation propagation and accumulation is constructed using the SoV and state space model to complete the assembly tolerance analysis and simulation. After repeating the abovementioned procedure hundreds of times using the Monte Carlo simulation method, the evaluation of AFRs in the HPMP can finally be realized.
Modelling and generation of skin model shapes with manufacturing defects
The skin model shape is a practical way to realize high-fidelity tolerance model representation of actual parts with manufacturing defects considering the position, orientation, and form errors. In the basic procedure shown in Figure 2, the modelling and generation of skin model shapes are essential steps. In this section, the skin model shapes can be classified into three different kinds of deviations: position, orientation, and form errors. Hence, the model representation of the generated skin model shapes can be expressed through the summation of three errors categories.
Model representation of position and orientation errors
Figure 1(a) shows a part model with geometric tolerance, including position tp and flatness tf of the top surface. According to the tolerance standard, the value of position tp must be greater than or equal to the flatness tf, i.e., tp≥tf. Hence, the top surface can be restricted by deviating only within corresponding tolerance zone. According to the SDT theory, the deviation of the top surface can be represented by three parameters [ΔZ, Δα, Δβ], where ΔZ represents small translation along z-axis direction; Δα and Δβ represent small rotations along the x- and y-axis direction, respectively. For the variation range of extreme positions on the plane surface, it is necessary to comply with tolerance specification of product design, and the expressions of variation range of the three parameters and tolerance zone can be obtained as follows:
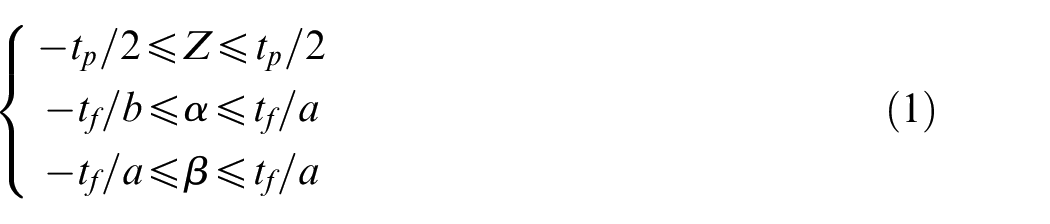
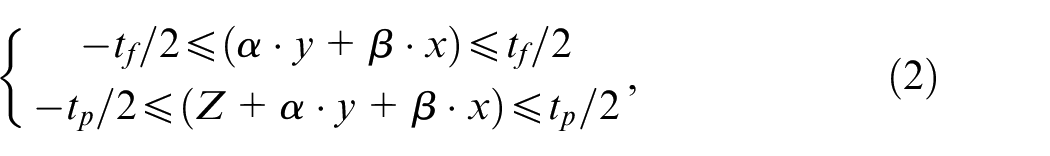
where a and b represent the length and width along x- and y-axis direction of the top surface, respectively.
Owing to the position and orientation errors of the surface, the surface of the nominal model have a deviation from its ideal position, which can be represented by a variation parametric model with a specific translation and rotation relative to the ideal model surface. The equation of the variation surface can be obtained based on the specific values of ΔZ, Δα and Δβ. Taking the variation of z-coordinates value as an example, the variation parametric model of the top surface can be expressed by function operator f on the sampling points (Xi, Yj) as follows:

where Tp represents the deviations of sampling points in z-axis direction; f indicates the basic function of variation parametric model restricted by equation (2); Xi and Yi represent the x- and y-coordinate of the sampling points respectively.
Model representation of form errors
In order to distinguish and compare the model representation methods of form errors, this section introduces two methods, i.e., mesh morphing method and DCT-based method. Due to different advantages of modelling methods, based on the mate type of AKFs, we recommend that the model representation of form errors for non-mating surfaces be implemented with mesh morphing method, 33 while another for mating surfaces be simulated using the DCT-based method. 34 It should be noticed that the two methods are not the only alternatives; other viable methods have also been published by references.26,35
Mesh morphing method for non-mating surfaces
Most non-mating surfaces in AKFs are generally regarded as the surfaces of AFRs that do not contact other surfaces, which are also related to the assembly quality of functional requirements of the HPMP. For the manufacturing deviations for non-mating surfaces, the mesh morphing method has some advantages at less computational cost and efficiency; thus easily simulate actual manufacturing deviations, which is more suitable for key surfaces without mating. In general, the overall design procedure of mesh morphing method oriented on form errors includes four steps: discretization of nominal CAD model, construction of mesh model (i.e., tessellation model), modelling of deviation simulation, and deviation visualization of part surface shapes.
First, a point-set model is obtained through discretization by a nominal CAD model to represent the external surface. Second, according to the neighbor relationship of discrete point-set, the mesh model is generated using the Delaunay triangulation algorithm. Third, with the comprehensive considerations of tolerance specifications, the modelling of deviation simulation is fully developed, considering the simulation of both systematic and random deviation. Moreover, systematic deviation is generally achieved by the simulation of second-order shape morphing, and random deviation is directly obtained through random shape morphing using the shape function. At last, by integrating the superposition of the two deviations into mesh model, the surface shapes conforming to tolerance specification are generated through visualization techniques at different scales. A more detailed implementation process has been explained in the previous reference. 36
To simulate the geometric form errors of part’s plane or cylinder surface, some typical kinds of second-order shapes have been adopted by Zhang et al. 26 to express the errors. Using a second-order function, the typical form errors could be calculated and simulated with paraboloid, saddle paraboloid, sphere, cone, ellipsoid, and cylinder modes for planar surfaces and banana, ripple, taper, elliptic, barrel, and concave modes for cylindrical surfaces, as the deviation visualization shown in Figure 3.
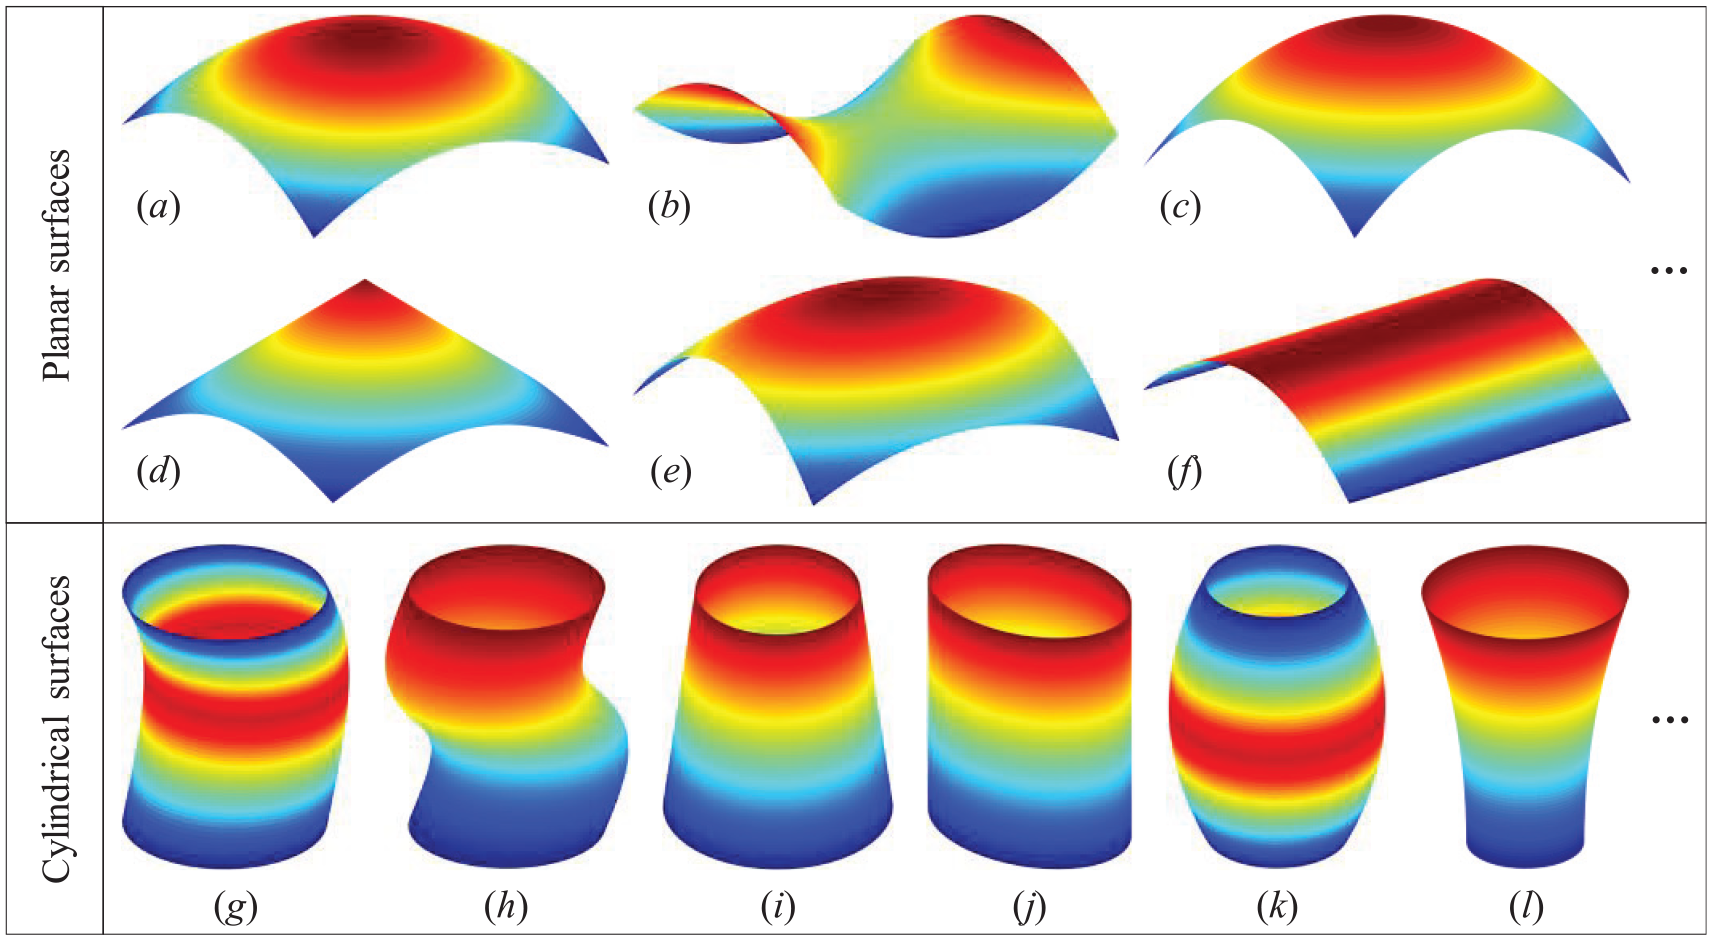
Typical form errors simulation by second-order shape morphing on plane surface and cylindrical surfaces: (a) paraboloid, (b) saddle paraboloid, (c) sphere, (d) cone, (e) ellipsoid, (f) cylinder, (g) banana, (h) ripple, (i) taper, (j) elliptic, (k) barrel, and (l) concave modes.
Therefore, after obtaining the deviation through different second-order shape morphing and random shape morphing simulation, a planar surface with a specific form error can be generated as follows:
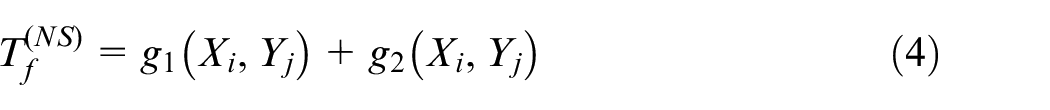
where
Discrete cosine transformation method for mating surfaces
The mating surfaces in AKFs are very important to affect assembly deviations in the assembly process, especially for HPMP. To simulate mating surfaces with manufacturing defects via a high-fidelity method, the DCT-based method is introduced to provide a compact and concise expression for representing various errors, including surface form, undulation, and roughness by summing different modes. Hence, this method is more reasonable for model representation of mating surfaces and also more conducive to further calculation in the assembly deviation propagation among mating surfaces.
As one of modal-based decomposition method, DCT is widely used in image compression and reconstruction for signal processing. By using the modal analysis of the DCT-based method, the specific representation of form errors can be expressed by the linear combination of a series of orthogonal basis functions. In a two-dimensional (2D) plane surface, form error is represented by deviation along the third direction (z-direction) using the DCT-based method. The deviation can be used to generate with the kernel function k(m, n, u, v) as follows:
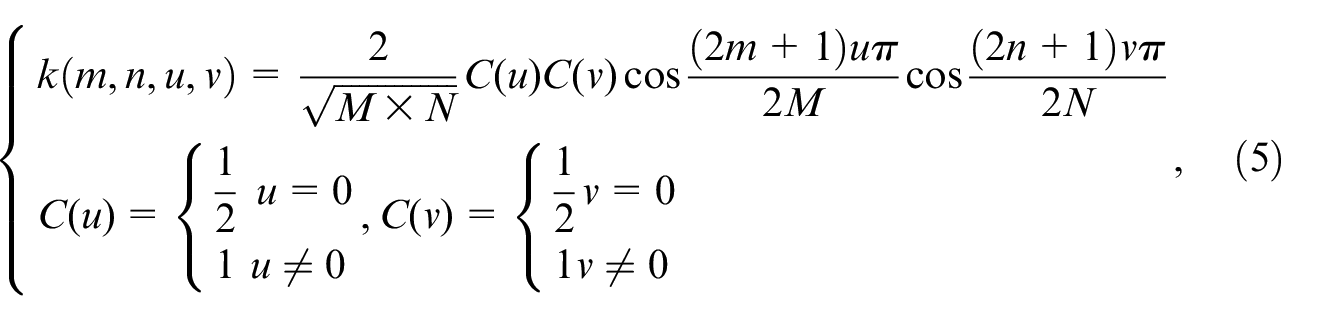
where the value of k(m, n, u, v) represents the deviation of sampling points (m, n) along the z-direction under the mode (u, v); M and N represent the number of sampling points along the x- and y-direction respectively; m, n, u and v are the variables related to sampling frequency. m, u =
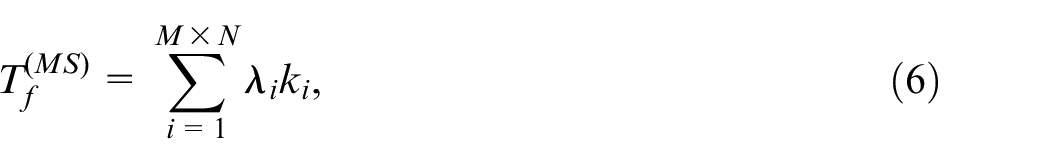
To realize the decomposition and reconstruction of a plane surface, it requires a total of sampling size M×N to generate the plane surface, which also corresponds to the number of basic functions. Besides, one specified mode (u, v) of basic functions corresponds to one basis shape. For example, for a plane surface with a sampling size of 21 rows and 21 columns along x- and y-axes, the first 20 basis shapes of all modes are shown in Table 1. After the linear summation of basic functions with different frequencies, a planar surface with form errors can be generated using the DCT-based method as follows:
First 20 basis shapes of plane reconstruction based on DCT simulation.
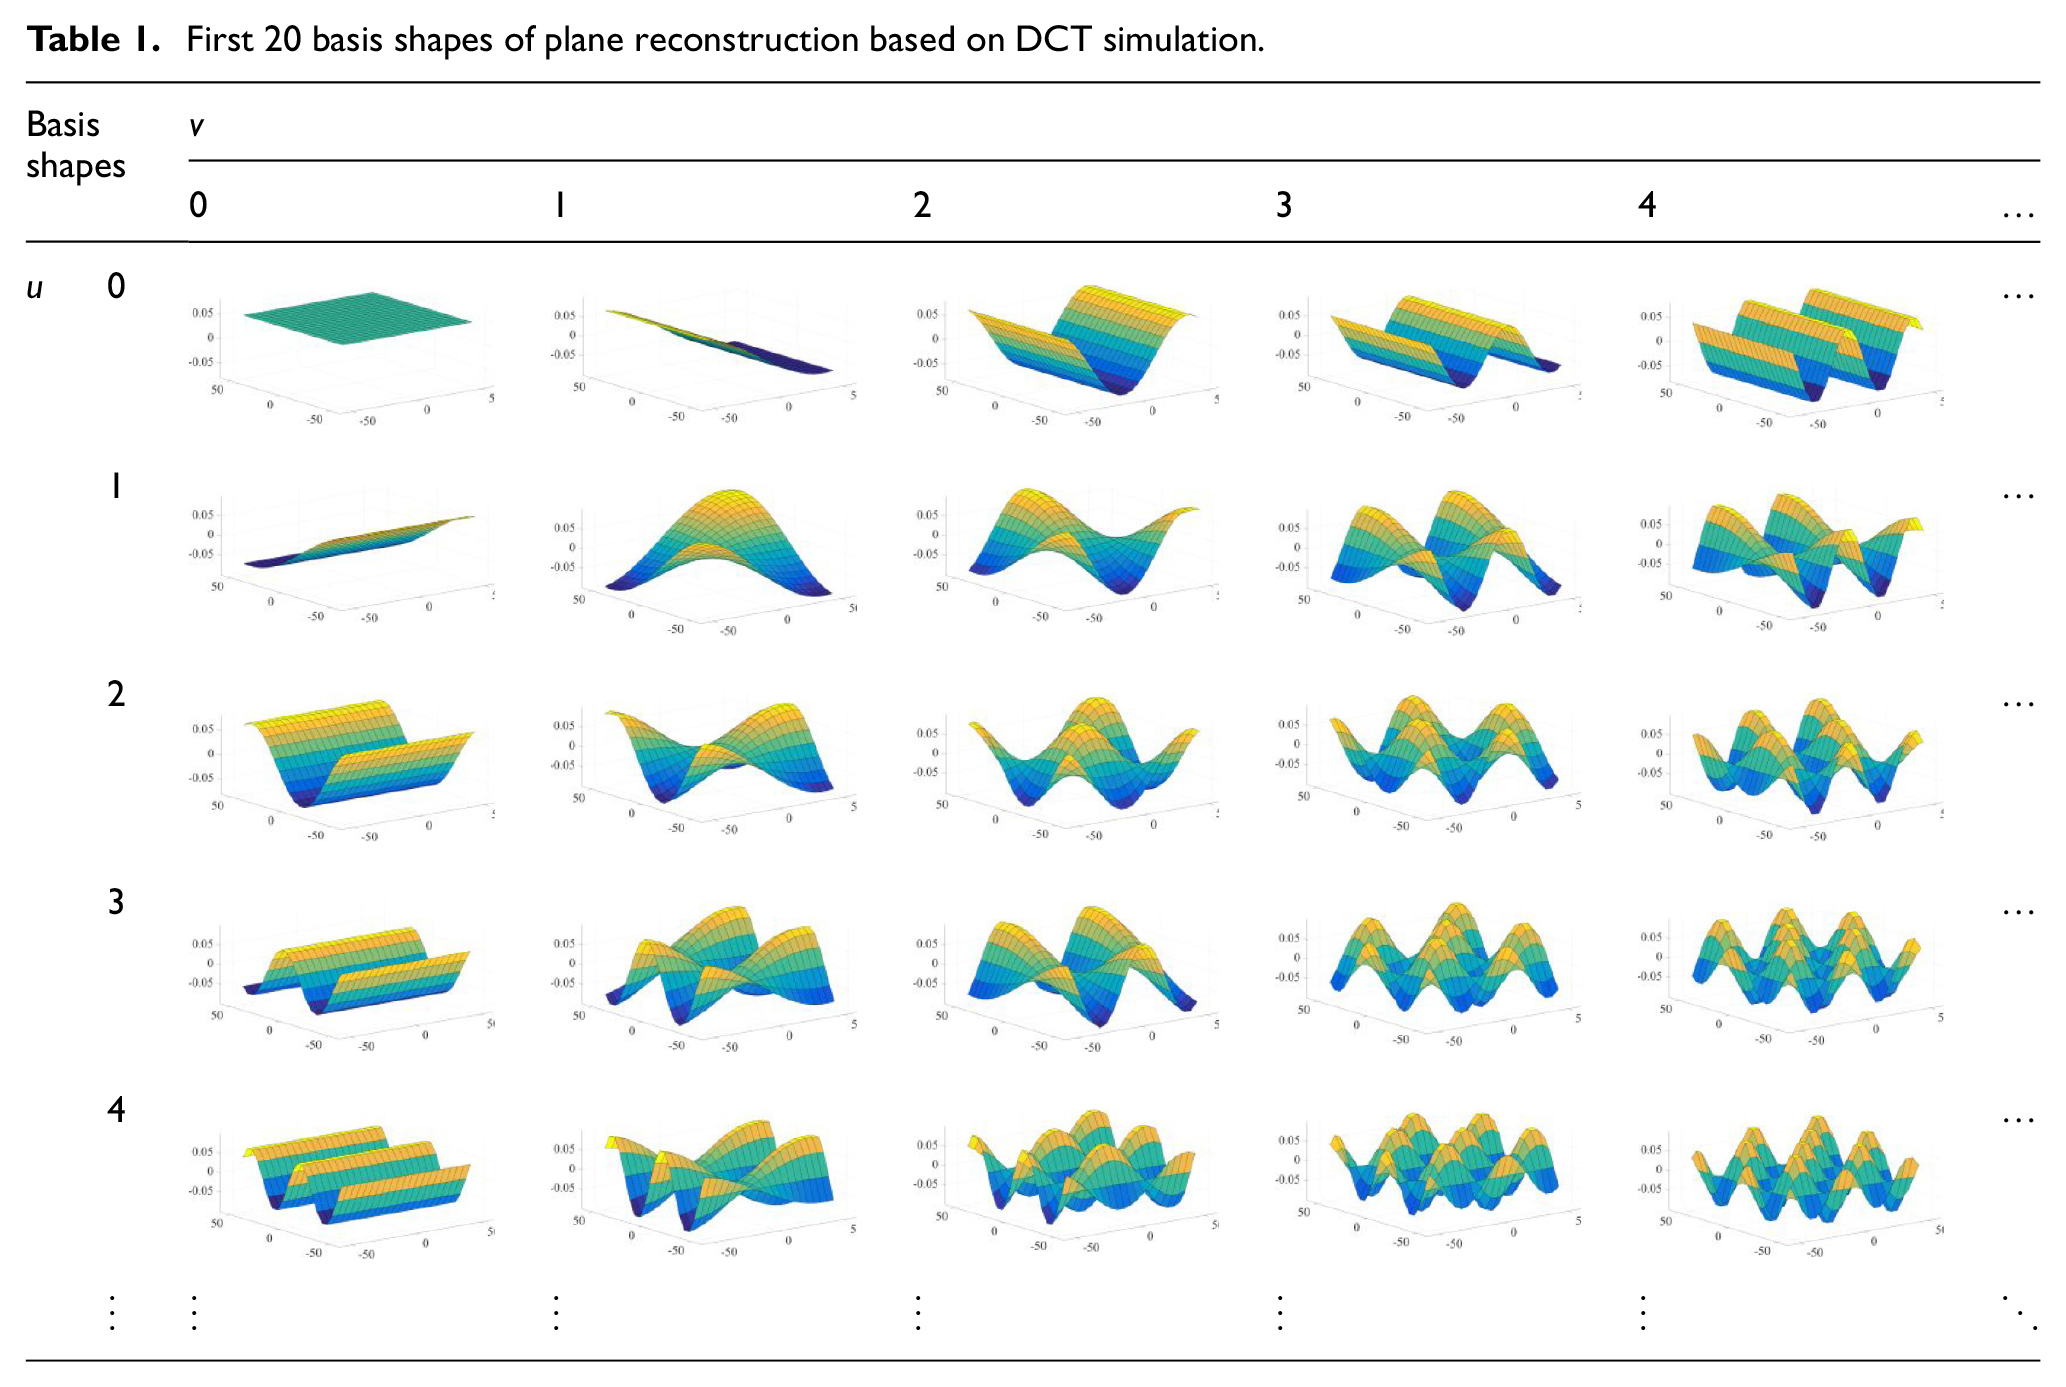
where
Generation of skin model shapes
After obtaining the position, orientation and form errors, the generation of skin model shapes for a plane surface is used to be implemented by summing the deviations of point-set Tp and Tf. Therefore, the modelling of skin model shapes can be represented with the integrated expression as follows:
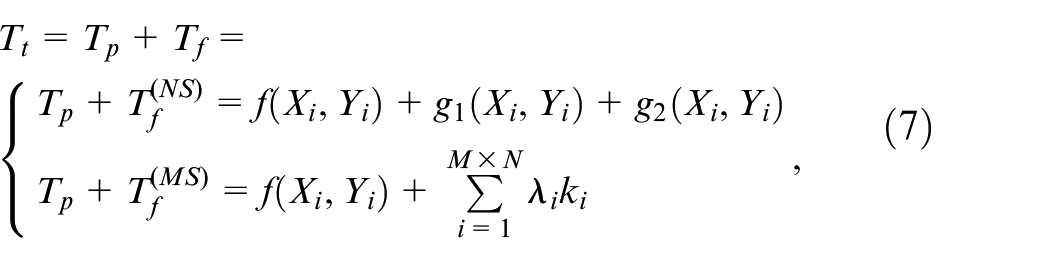
where Tt represents the deviations of sampling points (Xi,Yi) on the skin model shape with position, orientation and form errors of key surfaces in AKFs.
For the generated skin model shape, the value of Tt should conform to the tolerance specification, i.e., Tt is constrained by tp. However, the value of Tt obtained directly from equation (7) is not always satisfied with the constraint of tp. In order to avoid violating the constraint of tp, the generated skin model shape should be verified to conform to the constraint of tp. The modelling and generation flow chart of a valid skin model shape is shown in Figure 4.
Flow chart of generating skin model shape for plane surfaces.
Calculation of assembly deviation propagation
Formation mechanism of mating surface error
To guarantee that the calculation results of assembly deviation propagation can reach a high-fidelity assembly accuracy in the HPMP, the study of the formation mechanism of mating surface errors based on skin model shapes is a necessary prerequisite for obtaining the contact positioning errors. Traditionally, the contact positioning errors have been described by relative posture variation of ideal joint surface between two mating surfaces. However, owing to the skin model shapes by considering the coupling of position, orientation and form errors, the traditional formation mechanism for mating surface error should be updated by taking form errors into account.
As shown in Figure 5(a), the
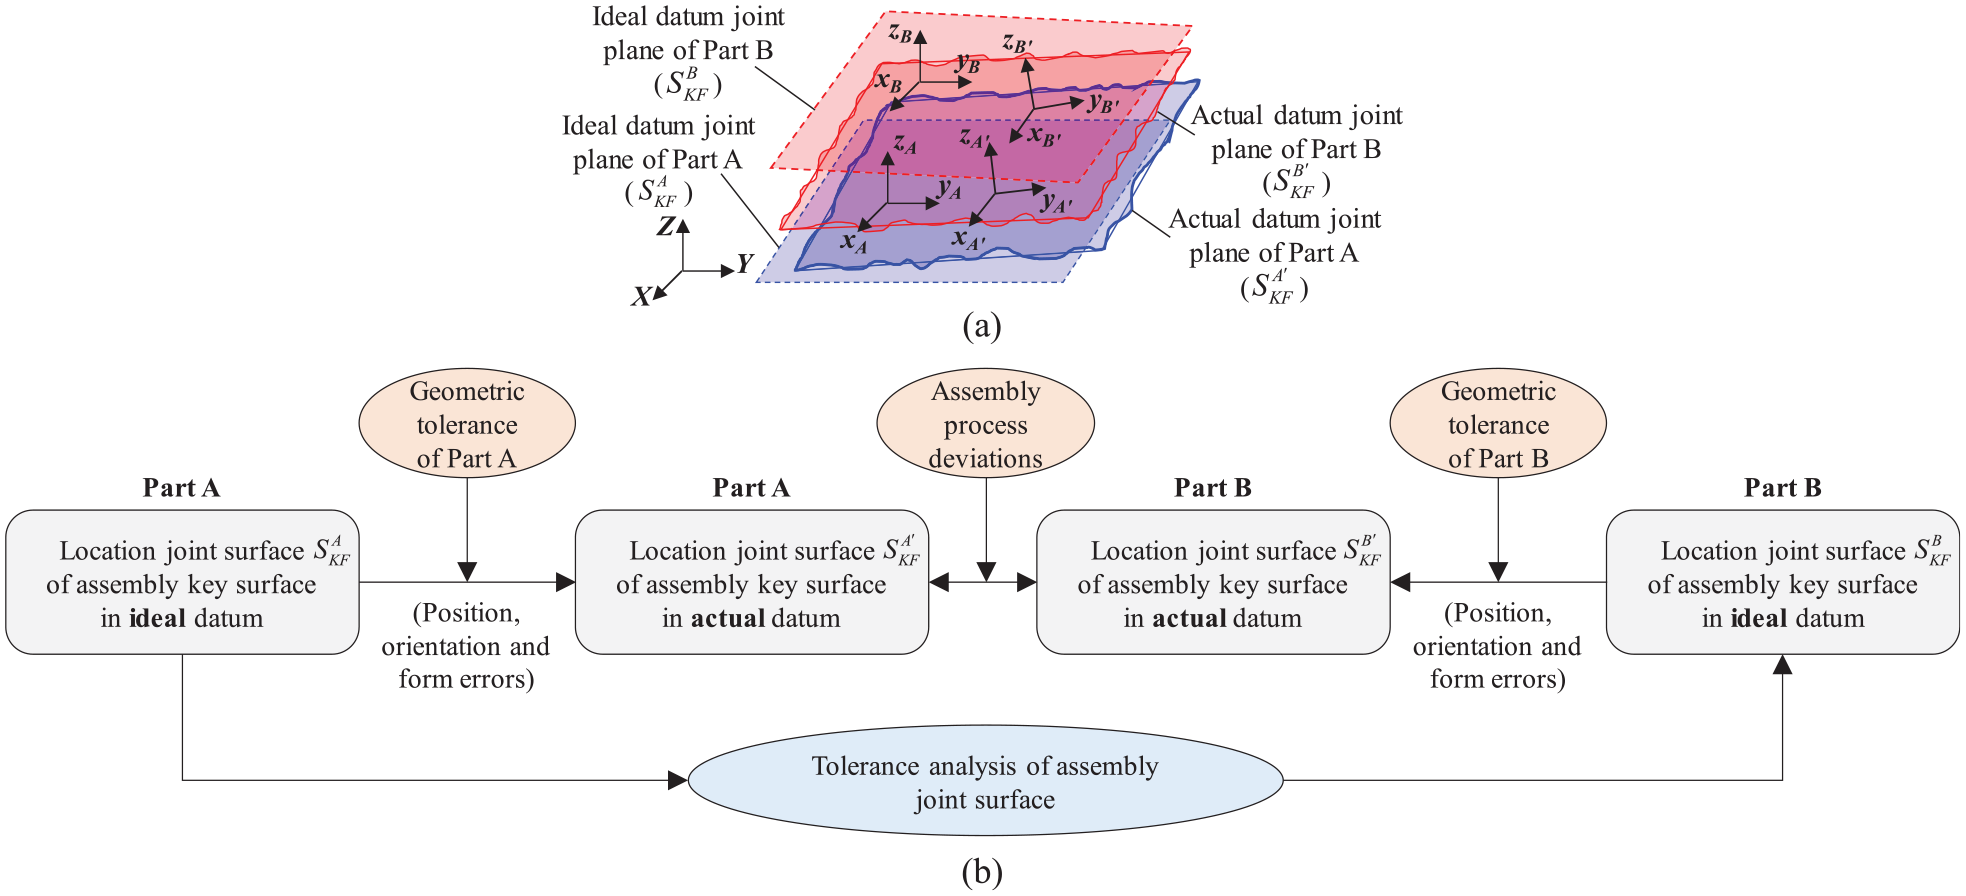
Diagram of mating surface error formation mechanism: (a) relationship between ideal and actual mating joint plane surfaces and (b) mating surface error formation process.
The mating joint surface error consists of three parts: the manufacturing errors of joint surface in Part A and Part B, and the assembly process deviations of two parts, respectively. It should be mentioned that the manufacturing defect simulation of plane joint surface of Part A and Part B can be expressed by tolerance modelling method of skin model shapes, as introduced in Section 3. In addition, the relative contact positioning errors of two non-ideal plane surfaces can be calculated using the progressive contact method. This method is used to obtain the deterministic contact point set between mating joint surfaces, thereby realizing the calculation of relative positioning errors (i.e., position and orientation deviations) between two non-ideal mating joint surfaces.
For the sake of completeness, the use of the progressive contact method to solve contact problems is briefly introduced below. 38 Under the assumption of frictionless non-adhesive contact of rigid body without considering external forces or thermal deformation, a slight modification is made to ensure that the calculation process of assembly deviation propagation is simple and reasonable through replacing the contact between two non-ideal mating joint surfaces with the contact between a rigid ideal surface and an equivalent non-ideal mating joint surface, which is also called different surface method. 28 Taking the plane contact mating pair as an example, Figure 6 shows the 2D contact process of difference surface, where S1 and S2 represent non-ideal mating joint plane surfaces, C1 and C2 represent the corresponding nominal mating joint plane surfaces, respectively, and Sdf represents the equivalent non-ideal mating joint plane surface or difference surface. Thus, the Sdf can be further deduced through the following expression according to the study of Section 3.
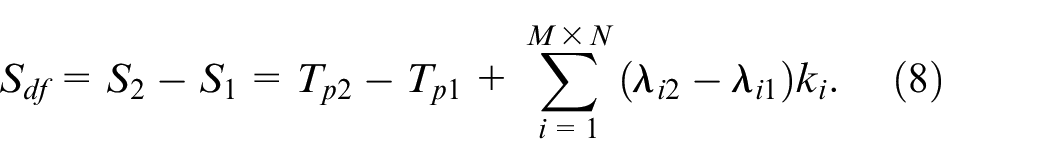
In order to determine the contact condition of relative positioning between the two non-ideal mating joint planar surfaces, it is necessary to calculate the minimum translation distance and the minimum rotation angle of mating joint planar surface C1 by determining the contact points pc1 and pc2, as shown in Figure 6. Therefore, the minimum translation distance and rotation angle are defined as the position and orientation deviations (denoted as POD) of the non-ideal mating joint planar surfaces, respectively. According to the analysis of 2D contact mating pair, the progressive contact method for 3D planar surface can be divided into four stages, as shown in Figure 7.
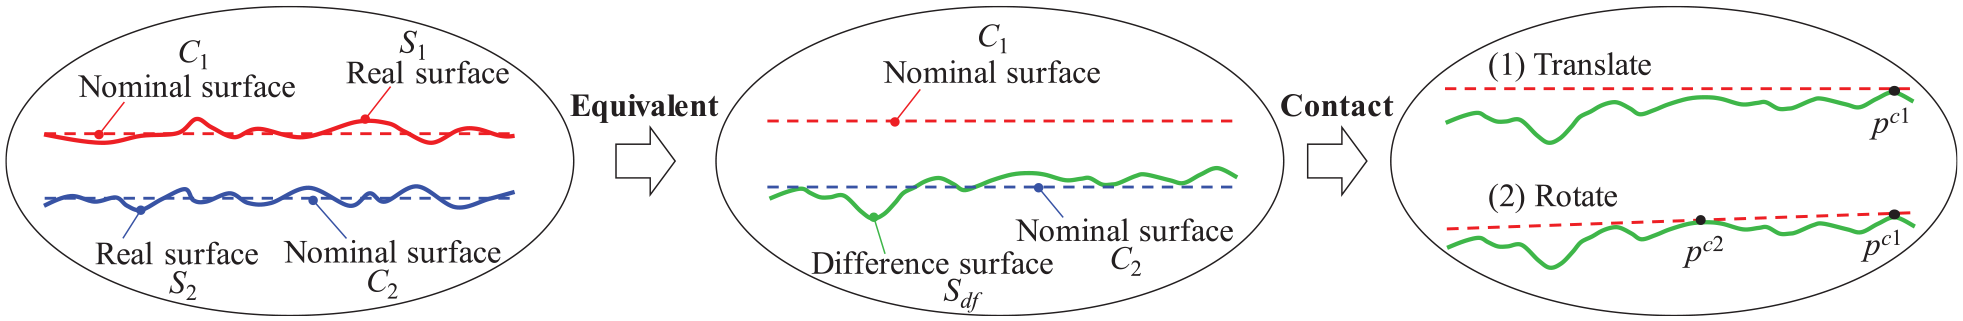
Contact process of difference surface.
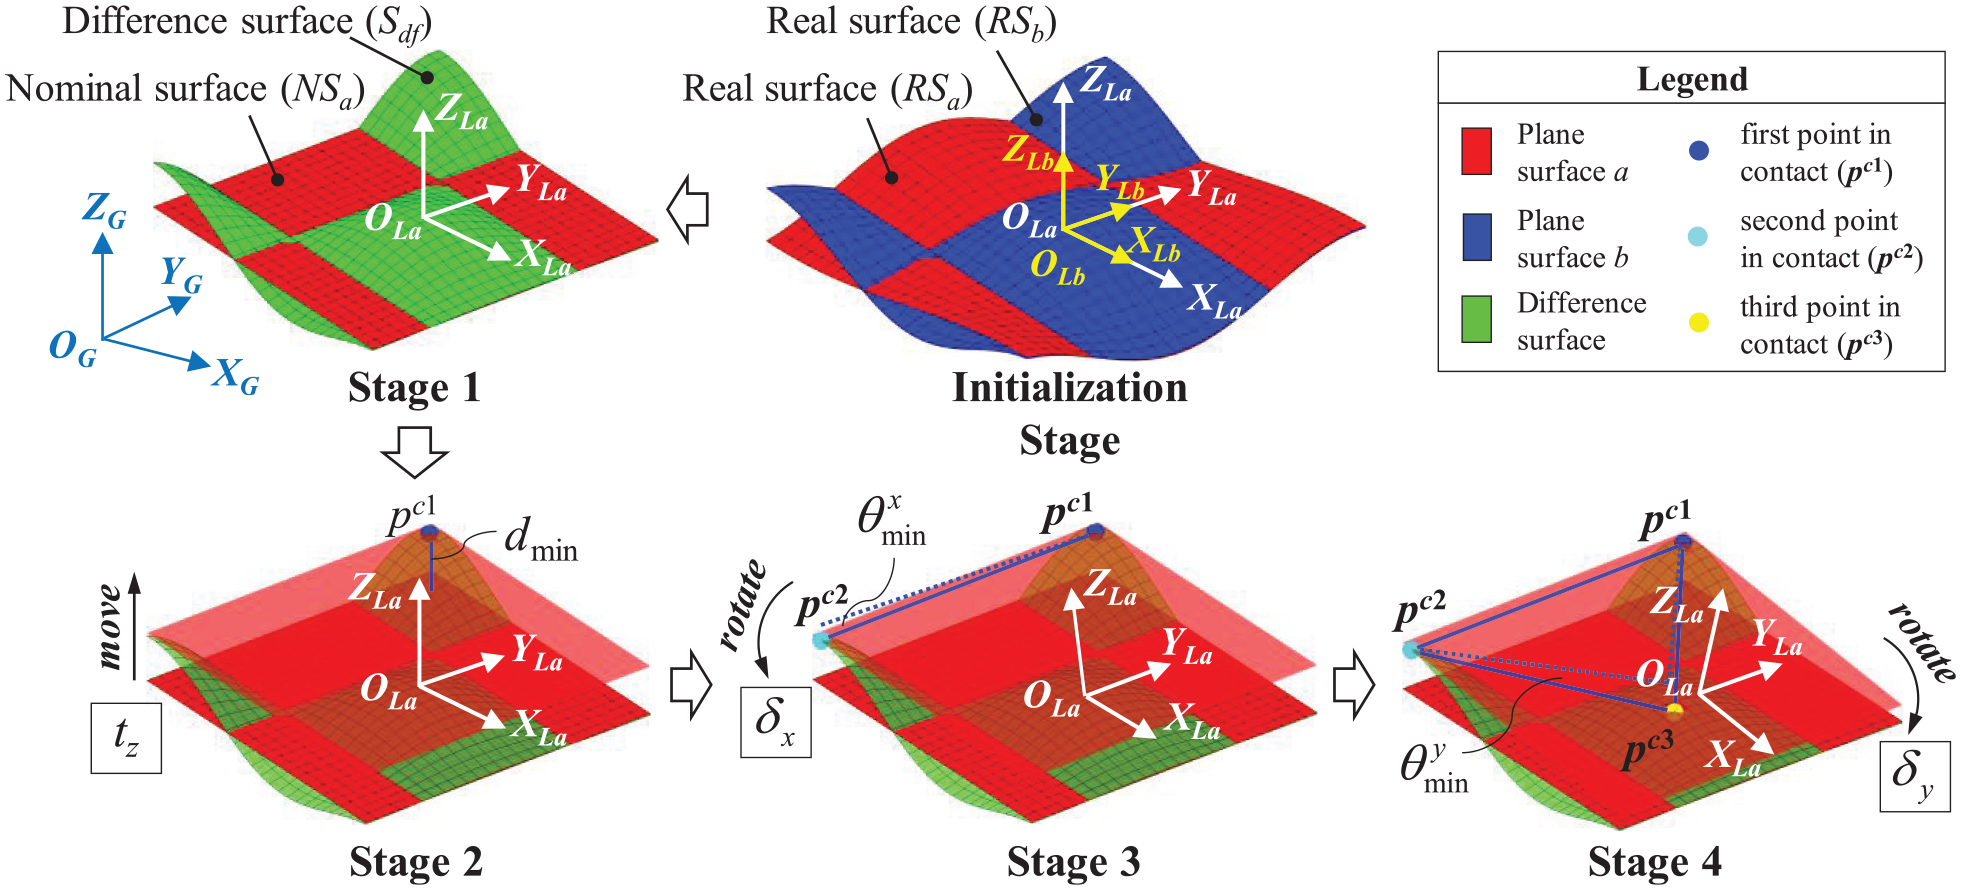
Illustration procedure of the progressive contact method for 3D planar surface.
With contacting between the non-ideal mating joint surfaces based on skin model shapes in two parts, there exists three position and orientation offsets to represent the PODab, including one translational and two rotational position and orientation offsets. The specific computing process of the progressive contact method can be found in reference. 38 Thus, the expression of PODab in the assembly process can be expressed as follows:
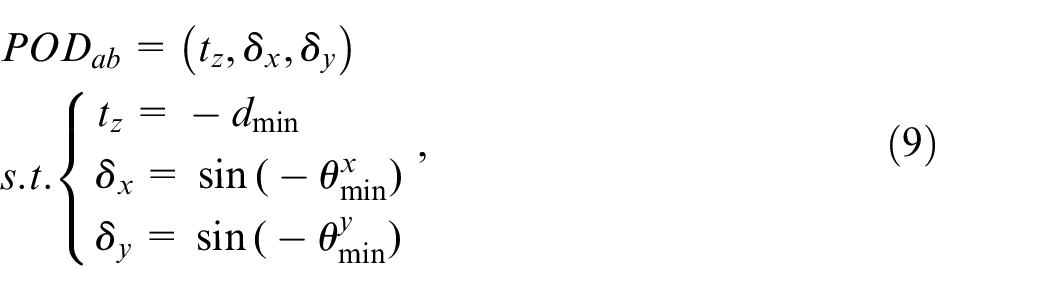
where tz represents the minimum translational position and orientation offset dmin by computing the differences of M×N pairs of sampling points between nominal surface (NSa) and difference surface (Sdf). δx represents the minimum rotating position and orientation offset
Assembly deviation propagation calculation process
The calculation of assembly deviation propagation in the MAP of the HPMP can be implemented based on state space model of the SoV theory, 39 which can quantitatively describe assembly deviation propagation, transformation, and accumulation to realize assembly accuracy prediction. Due to the relative positioning errors of key mating surfaces based on skin model shapes for the MAP, the progressive deviation accumulation of the HPMP will be propagated to subsequent assembly phases along with the assembly process. As shown in Figure 8, for a given assembly sequence, the effect of “deviation propagation” and “deviation accumulation” of each assembly step can be analyzed and calculated continuously until the mechanical product is completely assembled. Finally, the AFRs deviations and assembly accuracy results could be obtained.
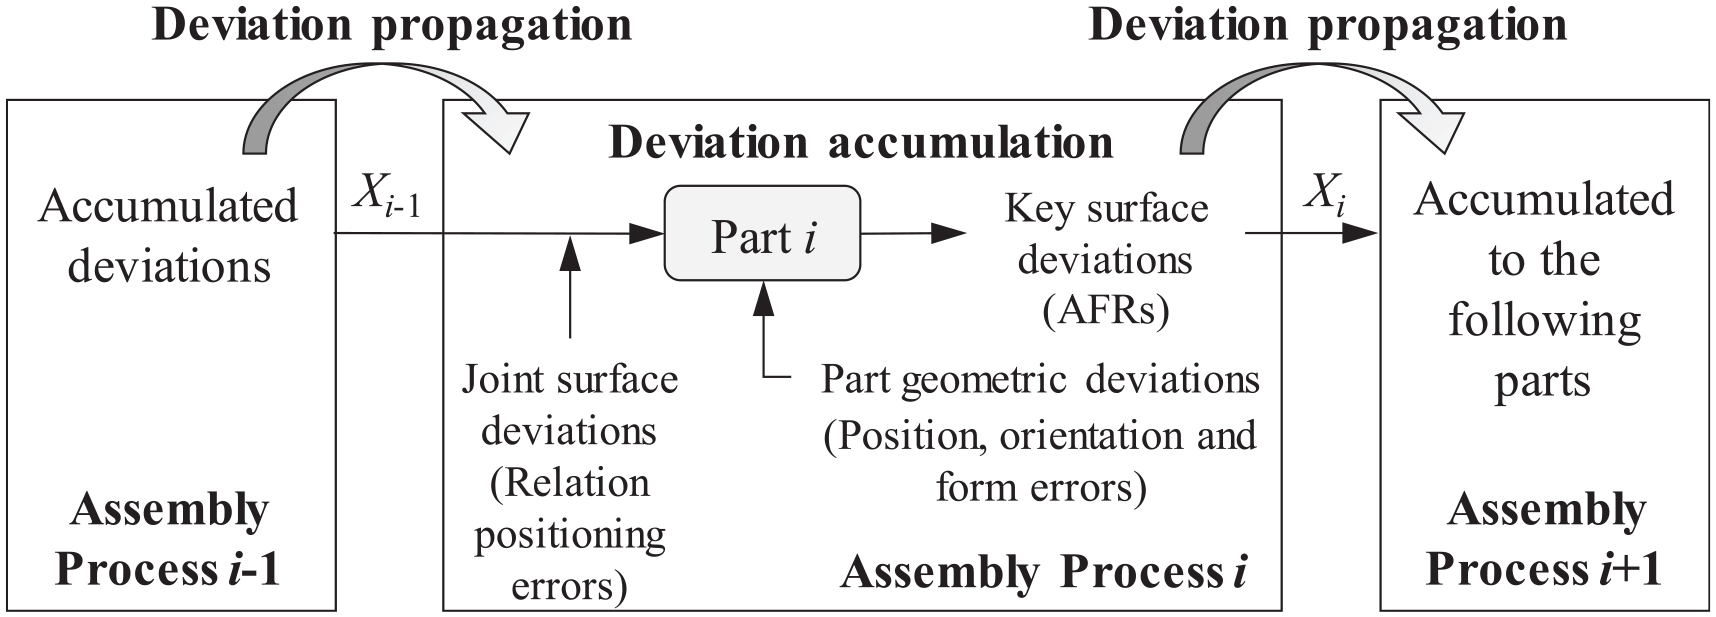
Schematic diagram of assembly deviation propagation and accumulation.
As shown in Figure 9, the MAP of the HPMP can be regarded as a system based on SoV from control theory. Assuming that only one part or component is assembled in each assembly step of the MAP, each assembly step corresponds to one variable state, which is subject to the geometric errors of part and the relation positioning errors between two mating joint surfaces. The key surface deviation of AFRs, obtained in the current assembly process, would be taken as the variable state output to the next assembly process, and then the assembly deviation propagation of current assembly process will be completed. Applying this procedure repeatedly, the deviation values of AFRs can be computed until the HPMP is assembled.
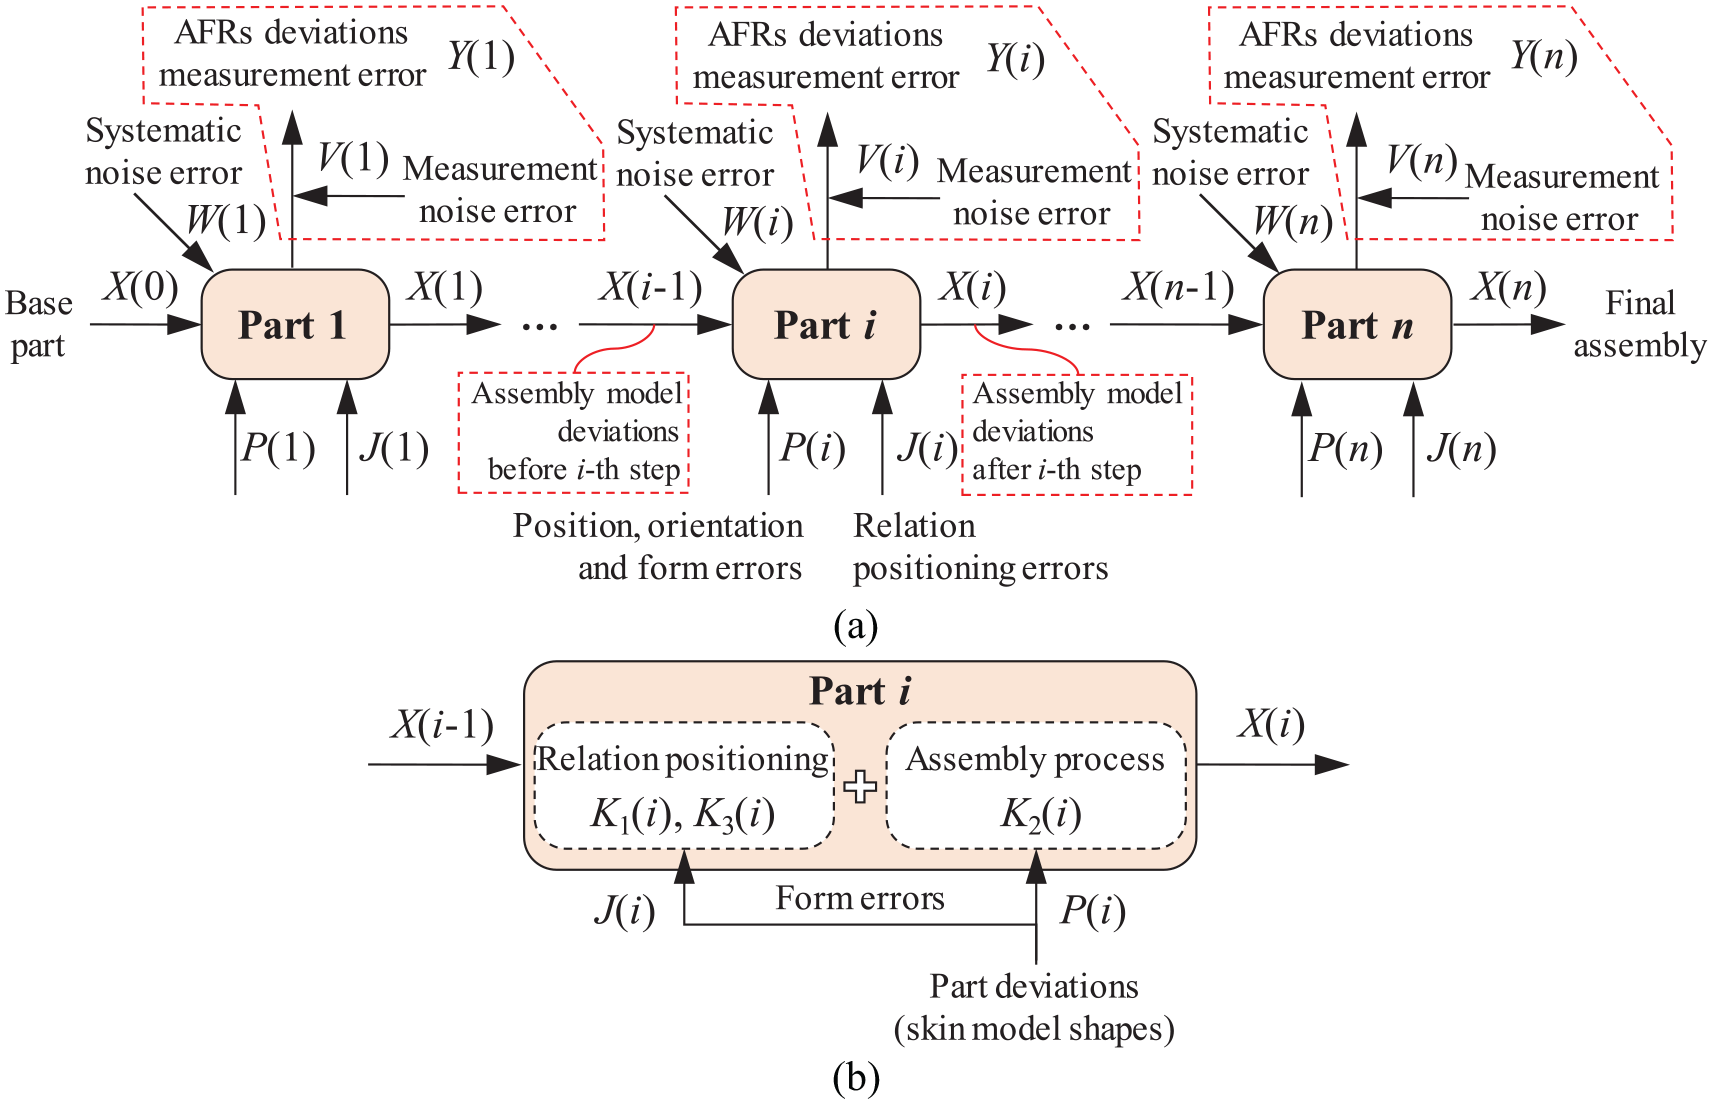
Illustration of assembly deviation propagation in multistage assembly process: (a) deviation propagation in multistage assembly process with n parts and (b) deviation accumulation in the i-th assembly step.
Therefore, based on the variation stream model, the modified state space equation of the i-th assembly step can be expressed in the following equation:
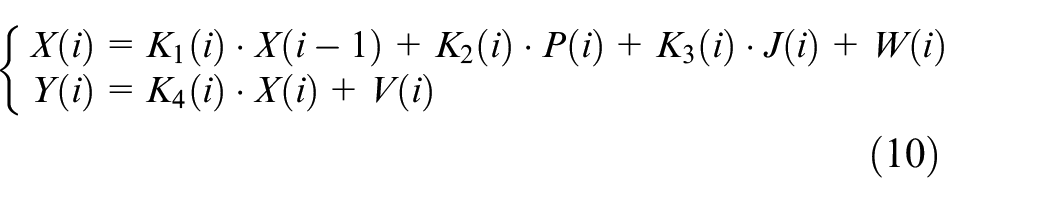
where X(i) is the space vector, representing the result of assembly deviation accumulation after implementing the i-th assembly step; P(i) represents the error vector of part deviations based on skin model shapes, which can be derived from equation (7); J(i) represents the relative positioning error vector between the mating joint surfaces, which can be derived from equation (9); Y(i) is the measurement matrix; W(i) and V(i) are systematic error noise and measurement error noise, respectively. Meanwhile, K1(i), K2(i) and K3(i) are the deviation transformation matrix, influence coefficient control matrix of part geometric deviations and joint surface deviations on the i-th assembly step, respectively; K4(i) is the observation matrix. In the first assembly step, i.e., i = 1, the space vector of equation (10) is simplified as X(1) = P(1) +W(1), which does not consider the relative positioning error between the first part and base part. It should be noted that, in the early design stage, the measurement matrix of AFRs is not indispensable for predicting assembly accuracy of the HPMP, which is neglected during the calculation process of assembly deviation propagation in the context.
Among the equation (10), the deviation transformation matrix K1 can be expressed by the deviation vector of sampling points. When the orientation deviation values of the part are minor, the deviation state vector of two sampling points A(xA, yA, zA) and B(xB, yB, zB) can be written as:

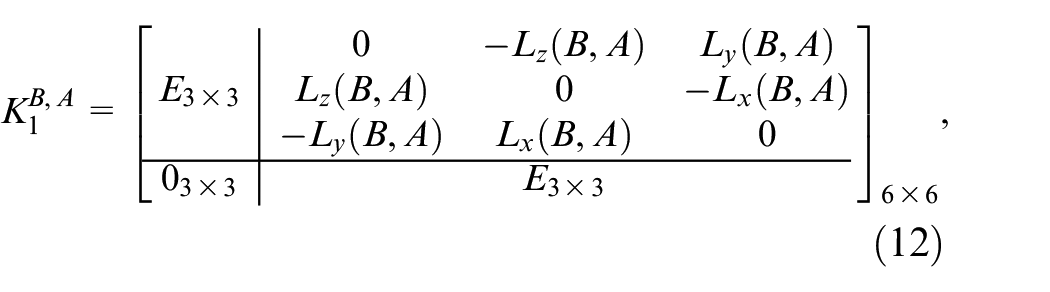
where E3×3 represents a unit matrix of the 3×3 order; Lx(B,A), Ly(B,A) and Lz(B,A) represent abbreviations of the difference in the x-axis, y-axis, and z-axis direction, respectively, which can be derived as Lx(B,A) = xB–xA, Ly(B,A) = yB–yA and Lz(B,A) = zB–zA.
Therefore, for the adjacent assembly process, the deviation transformation matrix can be established using equation (12) by selecting the reference sampling points in the mating joint surfaces. According to equations (10)–(12), the calculation of assembly deviation propagation based on the state space model can be realized. Finally, a Monte Carlo simulation for assembly tolerance analysis should be conducted by performing calculations n times to obtain the statistical characteristics of AFRs and predict assembly accuracy of the HPMP.
Case study
In this section, the calculation results of assembly tolerance analysis for key mating surfaces are discussed. Two simulations are conducted to demonstrate the influences of form errors and relative positioning errors based on skin model shapes. One considers only the influences of position and orientation errors, and the other considers the influences of position, orientation, and form errors. As shown in Figure 2, the statistical distribution results of assembly tolerance analysis for key mating surfaces in the proposed generic integrated approach can be obtained through the Monte Carlo simulation method. A simple assembly of three parts (see Figure 10) that had been used by Teissandier et al. 7 is used to conduct the simulation in this study. It should be mentioned that the three parts are assembled in sequence, that is, Part 2 is assembled on top of Part 1, and Part 3 on top of Part 2.
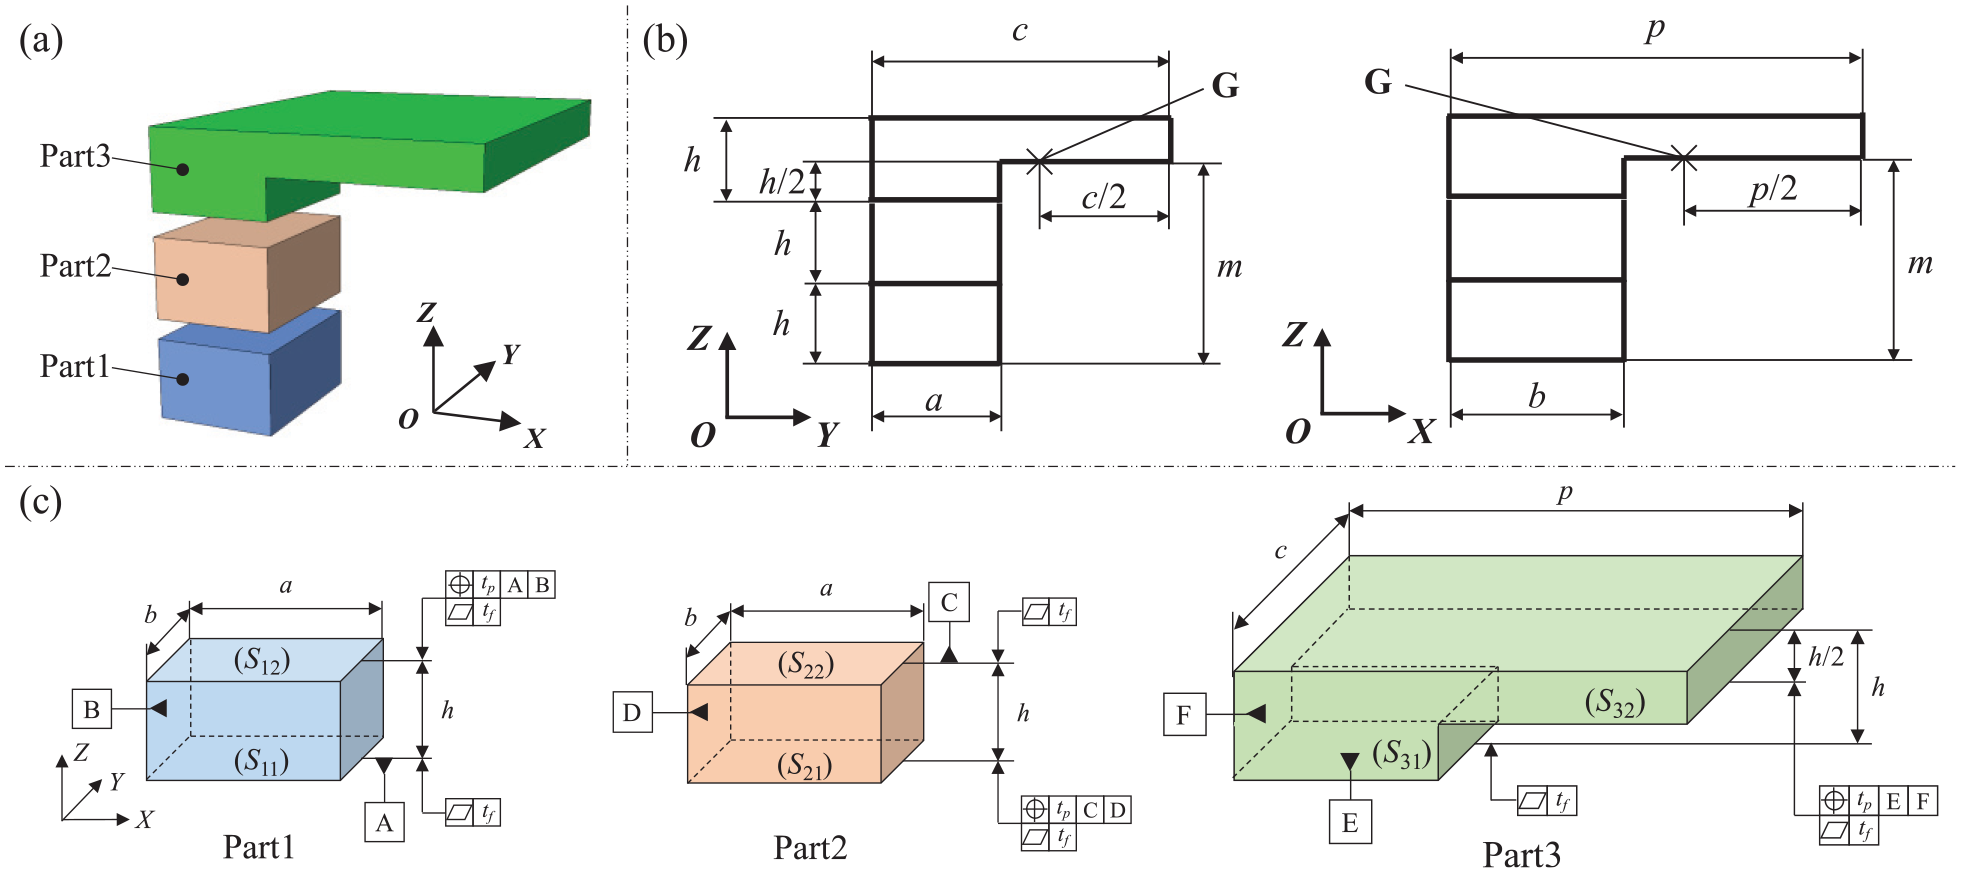
Simple assembly of three parts: (a) three parts, (b) X and Y-direction side views, and (c) geometric specification.
For all the three parts, the assembly simulation is conducted 2000 times, and the sampling size of skin model shapes is M × N = 41×31, a =30 mm, b =40 mm, c =80 mm, p =100 mm, h =20 mm, tp =0.1 mm, and tf =0.05 mm. Besides, assuming that the three parts are verified up to design specification, and the tolerance of machining parts comply with a normal distribution, the dimension tolerance values of all parts are in the interval [–0.2, +0.2], that is, t =0.2 mm.
Theoretical worst case
According to the mentioned classical method in the reference, 7 the relative positioning of two key mating joint surfaces can be determined by the PACV, which can be characterized by the modelling of an ideal fabricated surface to compute the limits of small displacements inside a tolerance zone. For the sake of completeness, a brief introduction to the solving method of theoretical worst case variation of the AFR surface based on the PACV is provided in the following paragraphs.
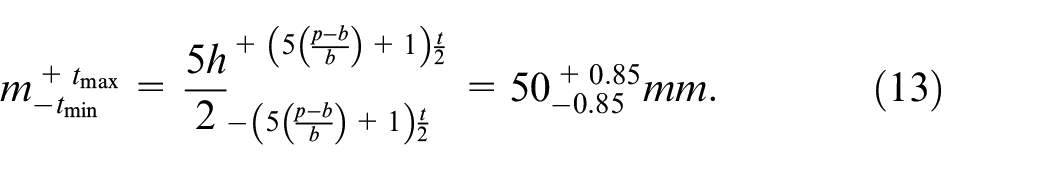
As shown in Figure 10, the objective of this case is to determine theoretical worst case variation characterized by tolerance interval [–tmin, +tmax] of z-direction dimension m at point G on the AFR surface. By calculating the variation domain of theoretical worst case by the SDT theory, we can obtain:
Next, Monte Carlo simulations further demonstrated how the influences of the form errors and relative positioning errors affect quantitatively the values of SDT parameters in the assembly tolerance analysis.
Case 1
Assembly simulation without the consideration of form errors
This case study only considers the position and orientation errors with AFR surfaces. Therefore, under the restriction of tolerance zone depicted by tp, the SDT parameters of AFR surfaces of the three parts should fulfil the following expression:
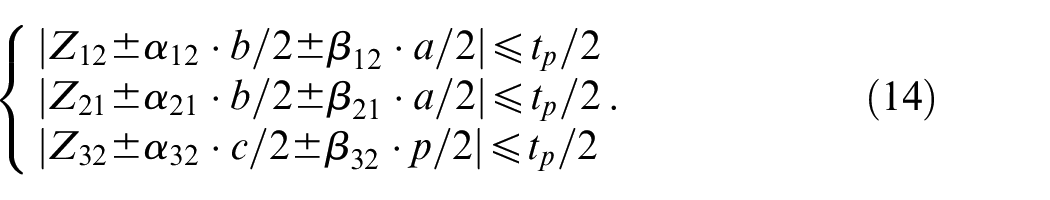
Equation (14) describes the theoretical deviation domain of each SDT parameters. In the process of assembly deviation propagation, the SDT deviation vector of specified key points on the part can be randomly generated complying with normal distribution by equation (1). The deviation value of key point G on the AFR surface can be calculated based on equations (10)–(12) along with assembly deviation propagation. After running 2000 times simulations, the distribution of specified SDT parameters at key point G can be obtained, as shown by the red dots in Figure 12(a). A detailed comparison and discussion of this simulation result are further explained in Section 5.4.
Case 2
Assembly simulation with the consideration of form errors
In this case, the key mating joint surfaces, such as the top and bottom surfaces of Part 1 and Part 2, the bottom surface of Part 3, are randomly generated based on the DCT-based method. The middle surface of Part 3 is produced by second-order shape simulation method presented in Section 3.2. Taking the contact mating between Part 1 and Part 2 as an example, it could be equivalently replaced by a non-ideal surface and an ideal surface based on difference surface method. Thereafter, the three non-linear contact points of relative positioning between two mating joint surfaces are obtained by the progressive contact method. For one time simulation, these contact points are shown clearly by three black dots as shown in Figure 11.
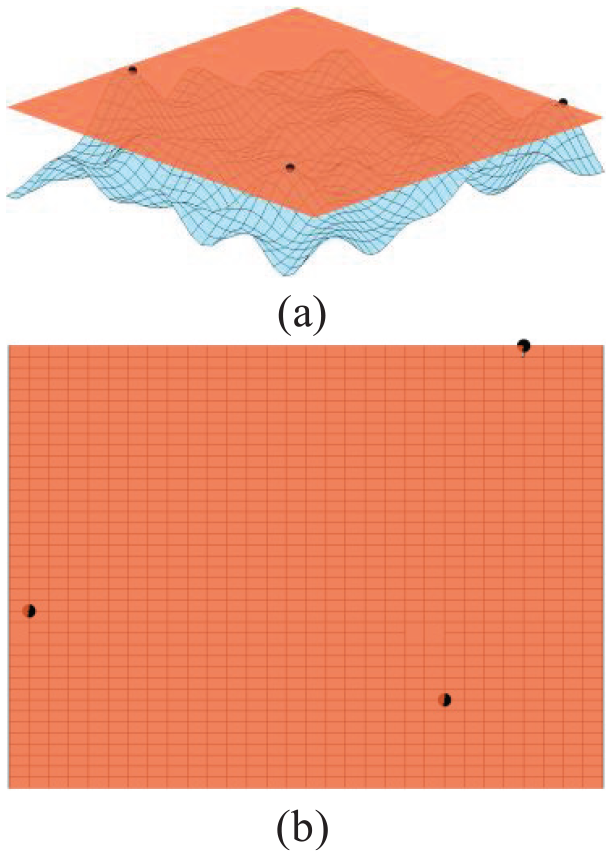
Three contact points of relative positioning of non-ideal mating joint surfaces: (a) side view and (b) top view.
Moreover, the POD12 and POD23 of non-ideal surfaces can be calculated based on equation (9) as the relative positioning errors of mating joint surfaces. Thus, the deviation value of key point G on the AFR surface can be calculated based on equations (10)–(12) along with assembly deviation propagation. In a similar way, after running 2000 times simulations, the distribution of specified SDT parameters at key point G can be obtained, as shown by the green dots in Figure 12(a). The distribution of green dots is different from those red points in Figure 12(b)–(d), which shows the influences of form errors and relative positioning errors of mating joint surfaces in the process of assembly deviation propagation. A more detailed comparison and discussion of this simulation result are given in Section 5.4.
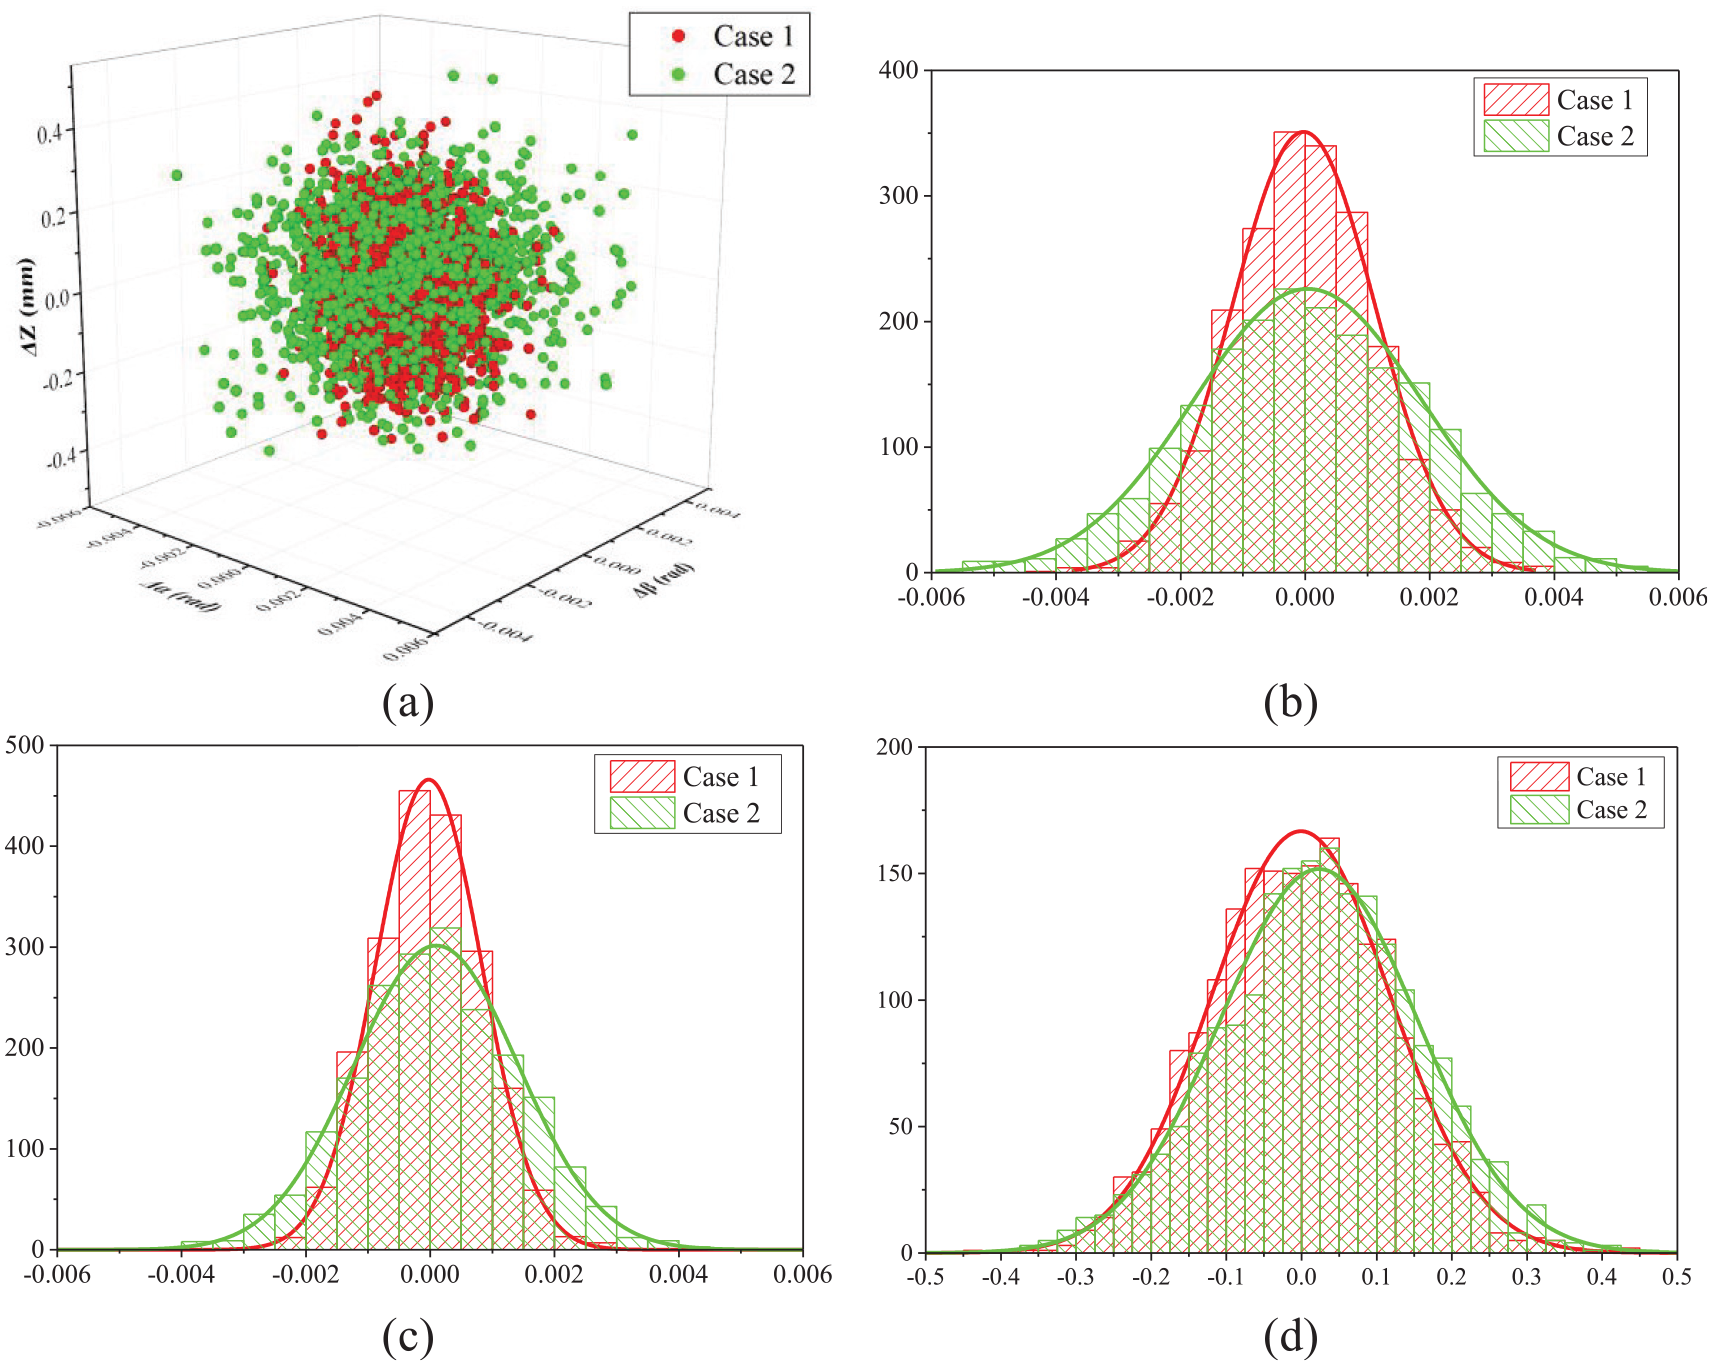
Calculation results of Case 1 and Case 2: (a) scatter diagram of SDT parameters, (b) histogram of frequencies for Δα (rad), (c) histogram of frequencies for Δβ (rad), and (d) histogram of frequencies for ΔZ (mm).
Results and discussion
To quantitatively analyze the effects of assembly deviation propagation by considering form errors and relative positioning errors, the deviation domain of key point G in the AFR surface is calculated by Monte Carlo simulation. This gives the calculation results of each SDT parameters as shown in Figure 12 for Case 1 and Case 2. Figure 12(a) indicates that the deviation value of AFR surface would have a certain extent effects along with assembly deviation propagation due to the consideration of form errors and relative positioning errors. Additionally, Figure 12(b)–(d) show the SDT parameters distributions of 2000 simulation runs of the two cases for comparison. Both form errors and relative positioning errors influence Δα, Δβ and ΔZ, but they have a greater influence on ΔZ compared with Δα and Δβ, which has an identical phenomenon reported by Liu et al. 29 Furthermore, this result also demonstrates that ignoring rotational angles is acceptable when form errors and relative positioning errors are considered in the assembly tolerance analysis, but they have a considerable effect on translational deviation ΔZ.
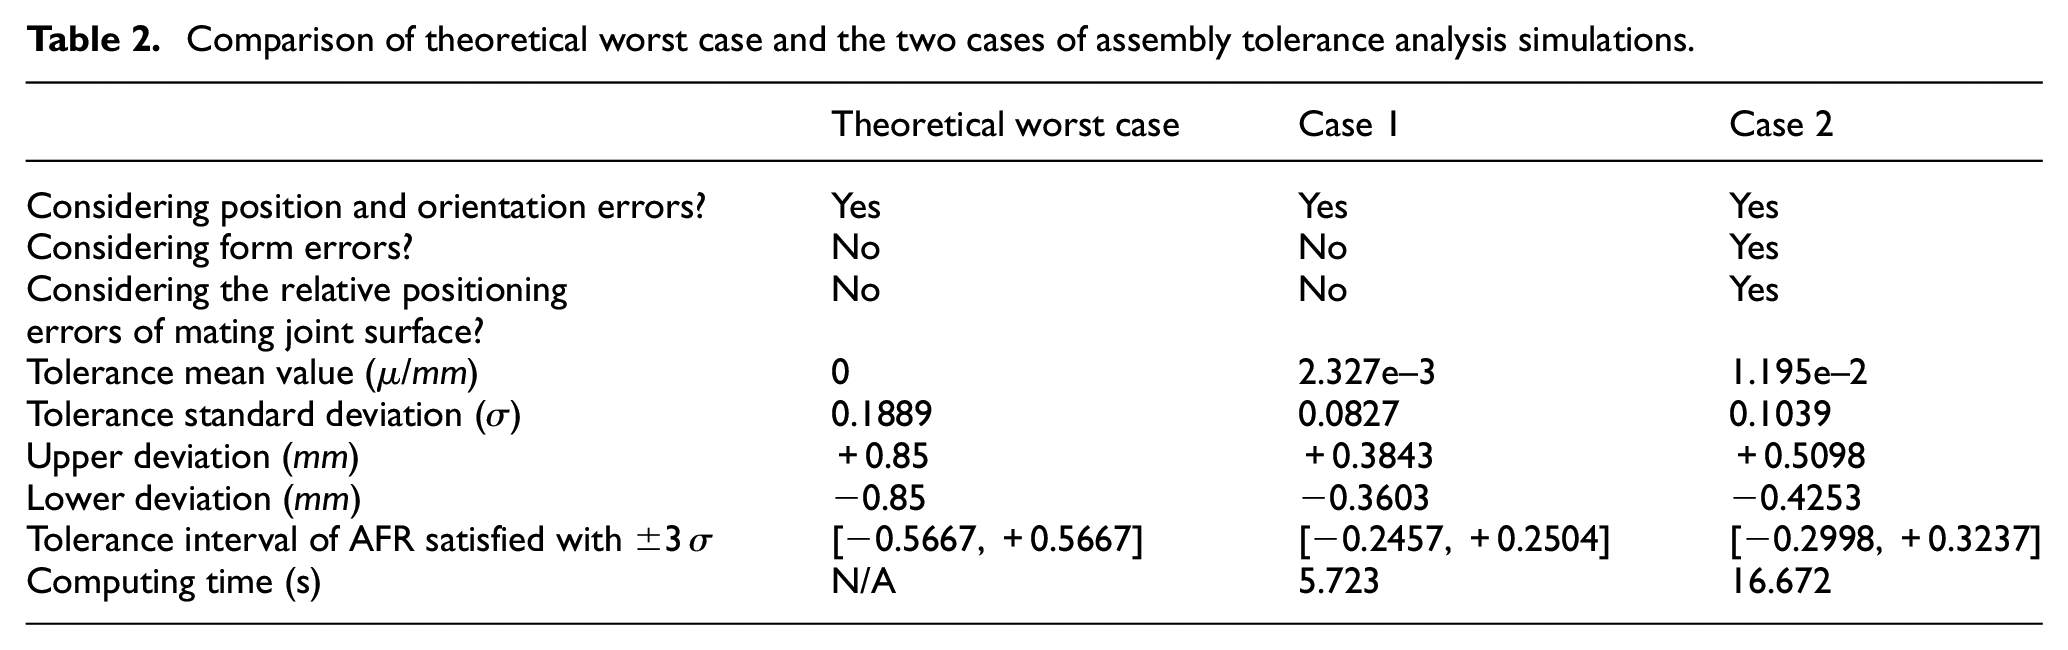
Table 2 lists the specific numerical comparison and descriptions of z-direction deviation at key point G in the afore mentioned cases. Figure 13 draws the corresponding deviation domain at the theoretical worst case and the two cases of assembly tolerance analysis simulation. As shown in Table 2 and Figure 13, Monte Carlo simulation method of Case 1 and Case 2 have higher assembly accuracy than the theoretical worst case method. With the introduction of form errors and relative positioning errors between mating joint surfaces, the deviation domain interval of key point G calculated in Case 2 is greater than Case 1, which is more according with actual situation of assembly deviation propagation. Moreover, Table 1 includes the calculation times of the two cases, which shows that the two simulation calculations are quite efficient. Even for Case 2, in which the generation of skin model shapes and the relative contact positioning errors between key mating joint surfaces are calculated, the average time is less than 0.01 s for one simulation run. Therefore, the calculation efficiency of the proposed generic integrated assembly tolerance analysis approach in Section 2 is acceptable.
Comparison of theoretical worst case and the two cases of assembly tolerance analysis simulations.
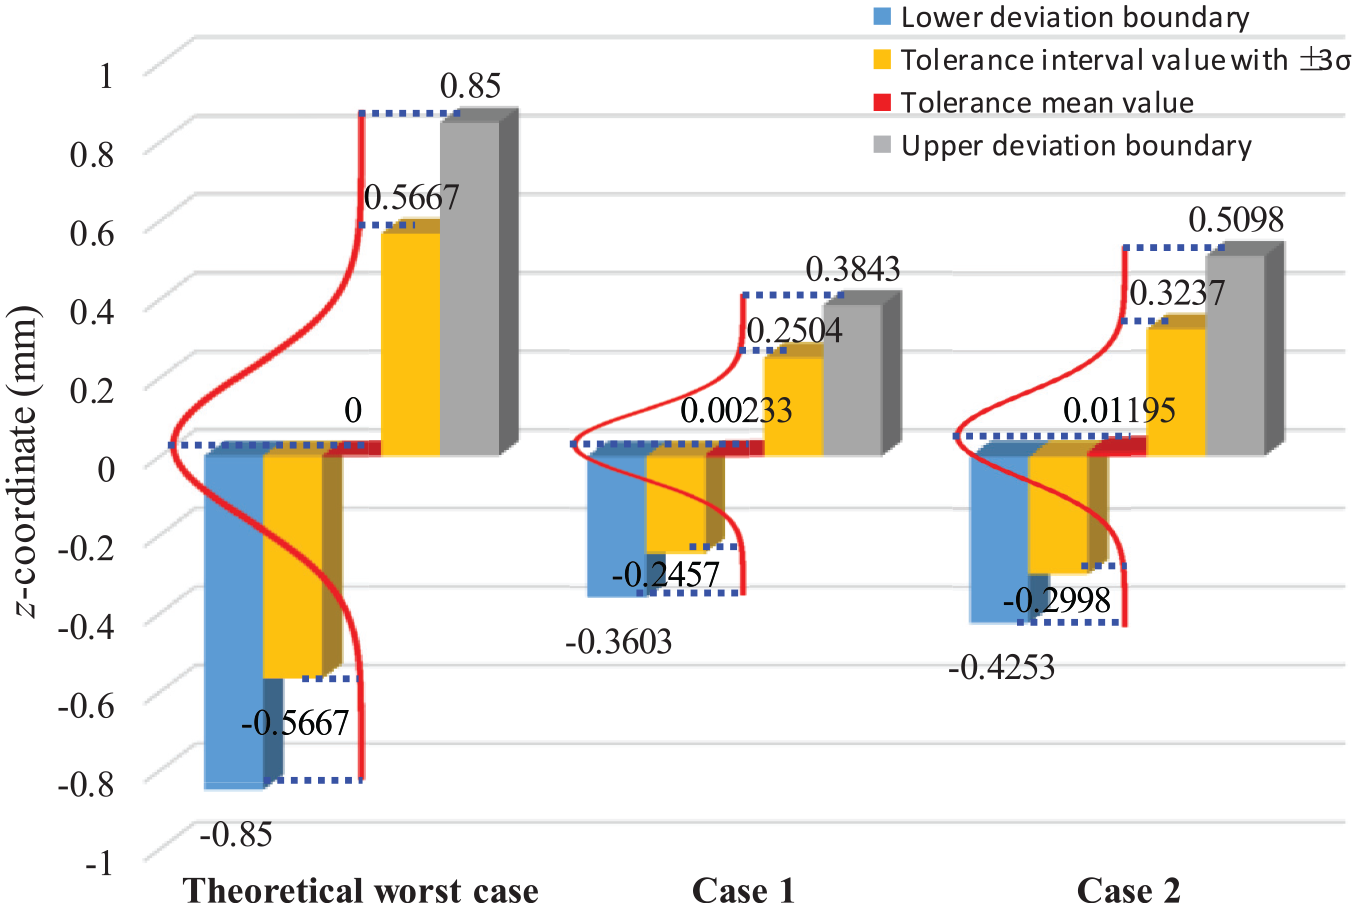
Deviation domain of theoretical worst case, case 1 and case 2 at key point G.
Conclusion
The aim of this study is to achieve a realistic virtual CAD model for a high precision assembly technology, and to predict assembly accuracy for ensuring assembly quality and performance of HPMPs in the early design stage. This paper proposes a generic integrated approach of assembly tolerance analysis based on skin model shapes and deviation propagation theory for planar surfaces in the HPMPs, which can also be applied to cylindrical surfaces in the similar method. Here, a generic approach in the assembly tolerance analysis that considers form defects and relative positioning deviations is implemented through integrating the advantages of each methods. First, in order to differentiate and provide appropriate methods for the generation of skin model shapes based on different mate types of AKFs, two generic methods, i.e., DCT-based method for mating surfaces and second-order shape morphing method for non-mating surfaces, are introduced to model and generate skin model shapes with manufacturing defects. Then, to avoid complicated and inefficient analysis procedures on assembly contact problems between two non-ideal surfaces based on skin model shapes, the relative positioning errors are calculated by considering form defects based on the slightly modified progressive contact method for further research on assembly deviation propagation. On this basis, for the sake of the improvement of assembly deviation propagation based on skin model shapes, the calculation of assembly deviation propagation is conducted based on the SoV theory and modified state space model, and the deviation values of AFRs are obtained using the Monte Carlo simulation in assembly tolerance analysis. Finally, the results of case study in typical assembly tolerance analysis indicate that the proposed generic integrated approach could lead to a more realistic assembly deviation prediction of HPMPs accurately and efficiently.
In further research, considering more factors, such as multiple parallel pairs of contact mating surfaces with various surface types and local surface deformations taking into account flexible parts, will be a part of the ongoing research, thereby possibly further improving the proposed assembly tolerance analysis approach to expand its applicability and ability to solve more complicated assembly problems.
Footnotes
Declaration of conflicting interests
The author(s) declared no potential conflicts of interest with respect to the research, authorship, and/or publication of this article.
Funding
The author(s) disclosed receipt of the following financial support for the research, authorship, and/or publication of this article: The author(s) gratefully acknowledge the financial support by the Fundamental Research Funds for the Central Universities (Grant No. 30917014101), the Qinglan Project Funding in Jiangsu University of China (2017), the Preliminary Research Program of Equipment Development Department of China (Grant No. 61409230103), and the National Key Research and Development Program of China (Grant No. 2018YFB1701301).