
Abstract
Additive manufacturing technologies are becoming more popular, as they allow the fabrication of specific parts with complex geometries not achievable by conventional manufacturing. In metal additive manufacturing, one of the most widely used technologies is laser powder bed fusion. This work focuses on the influence of different processing parameters on the density of AISI 316L stainless parts obtained through this technology. The article presents a review of published works on the deposition of AISI 316L stainless steel using laser powder bed fusion to define an optimal range of parameters to produce parts with densities above 99%, complemented by density measurements for new sets of laser powder bed fusion processing parameters within the defined optimal range. The investigation provides a further insight on the effect of operating parameters such as vector size and gas atmosphere (Nitrogen and Argon) on the part density. The density measurements were performed using two techniques: micrograph analysis and Archimedes method. Results reveal that an increase in vector size has a negative influence on part density. With the Archimedes method, a maximum relative density of 99.87% was achieved using Nitrogen atmosphere, showing that it is possible to produce near fully dense parts by laser powder bed fusion without post-processing by laser re-melting.
Keywords
Introduction
Additive manufacturing (AM) is, nowadays, regarded as a viable technology for producing fully functional parts rather than simple prototypes, as per its original definition: rapid prototyping (RP). It is precisely this evolution in part quality that led to the nomenclature change from RP to AM.1,2 AM comprises different types of technologies which allow the production of parts from different materials, such as metals, polymers or ceramics, but all are based on the same layer-by-layer building principle that allows parts to have complex geometries which would be very difficult, if not impossible, to obtain by subtractive manufacturing (SM) technologies.3,4 One of the technologies available for metal AM is laser powder bed fusion (LPBF), in which a bed of powder metal is selectively melted with a laser, according to the geometry of the layer of the part being produced. Then, another layer of powder is added, and the process is repeated until the final part is obtained.5,6 LPBF, being powder-based, produces parts with lower density than parts produced by SM from bulk material, due to pores that appear within the part. 7 The pores may result in parts with worse mechanical properties, which is undesired for structural components. In order to control the part porosity in LPBF and, consequently, its density, the processing parameters, such as energy density, hatch spacing, layer thickness, scan speed, spot size, vector size and powder particle size, must be optimized.
Literature review
LPBF manufacturing has several processing parameters which influence the outcome of the final part. For instance, the laser scanning strategy through the individual cross-sections of the part plays a very important role on the mechanical properties and density, as stated by Hitzler et al.
7
These parameters include laser power, hatch spacing, scan speed and spot size, as shown in Figure 1. Nonetheless, there are also other processing parameters which may influence the properties of the part such as powder particle size or layer thickness. The combination of four of the mentioned processing parameters allows us to determine the utilized energy density
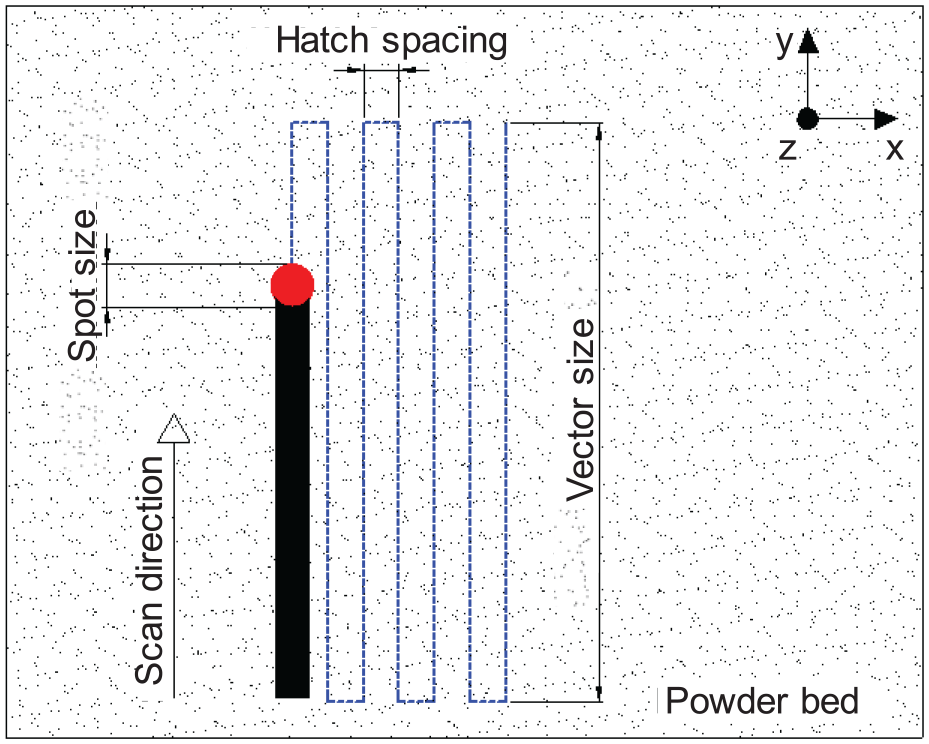
Schematic representation of hatch spacing, vector size and spot size.
Previous work regarding the influence of LPBF processing parameters on 316L stainless steel density of the parts was initially performed without achieving full melting of the metal powder by using a relatively low laser power.8,9 The low values of laser power explain why the obtained densities were far from 100% (maximum relative densities of 60% 8 and 87% 9 ). Since then, there is a necessity to fully melt the metal powder in order to obtain additively manufactured functional components.
Studies performed by Meier and Haberland 10 and Spierings and Levy 11 were some of the first published works that achieved densities near 100% (maximum relative densities of 99% 10 and 99.5% 11 ). Both studies showed the effect of energy density in part density. However, Spierings and Levy 11 also present the individual effect of scan speed and powder particle size. Both studies performed different density measurement techniques: micrograph analysis 10 and the Archimedes method. 11
Kruth et al. 12 and Yasa et al. 13 studied the effect of the scan strategy on 316L part density, surface quality, microstructure and residual stresses. Kruth et al. 12 also showed that post-processing by laser re-melting can significantly increase the density of the part (maximum relative density of 99.9%). Yasa et al.’s 13 was the first available study to build specimens using different vector size values. However, the individual influence of this processing parameter on part density was not analysed.
Yasa et al. 14 continued the work performed initially by Kruth et al. 12 on the effect of laser re-melting on part properties such as part density, microstructure and surface quality, resulting in the highest recorded LPBF 316L part density of 99.968%. Meanwhile, Levy and colleagues 15 further elaborated the work performed by Spierings and Levy, 11 detailing the influence of the particle size distribution of powder materials on part properties, such as density, surface quality and mechanical properties.
Kamath et al. 16 used high laser power (up to 400 W) in order to obtain full melting with high scan speeds (up to 2250 mm/s), concluding that for higher power values, high density parts can be obtained over a wider range of scan speed values. These results indicate that the utilization of higher laser power could provide greater flexibility in choosing process parameters that optimize different properties of the built part. Sun et al. 17 also analysed the part density using high build rates, achieving near fully dense parts for scan speeds from 625 to 3000 mm/s for a laser power of 380 W.
Cherry et al. 18 investigated the effect of energy density on the shape and quantity of porosity. This work stated that the total porosity is strongly influenced by laser energy density, where the minimum porosity value (part density of 99.62%) was obtained at 104.52 J/mm3. Moreover, this work also presents the negative influence of porosity on the measured material hardness. However, this influence is only significantly visible in cases of high porosity (over 2%).
An overview of available studies that include LPBF 316L part density measurements is presented in Table 1.
Selected parameters variation and resulting part density in previous work with 316L stainless steel in LPBF.
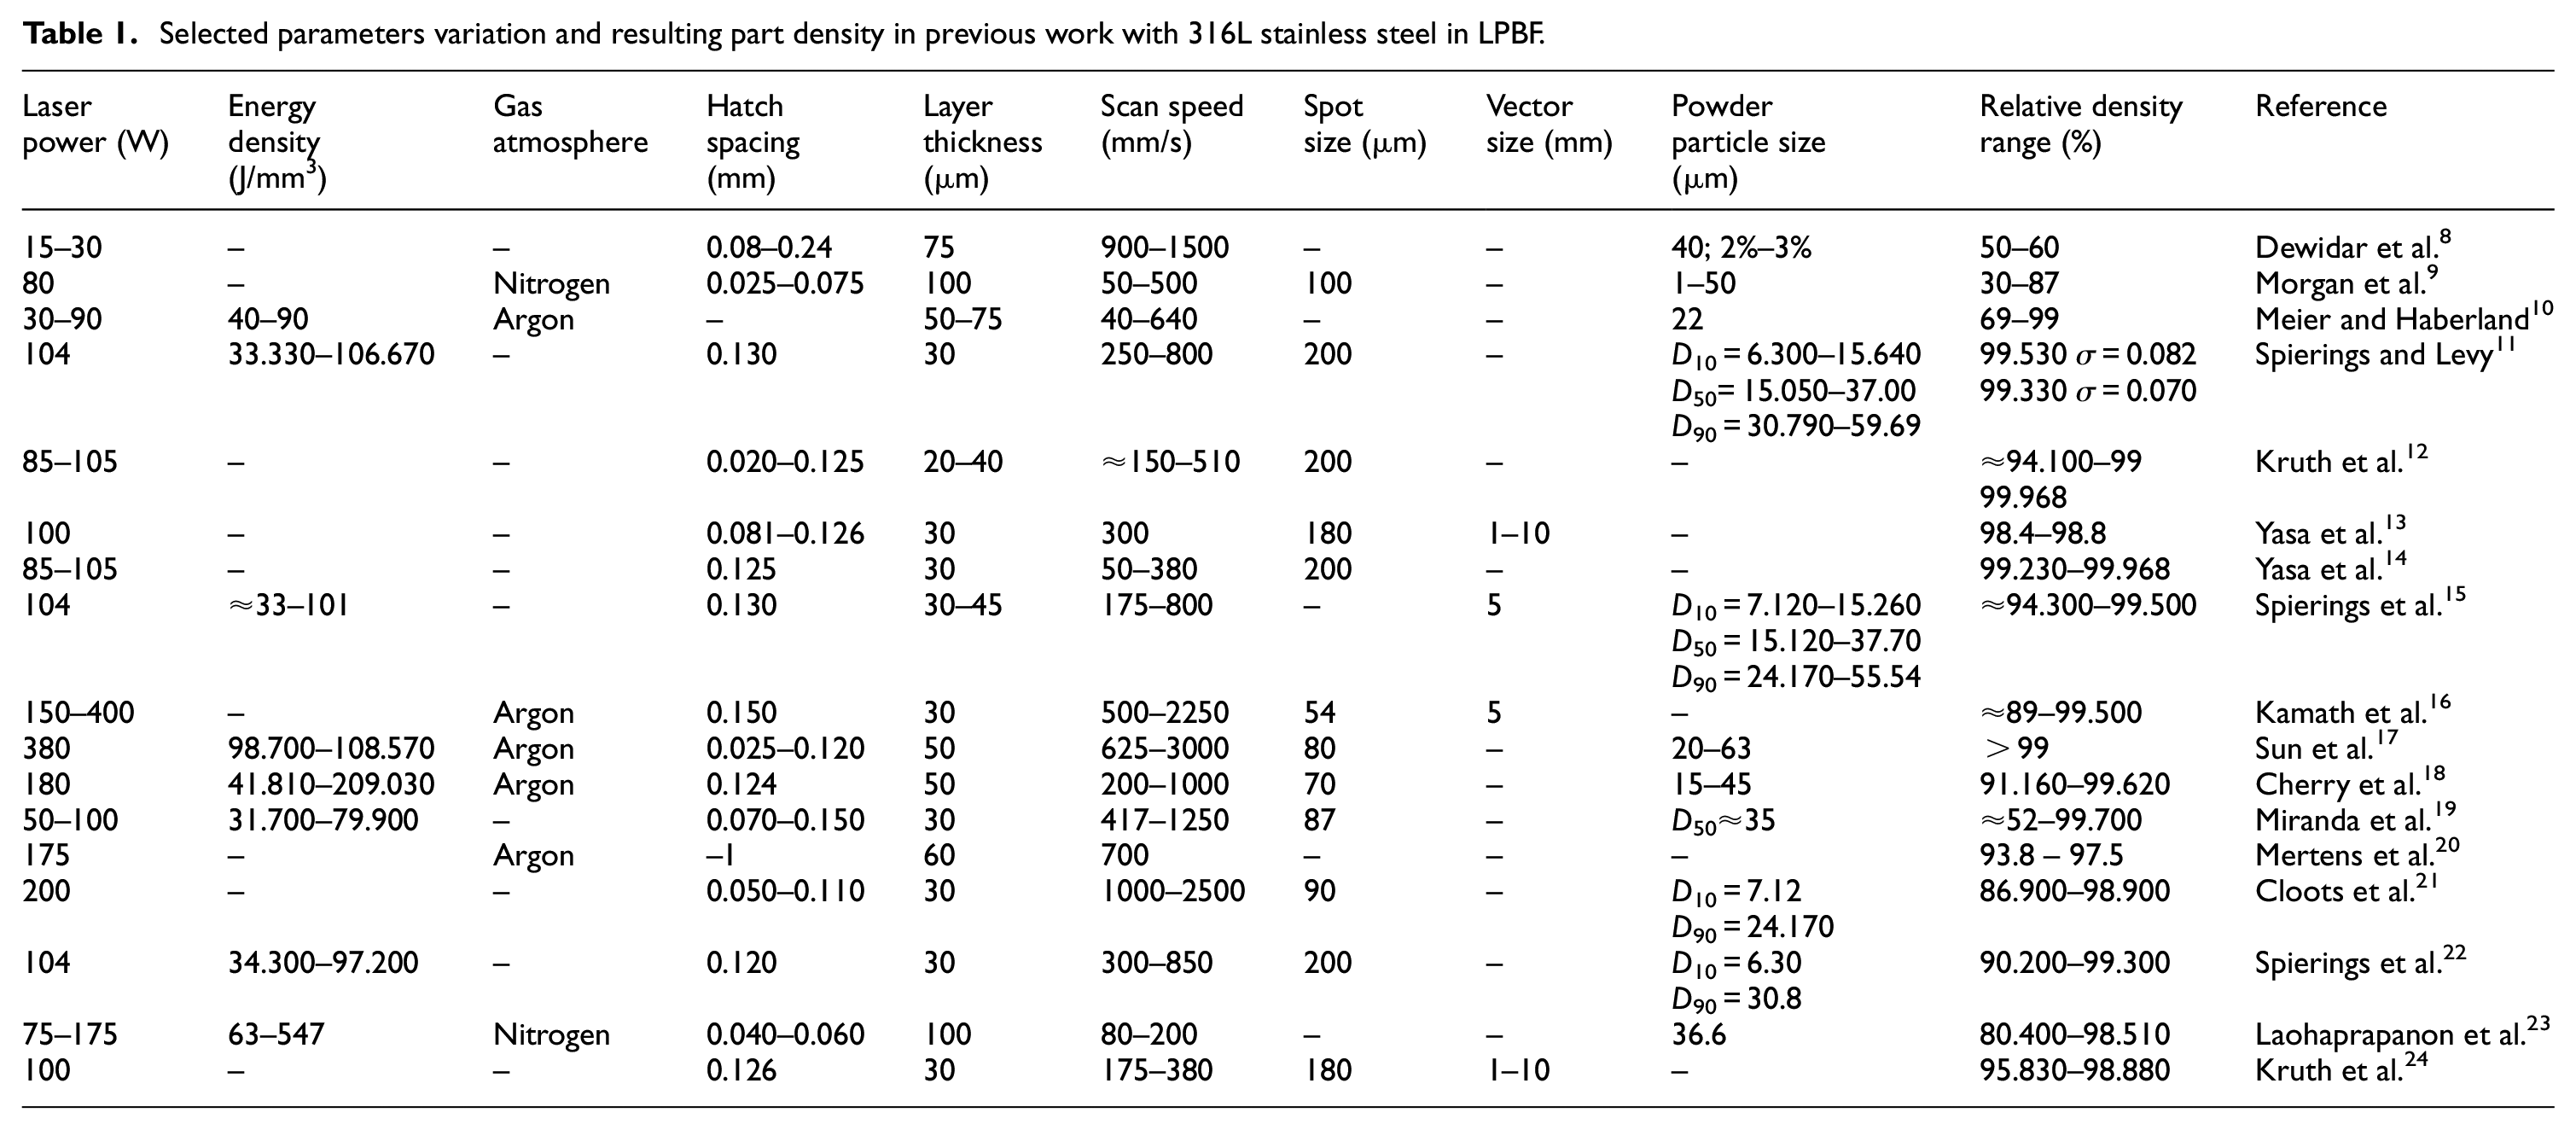
An analysis of the previous works, presented in Table 1, allows us to identify a lack of some results and conclusions related with the following topics:
There appears to be no clear consensus about the optimal range of processing parameters when near fully dense parts are required. There is a wide range for processing parameters available in literature, such as energy density (from ≈30 to 547 J/mm3), hatch spacing (from 0.02 to 1 mm) and scan speed (from 40 to 3000 mm/s), but the optimal values of each are not well defined.
Little to no information about the gas atmosphere or vector size is given in most of these studies. Moreover, the individual effect of each parameter on part density was not found in available literature.
The highest density values were obtained with post-processing by laser re-melting (up to ≈99.9%).12,14 For parts obtained without this time- and energy-consuming operation, is it possible to reach this level of part density only by optimizing the processing parameters?
Following these topics, this work considers the published results as a benchmark to select the optimal range of LPBF main processing parameters. According to Table 1, the energy density values available in the literature that allow us to produce parts with densities higher than 98% are presented in Figure 2.
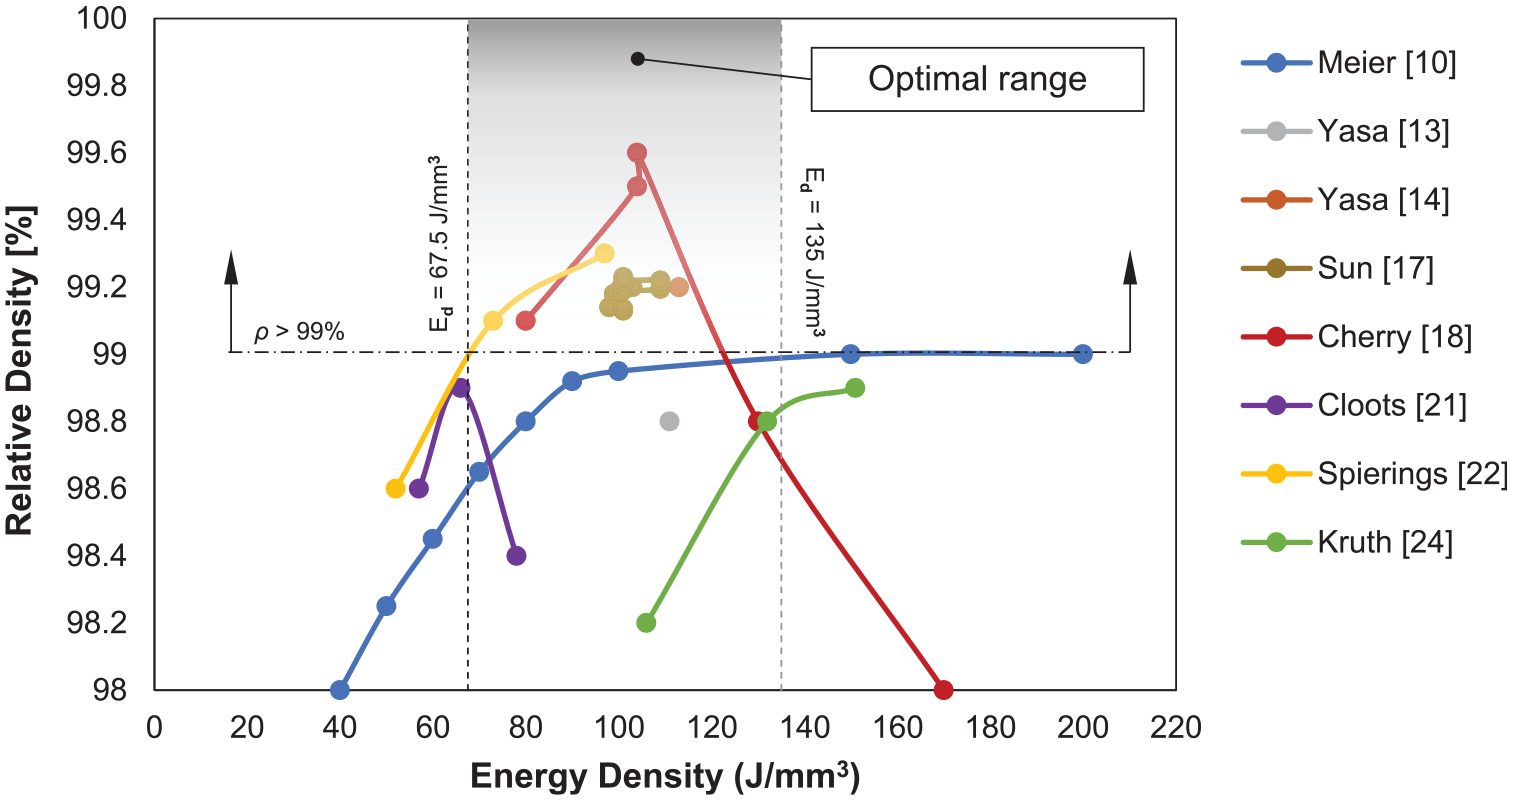
Results for part density as a function of energy density available in literature.
This work aims to optimize and narrow down the presented range of parameters for obtaining near fully dense parts without post-processing laser re-melting. The study will be focused on the individual effect of each analysed parameter on part density, to fulfil the lack of information on the available literature, such as the individual influence of the vector size and the inert gas atmosphere on part density.
Experimental work
Processing parameters
The experiments were performed on a customized LPBF machine with a 400-W fibre laser, focus diameter range of 60–600 µm and minimum layer thickness of 25 µm, under an Argon or Nitrogen atmosphere.
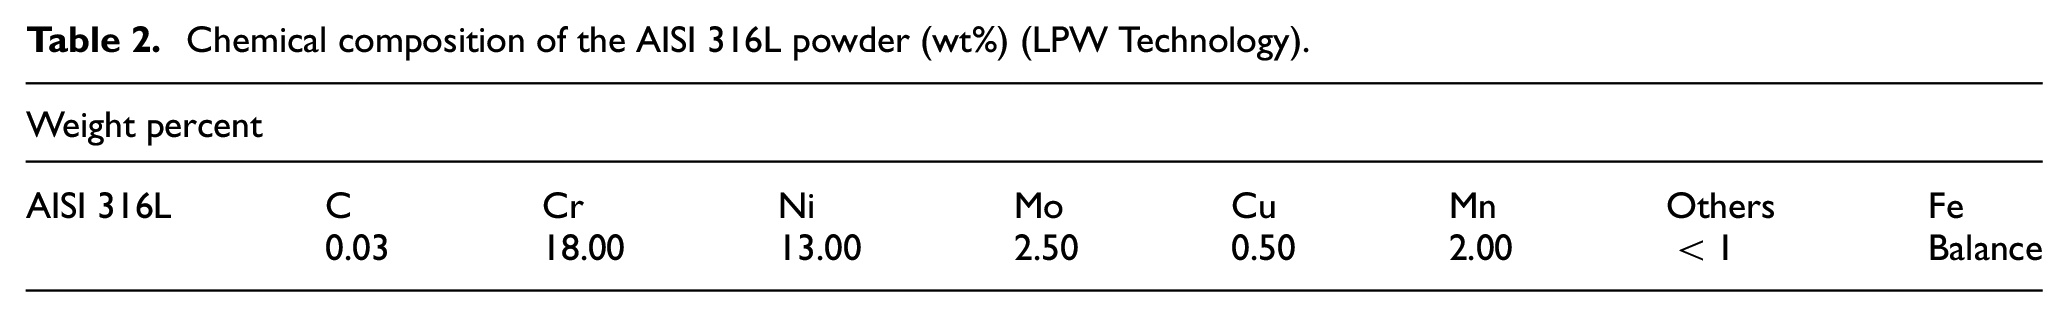
A gas atomized AISI 316L stainless steel powder supplied by LPW Technologies was used. The powder had a particle size distribution of D90 = 46 µm. The chemical composition of the as-built material, as specified by the material supplier LPW Technology, is depicted in Table 2.
Chemical composition of the AISI 316L powder (wt%) (LPW Technology).
To analyse the influence of processing parameters on density, cubic samples with 10-mm edge were produced (Figure 3(a)).
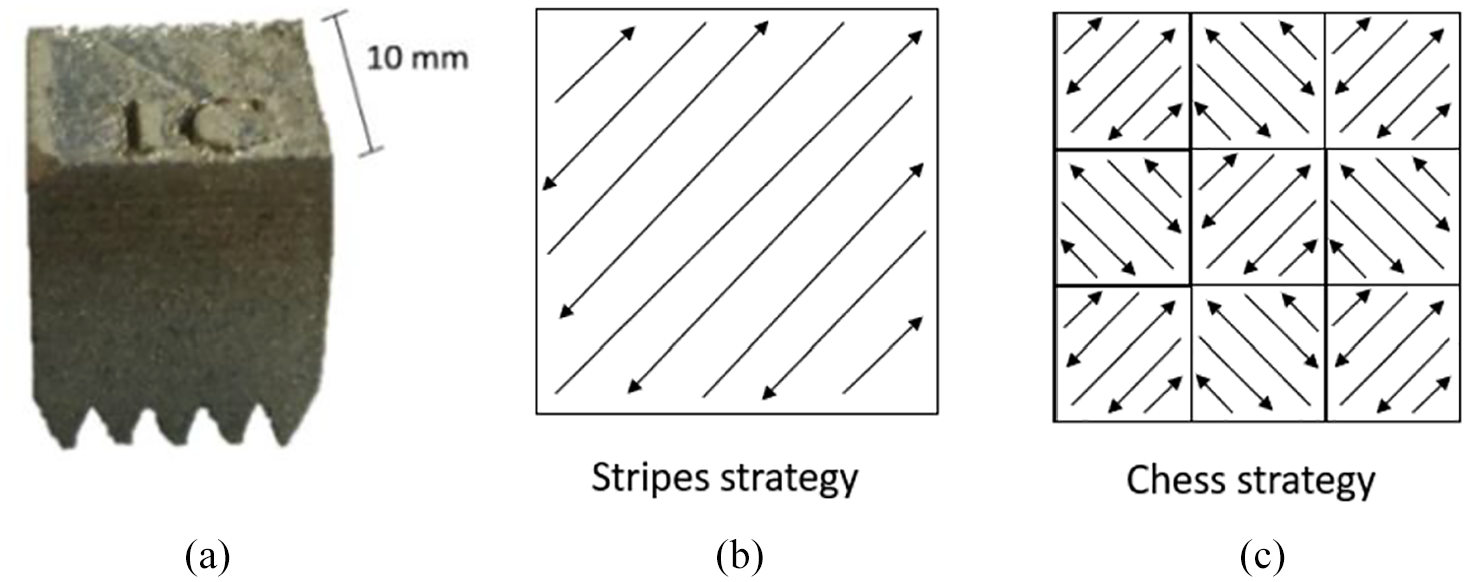
(a) LPBF-produced sample. Illustration of used scan strategies: (b) stripes and (c) chessboard.
Two different scan strategies were used: stripes and chessboard. In stripes scan strategy, the scan is made with all the scan vectors parallel to each other, as illustrated in Figure 3(b). Chessboard strategy consists in dividing the build area into several small squares, where each square has the scan vectors rotated by 90° relatively to the adjacent square (Figure 3(c)). In addition, in both scan strategies, the entire surface scan orientation was rotated by 67° after each layer, in order to avoid repeating the scan direction during the build of the samples.
The processing parameters utilized on this study were defined based on the energy density values available in literature that allow us to produce parts with densities higher than 99%. According to these data, the optimal range of energy densities considered in this work is defined between 67.5 and 135 J/mm3, shown within the grey area limited by the dashed lines in Figure 2. The remaining processing parameters values that were studied in this work were selected so that the energy density values for all built specimens fall within this range, according to equation (1).
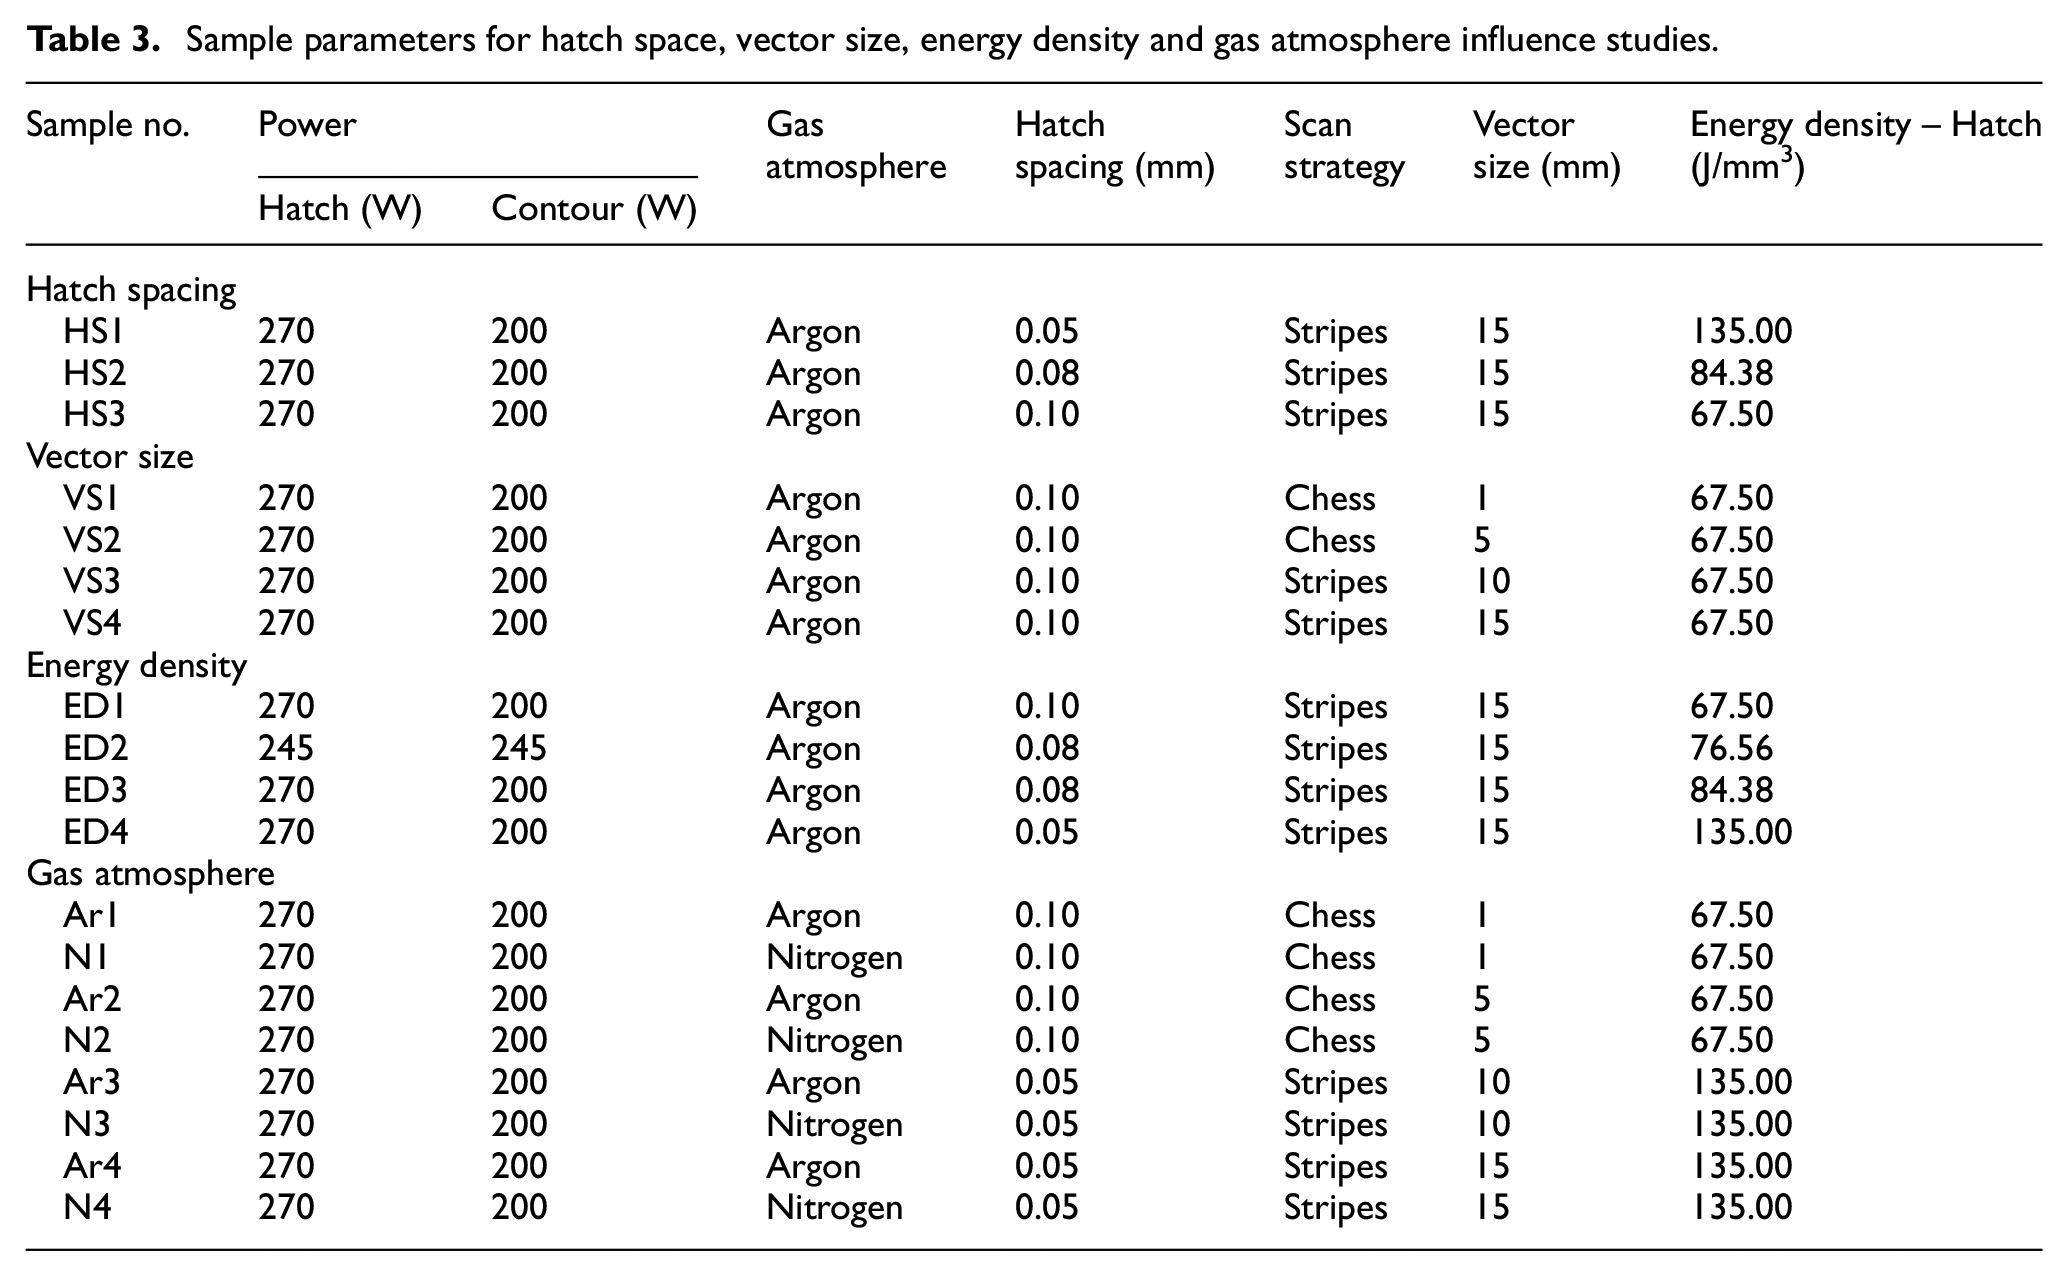
Table 3 shows the corresponding processing parameters for each built sample. The different built samples are grouped according to each individual parameter studied in this work. The processing parameters not mentioned in Table 3 were kept constant: spot size at 80 µm, layer thickness at 50 µm, and scan speed at 800 mm/s for the hatch and 600 mm/s for the contour. Beyond the parameters included in equation (1), the individual influence of the vector size and gas atmosphere on part density was also studied, where vector size was varied between 1 and 15 mm, and Argon and Nitrogen were used as inert gas atmosphere. For repeatability purposes, five sets of samples were produced for each built sample.
Sample parameters for hatch space, vector size, energy density and gas atmosphere influence studies.
Density measurements
Density measurements were performed by the Archimedean buoyancy principle and micrograph analysis. The measured densities were compared with a reference value for bulk 316L stainless steel of 8 g/cm3 and presented in relative density form. On both density measurement techniques, all specimens were cleaned and grinded with abrasive paper up to 2000 grit and later polished with 6- and 1-µm diamond suspensions. The specimens were measured without using etching.
Micrograph analysis
In order to evaluate the relative density of each specimen, there were, in total, four cross-sections prepared for micrographs: three horizontal cross-sections with a minimum distance of 1 mm and one vertical cross section (Figure 4). Ten micrographs of each cross section (2.5 × 2.5 mm2) were taken with 10× magnification and further processed in ImageJ software. 25 The number and area percentage of pores in each image was identified by adjusting the threshold values for the black-and-white micrographs. Five density measurements were performed in each micrograph, and the average value for each was considered.
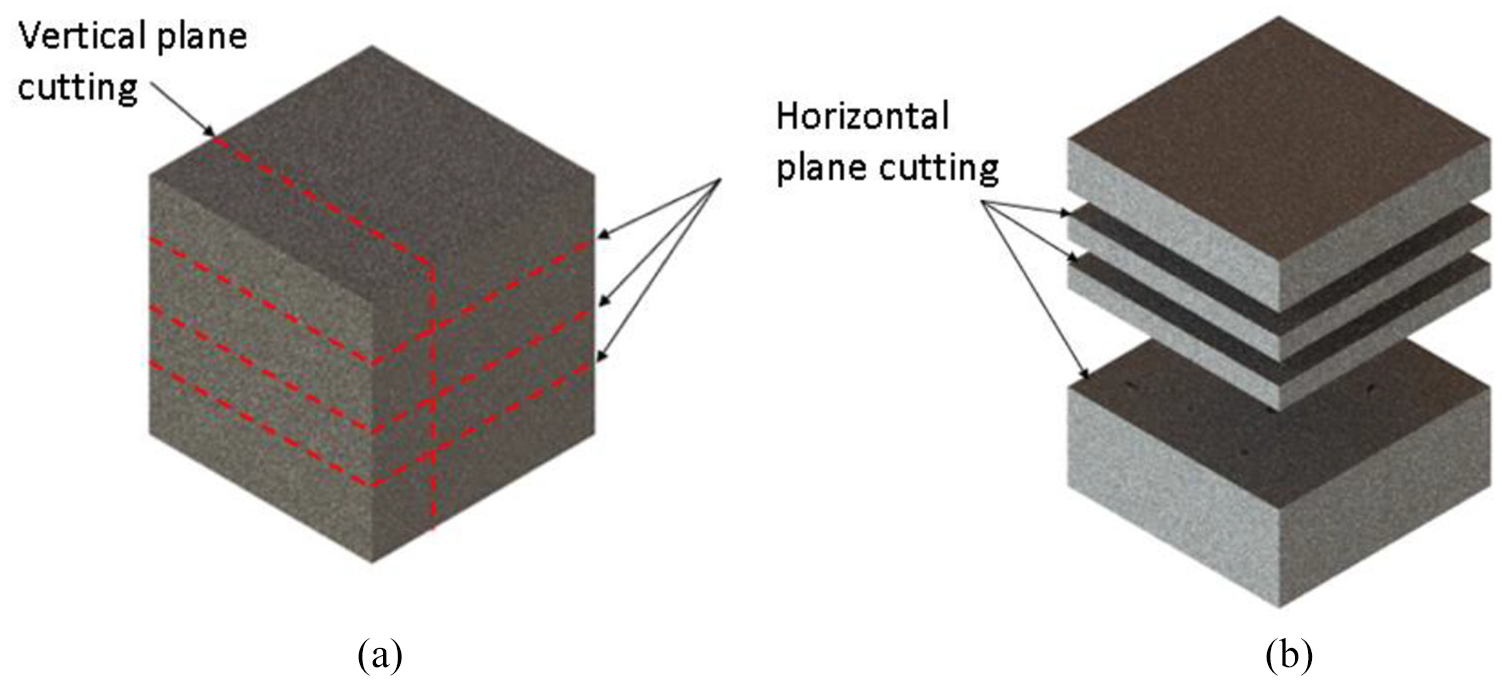
Schematic representation of cross sections for optical porosity measurements: (a) vertical and (b) horizontal.
Archimedes method
The Archimedes method consists in comparing the dry and immerse weight of the specimen to obtain its density according to equation (2), where
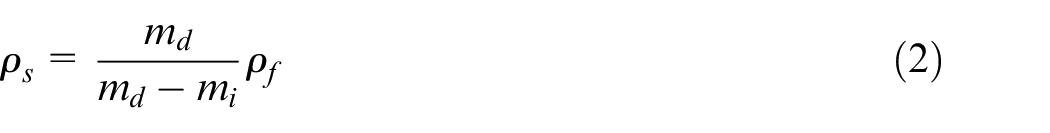
The measurements were performed in a Sartorius 410 BP 410S scale with maximum weight of 410 g and a resolution of 0.001 g, with an Archimedes measuring kit supplied by the manufacturer. All measurements were done using deionized water, and its temperature-dependence on the fluid density
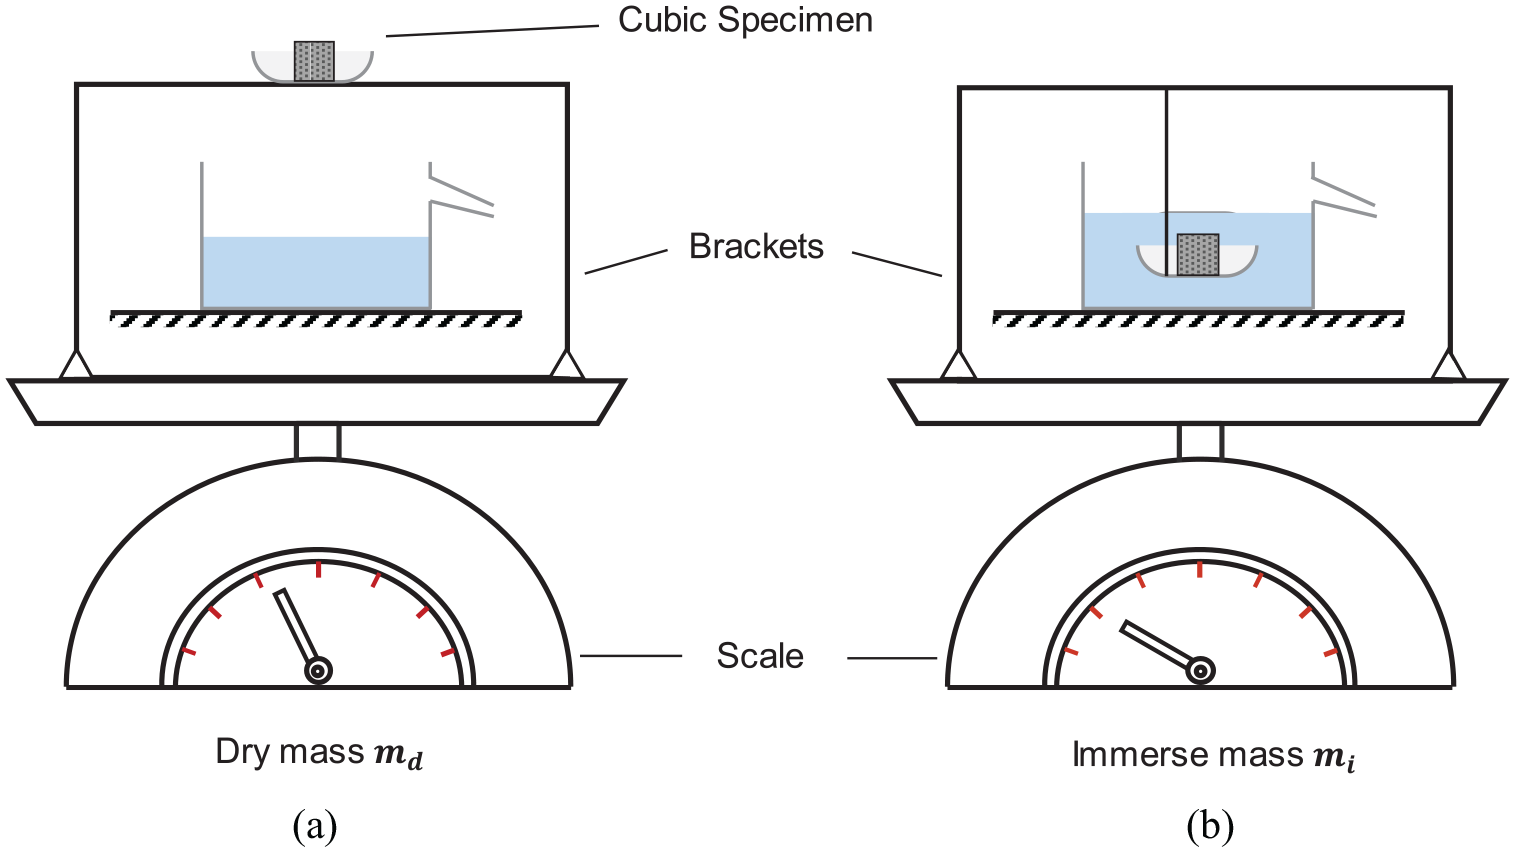
Schematic representation of the Archimedes method: (a) mass in air (dry mass) and (b) mass in the fluid (immerse mass).
Electrical conductivity
Electrical conductivity measurements were performed using an absolute helicoidally shielded eddy current (EC) probe with 3-mm diameter, operating in bridge mode with an Olympus Nortec 500C (Figure 6(a)). The electrical conductivity was calculated from the real and imaginary part of the electrical impedance of the probe. The test was performed in a XY moving table with a maximum resolution of 0.043 mm which allowed the acquisition of a surface mapping (Figure 6(b)). The relative magnetic permeability of the stainless steel 316L is approximately 1.0 and the electrical conductivity is 2.3% IACS, leading to a calculated penetration depth of 3 mm. The measurement of the electrical conductivity was performed on horizontal sections of the samples (perpendicular to the build direction).
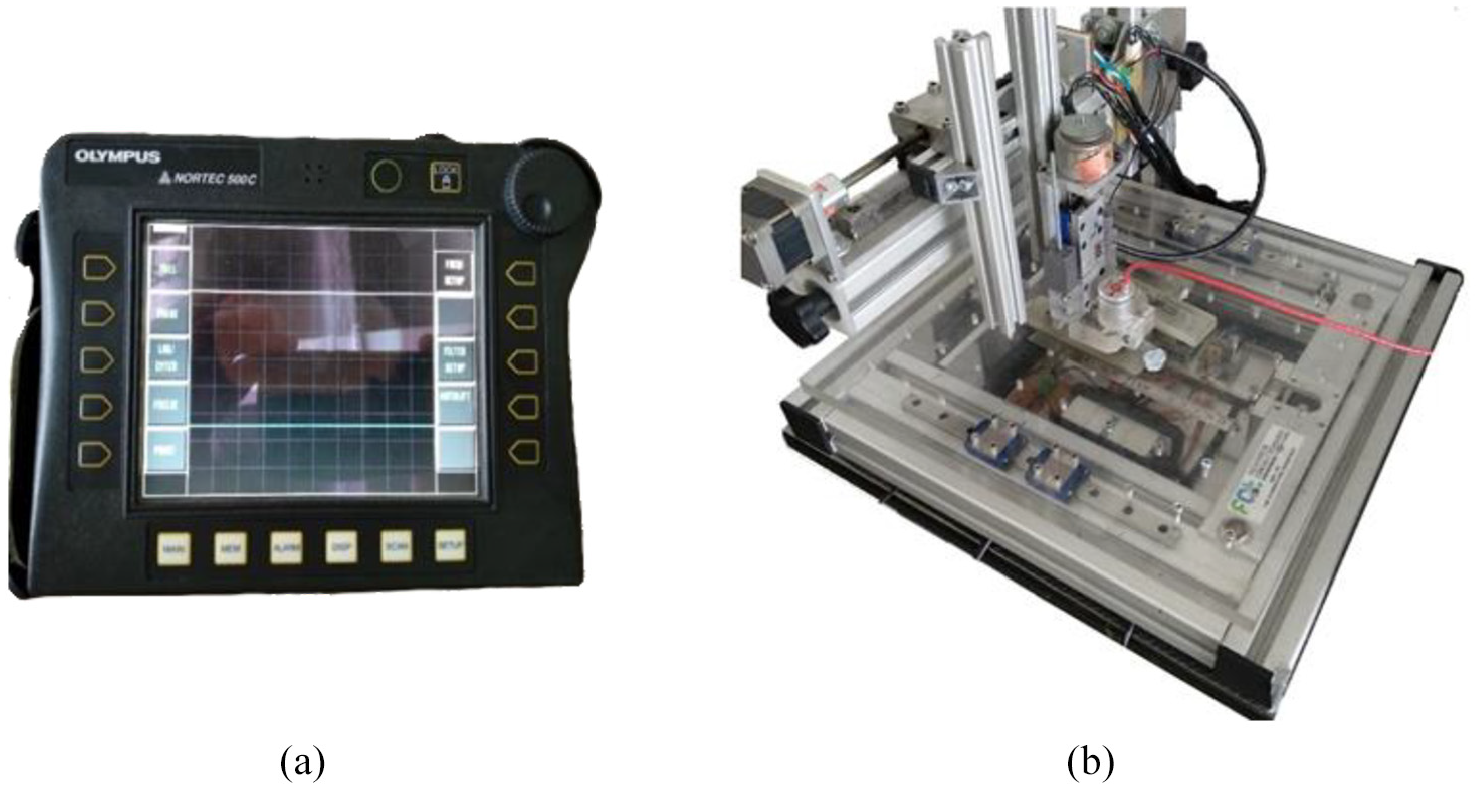
Experimental setup of the electrical conductivity measurements: (a) Eddy current flaw detector Olympus Nortec 500C and (b) XY moving table.
Microhardness
Vickers microhardness measurements were performed along a vertical line in the centre of the sample face with a displacement of 0.5 mm between consecutive indentations in order to estimate the mechanical strength of all prepared samples (Figure 7). The equipment used was a Mitutoyo HM-112 Vickers hardness tester with an applied load of 4.905 N for 10 s.
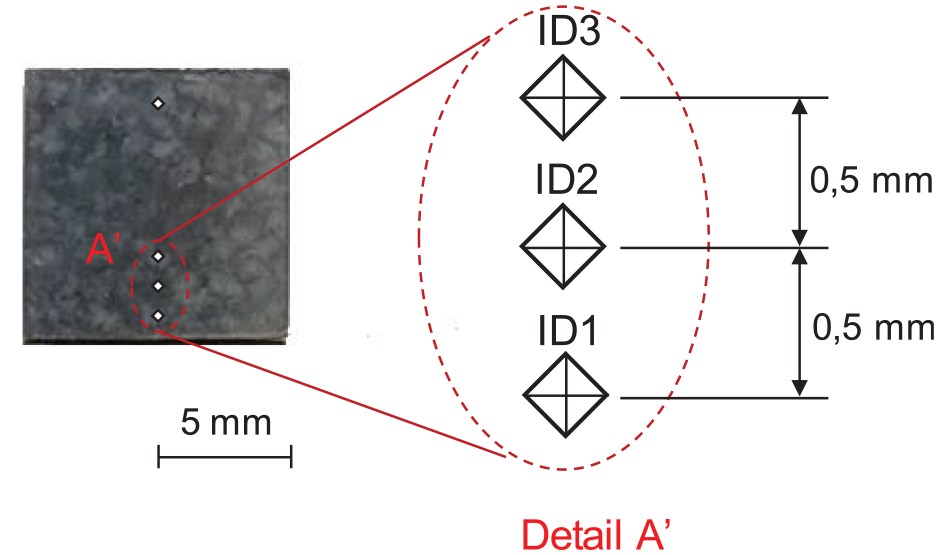
Schematic representation of the indentations performed in the cubic samples for Vickers microhardness measurements.
Results and discussion
Density measurements
The measured relative densities for the specimens are presented according to each of the different sets of processing parameters presented in Table 3.
Hatch spacing
The influence of hatch spacing variation in part density is depicted in Figure 8, where it can be seen that as hatch space increases, density tends to decrease. The highest values for density (99.655% with Archimedes method and 99.889% with micrograph analysis) were obtained at the minimum hatch spacing studied of 0.05 mm.
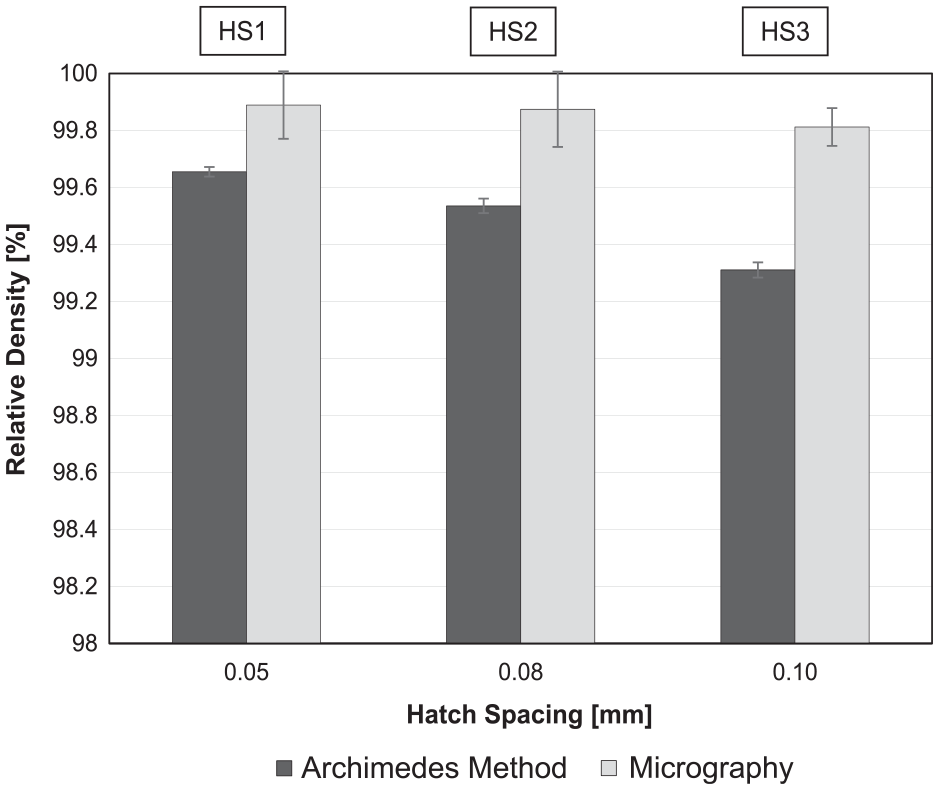
Relative density obtained with Archimedes and micrograph analysis as a function of hatch spacing (vector size of 15 mm).
The described influence of hatch spacing in density is coherent with previous work, since high hatch spacing values will result in insufficient overlapping of consecutive scan tracks, leading to unmolten areas and, consequently, lower densities, as also observed by Yasa et al. 13 This effect can be observed on the micrographs of samples HS1, HS2 and HS3 presented in Figure 9. The pores become more irregular and unmolten areas increase as hatch spacing increases.
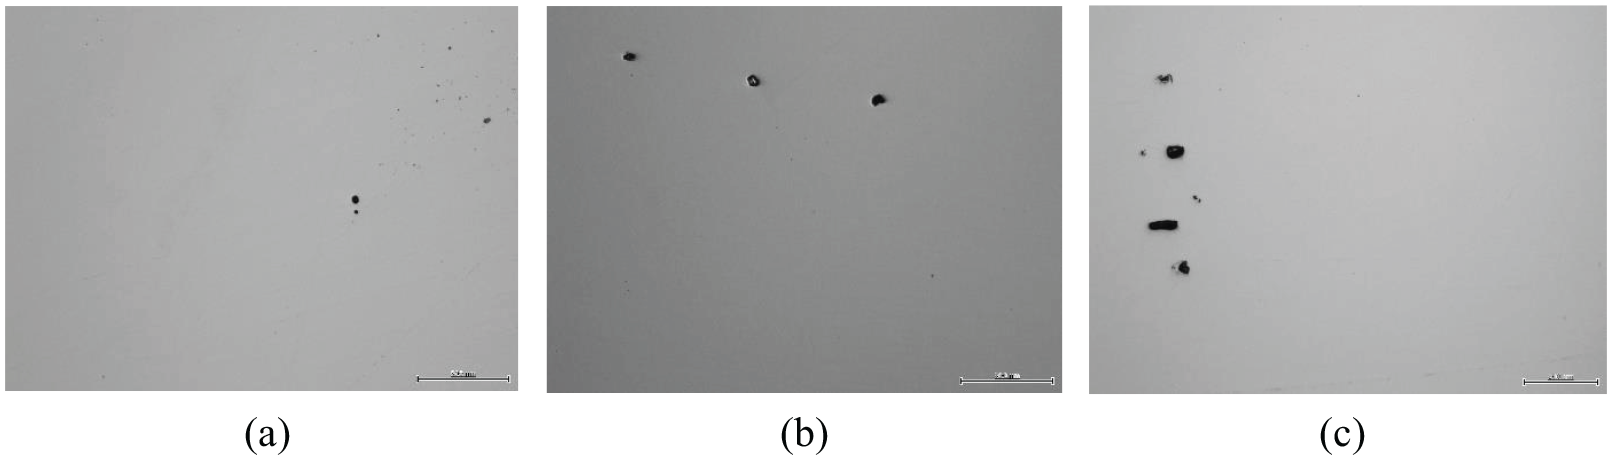
Porosity with hatch spacing variation: (a) hatch spacing 0.05 mm (sample HS1), (b) hatch spacing of 0.08 mm (sample HS2) and (c) hatch spacing of 0.1 mm (sample HS3).
Vector size
Density appears to be negatively influenced when increasing the vector size, as it is shown in Figure 10. The maximum density in this analysis (99.48% with Archimedes method and 99.92% with micrograph analysis) corresponds to a vector size of 1 mm, the minimum vector size studied.
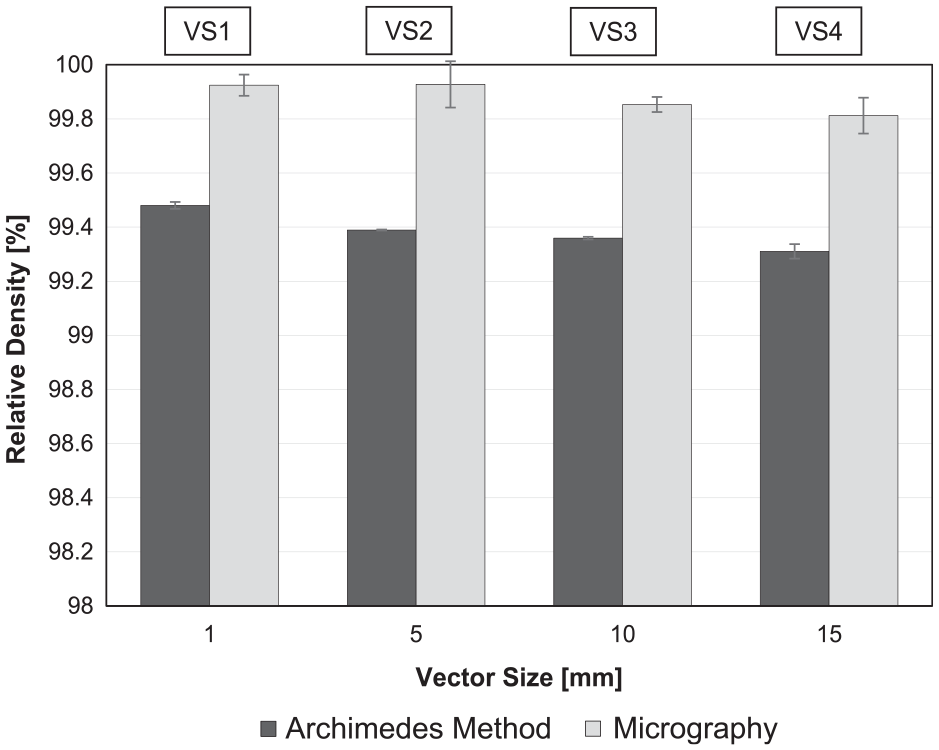
Relative density obtained with Archimedes and micrograph analysis as a function of vector size (hatch spacing of 0.1 mm).
Even though the effect of vector size on part density has not been extensively studied in previous research, one possible explanation could be that for a longer vector size, porosity tends to increase due to lack of fusion in the overlapping zone between consecutive vectors, as stated by Meiners. 26 The results corroborate Meiners’s hypothesis, showing that an increase in vector size corresponds to a higher number of aligned pores at the vector overlapping zone, as presented in Figure 11.
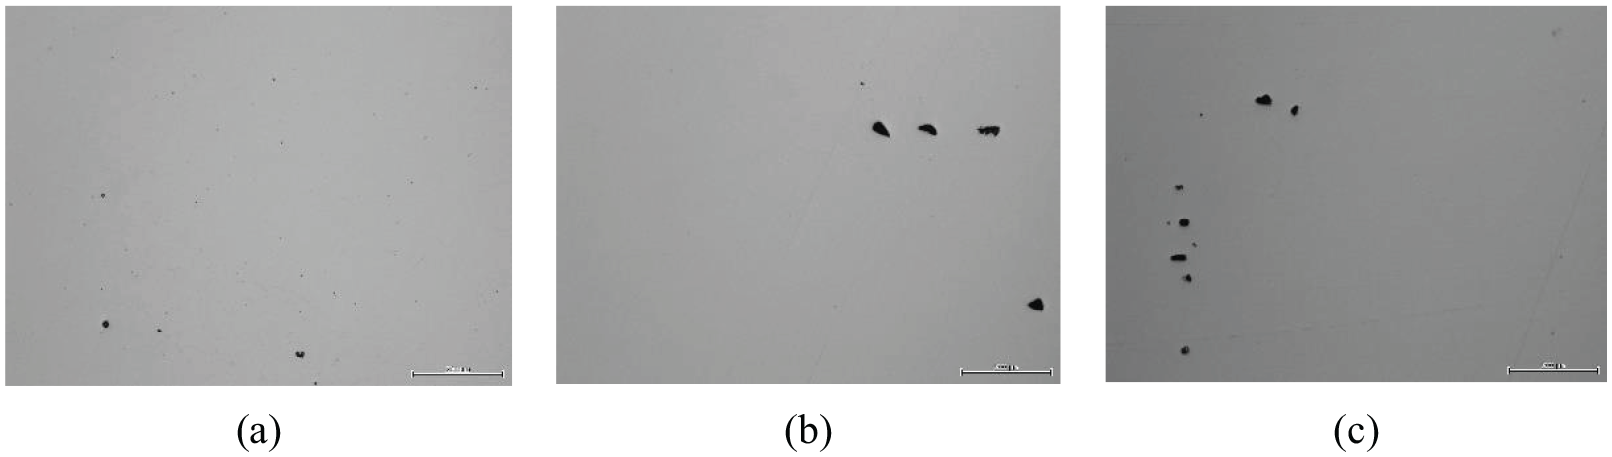
Porosity with vector size variation: (a) vector size of 1 mm (sample VS1), (b) vector size of 5 mm (sample VS2) and (c) vector size of 15 mm (sample VS4).
Energy density
Figure 12 shows the variation of the density with the increase of energy density, where, within the evaluated parameters, the optimal value appears to be 76.56 J/mm3 with densities of 99.655% and 99.889% for the Archimedes method and micrograph analysis, respectively.
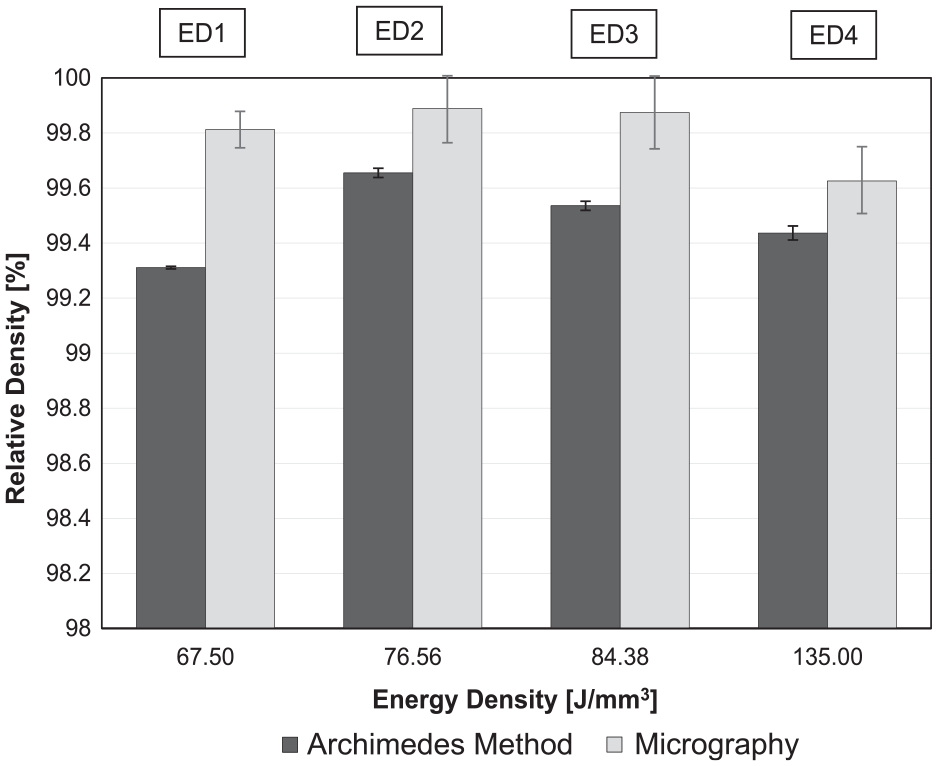
Relative density variation with energy density increase, Archimedes and micrograph analysis (constant vector size of 15 mm with variable laser power and hatch spacing).
The non-linear pattern observed in density variation with energy density increase is similar to the one previously discussed by Cherry et al. 18 Low energy density values are associated to higher porosities due to an increase of unmolten areas within the layers. An increase in energy density improves melting and the flow of the molten material, thus filling the pores and increasing density. Nonetheless, if the energy density is too high, part density decreases due to vaporization of low melting point elements. For instance, traces of oxygen and carbon may react due to the high temperatures of the process, resulting in the formation of CO and CO2 gases which can remain entrapped and form pores.
Among the previous work reviewed within the scope of this article, there does not seem to be a consensus about the most appropriate method for density measurements. For instance, Spiering and Levy 11 recommend the Archimedes method, using water or acetone, to measure density of the parts, whereas Yasa et al. 13 refer that the Archimedes method may not be the best method to measure the density of LPBF parts due to the possible presence of unmolten powder particles within the pores. Results obtained show lower densities using the Archimedes method, comparatively to the micrograph analysis. Moreover, as it can be seen in all density measurements, the micrograph analysis tends to exhibit a higher standard deviation. This is due to this technique not providing measurements of the whole part, but rather from selected sections, which might lead to analysing particularly good, or bad, zones of the samples. This phenomenon can be seen in Figure 13 where, for the same sample, different micrographs display porosities of 2.5% and 0.008%, and the total average porosity measured for the part was 0.2%.
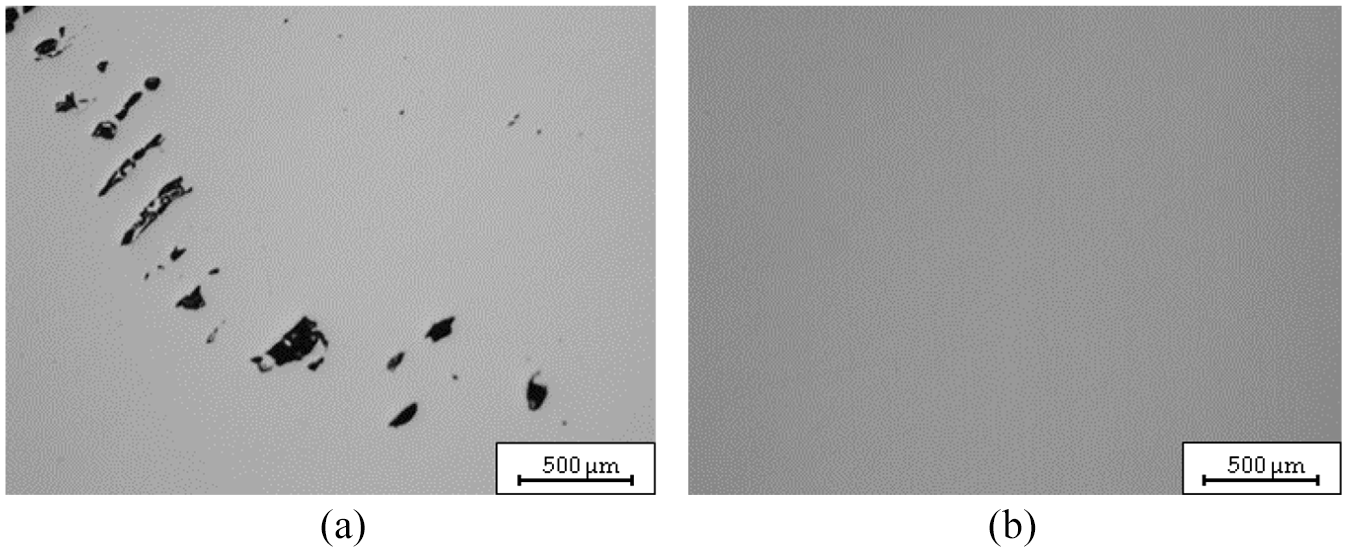
Cross sections of sample ED1: (a) porosity 2.5% and (b) porosity 0.008%.
Argon and Nitrogen atmospheres
Considering the previously mentioned influence of Nitrogen in the porosity of laser welds, some specimens were built in a Nitrogen atmosphere in order to compare them with identical ones manufactured under an Argon atmosphere, as shown in Table 3. Considering the previously discussed results, all the presented densities for this analysis were obtained through the Archimedes method. As it can be seen in Figure 14, the Nitrogen atmosphere–manufactured samples have higher density than the samples produced under an Argon atmosphere. The previously obtained correlations between part density and processing parameters for Argon samples are also verified, that is, increasing vector size or hatch spacing decreases the density of the samples.
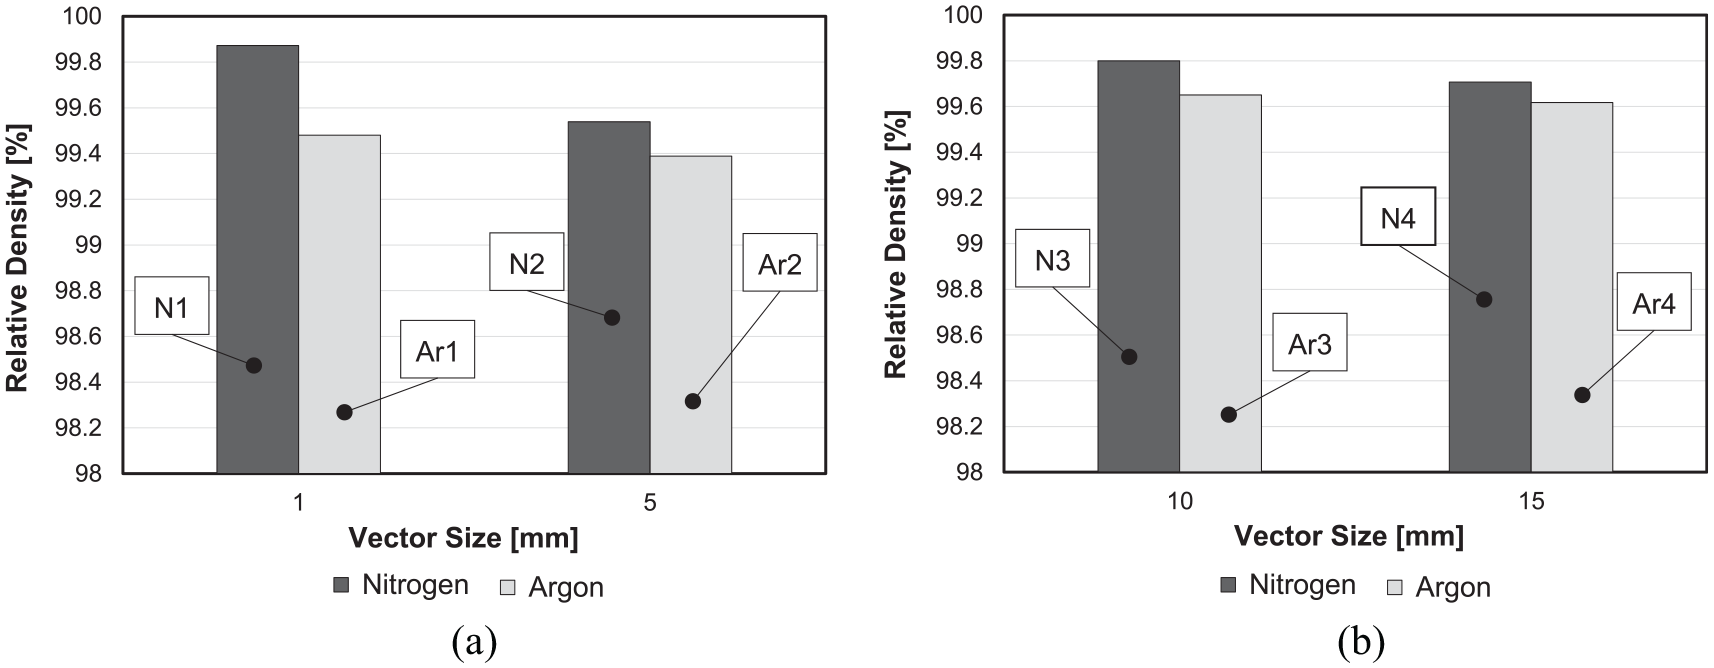
Relative density versus vector size for (a) Argon and Nitrogen (hatch spacing of 0.1 mm) and (b) Argon and Nitrogen (hatch spacing of 0.05 mm) using Archimedes method.
Though it is not clear why the porosity is reduced by the presence of a Nitrogen atmosphere, Elmer et al. 27 provide a possible explanation for this effect in laser welding. According to the authors, Nitrogen can react with the chromium in the stainless steel to form chromium nitrides, unlike Argon which is an inert gas. This means that the only way to remove Argon bubbles from the weld is by buoyancy or convective motion of the melt pool, whereas Nitrogen, after forming chromium nitrides, can dissolve into the molten material and reduce porosity. This mechanism will be effective as long as the solubility limit of the stainless steel is not achieved. These results are in line with the conclusions of the work performed by Katayama et al., 28 where porosity was hardly formed using Nitrogen gas when compared with Argon and Helium gases for laser welding of 304 stainless steel.
Microhardness measurements
To evaluate the influence of varying the processing parameters on the material hardness, tests on five samples of each energy densities were performed and the results are shown in Figure 15.
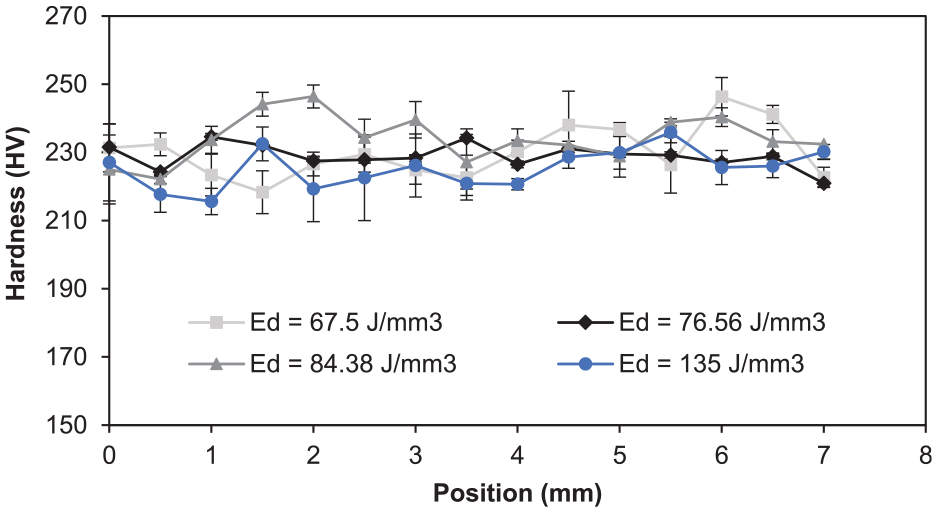
Hardness measurements at different points of the samples with different energy densities.
The highest average hardness was obtained for 84.38 J/mm3 at 234.104 HV, and the lowest for 135 J/mm3 at 225.228 HV. For 67.50 and 76.56 J/mm3, the values were 230.006 and 228.887 HV, respectively. The total average hardness was of 229.556 HV, which is above the hardness range provided by the powder supplier, for the as-built material. Considering the obtained results, it can be inferred that the values of energy density show no significant influence on part hardness because the porosity is relatively small (~0.3%), as demonstrated by Cherry et al. 18
Electrical conductivity measurements
The characterization of the samples was made by means of three-dimensional analysis, as shown in Figure 16. Figure 16(a) shows a continuous profile of electrical conductivity, evidencing microstructural homogeneity and absence of defects. However, an irregular profile is observed in Figure 16(b) which indicates the presence of defects, particularly, the presence of porosities. These readings further validate the results shown in Figure 12, where the highest material density was obtained for an energy density of 75.56 J/mm3.
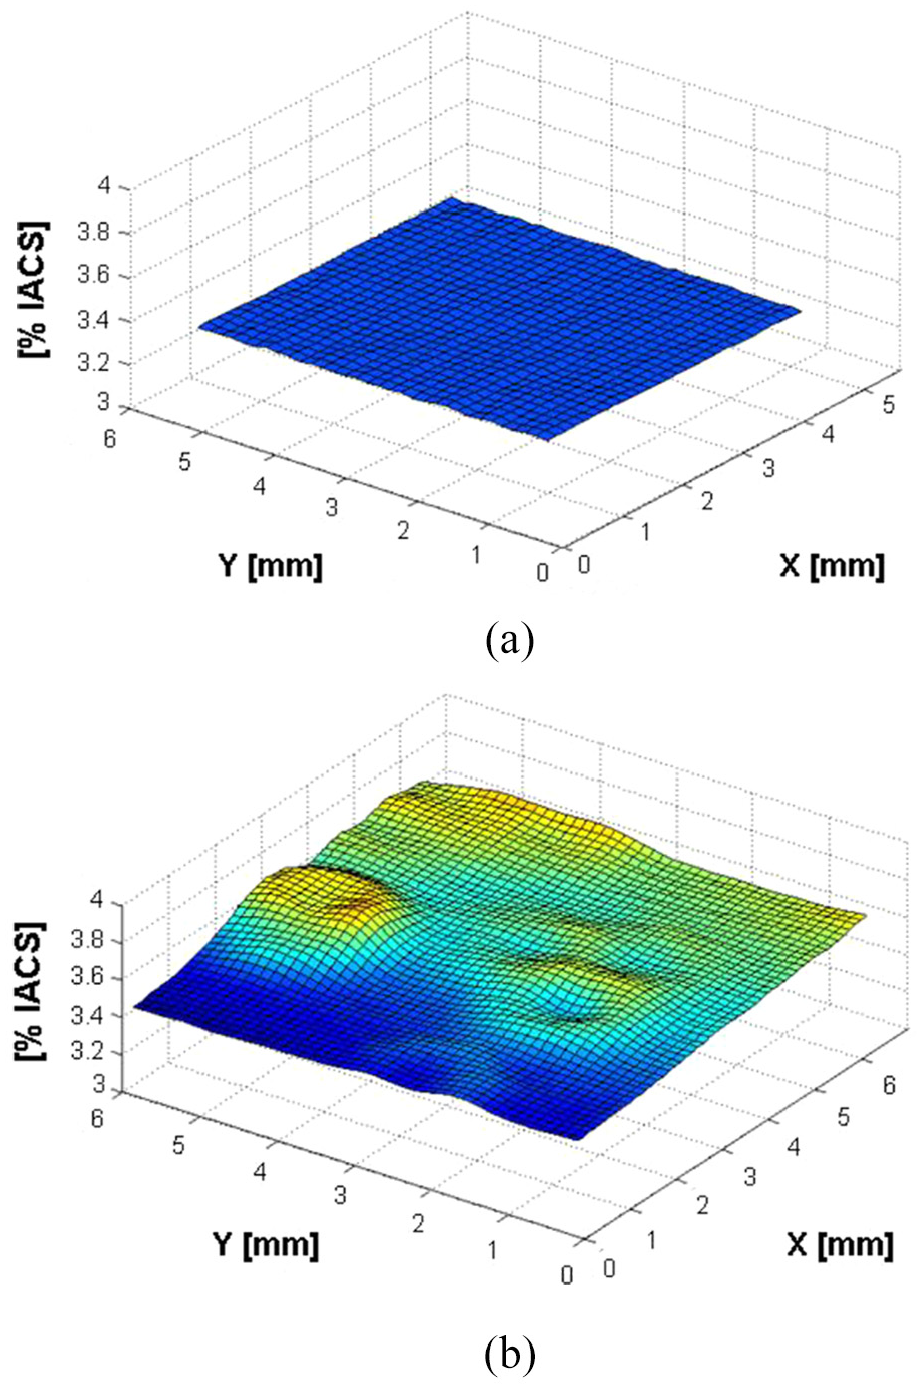
Electrical conductivity profiles: (a) energy density 75.56 J/mm3 and (b) energy density 135.00 J/mm3.
Conclusion
The selection of the optimal set of processing parameters allows us to produce parts with density above 99%, which is a positive indicator towards the ultimate goal of zero-defect manufacturing in LPBF. The analysis performed on all samples produced by the customized LPBF machine shows relative densities above 99%. The best results with an Argon atmosphere were obtained for energy density of 76.56 J/mm3 with a relative density of 99.655%, hatch spacing of 0.05 mm with relative density of 99.655% and vector size of 1 mm with relative density at 99.480%, all of each measured with the Archimedes method. Results also show lower densities for the Archimedes method measurements when compared with micrograph analysis. However, the Archimedes and micrograph techniques utilized to measure the porosity present the same tendencies of results for each studied processing parameter.
Considering the high standard deviation, the needed resources and the destructive nature of the micrograph analysis, the Archimedes method appears to be the better option for density measurements, unless the shape and exact location of the pores is of interest, as already stated by Spierings and Levy. 11
The obtained results allowed us to narrow down the range of processing parameters available on literature for producing near fully dense parts using LPBF. The individual effect of energy density and hatch spacing on part density, previously discussed by Cherry et al. 18 and Yasa et al. 13 respectively, is in line with the results obtained on this work. Since the parameters used in this work are placed within an optimal range, the density variation for the different sets of tests is small (results are all above 99%); nevertheless, the results obtained for the two density measurement techniques show identical tendencies for each analysed parameter.
The study of the individual influence of vector size shows that higher values of this parameter have a negative effect on the density of the parts (≈99.3% for a vector size of 15 mm, which was the highest value used in this work).
Regarding the inert gas atmosphere, a Nitrogen atmosphere allows us to build specimens with lower porosity comparatively to an Argon atmosphere using the same processing parameters. A maximum relative density of 99.87% was achieved, showing that it is possible to produce near fully dense parts by LPBF without the use of post-processing by laser re-melting.
Nevertheless, authors believe that further research regarding a more detailed effect of gas atmosphere in surface quality and mechanical properties is of interest. Moreover, considering the wide variety of metals already used in AM technologies, this future study would be of increased interest if performed with different powder metals in order to achieve fully dense parts.
Footnotes
Acknowledgements
The authors would like to acknowledge the technical support of Adira, MCG and INEGI.
Declaration of conflicting interests
The author(s) declared no potential conflicts of interest with respect to the research, authorship, and/or publication of this article.
Funding
The author(s) disclosed receipt of the following financial support for the research, authorship, and/or publication of this article: This work was developed as part of the research project ‘Programa PT2020, SLM-XL–FABRICO ATRAVÉS DE TECNOLOGIAS LASER, LISBOA-01-0247-FEDER-003346’, funded by ‘Fundo Europeu de Desenvolvimento Regional’ (‘FEDER’) through ‘Programa Operacional Regional de Lisboa’ (‘POR Lisboa 2020’) and ‘Programa Operacional Competitividade e Internacionalização’. The authors would also like to thank the support of Fundação para a Ciência e a Tecnologia of Portugal (FCT - MCTES), IDMEC under LAETA-UIDB/50022/2020 and UNIDEMI under UIDB/00667/2020.