
Abstract
Because of the stochastic nature of production systems, it is necessary to first build an uncertainty model for subsequent real applications. Moreover, process parameter planning, quality design, and production inventory management are interdependent elements. In this research, a computer simulation model via computer-aided engineering (CAE) was developed to determine the optimal process parameters, lot size, and back order intervals for an integrated process design and inventory management system with simultaneous quality and cost considerations. Based on the estimated process time and costs obtained using CAE, the derived production rate and unit cost were then used for production inventory applications. In consideration of the uncertainty factor, the response surface method (RSM) was employed to analyze the output, namely the total costs incurred in employing the proposed approach, as well as the inputs, which include the cutting parameters, production quantity, and back order intervals. After the RSM was used to obtain the response functions, which represent the output of the collective interests, the mathematical programming (MP) was formulated based on the response functions to determine the optimal process parameters, process quality levels, production order quantities, and back order intervals. The total cost per set time unit was minimized by determining the required quality level, process parameter values, Economic Production Quantity (EPQ), and back order intervals. A cutting example was chosen to demonstrate the proposed approach. Two cases were used for comparison: the Integrated Case (the proposed approach herein) and the Disintegrated Case.
Introduction
When a high quality product on the market has a low price, it is in a superior competitive state. The first step of developing a quality product is to understand customers’ needs. “Process design for quality” has become a popular practice in the business world, as it makes the product customer-driven and incorporates customers’ needs into in the production process. In the entire product process, production-inventory management, which involves a great deal of capital and influences the delivery time of goods, is often overlooked. As is known, quality levels and production costs are both directly related to product unit cost, which is further linked to the production quantity decision during inventory management. Paying additional attention to only process and quality design is not enough to ensure the economical attributes and quality of the product. Therefore, it is necessary to incorporate inventory management into the process and quality design.1–4 For the purpose of demonstration in this research, machining operation with controllable process parameters, processing times, unit cost, and quality levels were taken to characterize the process and quality design. Economic Production Quantity (EPQ) with back order problems for inventory management was chosen as an example.
Well-designed process parameters can appreciably influence production costs and quality levels. Cutting operations, for example, have a major impact on the production of economically sustainable and quality goods in most industrial sectors. In order to minimize the cost of each produced workpiece, process parameter determination must be able to reduce production time and cost to the lowest-levels.5–12 Most of these studies focus solely on production cost or process time minimization during the manufacturing process. However, production cost, process time, and quality level simultaneously influence product unit cost, successively impacting inventory carrying cost. These effects further determine production quantity, which then become turn-back influences on the determination of process parameters and quality levels related to process design. The turn-back influences mainly result from invalid process planning based on an unsound production quantity resulting from the lack of consideration of successive impacts. Under these successive or chain relationships, the cumulative influences become even greater under the combined impact of uncertain inventory cost and demand rate, which may arise in later production inventory management, with uncertain production cost and time estimation unconsidered in the earlier process design. Thus, the assumptions of invariable costs and time in traditional studies on the lot sizing problem are no longer valid under the chain influences. 13 In this regard, the proposed approach takes these chain relationships into account by integrating product/process design and production inventory management under uncertain impacts.
Due to the uncertainties that arise during the product/process design and inventory management, robust modeling for the process design and production quantity ordering should be considered simultaneously during the application. The uncertainties involved in the inventory system result primarily from variations in unit cost, demand rate, production rate, inventory carrying rate, ordering cost, and backorder cost.14–19 The variations in unit cost and production rate stem directly or indirectly from uncertainties that arise during the process, such as changes in the raw material cost, labor cost, overhead cost, set-up time, machine cost, replacement cost, product-process parameter determination, quality level establishment, and other production-related aspects. One of the robust methods used when confronting uncertainty is statistical analysis within the experimental design approach. With uncertainty as a consideration, this experimental design approach aims to build a functional connection between input and output, as well as to determine the factors that extensively affect the stability of output, such as quality and cost of a product/process, and production quantity of inventory management. The functions identified in the previous step are then used for further applications during system analysis and optimization. Using these common aspects, a few researchers have used regression analysis to form a functional relationship that can then be used to decide the best values of independent variables in the system of interest. Jacobs and Wagner 20 employ regression analysis for uncertain demand so that inventory costs can be lowered. Arreola-Risa et al. 21 use a simulation technique to build a regression equation for stochastic production-inventory applications. The best values of decision variables are determined on the basis of regression equations. The present study adopted an experimental design approach called response surface methodology (RSM) to regress inputs and outputs under uncertain impacts.22–24 RSM can use a factor design to obtain robust and effective information with less experiment cost and time. The interaction between factors is studied via analysis and adaptation patterns, and the extent to which multiple factors affect the response variables is discussed. At the same time, a mathematical model of the relationship between the simulated independent variables and the response value can be obtained, which significantly reduces the number of experiments and time. The inputs are the controllable variables, such as process parameters, production order quantity, and backorder periods, which all need to be determined. The outputs can be both the unit cost and total cost. The outputs are dependent on process parameters, material cost, setup cost, and tool cost. The total cost includes inventory cost, setup cost, and backorder cost. The uncertain impacts are considered as the noises occurring during the statistical analysis. The noises influencing tool replacement costs include: labor cost, overhead cost, set-up time, tool cost, and tool changing time. Other noise, such as raw material cost, also influences unit cost. The noises affecting production order quantity and backorder periods include: ordering cost, production rate, carrying rate, set-up cost, demand rate, and backorder cost.
It is normally difficult to determine precise unit cost in the early stage of the process and product design. However, owing to current developments in computer-aided design (CAD) software and in cooperation with robust design experiments for statistical analysis, design engineers are able to study unit cost-related process design problems in advance. 25 In this study, a cutting example was chosen to demonstrate the proposed approach, using computer-aided engineering (CAE) software such as CATIA (Computer Aided Three-dimensional Interactive Application) and CCS (Computer Cutting Data Service). Because of the convenience of unit cost estimation with CAE software, an extension with estimated unit cost, which includes the production-inventory system as an integrated system, is now possible. In this integrated system, input includes the cutting parameters from the process design system and production quantity, in addition to a backorder production period from the production-inventory system. Output of an integrated system refers to total cost, representing the measurement score. This functional relationship is used as an objective function in the mathematical programming (MP) for attaining optimization.26,27 Consequently, with the aid received from CAE software, this study was able to identify the means of building a computer model that links systems, such as process parameter planning, quality level, design and production inventory management for robustness and optimization, with uncertainty as a factor of consideration.
The remainder of this paper is organized as follows. Section 2 presents the research background. Section 3 provides the proposed computer model for the present research. Section 4 offers an example to demonstrate the proposed approach. Section 5 concludes with a discussion and summary of the key findings.
Integrating process design and production inventory management
The unit cost and process time, which are required factors in production inventory management, cannot be determined until the completion of the process design for the required production effectiveness and quality level. Thus, like the conventional approach, which is called the Disintegrated Case in this research, the process parameter design occurs before production inventory management is carried out. However, quality level achievement, process costs, and process times are closely related to the determination of production order quantities. The example is the processing times for a job, which can be determined by controlling the setting of the process parameters, and adding or reducing manpower and resources as required. These decisions directly affect unit cost and process time, which advance the EPQ determination. For example, an effective production process with additional resources spent on manpower, facilities, and materials may not yield the desired benefits in the following EPQ determination due to the resulting extra inventory cost. An example of turn-back influence is that quality progress causing process modification usually takes place after inventory decisions have been completed. Thus, redesigning processes typically alters both unit cost and process time (production rate). Because of the chain relationship, this alteration further impacts inventory carrying cost, an important element in production-inventory management. This alteration then causes the planned production quantity and back order interval to deviate from the estimated decision values.
The proposed computer model
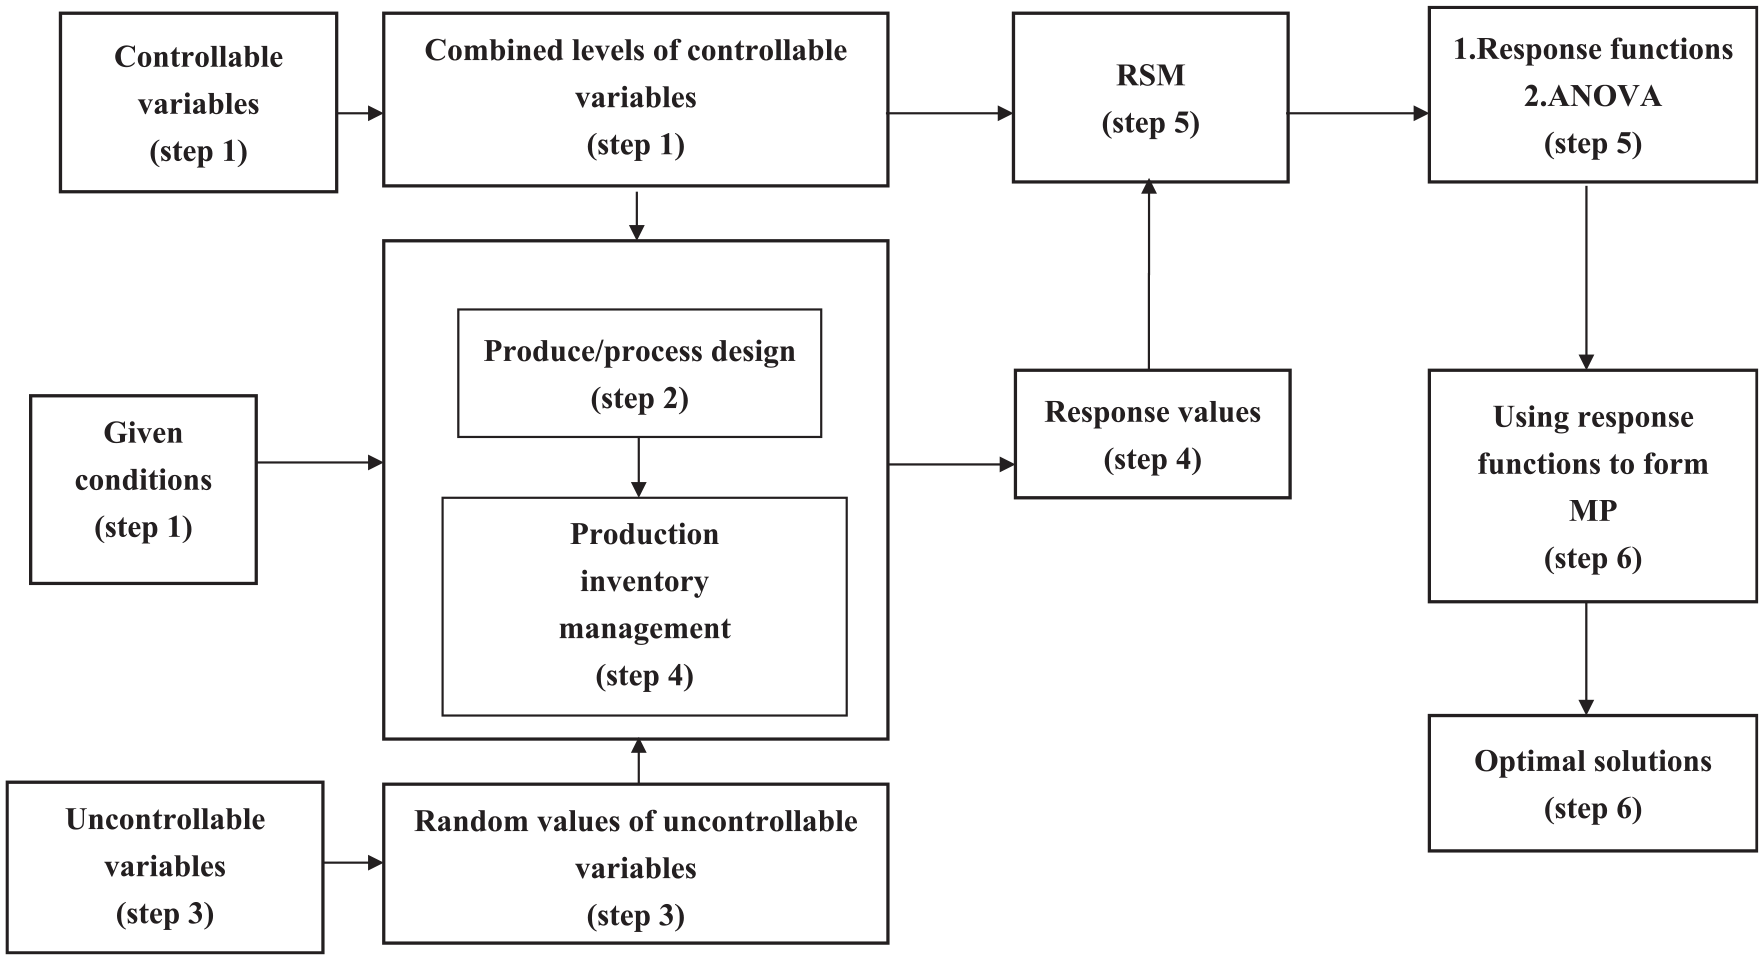
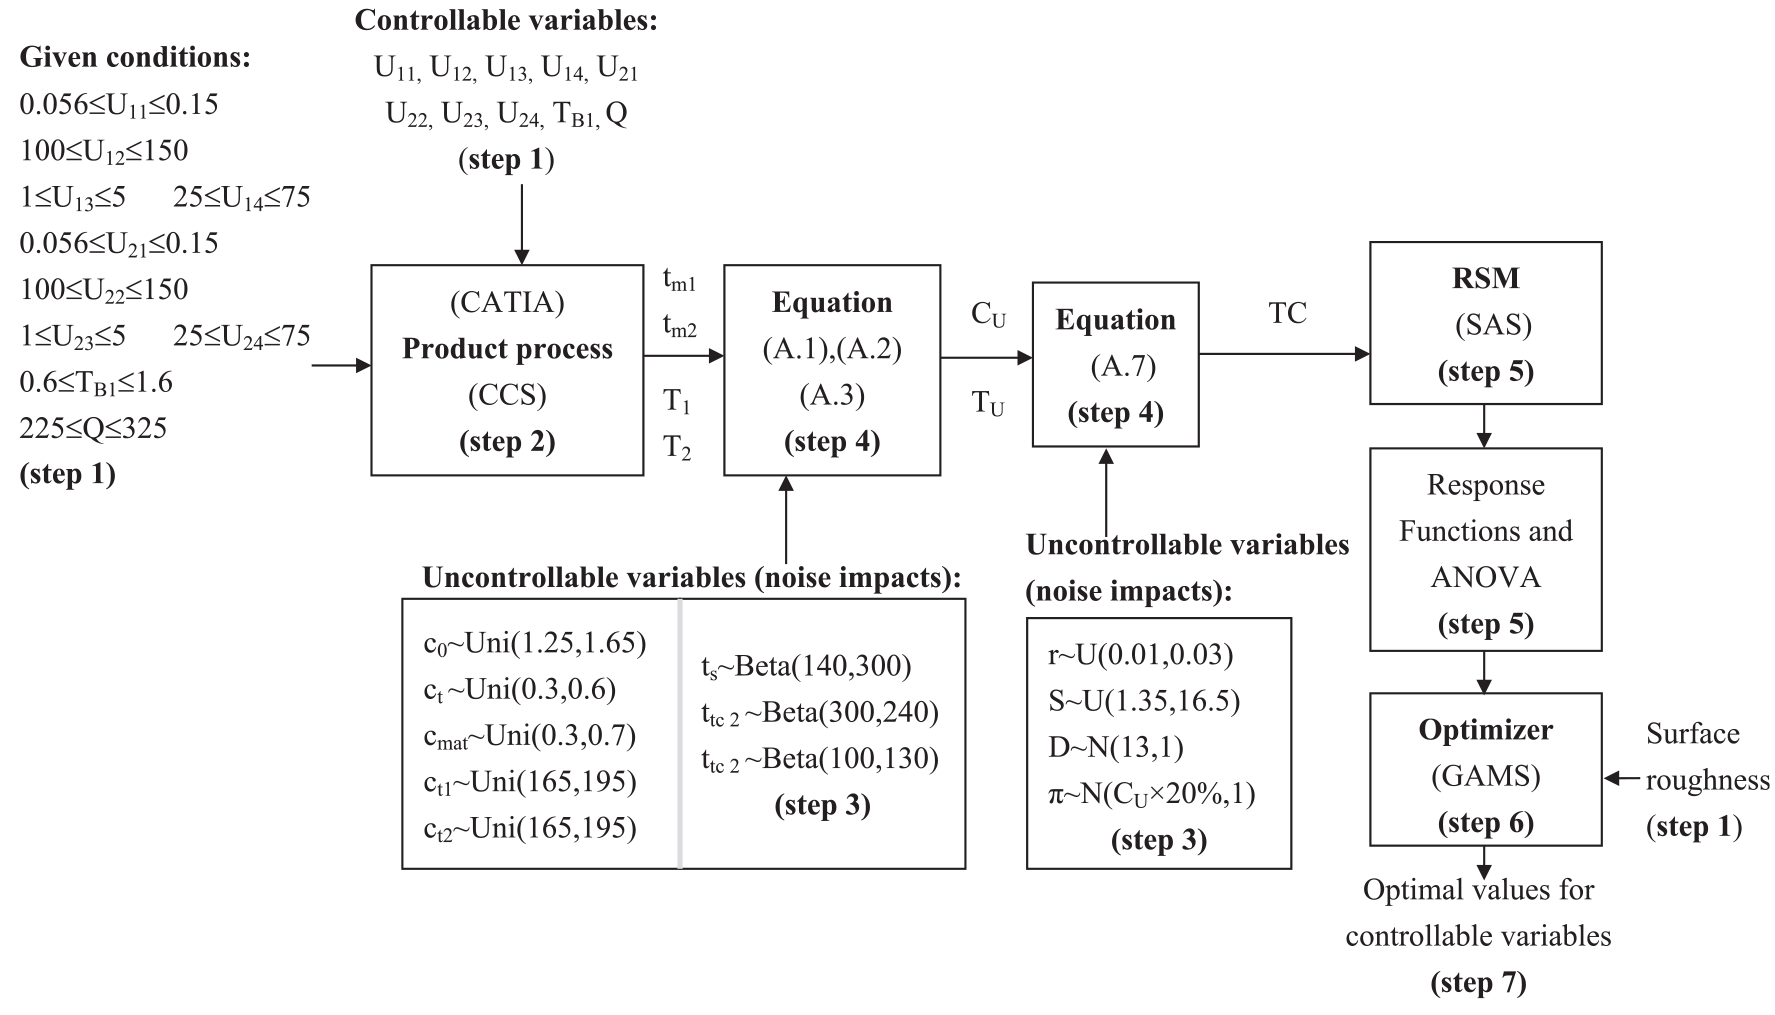
Unit cost is approximated as an RSM response function of the controllable design values determined during the product/process design stage. Processing times are the result of these controllable process parameters. Unit cost continues to affect inventory carrying costs and backorder costs, which in turn influence the economic production quantity (EPQ), as decided by the production inventory management system. Thus, integrating process design and production inventory management is necessary. The other elements that further prevent production quantity from achieving a truly optimal EPQ are uncertain factors, which include: material costs, tool change costs, carrying rates, backorder costs, stochastic demand, and setup time, incurred during the process design and production inventory management. Another difficulty occurring in the process design is that design functions are unknown in most situations. Fortunately, with the development of CAE, the process design can be performed before the production process is realized. In this regard, an integrated approach for process parameters and EPQ determinations for required quality levels via computer simulation in an uncertain environment needs to be established. One of the possible ways to deal with the preceding concerns, such as integration, unknown design functions, and uncertainties, is to use a statistical method such as RSM to cope with the process design requirements via CAE computer simulation and EPQ determinations through numerical simulation to form the response functions. MP is then formulated with the aforementioned RSM response functions to find the optimal solutions via the optimization software. The flow process of the integrated case is depicted in detail in Figure 1; the proposed approach is illustrated in the following steps.
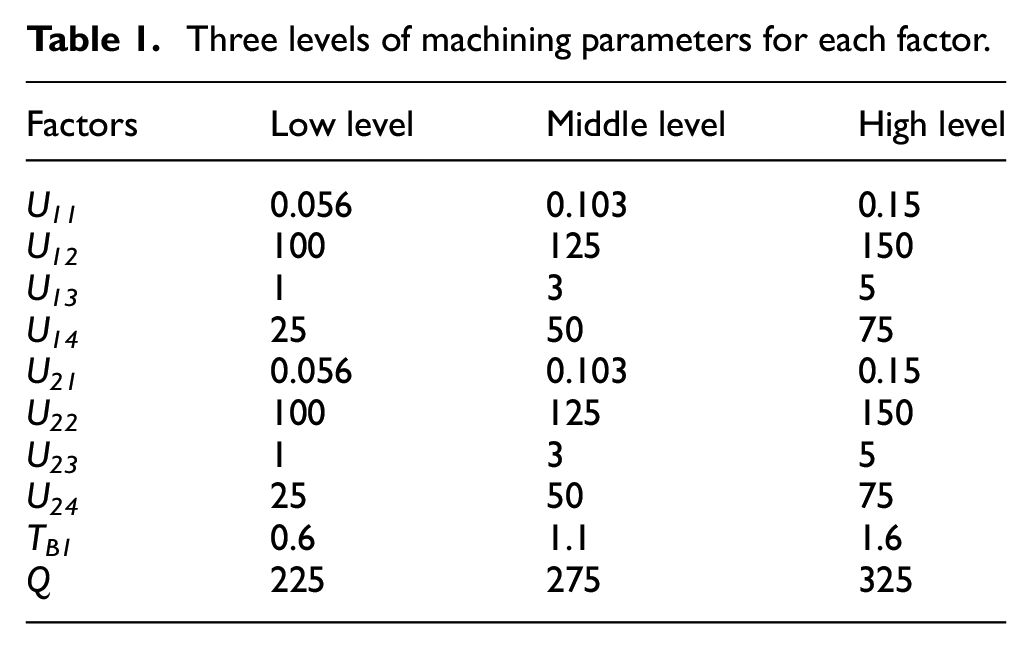
Three levels of machining parameters for each factor.
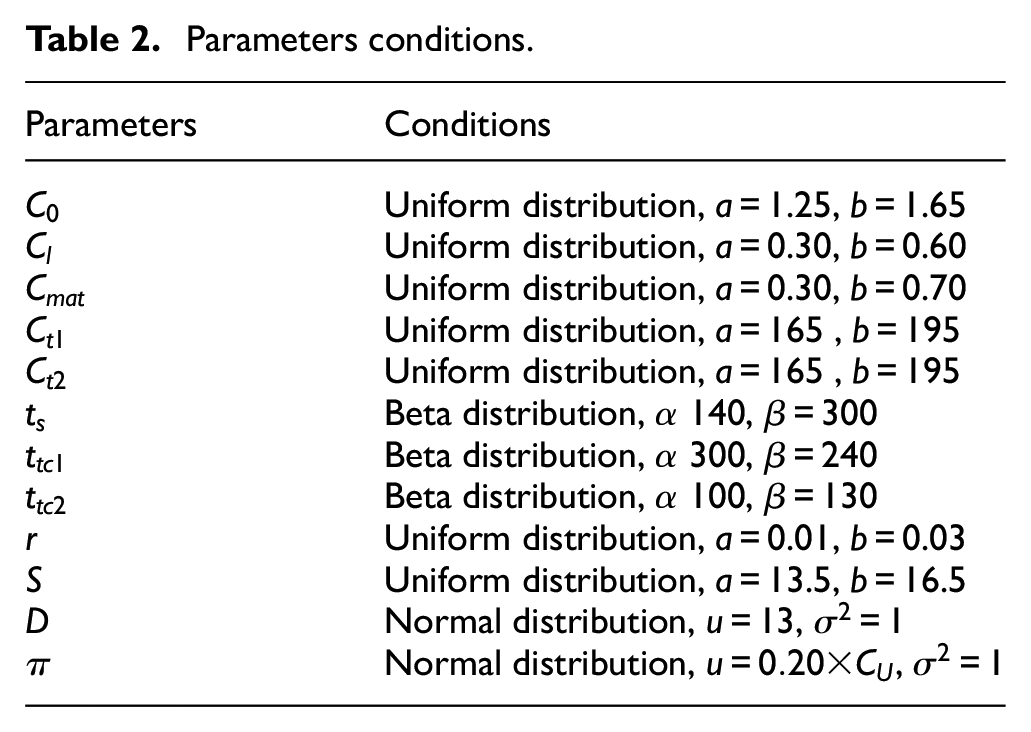
Parameters conditions.
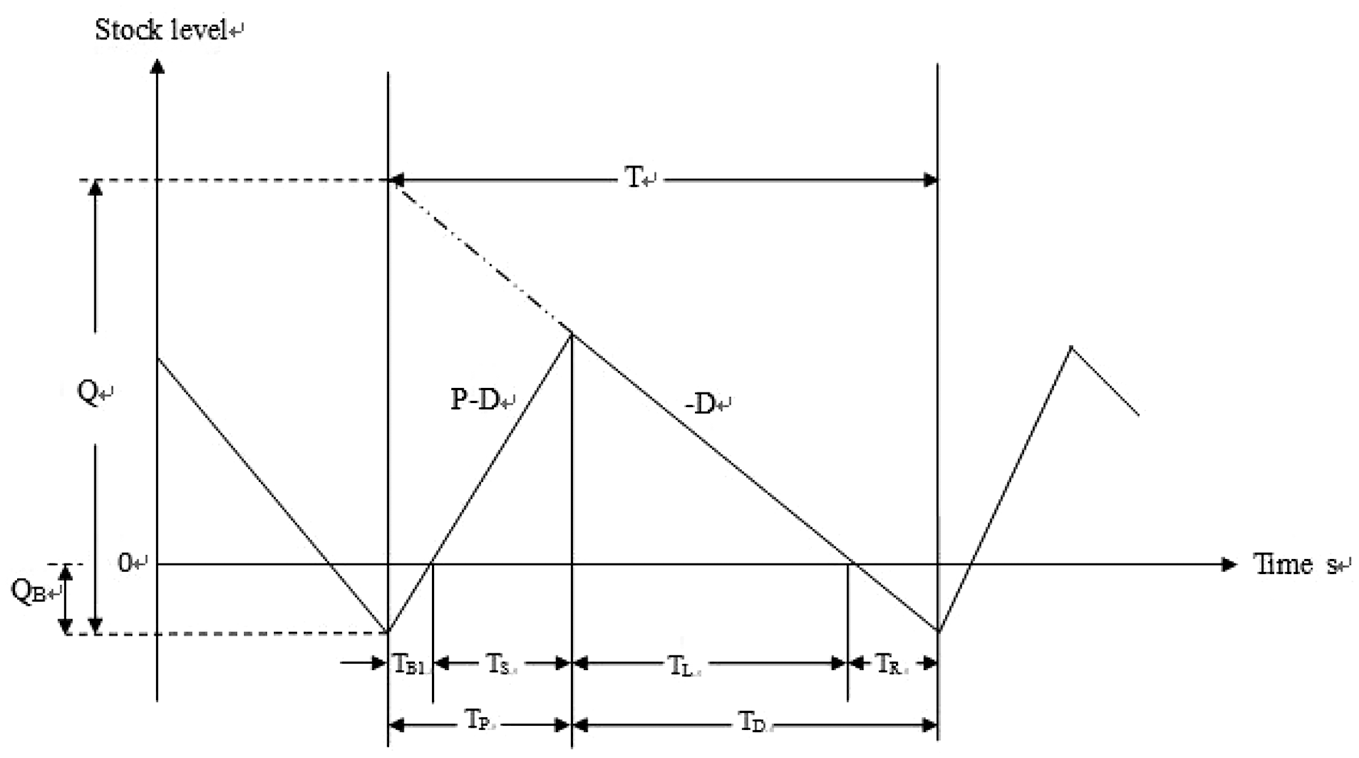
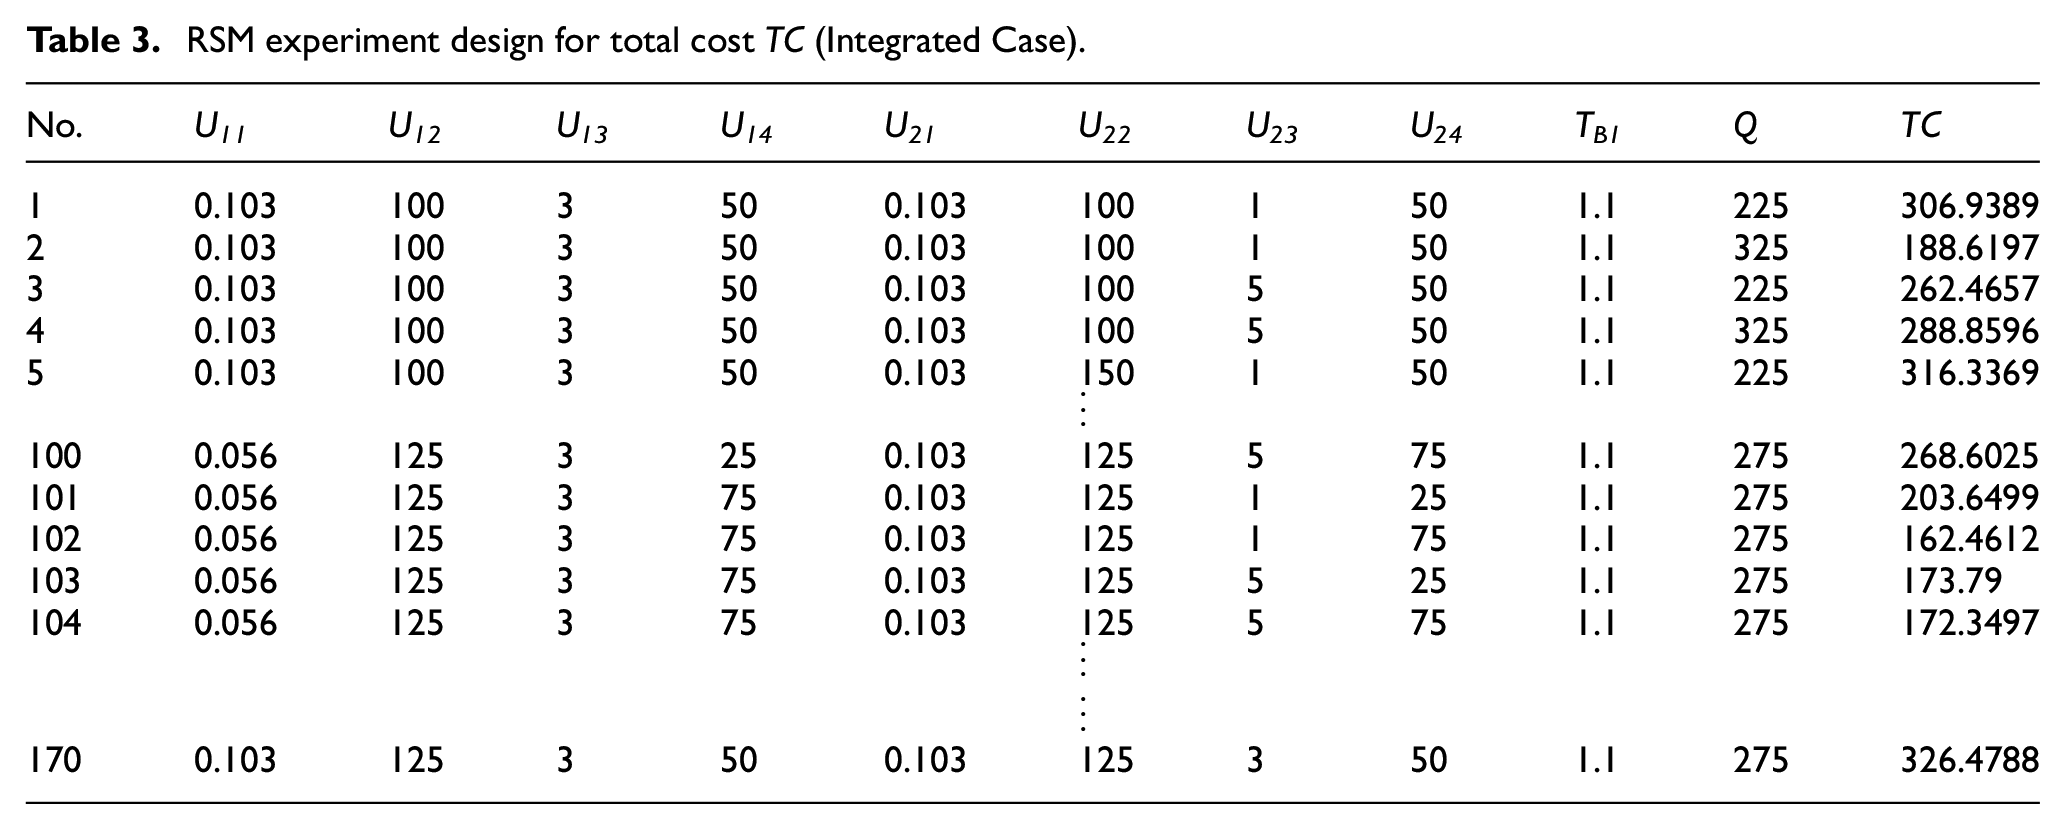
With the suggestions derived from the RSM experimental design matrix, the combined levels of controllable process parameters are input into the CAE simulation software to generate the simulated process machining time, tool life, and unit cost for multi-cutting operations. The generated parameter values of production inventory (Figure 1), the arranged levels of TB1, and Q (Figure 2) and the preceding multi-cutting unit cost are then collected for further application to account for the cost represented in the proposed approach (integrated case).
Process design and production inventory management for integrated case.
EPQ model with shortage.
Application
Numerical analysis
The example provided aims to deal with the minimization of machining costs of quality end-milling processes with solid parts, as shown in Figure 3. Production costs include machining operations costs and production inventory management costs.
31
The choice of control factors depends on the experience of the engineer and can also be obtained by performing screen experiments. The different level values of machining parameters for each factor is set according to the range in which the practice can be operated. The machining operation involves removing excess material from the part body; the dimensions are 100 × 100 × 30 mm3. The tool geometry includes a normal diameter of 10 mm, an overall length of 100 mm, a measuring cutting length of 50 mm and a body diameter of 15 mm. Technical specifications of the tool are: six flutes, right hand rotation, rough quality machining, and a tooth material of High Speed Steel (HSS) coated with TiCN. The tool path style is inward helical. Because there are two features in the studied part, the parameters for the two features are defined correspondingly. U11 and U21 are the feed rates (mm/rev), U12 and U22 are the cutting speeds (m/min), U13 and U23 are the depths of cut (mm), and U14 and U24 are the percentages of tool diameter. As shown in Figure 2, the example for production inventory system is EPQ, with back order allowed. The conditions for overhead cost
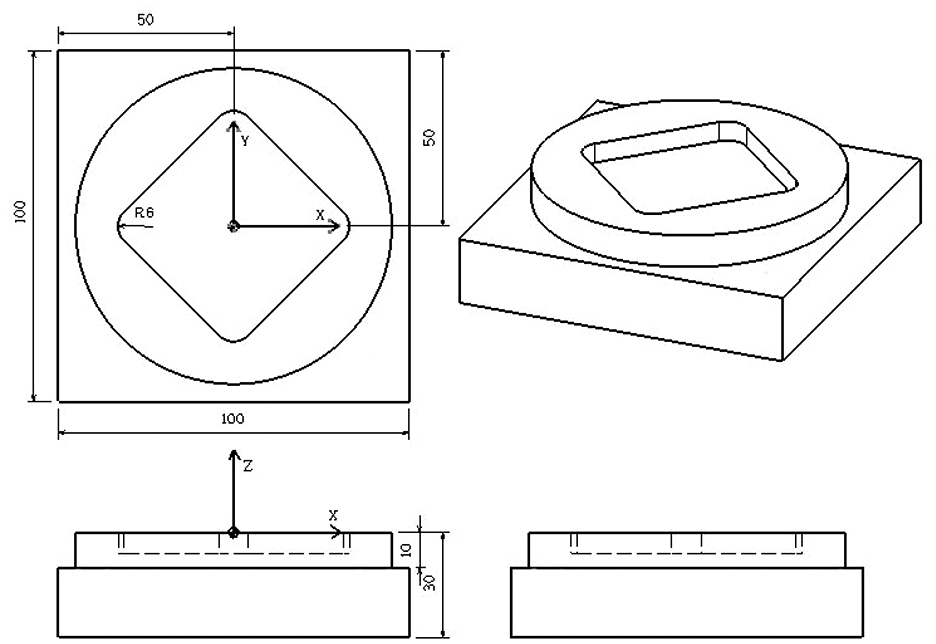
Geometrical solid model of the part.
RSM experiment design for total cost TC (Integrated Case).
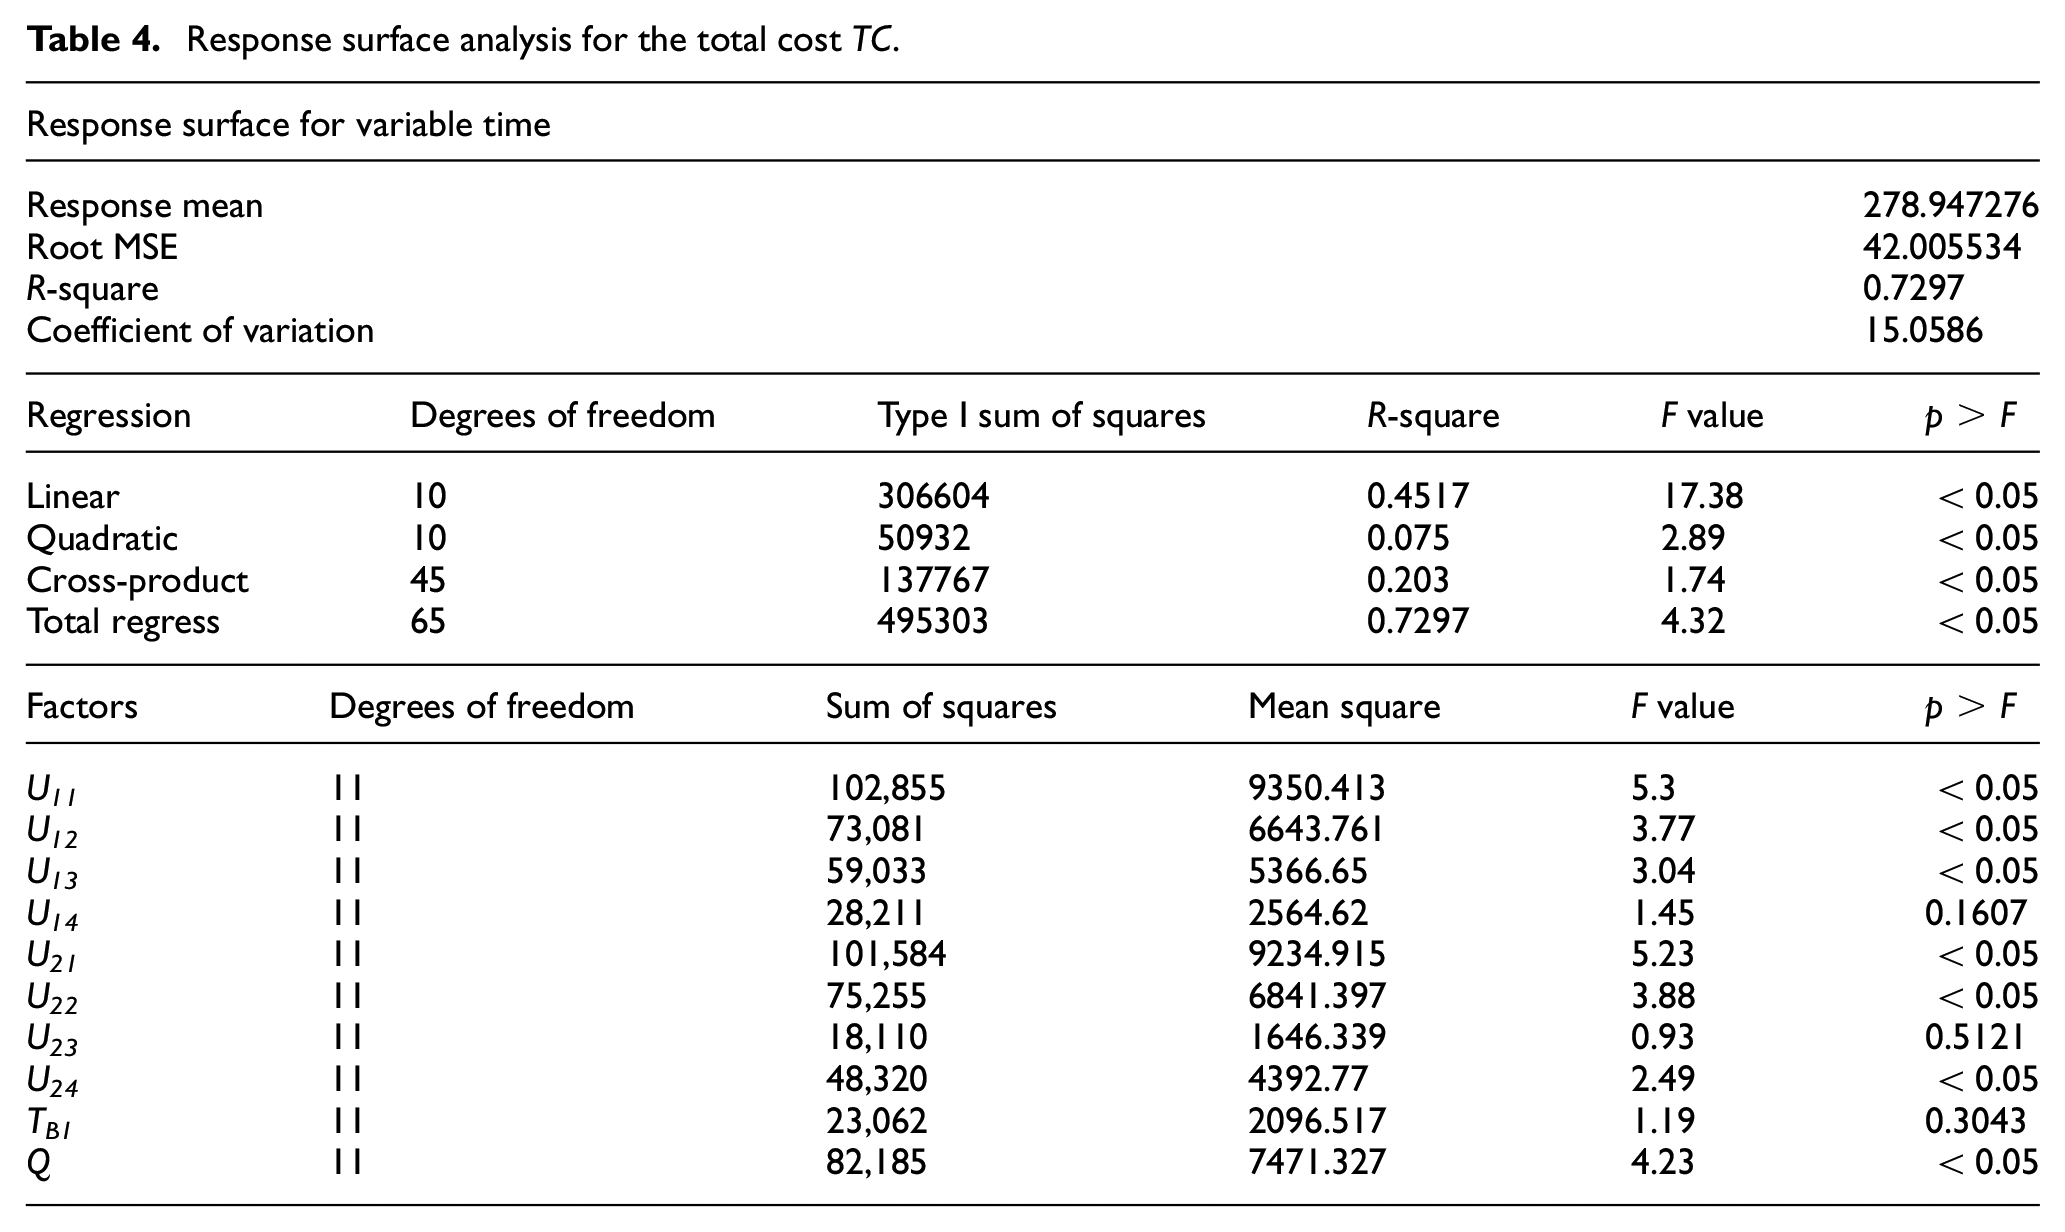
Response surface analysis for the total cost TC
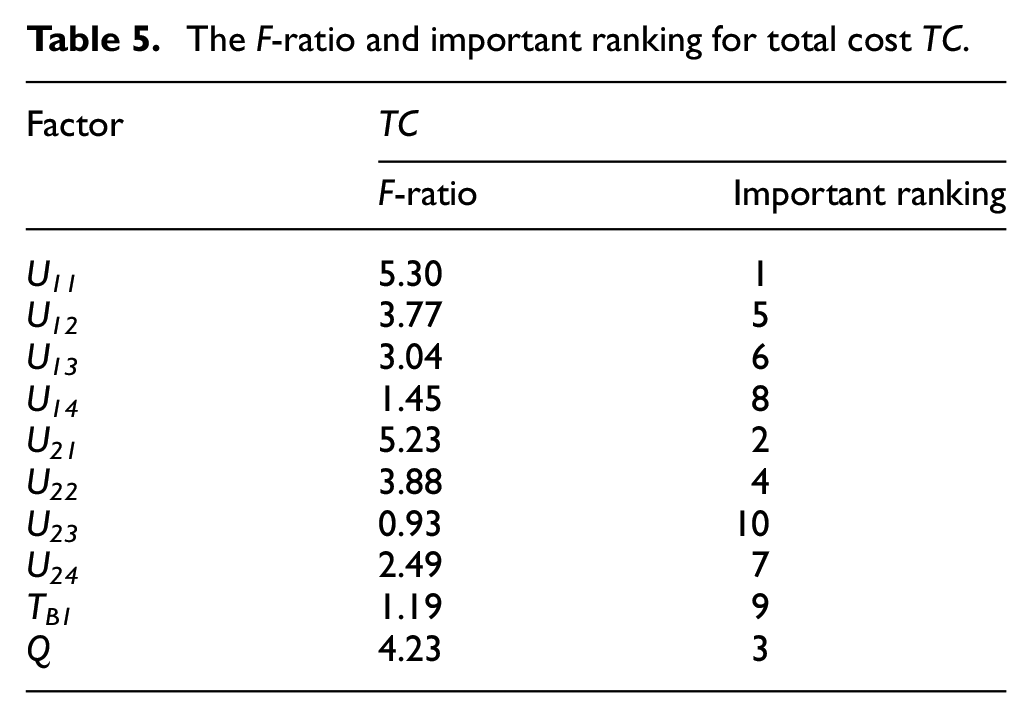
The F-ratio and important ranking for total cost TC.
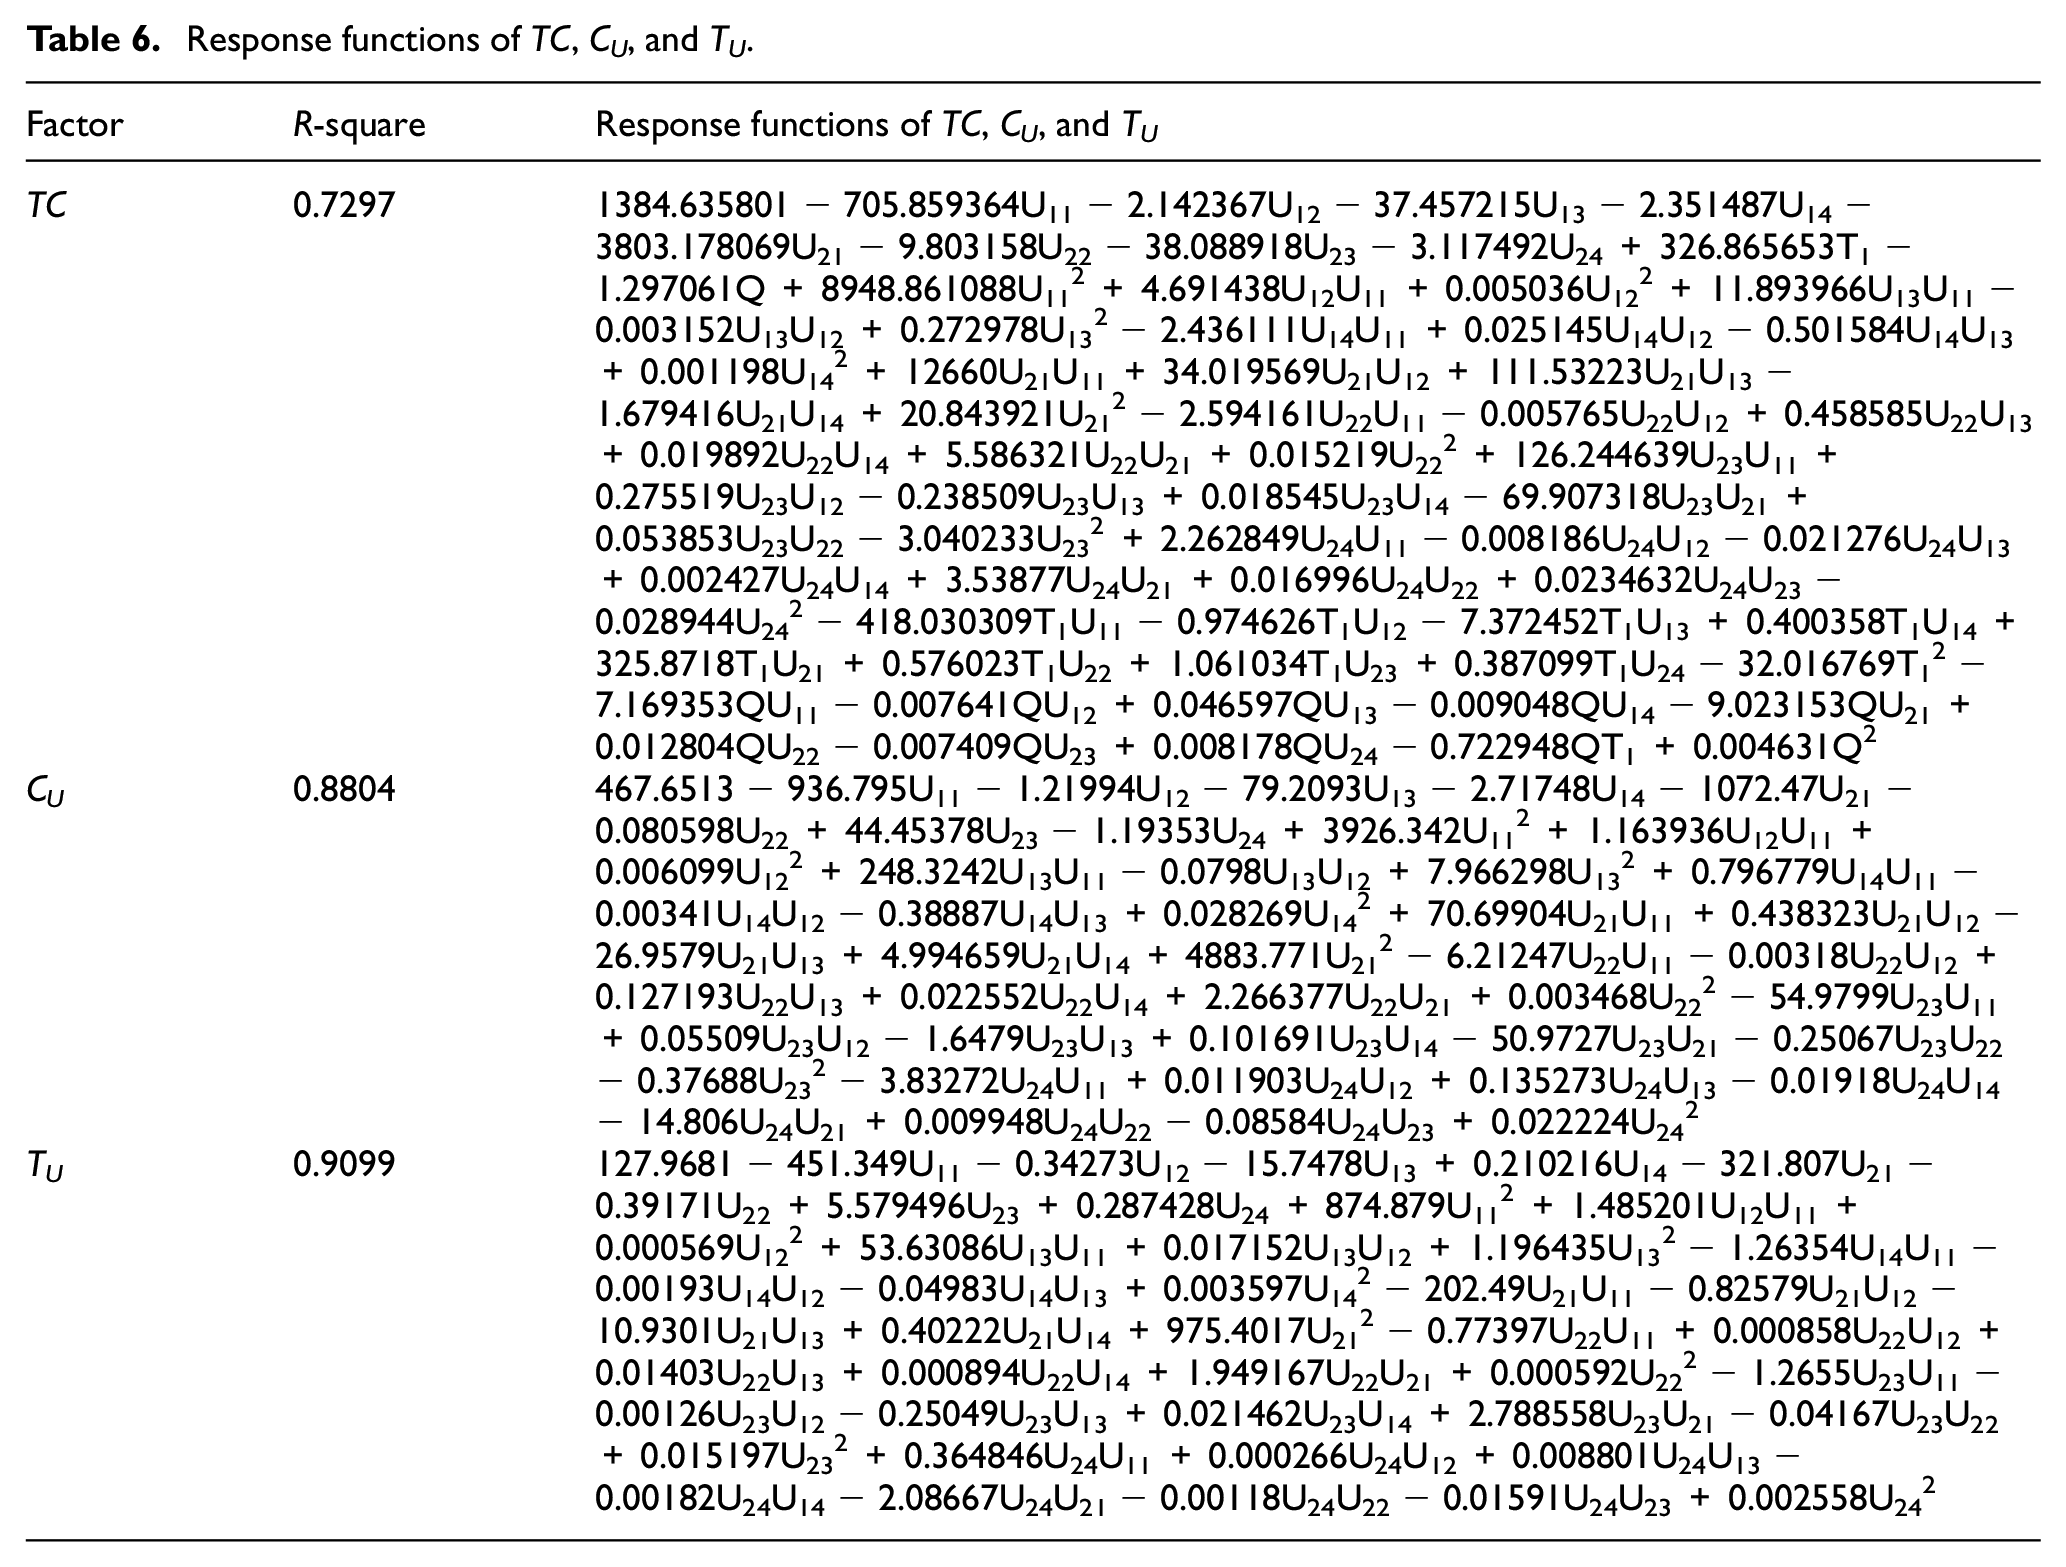
Response functions of TC, CU, and TU.
Computer model via computer software, statistical methods, and optimization techniques.
As shown in Tables 4 and 5, the significant factors are feed rates U11 and U21, economic production quantity Q, and cutting speeds U12 and U22. The insignificant factors are backorder period TB1, depth of cut U23, and percentage of tool diameter U14. To balance the ordering cost and inventory carrying cost in a production inventory management system, the most important decision variable is production quantity Q. Hence, Q is considered the most significant factor of response function TC formation. In cutting process planning, cutting speed and feed rate together determine the material removal rate, which is the production rate that further affects production quantity Q. Thus, these two factors appear significant influence in building TC response function. On the other hand, rest of the factors are relatively less significant. The backorder period TB1 is the least significant among all factor because a high backorder cost, as compared with inventory carrying cost, results in a small backorder period TB1, which has even less significant influence on the total cost TC response function.
As indicated in Step 6 in the preceding discussion, the TC response function is used as an objective function to form the MP. The decision variables are: U11, U12, U13, U14, U21, U22, U23, and U24. They are restricted by the upper and lower limits, SUi and SLi, as defined in Table 1. These restrictions are expressed in equations (2)–(11).
The problem for the integrated case is formulated as follows:


The optimal solutions via the above MP 29 are given in Table 7.
The optimal solutions for integration case.
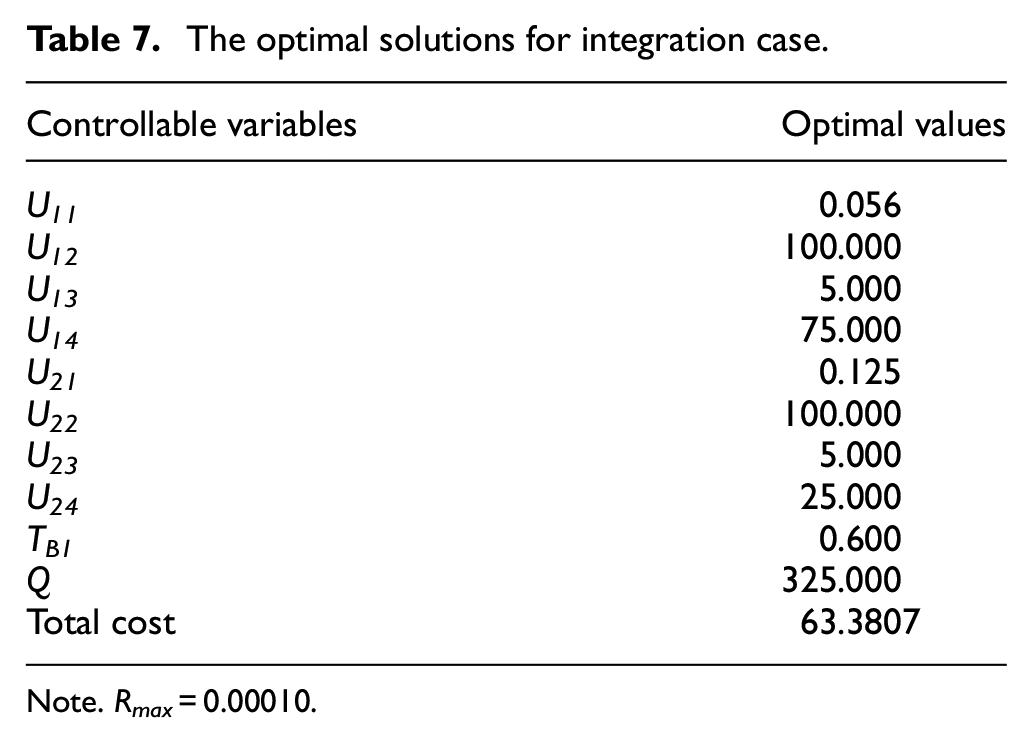
Note. Rmax = 0.00010.
The following equation ensures that an acceptable quality level restricted below the maximum surface roughness, Rmax.

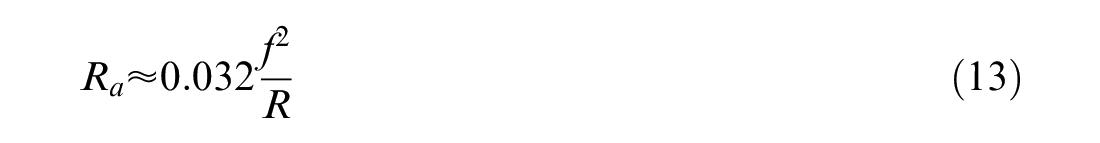
where Ra is the ideal arithmetic average surface roughness, f is the tool feed, and R is the tool tip radius.33–35
The results of sensitivity analysis under different quality levels Ra are shown in Table 8.
Comparison between integration and disintegration among various surface roughness.
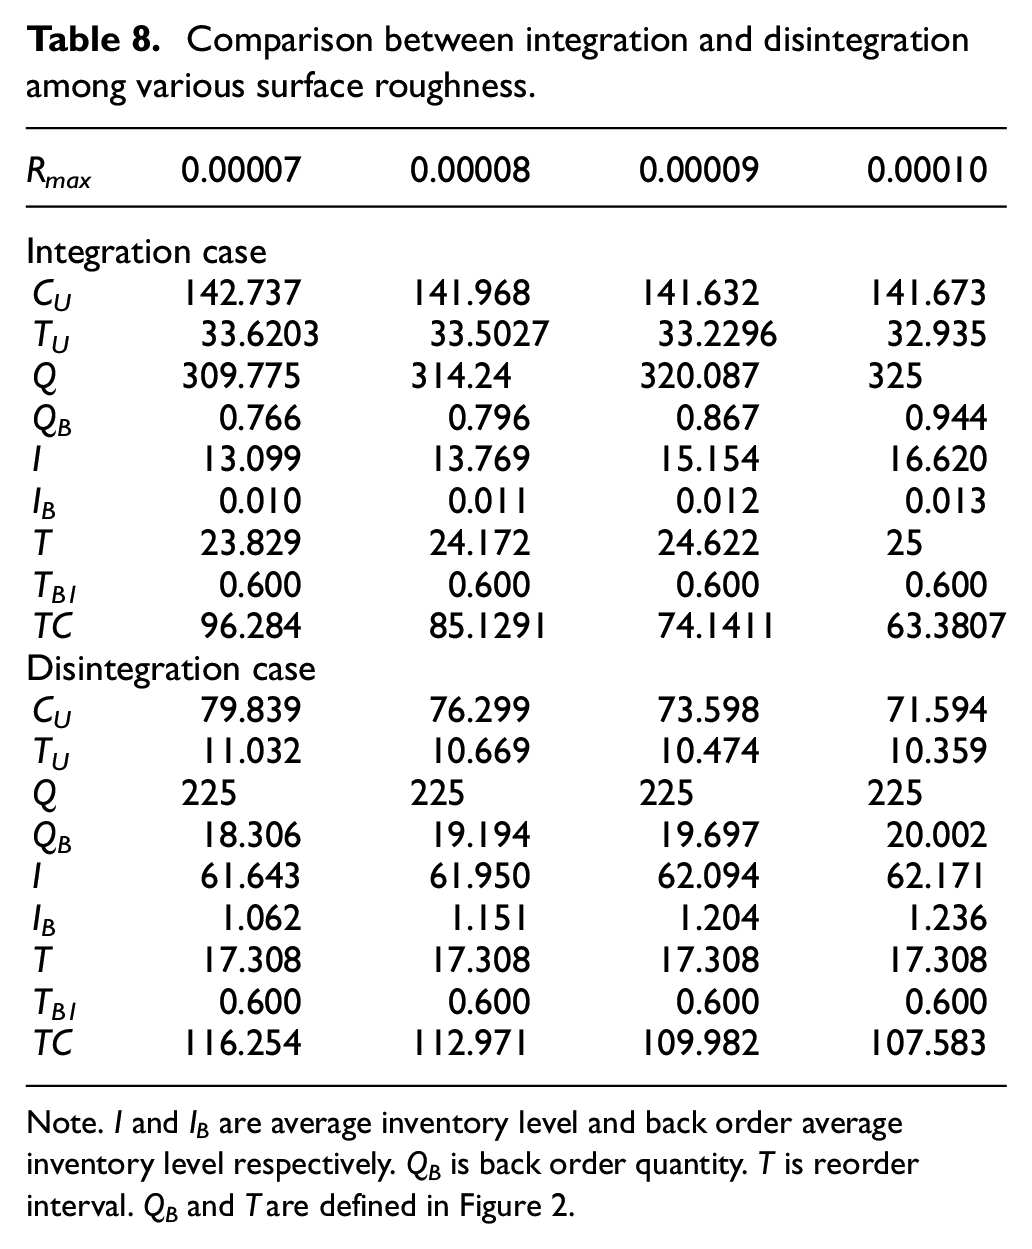
Note. I and IB are average inventory level and back order average inventory level respectively. QB is back order quantity. T is reorder interval. QB and T are defined in Figure 2.
Similarly, with the constraints from equations (2)–(9) and equation (12), instead of TC as the response function used in the Integrated Case, the obtained CU response function was considered as an objective function in the formulation of MP for the Disintegrated Case. CU was optimized in advance before the lot sizing was carried out in the second stage of the Disintegrated Case. Then, TU was obtained from the optimal cutting parameters determined via the above MP formulation. The production rate P was identified through equation (A.3). TC was found from the above CU and P via equations (A.4)–(A.7). TC became a function of TB1 and Q. MP was formed with the TC response function as an objective function, with equations (8) and (9) as constraints. Similar to the Integrated Case, a sensitivity analysis was performed with the various Ra, as given in equation (12). The results are shown in Table 8. These results can be further used for comparison.
In MP, the problem is formulated into a mathematical model, which involves an objective function subjective to constraints. MP is used for obtaining the most optimal solution for a problem with given constraints. All the constraints intersect a region giving a feasible region for optimization. The feasible region explains all of the values that a mathematical model can provide. The optimal solutions of decision variables are the best values of objective function in the feasible region. In other words, the optimal solutions are dependent on the given equations of objective functions and constraints. Table 4 lists the important levels of controllable variables (factors) that influence the variability of response values of response functions. However, the presented MP is an optimization technique for finding the best mean values of problem model. Due to the insignificant consideration in Table 4, the elimination of partial controllable variables from response functions sometime may lead to biased optimal solutions. Hence, all significant and insignificant controllable variables, such as TC, CU, and TU, should be included to form response functions.
Results discussion
The results summarized for both cases in Table 8 indicate that CU, TU, and TC decrease as Rmax increases. The magnitudes Q, QB, I, IB, and T increase as Rmax increases, since poorer quality levels with greater Rmax require less production time and money spent on producing a unit. The shorter production time and cheaper unit cost result in a greater production quantity and inventory level because of the higher production rate and lower carrying cost. Although CU and TU in the Integrated Case are greater than those in the Disintegrated Case, the Integrated Case has a lower average inventory level I and TC because the Integrated Case assimilates process design and production inventory management under the consideration of balance. In further comparing these two cases, the Integrated Case shows greater production quantity Q and periodic reordering interval T than the Disintegrated Case does. These phenomena reflect that greater production time TU in the Integrated Case indicates a slower production rate and a higher unit cost resulting from a poor process design, as compared to a lower production time with higher production rate and lower unit cost from an effective process design in the Disintegrated Case.
An additional application with the proposed approach is to find the best parameters for product development. The best combination of product parameters is the obtained parameters associated with an alternative that holds the minimum response TC. The corresponding TCs are found with varying product design parameters. Consequently, the optimal parameters for simultaneous product and process design can thus be determined.
In contrast, the Disintegrated Case aimed to minimize the manufacturing cost of the process design in the first stage and then the production cost of inventory management in the second stage, sequentially and independently. As in the presented example for the Disintegrated Case, the act of cost reduction in the first stage solely with effective process design, namely, a smaller production time TU, or unit cost CU, may not prove beneficial in a further attempt at cost saving in the second stage. Consequently, greater collective TC results for the Disintegrated Case, since the higher production rate is decided solely in the first stage (process design), caused overproduction in the second stage (inventory management system). Overproduction results in a higher inventory level and carrying cost in the second stage. Thus, the reason that subsystem optimization sequentially and independently cannot obtain the global optimization for an entire system is that the local optimization for the predecessor subsystem may exert a negative impact on the successor subsystems.
Thus, the reason that subsystem optimization sequentially and independently cannot obtain the global optimization for an entire system is that the local optimization for the predecessor subsystem may exert a negative impact on the successor subsystems.
Computer simulations via CAE can replace physical experiments, decrease the cost of experimentation, and accelerate the process design and production development. As shown in Figure 4, the noise impacts from Table 2 are considered in the proposed approach, which makes the integrated system more robust during the applications, especially in uncertain environments. The proposed approach contains statistical analysis for importance ranking, which assists designers to identify the reasons for changes and to receive instantaneous advice for design progress. The proposed approach with CAE, RSM, and MP optimization for an integrated system can proceed equally well on personal computers.
Summary
The proposed approach in this study was used to develop a computer model to obtain the minimal cost with acceptable quality levels for simultaneous process design and production inventory management under uncertainty. Computer software CATIA and CCS were adopted to simulate the relevant data. Then, the statistical RSM method and the MP optimization technique were used to derive the optimal process parameters and production quantities. An example was introduced to demonstrate the proposed approach. The results show that integrating machining operations and inventory management could achieve lower costs and higher quality. Consequently, economically viable and high quality product/process design and production planning can be completed simultaneously in the early stages of a product’s life cycle.
In addition, the integrated process and quality design of whole product and process life cycle could be proposed as multi-objective programming, which can be solved with newly developed algorithms, such as the ant colony algorithm, genetic algorithm, simulated annealing algorithm, etc. Future work will explore whether it is possible to find a more accurate and optimal value.
Footnotes
Appendix A: Matrix of Box-Behnken design for integrated case
Factors = 10, runs = 170
Appendix B: Matrix of Box-Behnken design for disintegrated case
Factors = 8, runs = 120
Appendix C: Equations represent for machining operations and EPQ production inventory systems
The unit cost is 30 :
where
m: number of machining operations required to produce a unit of product
Ti: ith tool life for feature i
The production time for each unit, TU:
The production rate, P:
The average setup cost per time:
where ordering cost S and demand rate D are known
Q is unknown production quantity needed to be determined
The average inventory carrying cost per time:
where TP and TB1 are defined in Figure 2
TB 1 is unknown backorder period needed to be determined
TP is unknown production cycle which is
r is inventory carrying rate
The average backorder cost per time:
where
The total cost:
Declaration of conflicting interests
The author(s) declared no potential conflicts of interest with respect to the research, authorship, and/or publication of this article.
Funding
The author(s) received no financial support for the research, authorship, and/or publication of this article.