
Abstract
This article presents a closed-loop Kaizen system with discrete event simulation in the stage of design and reengineering of mass-customization production system. This approach contains four steps: current process analysis, production line design, discrete event simulation to solve the dynamic event questions, and implements and evaluation. The current process analysis and the production line design refer to the value stream mapping and the productivity analysis based on Kaizen principle, respectively. Production line designs are the modeling basis of discrete event simulation, and discrete event simulation feeds back results to the decision-makers to reduce waste and cost and improve the quality and productivity by reforming the production line. Therefore, by connecting the closed-loop Kaizen with discrete event simulation, the production line can be continuously and automatically improved. To demonstrate the potentials of the closed-loop Kaizen system, a case study was applied based on the original production layout and economic benefits were achieved. Moreover, this article indicates a direction for the full automation of process optimization.
Keywords
Introduction
With the increasing challenges from market competitions and environment regulations, manufacturers are placing more emphasis on the application of robot cells and enterprise information systems to improve the effectivity of production system and reduce the production cost.1–3 At the same time, many manufacturers have adopted some advanced tools, methods, and techniques in their production activities. The tools and techniques containing value stream mapping (VSM), Lean–Kaizen, and the standardization of work have been used in production line4–6 to process improvement. Continuous improvement is evolutionary improvement in quality management and manufacturing performance of the organizations for modern manufacturers.7,8 Kaizen is a popular tool applied to eliminate wastes and minimize cost at all levels of production system, 9 and it mainly aims to solve the real problems. The problems usually can be solved accurately because the results can be seen through the validation against a real scenario. 10
The performance was optimized by the Bernoulli serial in the rework production activities under the ideal situation of machine. 11 In fact, discrete event simulation (DES) is an effective method of solving the stochastic problem and decreasing the fluctuation caused by uncertainties from the previous cells to make the production line more stable.12–14 On the aspect of sustainability and forecast ability, DES can support decision making to determine the best scenario in a production line with stochastic variables and this procedure has been used for many years. 15 In addition, a lot of good results in real production line have been reported by researchers in the energy optimization, 16 product life cycle management, 17 batch size optimization, and buffers optimization 18 through the DES model. Due to the gap between the virtual simulation and the real production line, the optimization results are very different for different carriers. DES needs uncertainties, but how to avoid uncertainties and decrease the fluctuation caused by uncertainties from the previous cells to make the production line more stable becomes a new problem. Therefore, combining the merits of the continuous improvement methods and simulated the uncertainty event methods worth a further study.
This article presented process improvement by addressing the accurate optimization and continuous optimization problem. The main aim of this article is to develop a closed-loop Kaizen system by considering the effect of the process cell’s optimization and fluctuation of the cycle time in the production line. The proposed system uses VSM to detect problems that does not comply with Kaizen principle and DES to evaluate the performance of solutions. To assist the DES for modeling, productivity analysis is used and sensors are also used in this system to promote the accurate and continuous optimization by providing data for VSM and validate the execution effect of solutions. Due to the complexity of the manufacturing environment and the limit of robotic techniques, this article only focused on the production cell that can be reformed by using robots and the closed-loop Kaizen system is just robotization which is not fully intelligent.
This article is organized as follows. Section “Literature review” reviews related work. In section “Methodology,” the methodology of building a closed-loop Kaizen system is displayed. In section “Case study,” a case study was carried out to deeply optimize the process cell through the closed-loop Kaizen system with DES. The discussion is in section “Discussion.” Conclusions are presented in section “Conclusion.”
Literature review
The cores of process optimization are the application of intelligent devices and robotic cells, the integrated application of artificial intelligence and some lean management, and the continuous improvement of intelligent production system through simulation method. The development of production systems was a complex task, and researchers usually studied a variety of scenarios by productivity analysis especially in robotic cells. Hall et al. 19 studied the sequence of a robot that produced similar parts in a manufacturing robotic cell with several machines. Geismar et al. 20 studied the problem of scheduling operations in robotic cells with dual gripper. Drobouchevitch et al. 21 tried to maximize the productivity by analyzing the sequence. The robotic welding systems were developed in the shipyards to shorten the welding time. 22 Gultekin et al. 23 found that a robot-centered layout could significantly reduce the cycle time.
In the past researches, the continuous improvement and lean management were focused by some scholars and manufacturers. The Kaizen method was widely used in the field of increasing operational efficiency, reducing cost, and improving the product quality to reduce cycle time and increase profits. 24 Glover et al. 25 proposed a Lean–Kaizen method to identify and eliminate wastes in production lines and provide continuous improvements in the small enterprise. Suarez Barraza et al. 26 illustrated that three techniques namely 5S (Seiri, Seiton, Seiso, Seiketsu, and Shitsuke), Gemba-Kaizen workshops, and process mapping which were related to Kaizen had a direct good effect on the processes and management systems. By the validation of reality, Kaizen method tightly connects with real manufacturing and can achieve improved effect as good as expected.
In the era of Industry 4.0, Rodič 27 presented a new simulation modeling paradigm to supply the seamless assistance in the lifecycle of production system supported by the real-time operation data. In the discrete manufacturing system, the process monitoring was achieved by the radio frequency identification to capture the real-time information for developing the scheduling simulation model. 28 The new simulation optimization tool of DES was used in many scenarios, such as prediction and evaluation of intractable production questions for the decision-makers to reduce the economic cost. 29 Turner et al. 30 constructed a test platform using DES to make decisions for smart factories. Fengque et al. 31 found an intelligent DES architecture to optimize the decision by sharing resource information between different processes. Hoad and Kunc 32 built a hybrid system combining the dynamic simulation and DES to offer a better understanding of real-world problems. DES depending on the powerful ability of computers can make the optimization better and more sustainable before the optimization is carried out.
Based on the contributions of past research, this article proposed a closed-loop method combining Kaizen and DES in production line to satisfy the needs of smart factory including the accuracy and sustainability of the optimization. Through this study, an application was carried out and expected results were achieved, which played an exemplary role for the wide use of this method. The research efforts will also enrich the current knowledge on process optimization.
Methodology
This article proposes a framework of closed-loop Kaizen system (as seen in Figure 1) to automatically and continuously optimize the production line. The procedure is shown as follows:
Step 1: Current process analysis. Through the ECRS (Eliminate, Combine, Rearrange, Simplify), SVM, action analysis, and Kaizen, the problems happening in production lines can be monitored and analyzed such as invalid action and idle time, time and motion study, manual operational analysis, and identified problems in process. VSM helps to display the most wasteful and unreasonable processes or key constraint problems and gives suggestions such as reducing machines, replacing workers by robots, and adjusting work sequence.
Step 2: Production line design. Depending on the current process analysis, the segment of production line design makes possible solutions such as production layout design, autonomation load/unload parts, robot design and choose, robot fixture design, and equipment linkage, by considering parameters such as cycle time, number of unqualified parts and qualified parts, idle time of machines, and arriving time of parts.
Step 3: DES. The DES model of production line is shown in Figure 2, including parts arrive segment, arrange machine segment, processing segment, and finish segment. The main simulation is the arrival time of parts, idle time of workers, loading and unloading time, and idle time of processing equipment. In the traditional production line, the manual operation brings fluctuation of cycle time and the robotic operation can conquer fluctuation of cycle time. However, in the smart production line, the robots dynamically respond to the time variation caused by the parts arrive segment in the production line. For example, the robots speed up to make up the late and keep the stability of production line during the parts arrive late. The model of DES is different for humans (Figure 2(a)) and robots (Figure 2(b)).
The last step is to verify the design effect through implementation and to feedback results to decision-makers to provide reference for the future optimization. Based on the analysis of DES results, the process optimization will be carried out by decision-makers and the effect of the optimization will be validated by the closed-loop system. If the reform is not well executed or some new problems happen, the defect optimization can be found immediately by sensors and DES model. The system will inform decision-makers again to improve the defect until the expected results are achieved.
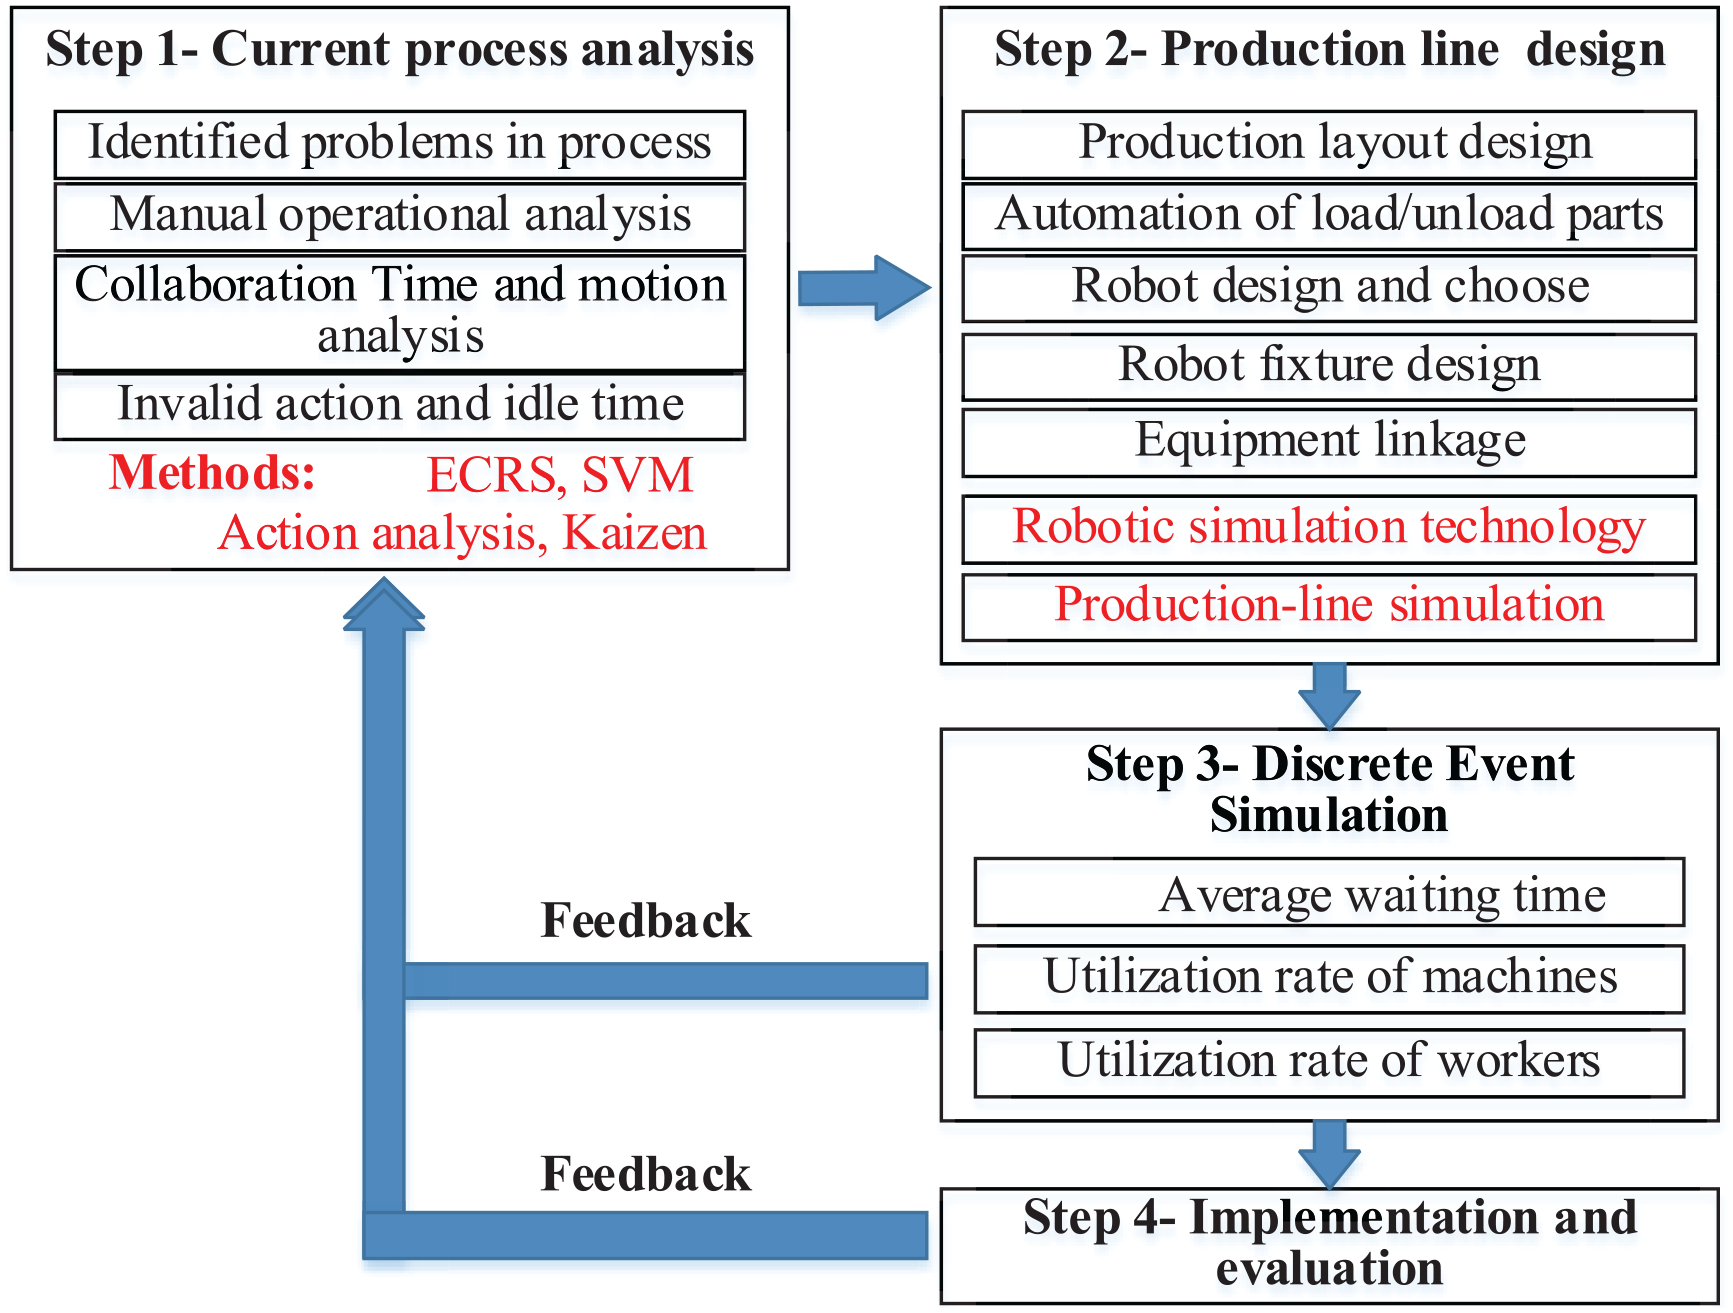
Framework of the closed-loop Kaizen system.
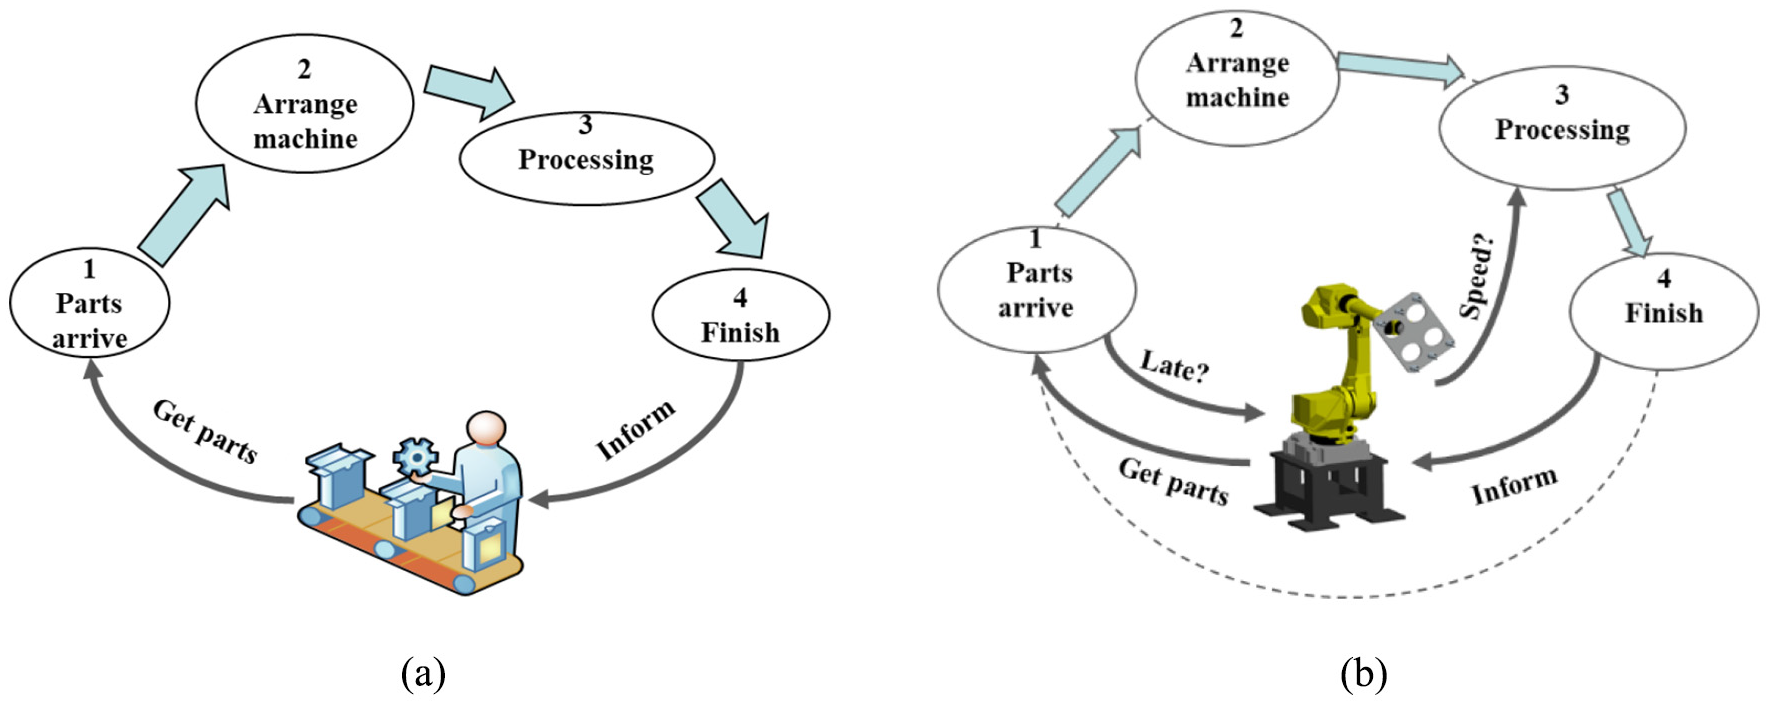
Different operation flowchart: (a) manual operation flowchart and (b) robotic operation flowchart.
Case study
This method was used in the production line of air conditional compressor parts (ACCP) in a Chinese company B. The company B was facing the growing problems of external competition and internal personnel cost. They needed an automated and smart production line instead of the traditional production line to further reduce costs and improve the stability of production time.
Current process analysis
The current VSM (Figure 3) shown the existing processes and guides to identify problems for improvement. The upstream flow was for customers and the product was ordered monthly. The downstream flow was for supplier and the raw material was ordered monthly. The top flow was given at the top which represented information flow that moves from right to left between customer and supplier. The bottom flow was given at the bottom which represents the material moving from left to right in the ACCP production line. The production planning and control (PPC) department plans and monitors the quality status of the product in real time by Internet of things. The eight processes included the coarse grinding (P1), broaching (P2), middle washing (P3), surface grinding (P4), radius fine grinding (P5), hole polishing (P6), surface polishing (P7), and final washing (P8). The cycle time (CT), number of equipment (NE), number of workers (NW), unqualified rate every 10,000 (UR), and simultaneous processing quantity (SPQ) were recorded.
CT: the cycle time of a machine;
NE and NW: the number of equipment and worker respectively in a process cell;
UR: the unqualified rate of processed work pieces in every 10,000;
SPQ represents the number of processing work pieces that every worker has to manipulate simultaneously including loading, unloading, and carrying.
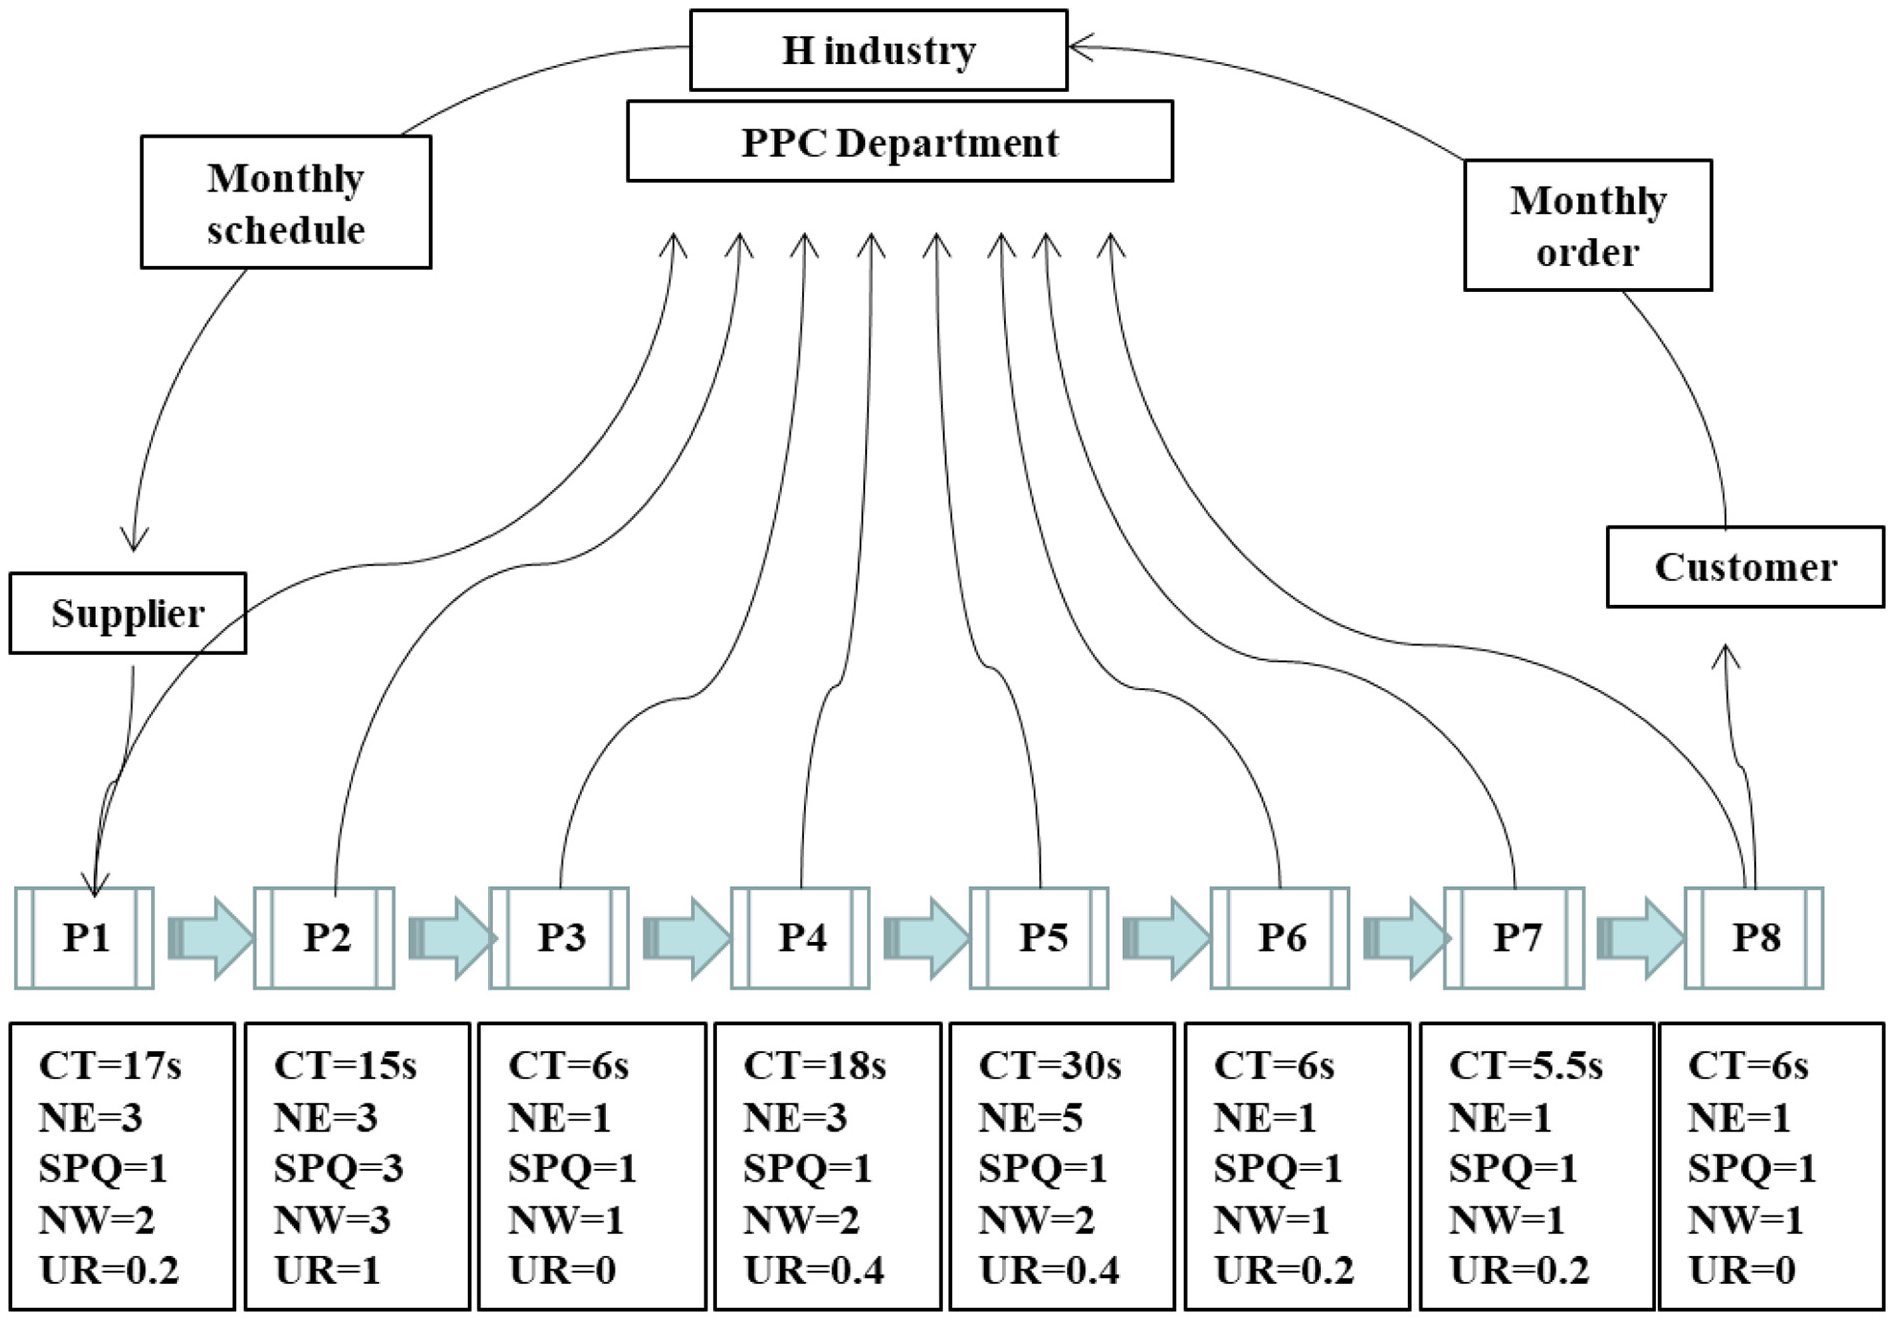
Current value stream mapping of ACCP.
According to the VSM, it is obvious that P2 occupies the most people but has the highest unqualified rate, which is very unreasonable and needs to be improved. It is necessary and worthwhile to analyze the broaching (P2). The ECRS method is carried out to deeply analyze P2 and make preparation for the production line design and optimization from four aspects:
Elimination: eliminate invalid actions and idle time.
Combination: combine the operations to eliminate unnecessary time and action.
Rearrangement: rearrange the job order and resources to find the optimal sequence.
Simplification: simplify the operation by clamping three work pieces at a time.
Production line design
Through the current situation analysis, the production line was redesigned and two robots were planned to replace the three people, one of which operated two broaching machines and the other one of which operated another broaching machine (Figure 4). The coarse grinding cell was manual and thus the arriving time of work pieces for the net cell was uncertain. The three broaching machines did the same thing and work at full speed. Before executing the plan, it was necessary to simulate the production of humans and robots to assist decision making by illustrating advantages and disadvantages.
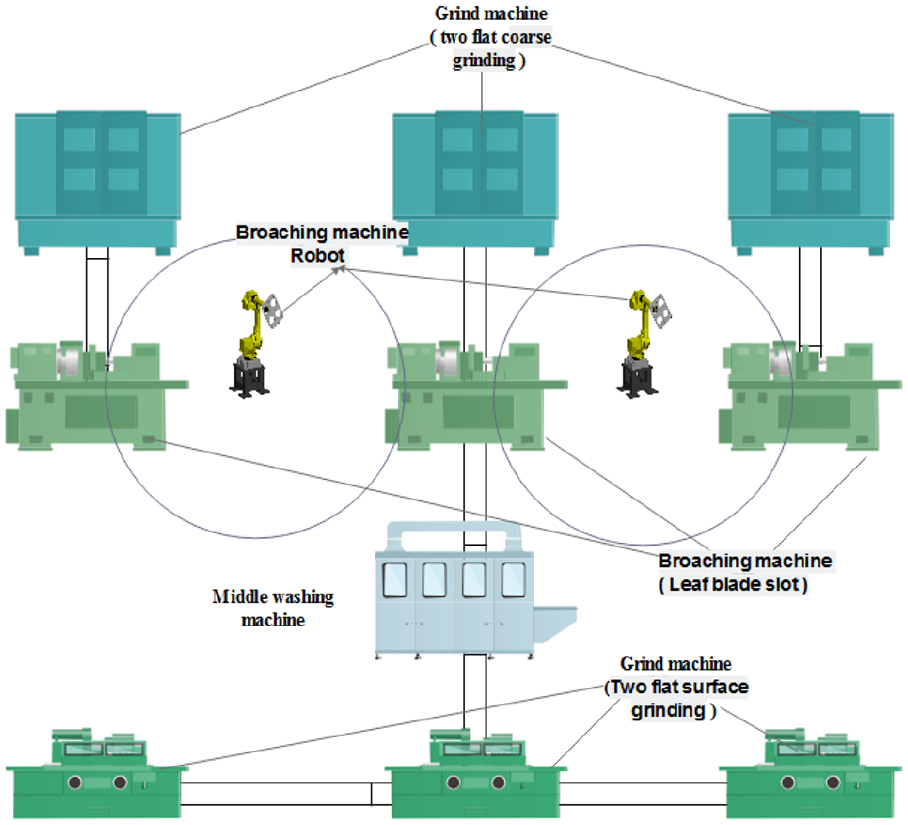
Lean automatic production line layout of ACCP.
There were two types of robots to choose: (1) one with a six-claw manipulator and (2) the other one with a three-claw manipulator. The three types of work sequences were analyzed including manual work sequence. According to the theory of productivity analysis, 33 the best work sequence was shown in Figure 5. The manual work sequence was the same as the robotic sequence for one broaching machine (as seen in Figure 5(a)). The main difference between six-claw robot and three-claw robot was also that the unloaded and load time are different.
M,
In the manual cell or one-machine cell of ACCP, the sequence (as seen in Figure 5(a)) starts with the movement of the robot at the input. The state of the system was expressed using
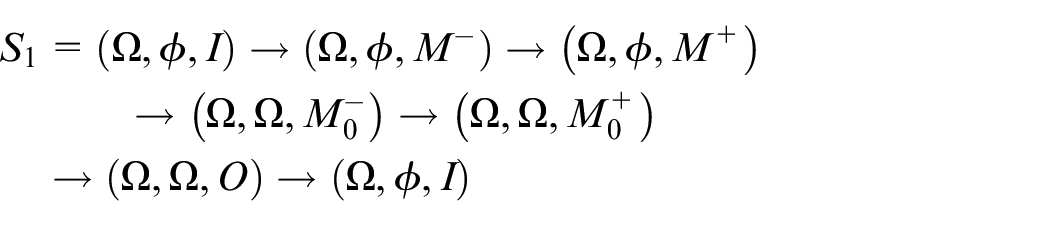
S1 starts with the movement of the robot at the input. Before the sequence starts, there should be work pieces being processed in M. Three work pieces were picked up and carried to M, where three old work pieces were unloaded and the three new work pieces were loaded. The robot moved to
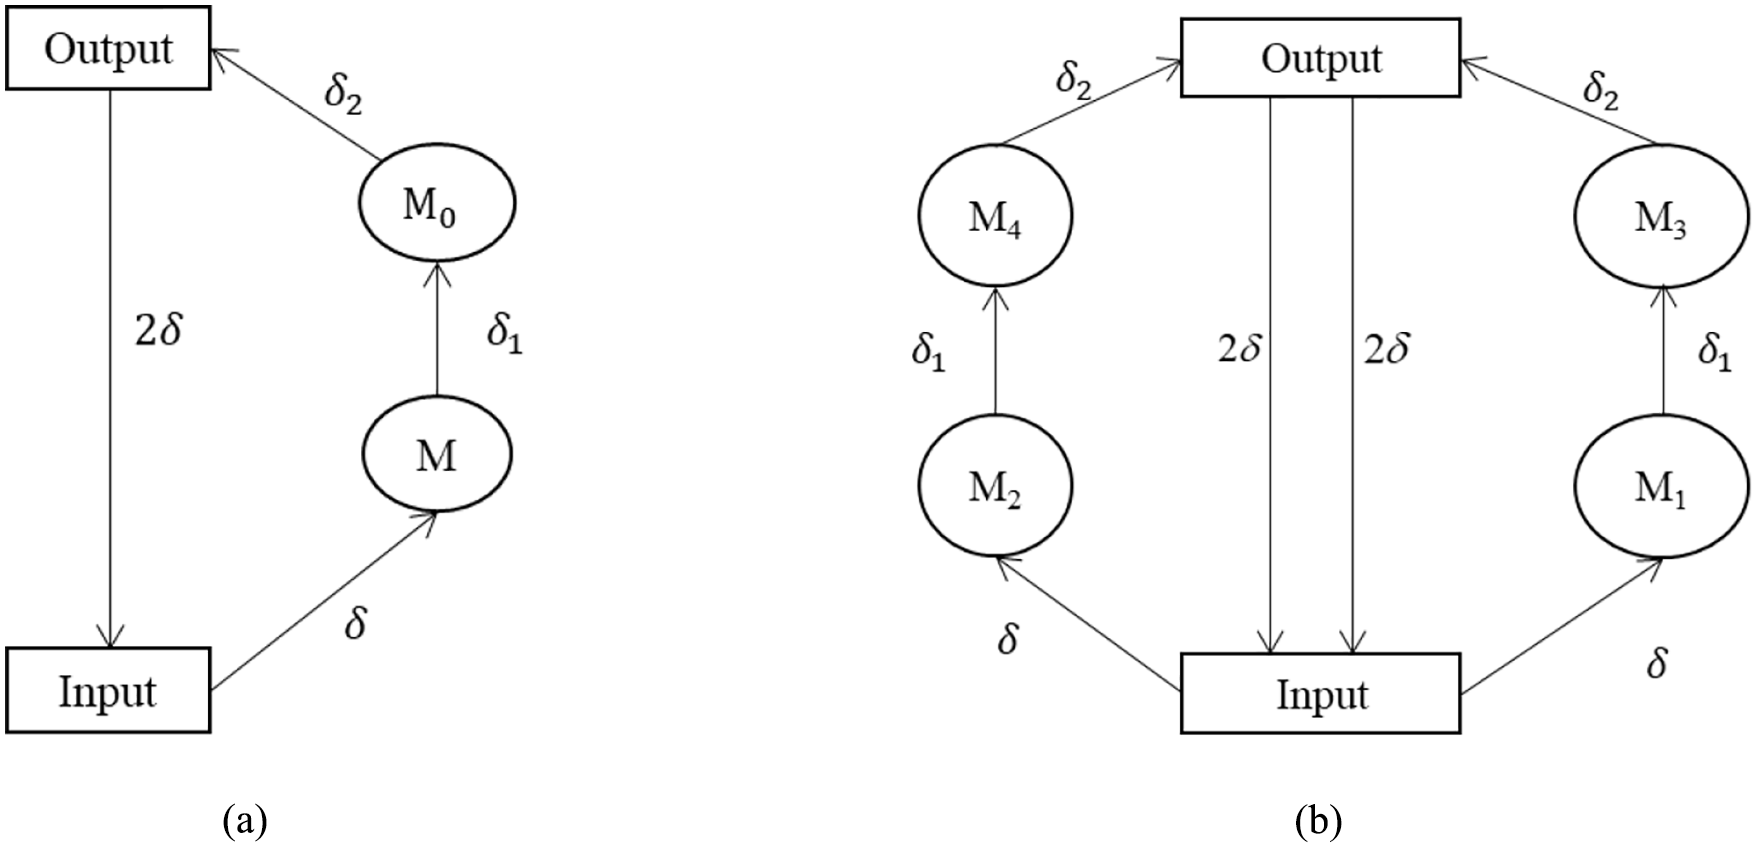
Work sequence of one and two broaching machines: (a) work sequence of one broaching machine and (b) work sequence of two broaching machines.
For production cell of ACCP with two broaching machines, the sequence (as seen in Figure 5(b)) starts with the movement of the robot at the input. The state of the system was expressed using
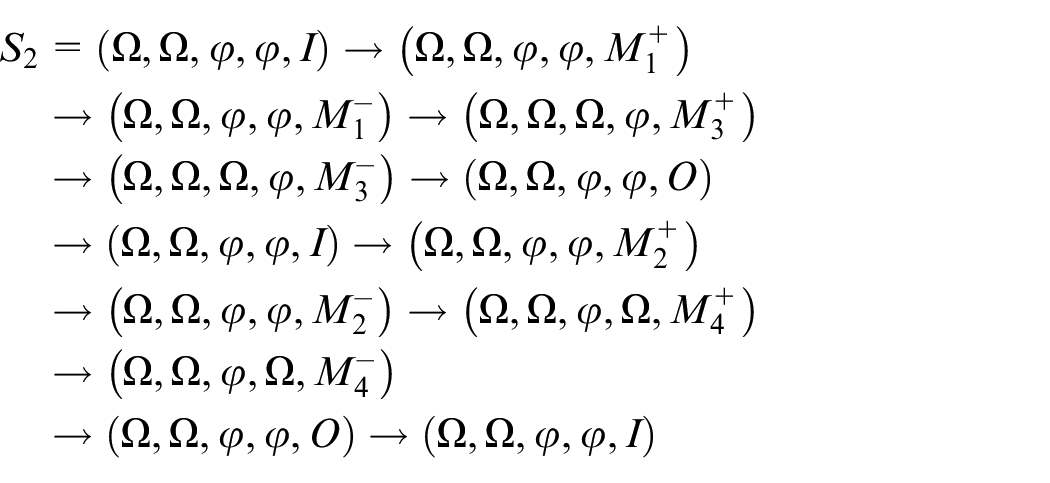
S
2 starts with the movement of the robot at the input. Before the sequence starts, there should be work pieces being processed in
Based on the activity and behavior analysis, the sequence time of manual work and robotic work was measured and listed in Tables 1 and 2. It was defined that when the production line did not contain oil shedding machine,
Robotic work sequence time.
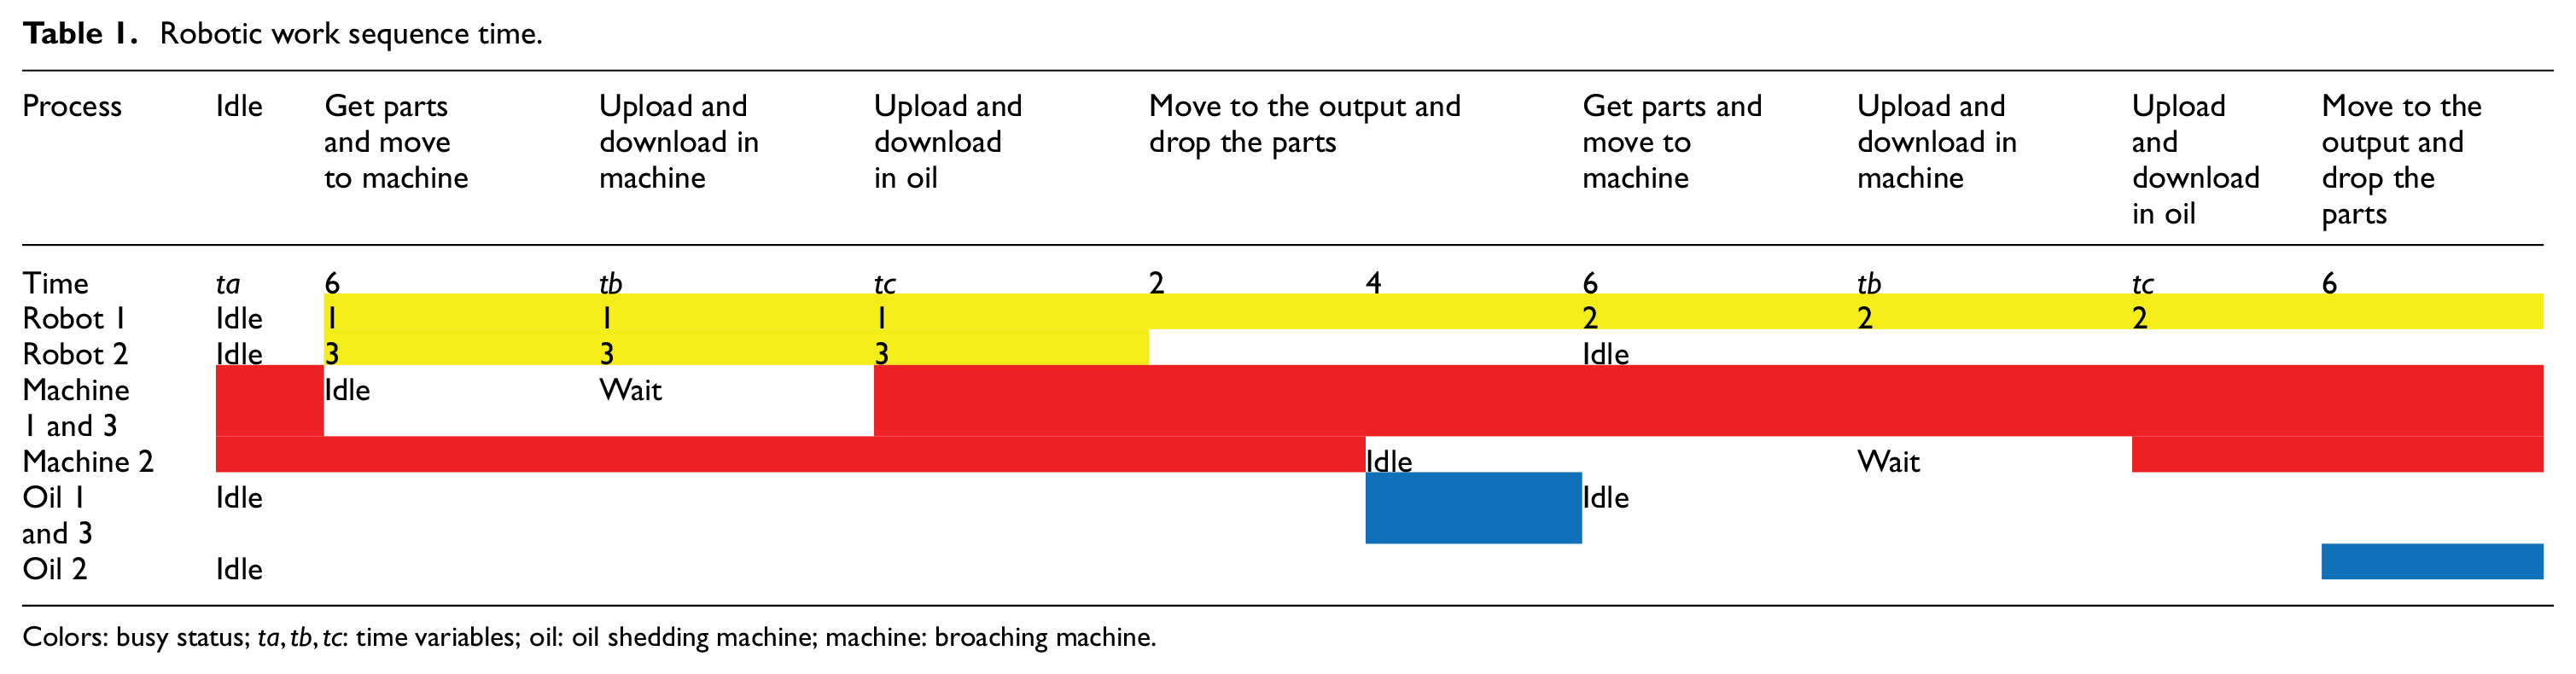
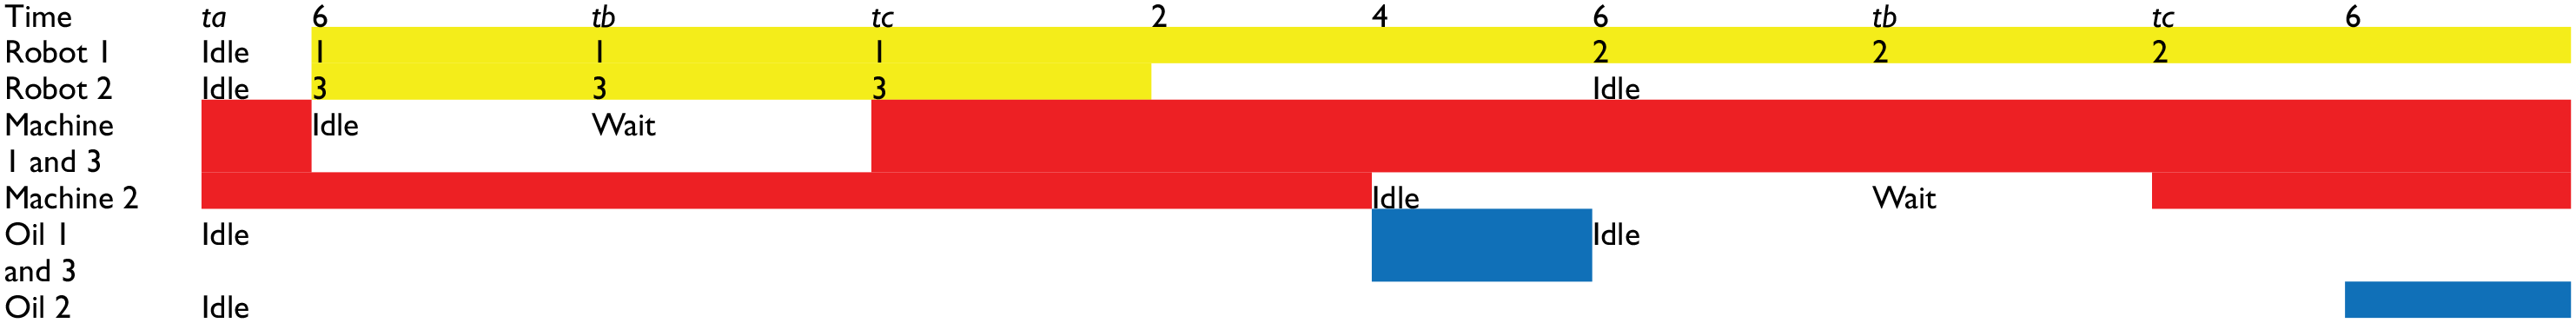
Colors: busy status;
Manual work sequence time.
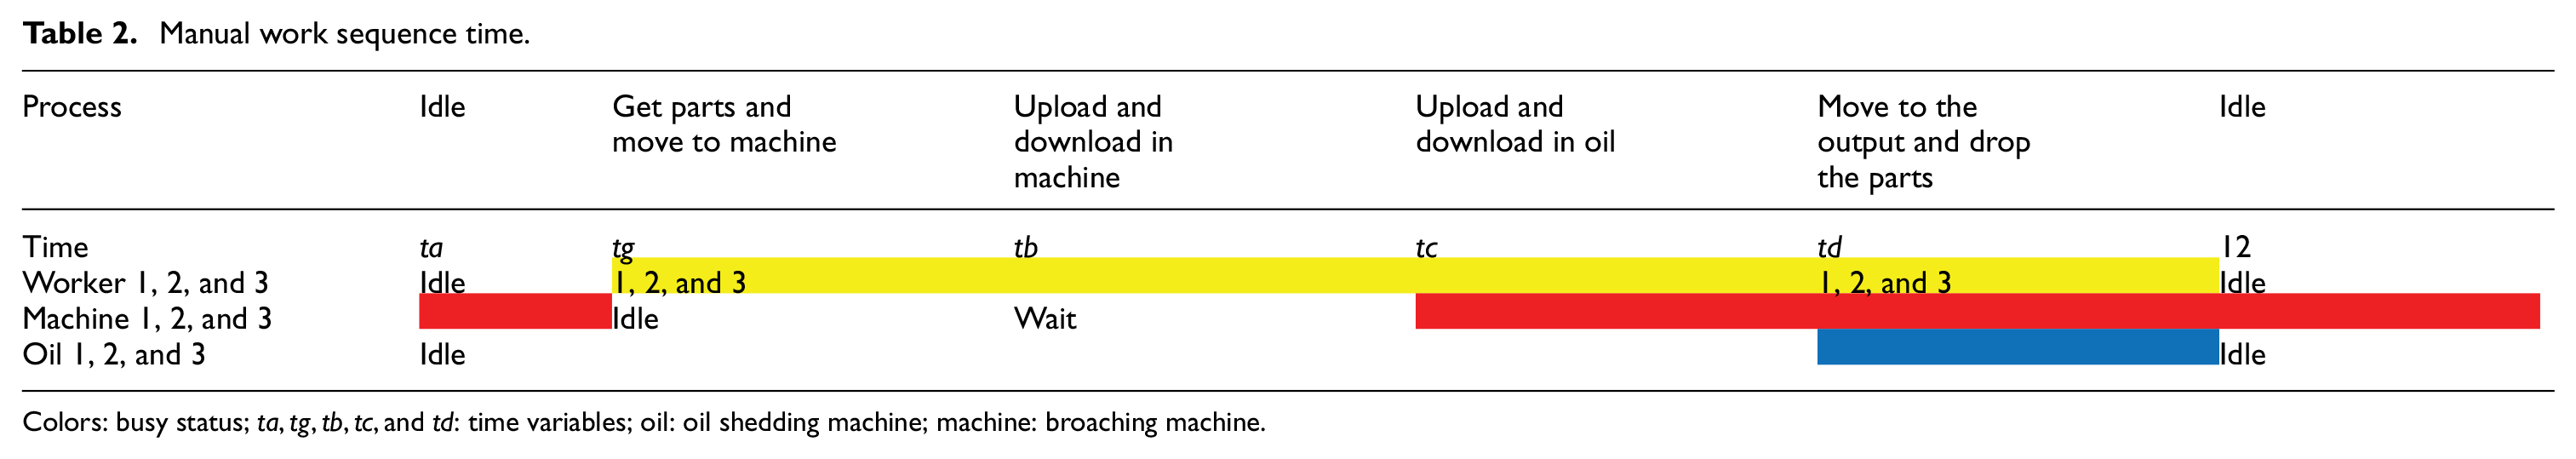

Colors: busy status;
The time allocation for robotic production line scenarios including oil shedding machine is shown in Table 1. The first scenario was in the six-claw robot operation scenario:
The time allocation for the manual production line scenario including oil shedding machine was shown in Table 2:
DES for production scenario
In this case study, there were three production scenarios of ACCP, that is, manual operation, three-claw robots’ operation, and six-claw robots’ operation. Every time three parts arrived on each line and the interval time was about 17 s which was uncertain. DES method programmed by using C++ on computer was used to simulate the production of the three scenarios. The flowchart of DES program is shown as Figure 6. The uncertainties including arriving time and manual operation time were random and they could be produced by random function: srand ((unsigned) time (NULL)).
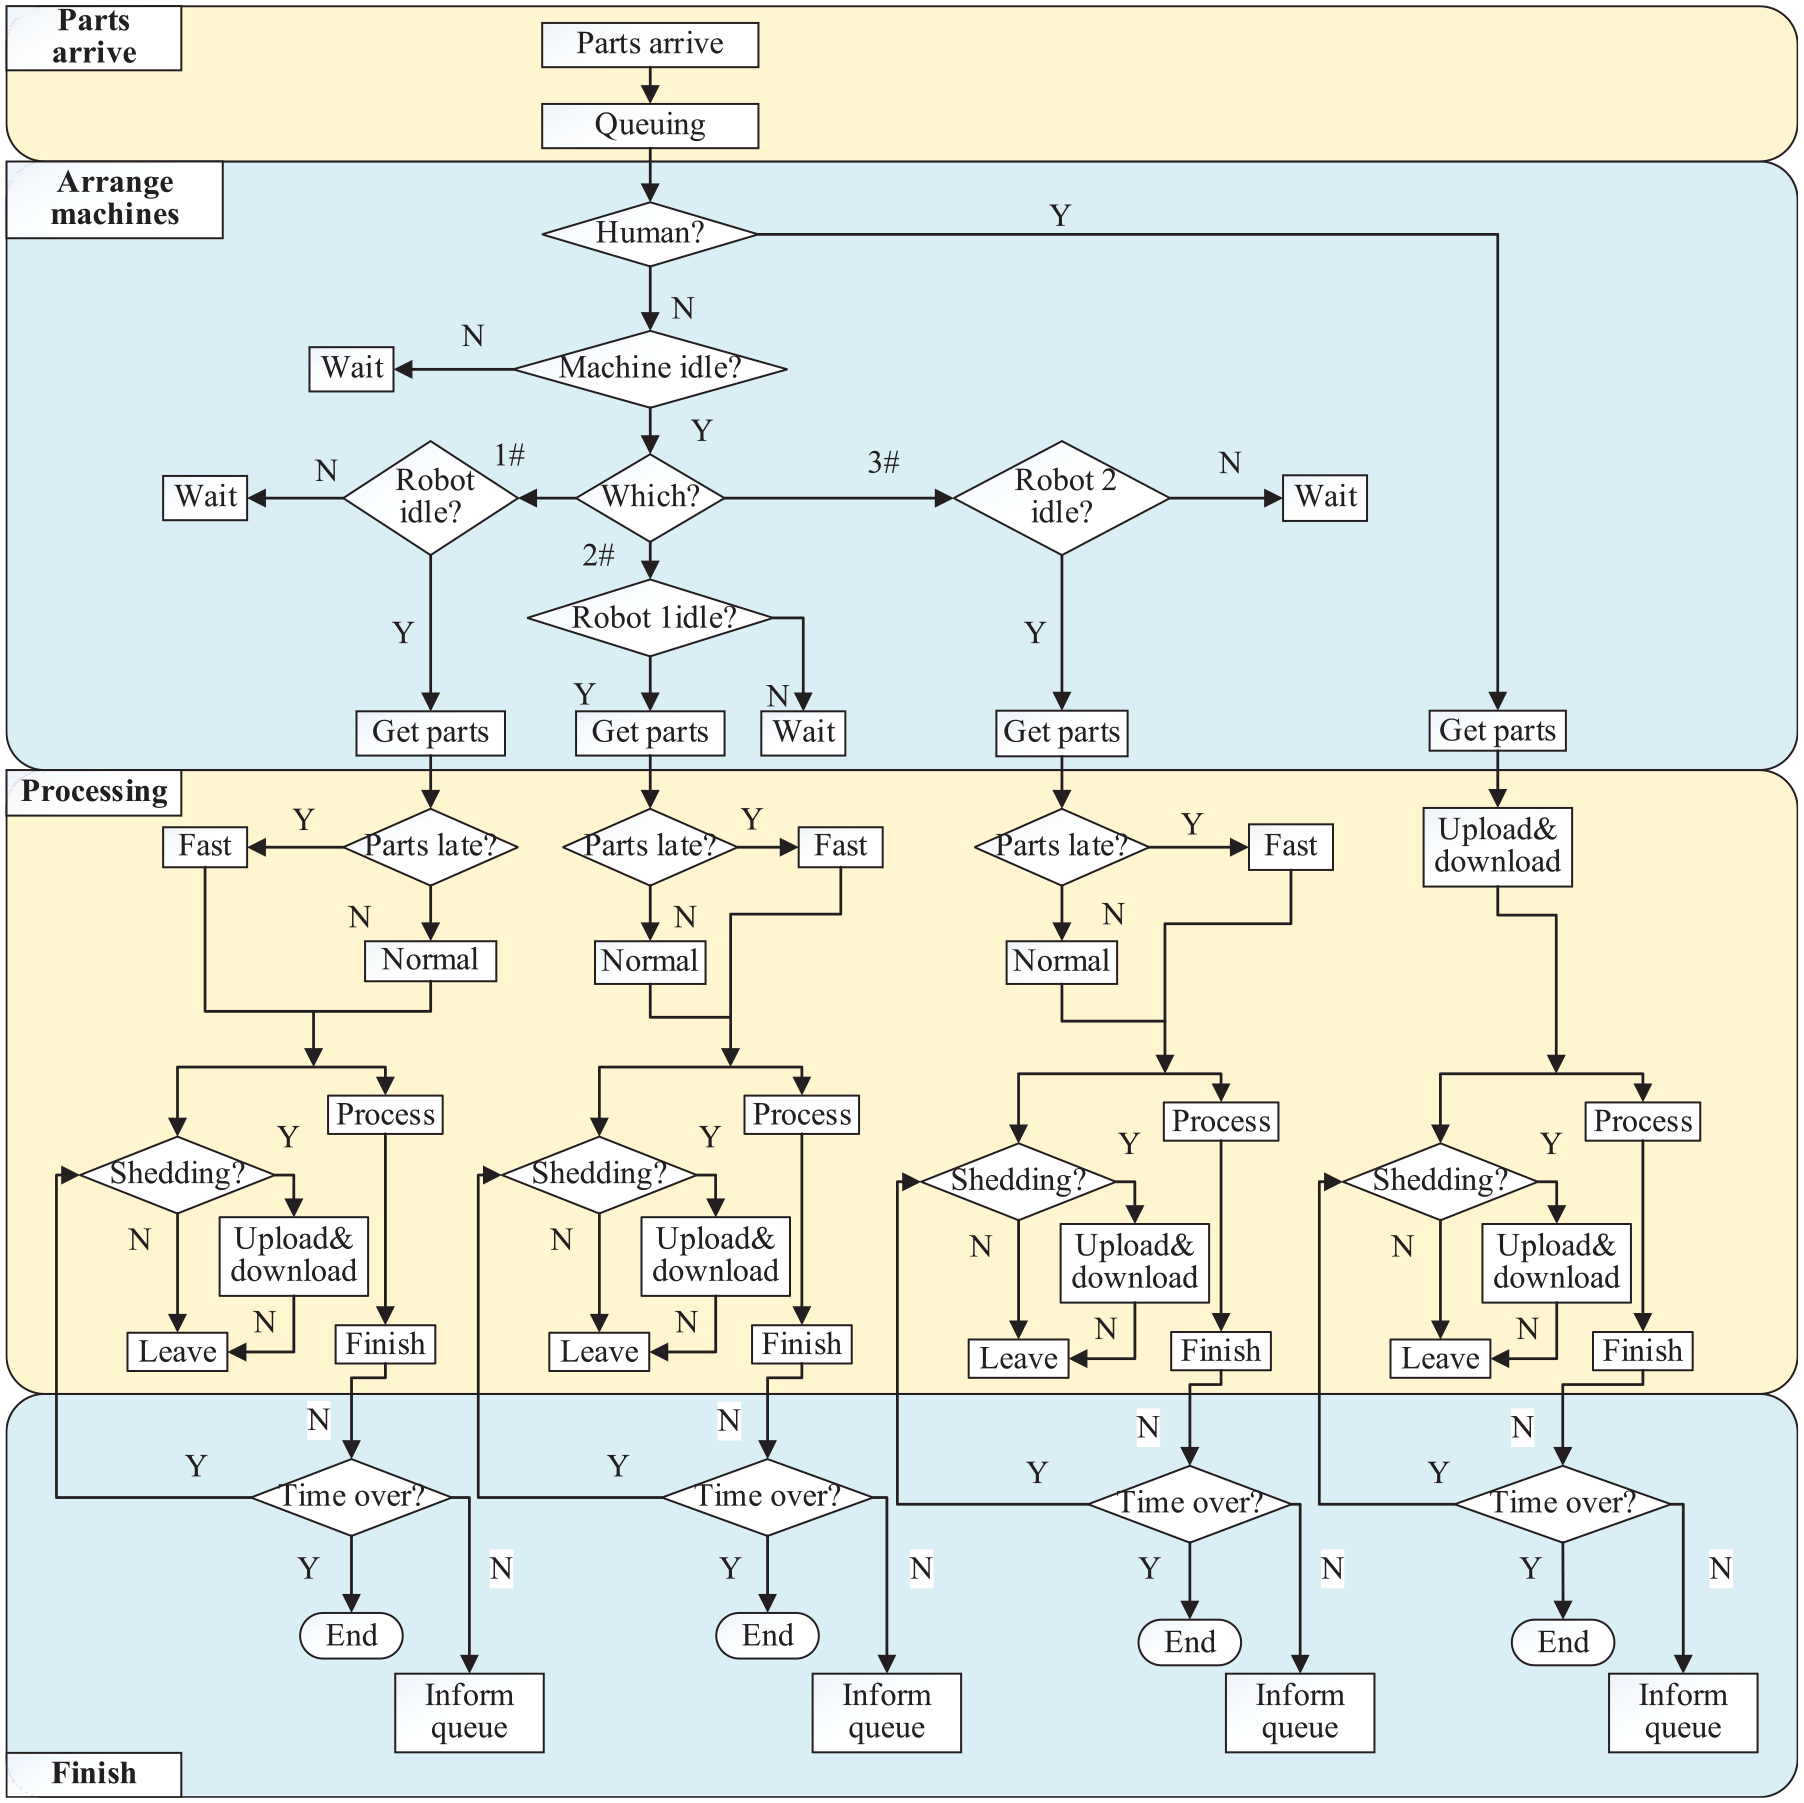
Flowchart of DES program.
Implementation and evaluation
Through the implementation of DES, we got the average waiting time (Figure 7), utilization rate of machines (Figure 8) and workers (Figure 9), and fluctuation of cycle time (Figure 10) in the different scenario.
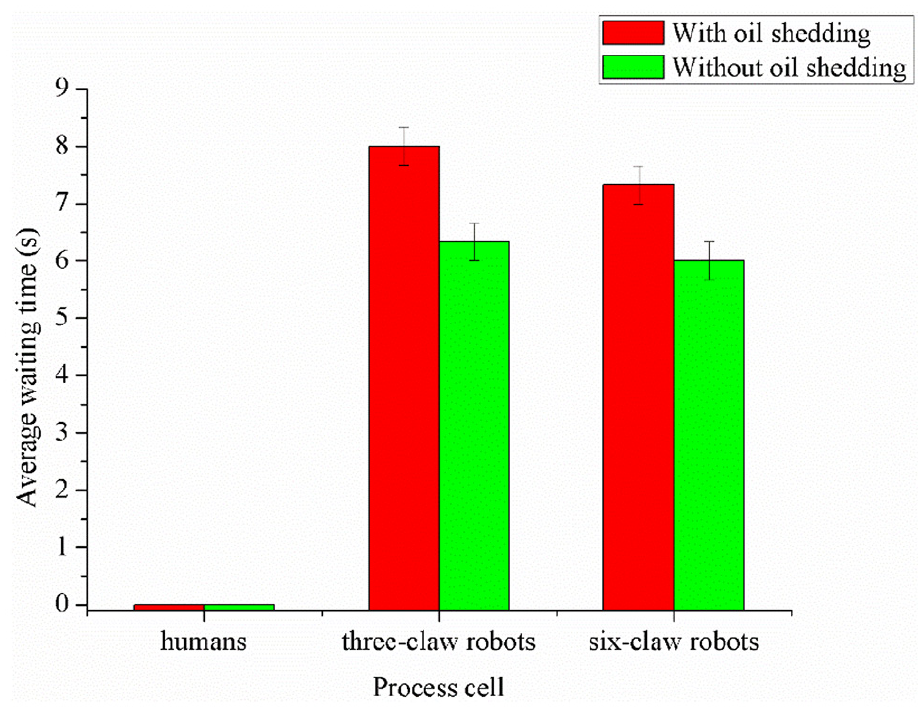
Average waiting time in different scenarios.
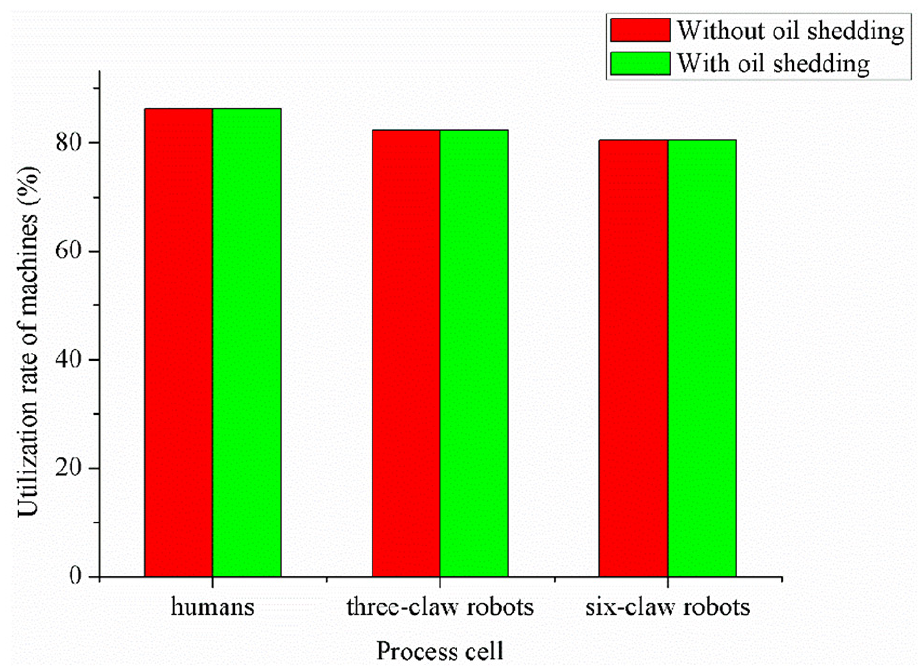
Utilization rate of machines in different scenarios.
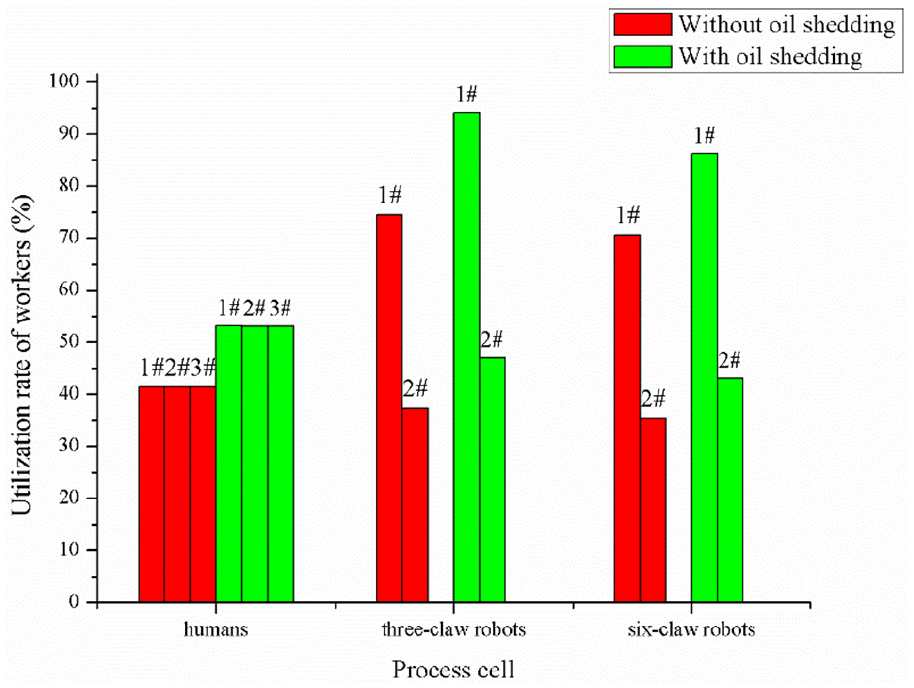
Utilization rate of workers in different scenarios.
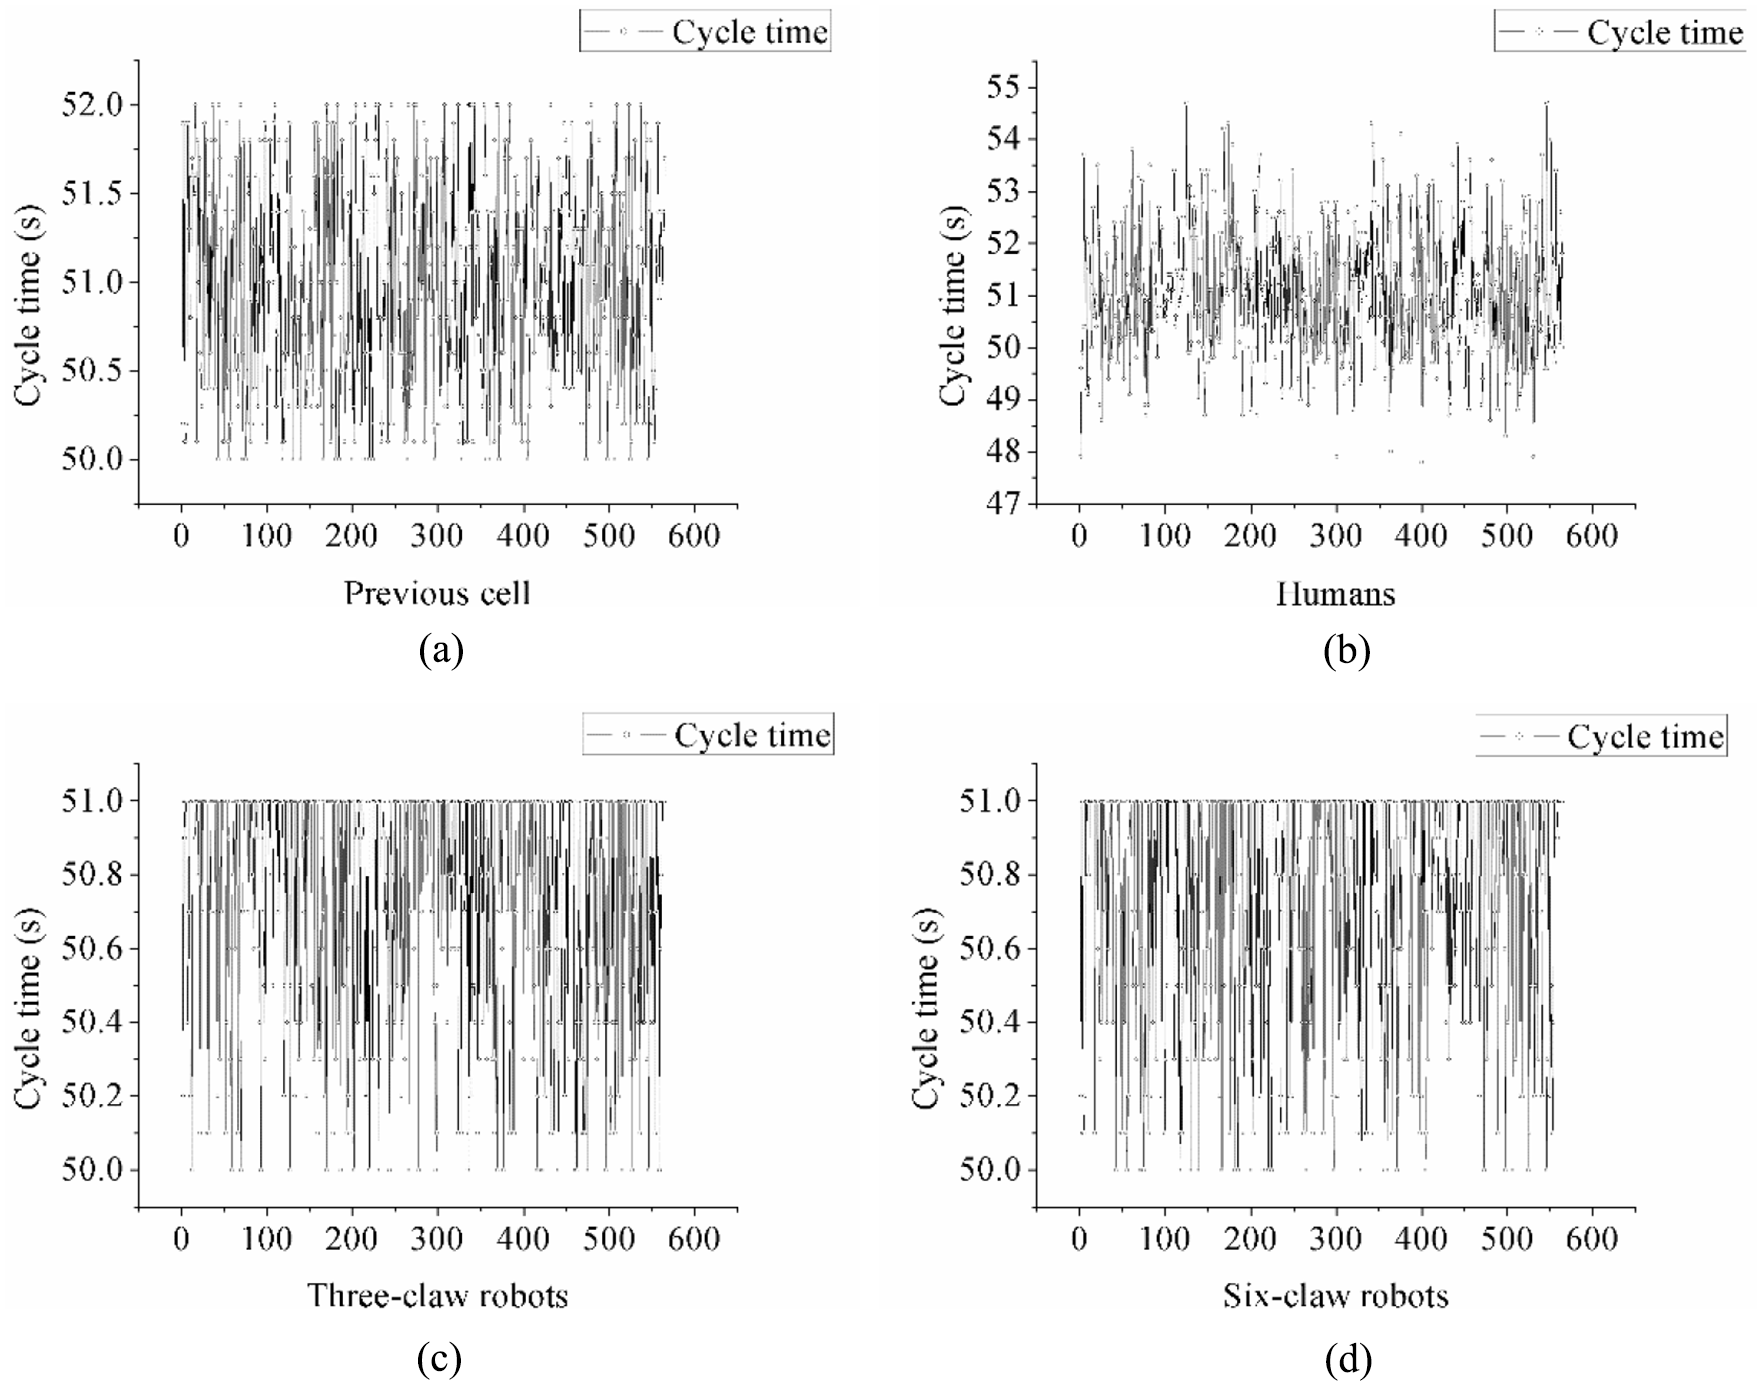
Fluctuation of cycle time in different scenarios: (a) previous cell scenario, (b) human cell scenario, (c) three-claw robot cell scenario, and (d) six-claw robot cell scenario.
The average waiting time of manual operation was the minimum and the three-claw robot operation was the maximum. The values increased when the oil shedding machines were added. The humans had the biggest utilization rate of machines and the six-claw robots had the smallest, which also illustrated that the machines can have more rest in the six-claw robot cell at the same productivity level. The utilization rate of broaching machines was the same for the same type of cell, no matter if there were shedding machines added. For the utilization rate of workers, the three-claw robots were the busiest and the humans were the idlest. When the oil shedding machines were added, all types of workers became busier but the value of three-claw robot 1 ascended to 94.1%, which was not good for the life.
The fluctuation of cycle time in the previous cell varies from 50 to 52 s which would influence the cycle time of the next process cell. The fluctuation of the manual increased from 47.3 to 55 s. Under the robotic operation cell scenario, the fluctuation was controlled, and the cycle time was limited between 50 and 51 s through the closed-loop Kaizen system.
After the application of oil shedding machines, the oil waste was eliminated. To test its effect, 10 work pieces were continuously weighed before and after the application of oil shedding machines. The comparison of deoiling effect is shown in Table 3.
Comparison of deoiling effect.
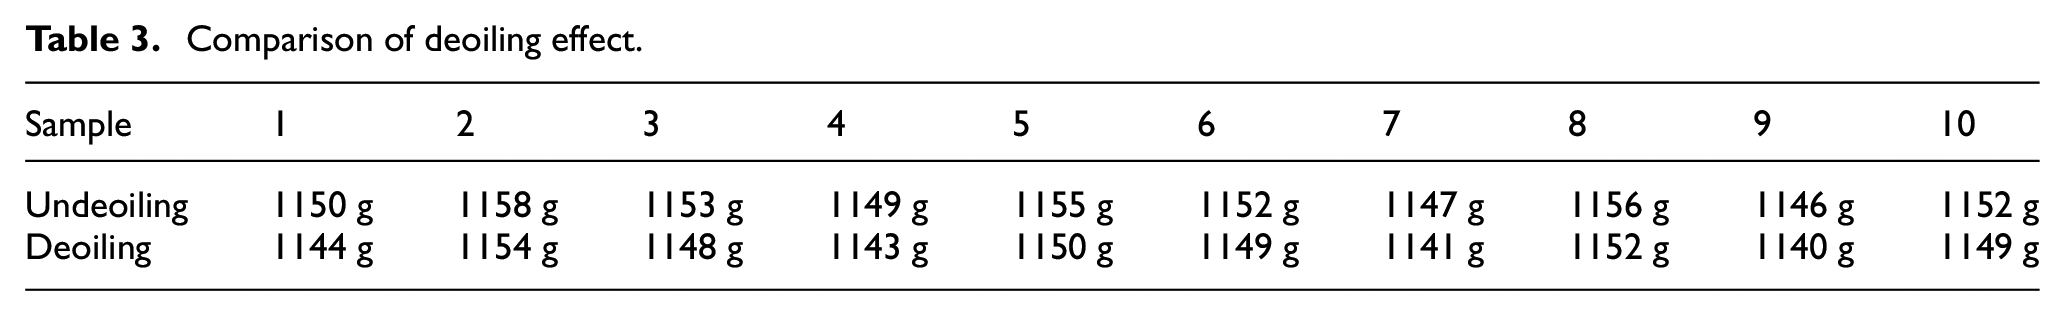
Paired t-test was used to determine the effect of deoiling. The data were of normal distribution and the variance was equal. The results are shown in Figure 11. The effect of throwing oil was remarkable, and the average weight was 4.8 g lighter after throwing oil.
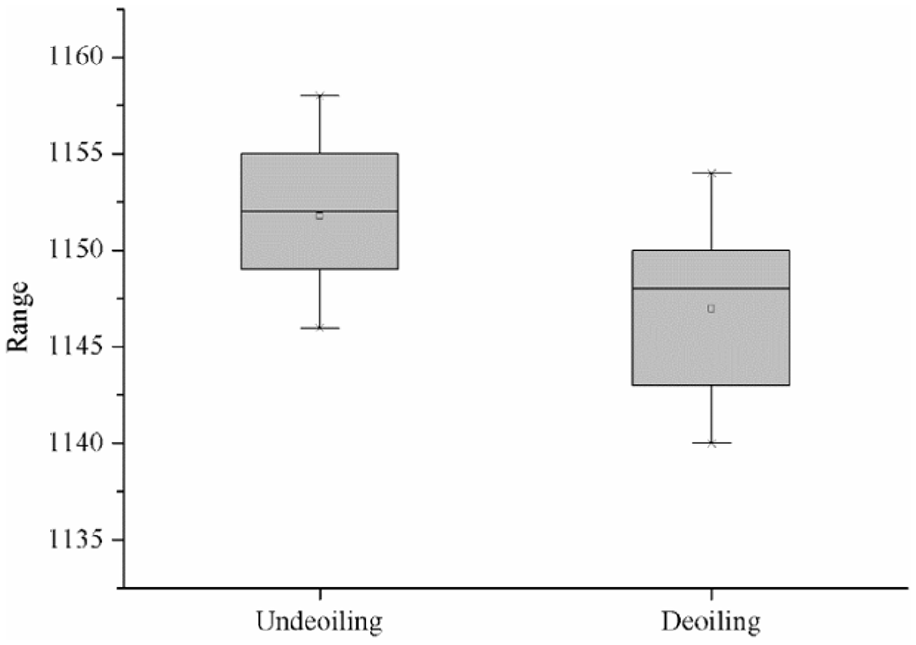
Comparison chart of t-test.
The recycling of the oil was between 3 and 5 g for every product of different types and the average was 4g. The oil price was about 11.69 RMB/kg and the production output was 5.75 million pieces every year.
Total weight of the oil could be saved per year

Total cost of the oil could be saved per year

The oil waste was successfully eliminated without decrement of productivity. At the same time, the unqualified rate also decreased from 1 to 0.1 every 10,000 through this method.
Discussion
From the results, it was obvious that the closed-loop Kaizen system could overcome the fluctuation brought by previous cell and made the production line more stable. Represented by manual, the non-dynamic system accumulated the fluctuation and made the production line more unstable. The average waiting time for manual was low and the utilization rate of broaching machines was good, but the utilization rate of manpower was too low. At the same time, the cost of manpower was 276,000 RMB/year but the cost of robots was 112,000 RMB/year. Three workers were replaced by two robots; the labor cost could be reduced by 59%.
The ability of controlling fluctuation of cycle time was the same for three-claw robots and six-claw robots. The average waiting time in six-claw robot cell was smaller than in three-claw robot cell. Although the utilization rate of machines in six-claw robot cell was 2% smaller than in three-claw robot cell, the utilization rate of robot in six-claw robot cell was 4% smaller than in three-claw robot cell, which said that the six-claw robot had more time to deal with added machines. When the oil shedding machines were added to the cell, the busy rate of six-claw robot only increased from 70.6% to 86.3%, but the three-claw robot’s busy rate was increased to 94.1%, which was too high. Therefore, the six-claw robot should be chosen.
When the oil shedding machines were added to the process cell, the average waiting time of work pieces would increase a little but the change could be neglected as to the cycle time. The utilization rate of broaching machines would not change and the utilization rate of robot would still be in reasonable range. Moreover, the cycle time of the process cell would not be affected, if the oil shedding machines were added. Therefore, the oil shedding machines were safe to use.
Based on the analysis of DES results, the process optimization was carried out by the decision-makers and the effect of the optimization was validated by the closed-loop system. Through twice-cycle running of the system, the process optimization of the production line achieved the expected results including the stability of the cycle time.
Conclusion
This article proposed a closed-loop Kaizen system with DES capable of continuously improving the production line and automatically controlling the fluctuation of the production line caused by uncertainties. The contributions of this article were summarized as follows:
A framework integrating the merits of Kaizen method and DES method to continuously optimize the production line was proposed.
A closed-loop Kaizen system which had the capability of automatically controlling the fluctuation of the production line caused by uncertainties was built.
A half-automatic system which simulated the results of reform and validates the results of optimization was displayed. A direction for the full automation of process optimization was indicated.
The feasibility of the proposed approach was validated by a case study. Through the application of the closed-loop system, a successful process optimization was displayed. The replacement of humans, the adoption of six-claw robots, and the addition of oil shedding machines were all indicted and validated by the system, and the fluctuation of cycle time was also controlled in real time.
Although the study demonstrated potentials of the closed-loop Kaizen system with DES, there are still more research that need to be done. The method is only based on the actual situation of this study. Some more complex applications and rules need to be further explored. Future research will focus on the automation of the closed-loop Kaizen system.
Footnotes
Appendix 1
Acknowledgements
The authors would like to thank Shanghai Institute of Producer Service Development (SIPSD), Shanghai Research Center for industrial Informatics (SRCI2).
Declaration of conflicting interests
The author(s) declared no potential conflicts of interest with respect to the research, authorship, and/or publication of this article.
Funding
The author(s) disclosed receipt of the following financial support for the research, authorship, and/or publication of this article: This research was supported by the National Natural Science Foundation of China (Grant No. 71632008).