
Abstract
Pore size, external shape, and internal complexity of additively manufactured porous titanium scaffolds are three primary determinants of cell viability and structural strength of scaffolds in bone tissue engineering. To obtain an optimal design with the combination of all three determinants, four scaffolds each with a unique topology (external geometry and internal structure) were designed and varied the pore sizes of each scaffold 3 times. For each topology, scaffolds with pore sizes of 300, 400, and 500 µm were designed. All designed scaffolds were additively manufactured in material Ti6Al4V by the direct metal laser melting machine. Compression test was conducted on the scaffolds to assure meeting minimum compressive strength of human bone. The effects of pore size and topology on the cell viability of the scaffolds were analyzed. The 12 scaffolds were ultrasonically cleaned and seeded with NIH3T3 cells. Each scaffold was seeded with 1 million cells. After 32 days of culturing, the cells were fixed for their three-dimensional architecture preservation and to obtain scanning electron microscope images.
Introduction
Rapid advancements in additive manufacturing technologies and the emergence of highly sophisticated three-dimensional (3D) modeling and visual programming software have made it possible for scientists and engineers to create microstructures that contain a high level of complexity. 1 Bone tissue engineering is an area where such complexities are used. The promising future of additive manufacturing in bone tissue engineering has gotten the technology a lot of attention from, not only the medical industry but also, the government. 2
Bones are important parts of the human body. They not only shape the body, but also stabilize it by providing the support and structure it needs. Without bones, our vital organs throughout the body could not be protected. 3 Different bone disease, accidents, explosions (e.g. in military cases), and many other incidents could result in a bone loss. It has become a common practice to replace the lost or malfunctioning bones with titanium-based implants. 4
Human bone is made up of two different types of bones with different parameters such as pore sizes, porosity percentage, and other dimensional specification. The outer shell of the bone is called cortical, compact bone and the inner part of the bone is called trabecular, spongy bone. 5 Cortical bone has a porosity of 3%–12% and the trabecular bone has a porosity of 50%–90% and pore sizes of 1 mm. 6 Spongy bone is lightweight, highly porous, and rich in blood vessels and bone marrow. 7 Through further studying of the bone structure, we found out that the compact bone is made up of cylindrical structures called osteon. Every osteon is made up of different layers known as concentric lamellae averaging between 3 and 7 μm in thickness, 8 and is organized around a central canal called Haversian canal. 9 Collagen fibers are fibers responsible for forming the matrix of the bone. The fibers orientation angle changes from one layer to another within an osteon to create more tensile strength in the bone. 3 Collagen fibers orientation is unidirectional ranging from 0° to 180° with a changing angle of approximately 7.5°. 5 In between the layers (concentric lamellae) there are cells that are responsible for communicating the changes in the body to other cells. The reason for such a communication is so that the body can adjust the mechanical properties of the bone required at any given time. 10 The compact bone is so dense that the cells will have to have small canals to communicate with each other and deliver the necessary nutrition. The cells between each layer of an osteon are called osteocyte which live in a cavity called lacunae. 11 Every osteocyte is connected to another by small processes called canaliculi which measure 23–50 μm in length and 100–400 nm in diameter. 12
Biocompatibility of titanium has made a good option for human cells to grow in. 2 Scaffolds for the development of bones should be designed similar in shape and structure to the human bone to optimize their integration into neighboring tissue. 13
For the scaffolds to function as true replacements for human tissue, they must meet special requirements specific to each patient. Such requirements include the shape of the scaffold, its resistance to mechanical loads, and its compatibility with the patient’s biological requirements. To meet the requirements, scaffolds are usually designed as porous structures with specific pore size and shape and complex internal structure. Porous structures create an environment where the cells could grow and nutrients are transported from one cell to another while maintaining the desired resistant for mechanical loads. 14
Before the emergence of advanced manufacturing techniques such as additive manufacturing, porous scaffolds were manufactured using traditional manufacturing techniques such as fiber bonding, molding, foaming, and so on. 15 Conventional manufacturing techniques worked, but they were limited. Because they were done manually, there was very little control over what the final result would look like. The overall geometry, as well as the pore size, was dictated by the process, and the manufacturer had little to no control over it. Scaffolds manufactured using traditional manufacturing techniques were not optimal. 16 To gain better control over the overall architecture of the scaffolds and reduce the variations in pore sizes, 3D printing methods were proposed. 17 These methods allowed for the creation of customized scaffolds. 18
Advanced 3D modeling tools, and additive manufacturing techniques, together, have enabled researchers and scientists to experiment with customized scaffolds of different pore width. The mechanical strength and biological functionality of the scaffolds are highly affected by the size and shape of the pores and their correlation to each other. 19
Some studies suggest a direct correlation between the pore size of a scaffold and the bone ingrowth. They believe, larger pore size, and higher porosity increase the chance of bone ingrowth. 5 However, other studies found the opposite to be true. A group of researchers conducted experiments using scaffolds of pore sizes ranging between 0.45 and 1.2 mm. Warnke’s results showed no pore blockage on pores width of 0.9–1.2 mm. 20 Another study done on additively manufactured titanium sample scaffolds with 300-, 600-, and 900-µm pore size revealed the pore size of 600 µm to have the optimum cell ingrowth. 21
Based on the aforementioned, researchers have different opinions on the relationships between scaffold pore width and their cell viability. The aim of this article is to explore the relationship between pore size, shape, and mechanical property of different additively manufactured porous titanium scaffolds while examining their viability for cell ingrowth. The aim of the work is to find the optimal scaffold design for highest bone ingrowth.
Design of porous titanium scaffolds
The design exploration of different lattice (scaffold) structures started by understanding the minimum and recommended pore sizes, as well as a suggested overall scaffold porosity. The pores needed to be large enough to accommodate for cell size and allow for their migration and movement. The minimum pore was considered to be ∼100 µm. 22 While making sure that the pores met the minimum pore size requirement, the scaffolds were designed to meet the recommended pore size of >300 µm to allow for enhanced new bone formation. An overall porosity of >45% was assured for all scaffolds. 23
Design process and tool
The scaffolds discussed in this article were generated in Rhinoceros®, a 3D modeling software, using Grasshopper™, a visual programming and algorithmic modeling plugin, and IntraLattice, an open source plugin for Grasshopper™ that is used for creating solid lattice structures inside a 3D modeling program. 24
Four built-in cells of IntraLattice, Figure 1(a) to (d), were used to generate the scaffolds. Although the application allows for designing cells with custom topologies, advantage of the built-in cells was taken as they were sufficient for finding the optimum balance between porosity, mechanical behaviors of scaffolds and their correlations with their cell viability. The application is capable of generating lattice structures that conform to any pre-defined or freeform design spaces (non-organic, organic geometry). 25
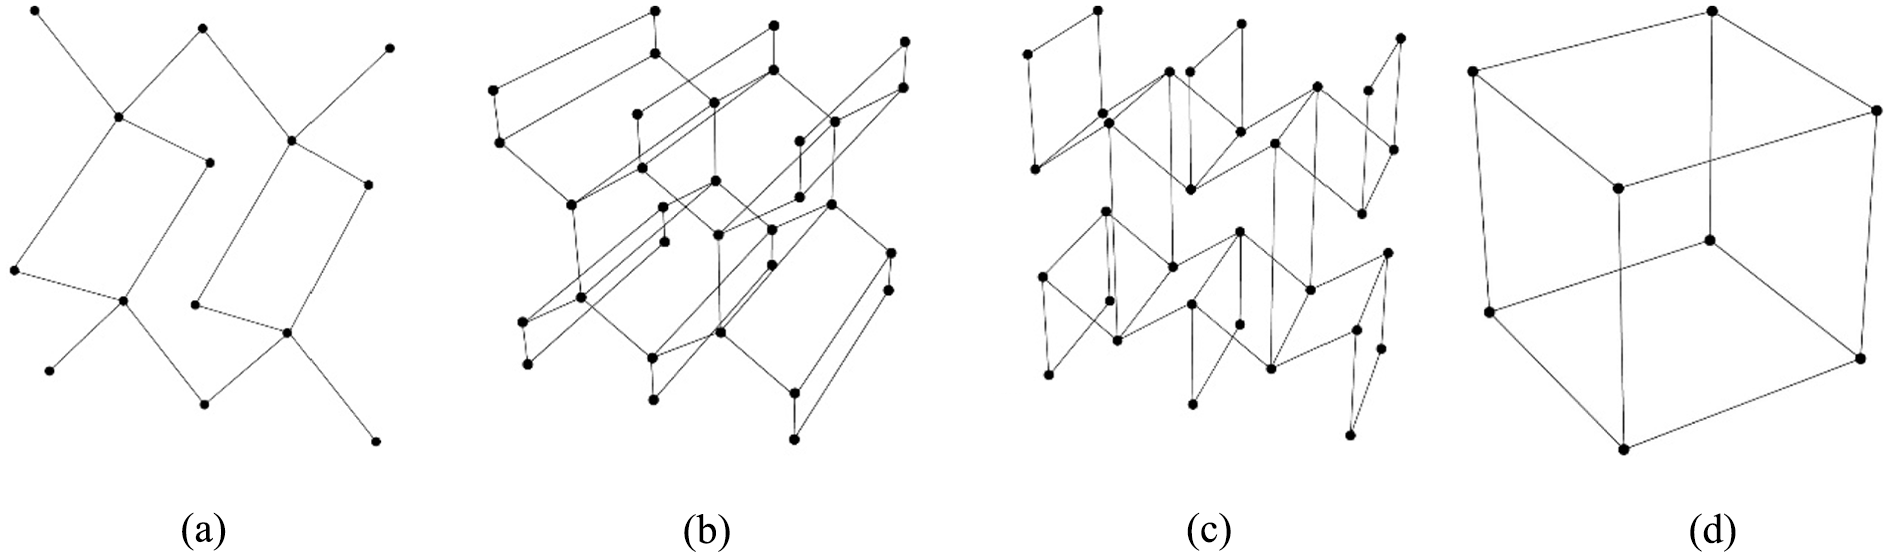
Four IntraLattice built-in cells used to generate scaffolds: (a) Diamond, (b) Honeycomb1, (c) Honeycomb2, and (d) Grid.
The size of each cell is adjustable in X, Y, and Z directions. The default unit size for the built-in cells is one (in each direction). 26 However, using the corresponding components the cell size could be adjusted in all three dimensions, Figure 2(2). The number of cell parameter component will array the cell in a certain direction, by a specified number, Figure 2(3). For example, the number of cells (X) will array the cells in the X direction as many times as the number specified. The same is true for the Y and Z directions. In Figure 2, module 1 defines cell while the orientation of arrows will result in switch between different built-in cells. Three parameters in Module 2 can determine the cell size in X, Y, Z directions which could be set to be adjusted independently of each other or together. Three parameters in module 3 determine the number of cells/modules in each direction X, Y, and Z. Module 4 determines the overall frame for the boundary. Module 5 determines the type of mesh. In this case it is homogeneous. Module 6 defines the radius of the struts.
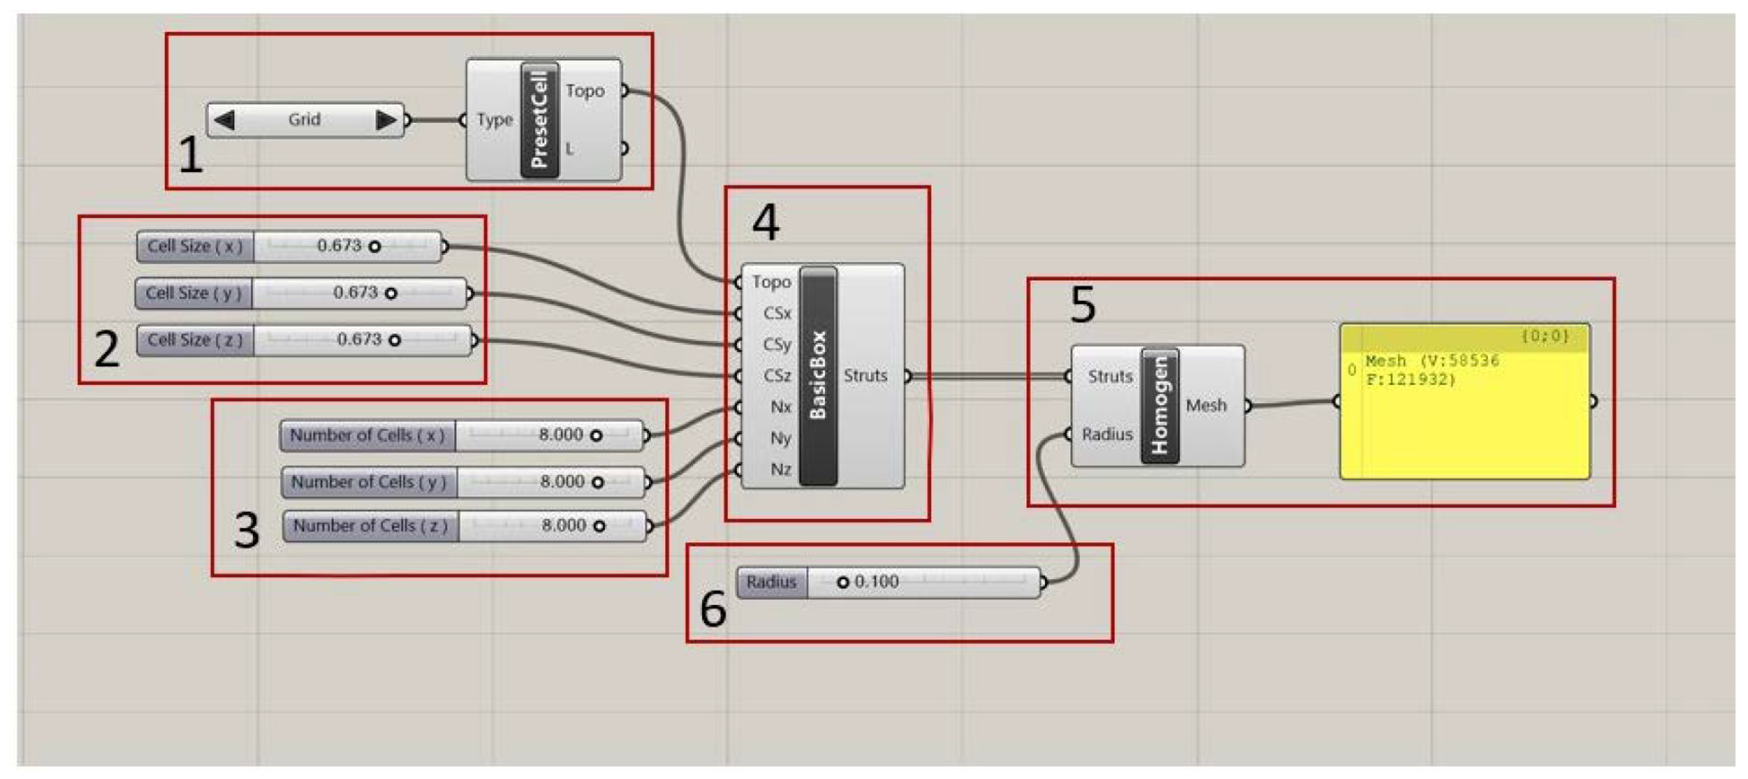
Schematic of IntraLattice modules generating scaffolds in Grasshopper™ environment.
The pore sizes of the scaffolds used in this article ranged from 300 to 500 µm. A range was chosen to find out how pore size and porosity affects cell proliferation. There was no specific reason for choosing this range other than making sure that the smallest pore size met the minimum recommended pore size of >300 µm. 27 The strut radius for all of the scaffolds is a constant of 0.1 mm which results in a strut with a 0.2 mm in diameter. The size of the radius was chosen based on the capabilities and resolution of direct metal laser melting (DMLM) machine, Concept Laser M2 cusing metal 3D printer. Keeping the radius, the same throughout all the scaffolds, cell sizes were adjusted and fine-tuned in all three directions using the cell parameters in IntraLattice.
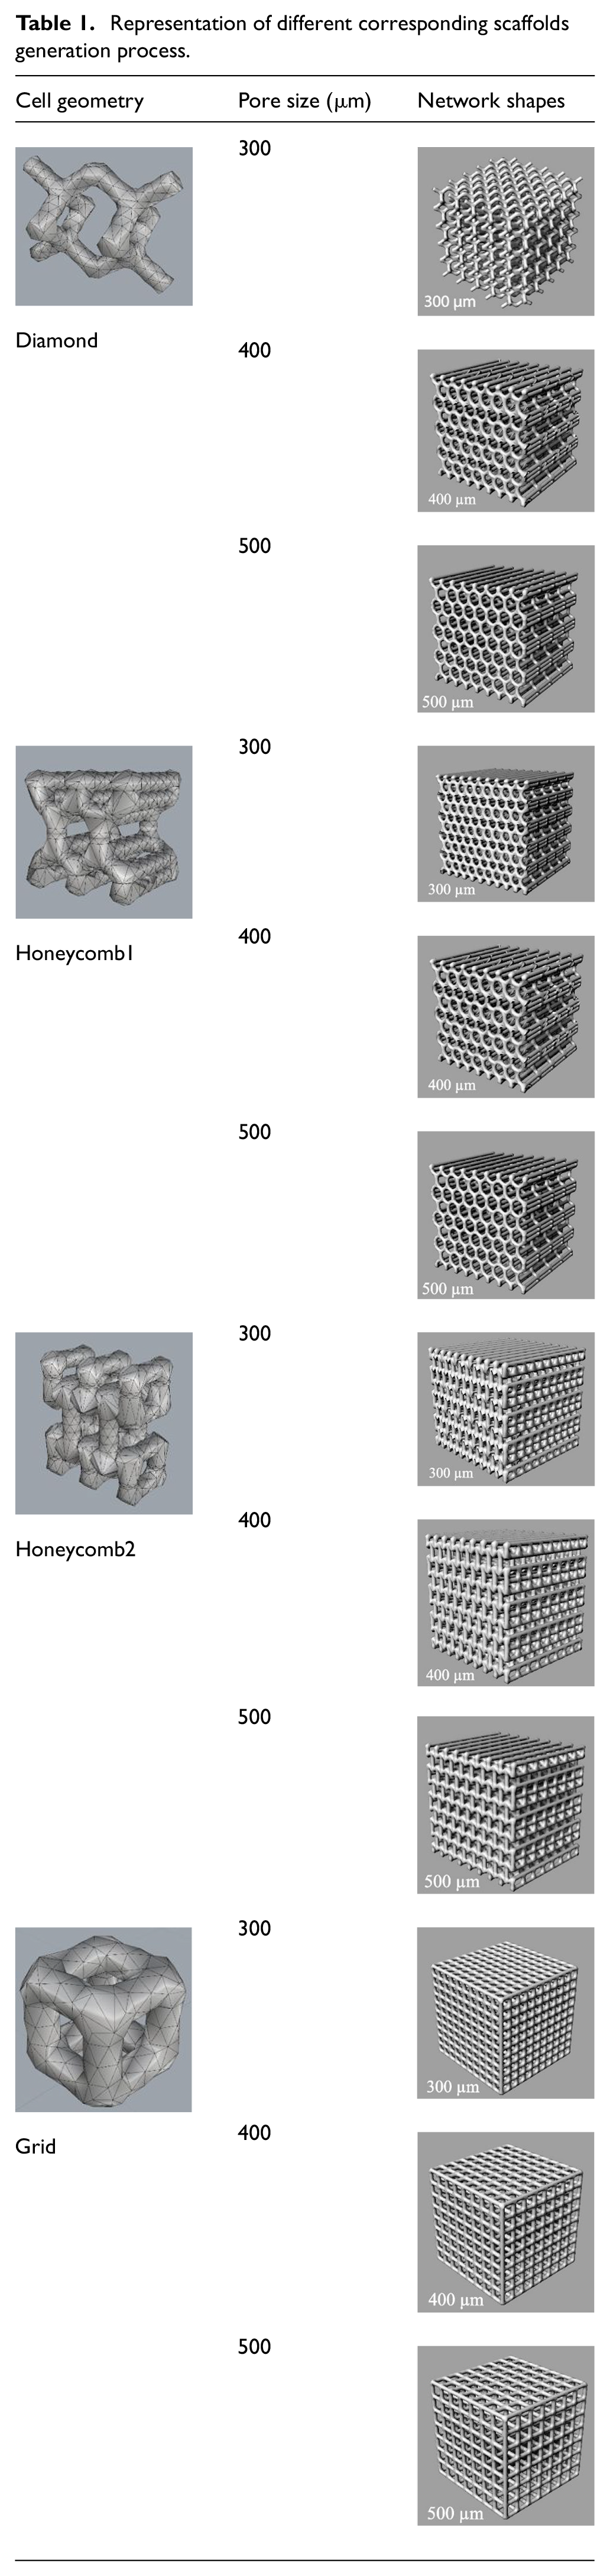
Table 1 is a visual representation of the process taken to design a scaffold with three different pore sizes. It shows the parameters used to create each specific pore size and visualizes the corresponding scaffold generated using that specific cell size. By adjusting the appropriate parameters, three different pore sizes were generated using the same cell topology, images under cell geometry section. As previously mentioned, the radius was kept at 0.1 mm for all scaffolds. Change in cell size changed the pore size, which resulted in the generation of different pore sizes. The number of cells was adjusted in all three directions to create scaffolds that were approximately 5 mm in all directions, shown in column of network shapes in Table 1. The pore size of 300, 400, and 500 µm on each scaffold show that it was generated using the corresponding cell and parameters.
Representation of different corresponding scaffolds generation process.
Pore size and porosity
The pore sizes were determined based on the smallest distance in each cell geometry, illustrated by blue arrow in Figure 3. The following figure illustrates the pore size determination approach for each one of the four cells.
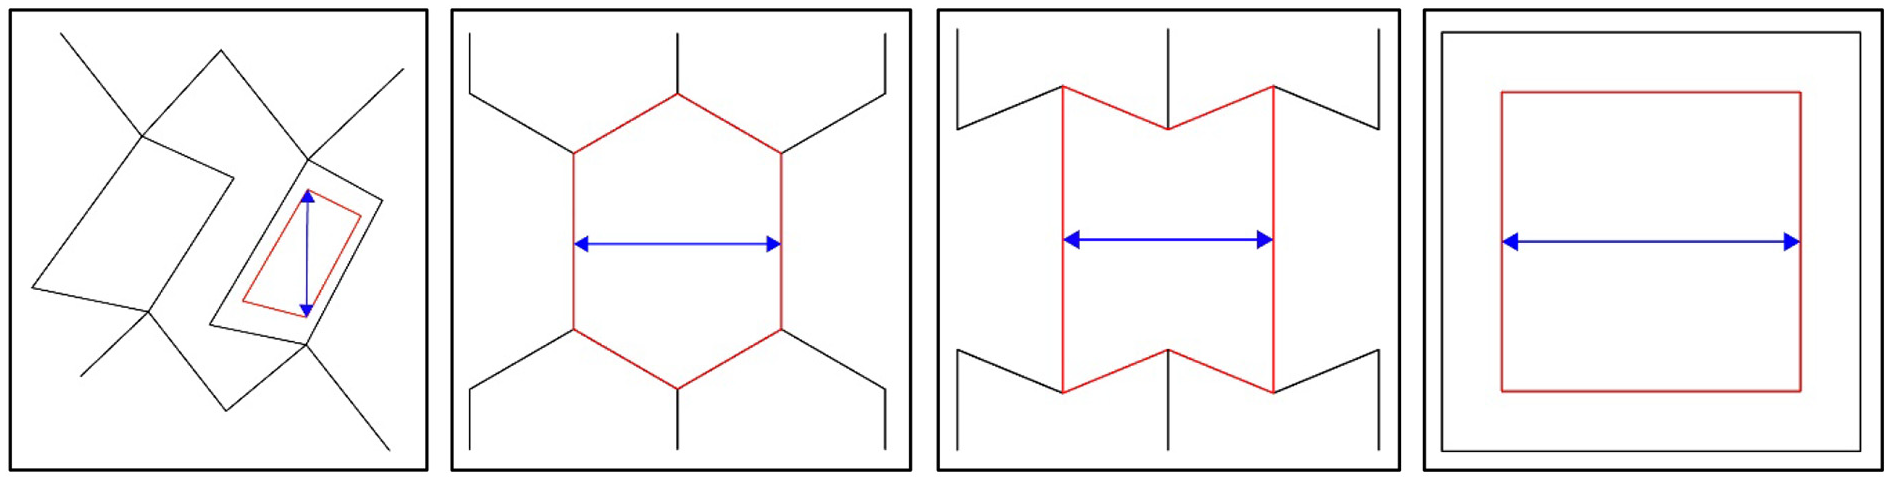
Definition of pore width for all four cell types.
To understand the relationships between cell pore size and overall porosity of corresponding scaffold, the following formulas were used


where
L = (number of cells in X direction) × (cell size in X direction) + 2r
W = (number of cells in the Y direction) × (cell size in the Y direction) + 2r
H = (number of cells in the Z direction) × (cell size in the Z direction) + 2r
r = 0.1 mm, shown in Figure 2(3).
The reason why adding 2r to cell size is that the measurement of cells is from center of strut to center of strut next to it. To get the outside dimension of cell we add 2r. Scaffold volume is taken from the computer aided design (CAD) modeling.
Additive manufacturing of porous titanium scaffolds
DMLM is an additive manufacturing technology that makes it possible to manufacture one-off titanium alloy scaffolds with unique outer shape and internal geometry where human cells could grow. 28 Concept Laser M2 cusing metal 3D printer was used for 3D printing. Metal power is titanium alloy Ti6Al4V with 325 mesh purchased from Dentaurum USA, Langhorne, PA, USA. The layer thickness is 40 µm while scanning speed is 7 m/s and laser power is Fiber laser 200W (cw). 3
Geometrical and dimensional validation
Inverted motorized microscope
The 3D printed scaffolds were taken to Zeiss Axio Observer.Z1 Inverted Motorized Microscope, and inspected for their geometrical and dimensional accuracy. Figure 4 shows the images of titanium scaffolds. Figure 4(a) revealed a pore enlargement of approximately 20% compared with the original CAD model. While Figure 4(b) to (d) also showed some enlargement in the pore size, Figure 4(e) and (f) showed missing links. Figure 4(g) is the top view, and no missing links were observed in this particular scaffold. The holes appeared to be through. Figure 4(h) and (i) are the side views of the scaffold, while Figure 4(g) showed no missing pieces and looked intact and Figure 4(i) showed some missing links at the edge.
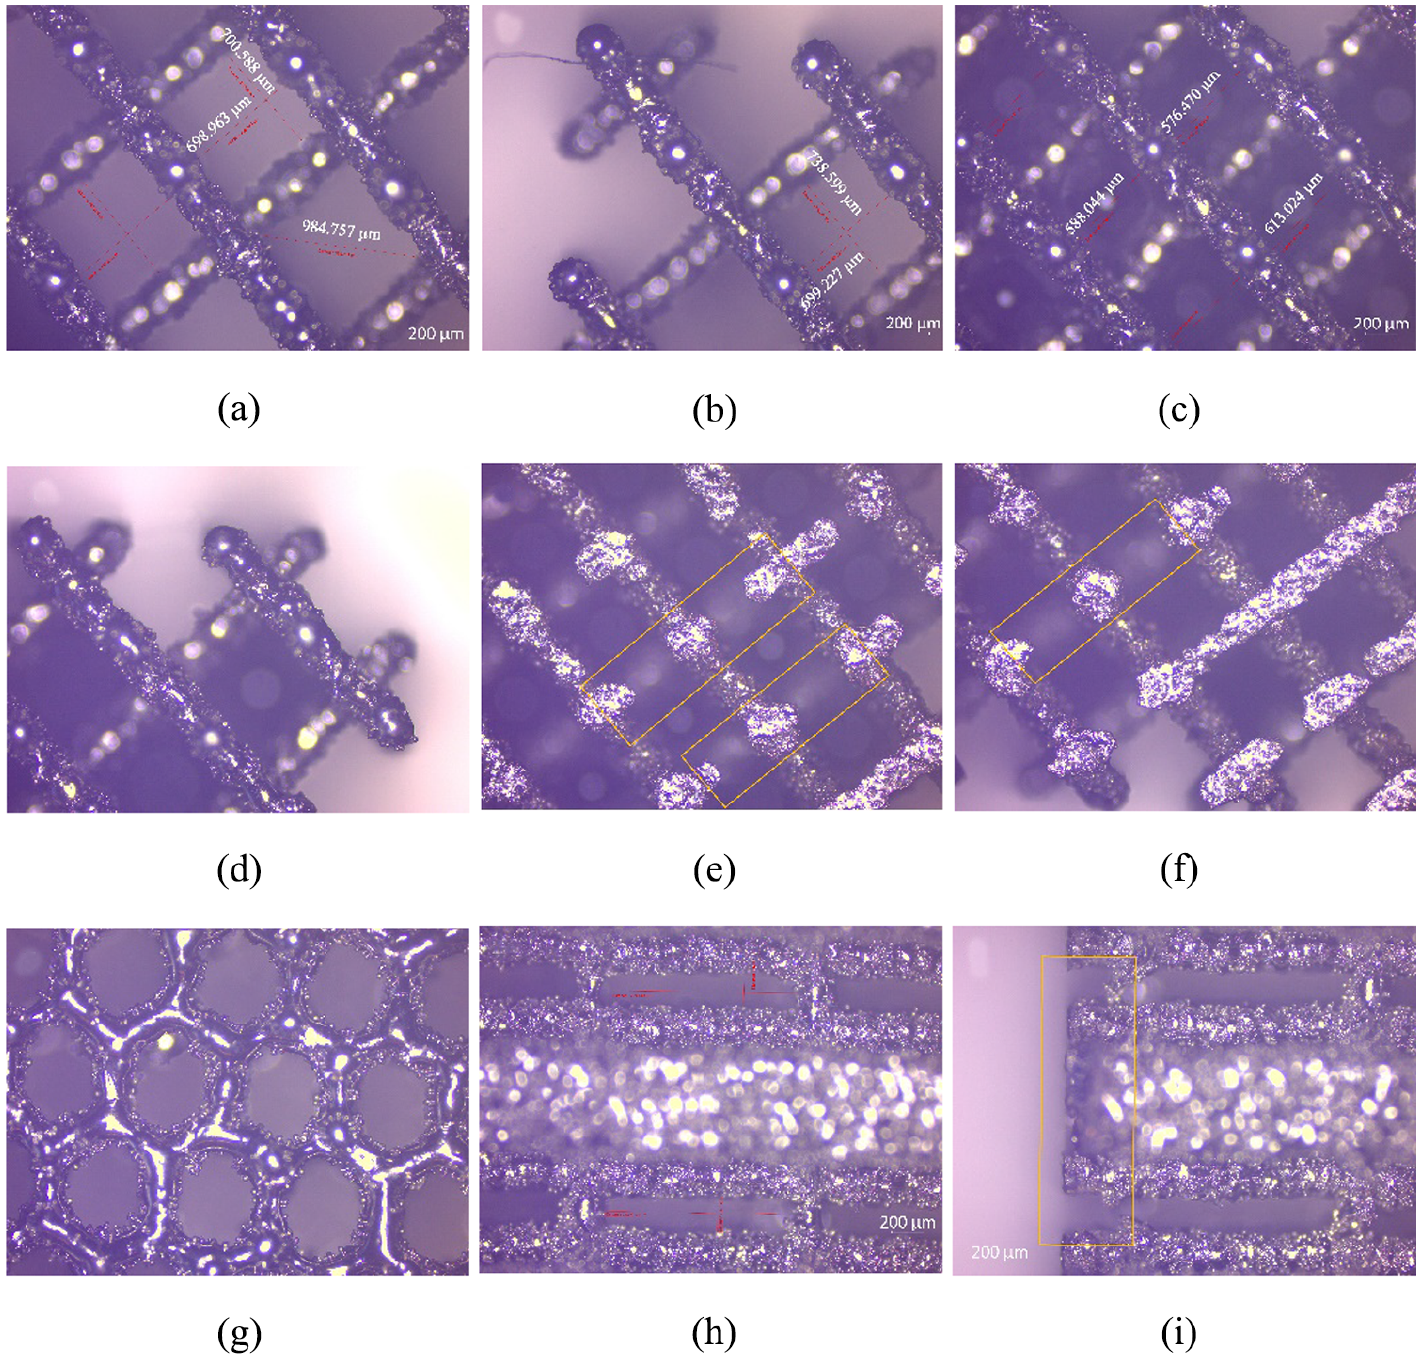
Images of four scaffolds in inverted motorized microscope: (a) top-view of Grid 500, (b) side-view of Grid 500, (c) top-view of Diamond 400, (d) side-view of Diamond 400, (e) top-view of Diamond 300, (f) top-view of Diamond 500, (g) top-view of Honeycom1 400, (h) top-view of Honeycom2 400, (i) side-view of Grid 300, and (j) side-view of Grid 300.
Scanning electron microscope
After the inverted motorized microscope analysis, the scaffolds were taken to a scanning electron microscope for further and detailed analysis of their geometry and dimension. Figure 5 showed scanning electron microscope (SEM) images of four scaffolds taken from top view and 45° side view.
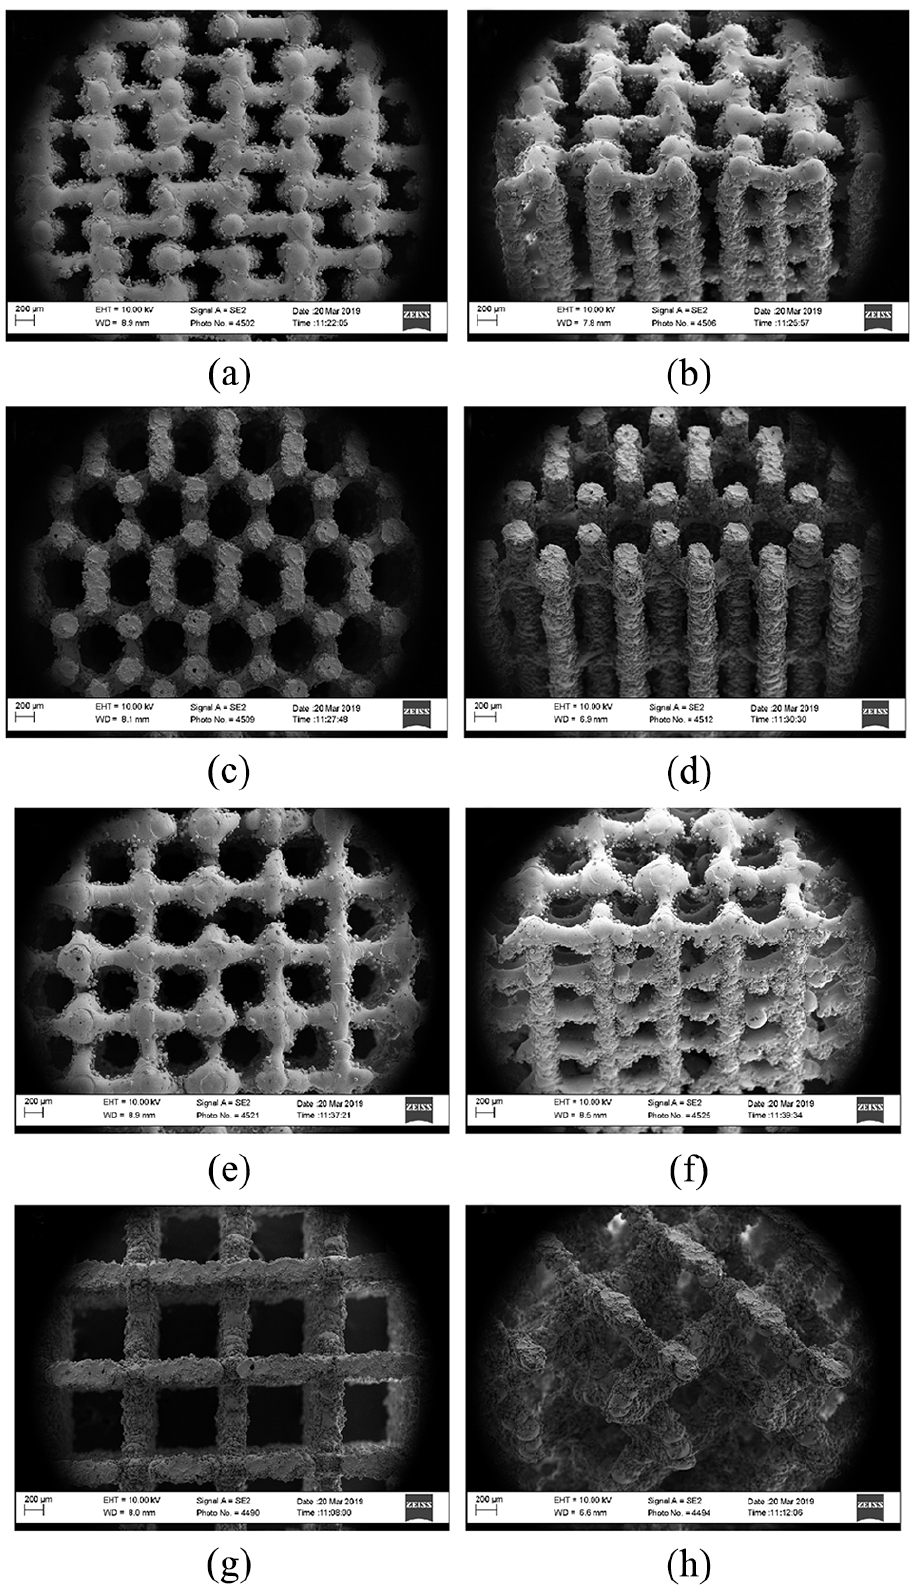
SEM images of four scaffolds: (a) top-view with Honeycomb2 cell, (b) side-view with Honeycomb2 cell, (c) top-view with Honeycomb1 cell, (d) side-view with Honeycomb1 cell, (e) top-view with Grid cell, (f) side-view with Grid cell, (g) top-view with Diamond cell, and (h) side-view with Diamond cell.
The analysis revealed that some missing pieces and a slight distortion were observed in Figure 4, but the percentage was low enough to be considered to be negligible. The surface roughness appeared to be normal.
Compression test
Uniaxial compression tests were carried out at the Pacific Testing Laboratory, Inc. The test equipment is United Load Frame (FM60R) with cell (10K). The test temperature is room temperature and loading rate is set to 8.47 µm/s. Each scaffold was tested separately. The results showed a direct relationship between scaffold pore size and structural strength. For all samples tested, scaffold with a pore size of 300 µm were the structurally strongest and the ones with a pore size of 500 µm were the weakest. Samples of 400 µm pore size appeared to be somewhere between the strongest and weakest.
Table 2 shows the maximum load that each scaffold was able to withstand and compressive strength. The numbers 500, 400, and 300 after the name of each scaffold represents the pore size for that scaffold, for example, Diamond 500 means a scaffold with a Diamond topology (refer to Table 2) and pore size of 500 µm. Human bone has a high compressive strength of 170 MPa, 29 therefore all three Diamond scaffolds failed while Grid 500 and Grid 400 are on the border line.
Maximum load and compressive strength.
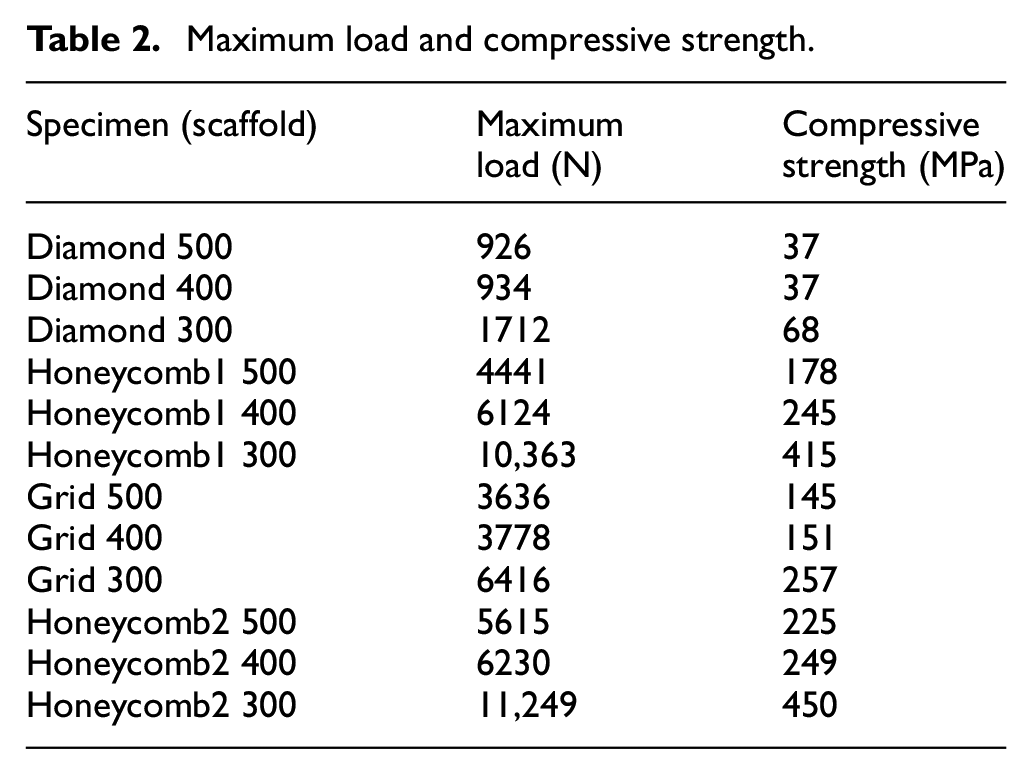
The compression test results of 12 scaffolds were also shown in Figure 6. It clearly shown that compressive strength of 5 of 12 scaffolds fall below that of human bone.
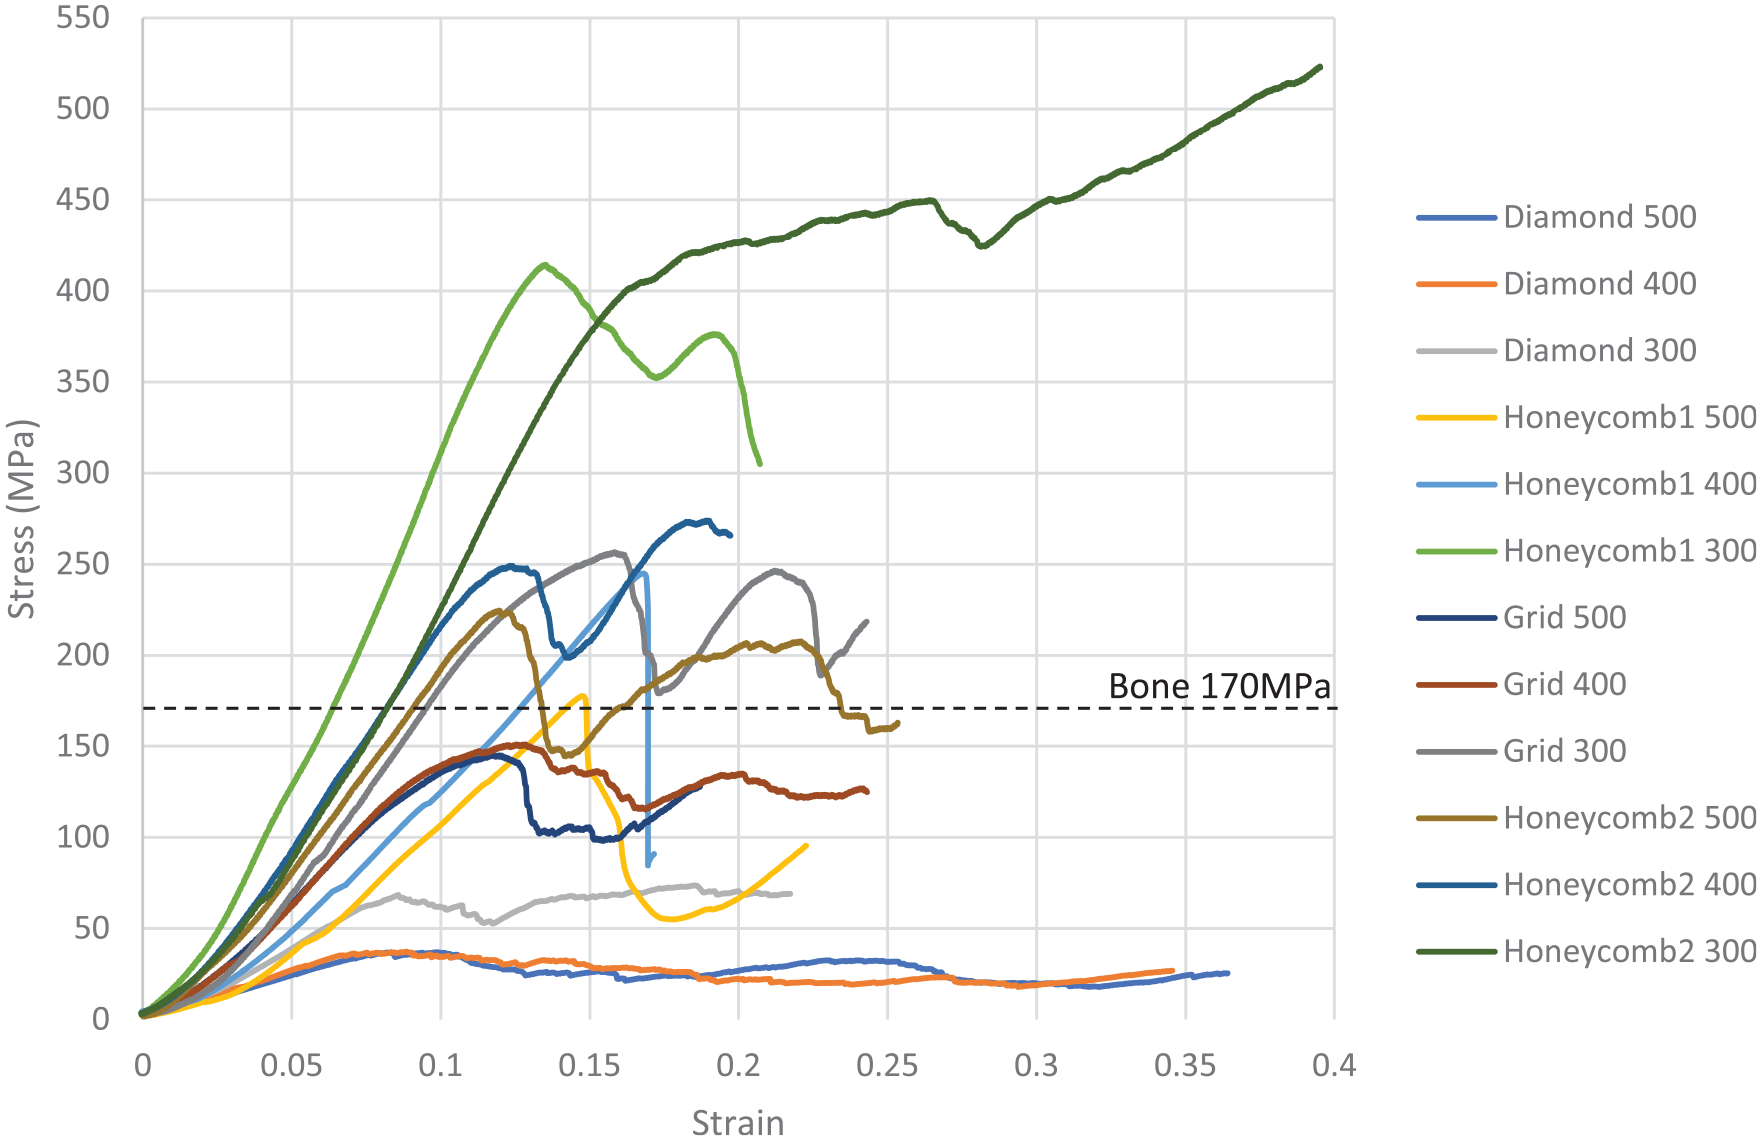
Stress–strain graph of compression test for 12 scaffolds.
Cell viability
Preparation of the scaffolds
Separation of titanium 3D prints from build plate was cut through wire electrical discharge machining (EDM) process.
Ultrasonic cleaning
The first step to cell viability testing was to assure that there were no chemicals from the process left on the scaffolds. Therefore, the scaffolds were cleaned ultrasonically, by Kendel ultrasonic cleaner. Four beakers were washed with hot water. They were then filled with de-ionized water and ultrasonically cleaned for 5 min. Next, the water was replaced with acetone, and scaffolds were submerged in it. To prevent acetone from evaporating during the cleaning process the beakers were covered with aluminum foil leaving a small vent for the air to escape. The machine was run for 5 min and checked to see whether there was any acetone discoloration. No discoloration was observed. Then the machine was run for another 10 min and no discoloration was observed this time either. Therefore, the samples were free of any potential contaminants.
Autoclaving
The next step was to autoclave the samples before seeding. The scaffolds were autoclaved for 30 min at 121°C.
Seeding scaffolds
Autoclaved samples were placed in a 48-well cell culture plate. Each scaffold was seeded with 1 million NIH3T3 cells. Each well received 1.5 mL of the media. To prepare the media for NIH3T3 cells, Dulbecco’s modification of Eagle’s medium (DMEM) with 1 g/L glucose,
An automatic machine was used to count the cells, shown in Figure 7. Cells from two different plates were counted and the average was used to get the 1 million cells for each scaffold
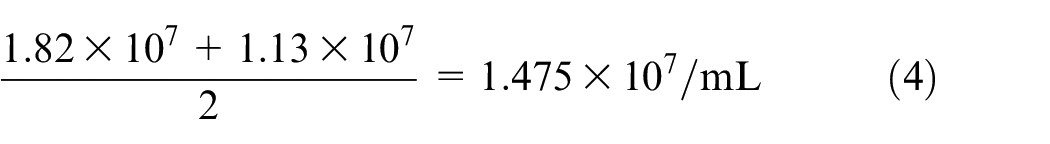
From Equation (4), there were 14.75 million cells on an average in 1 mL of media. To have 1 million cells per well or scaffold, roughly 68 µL of media has to be prepared.
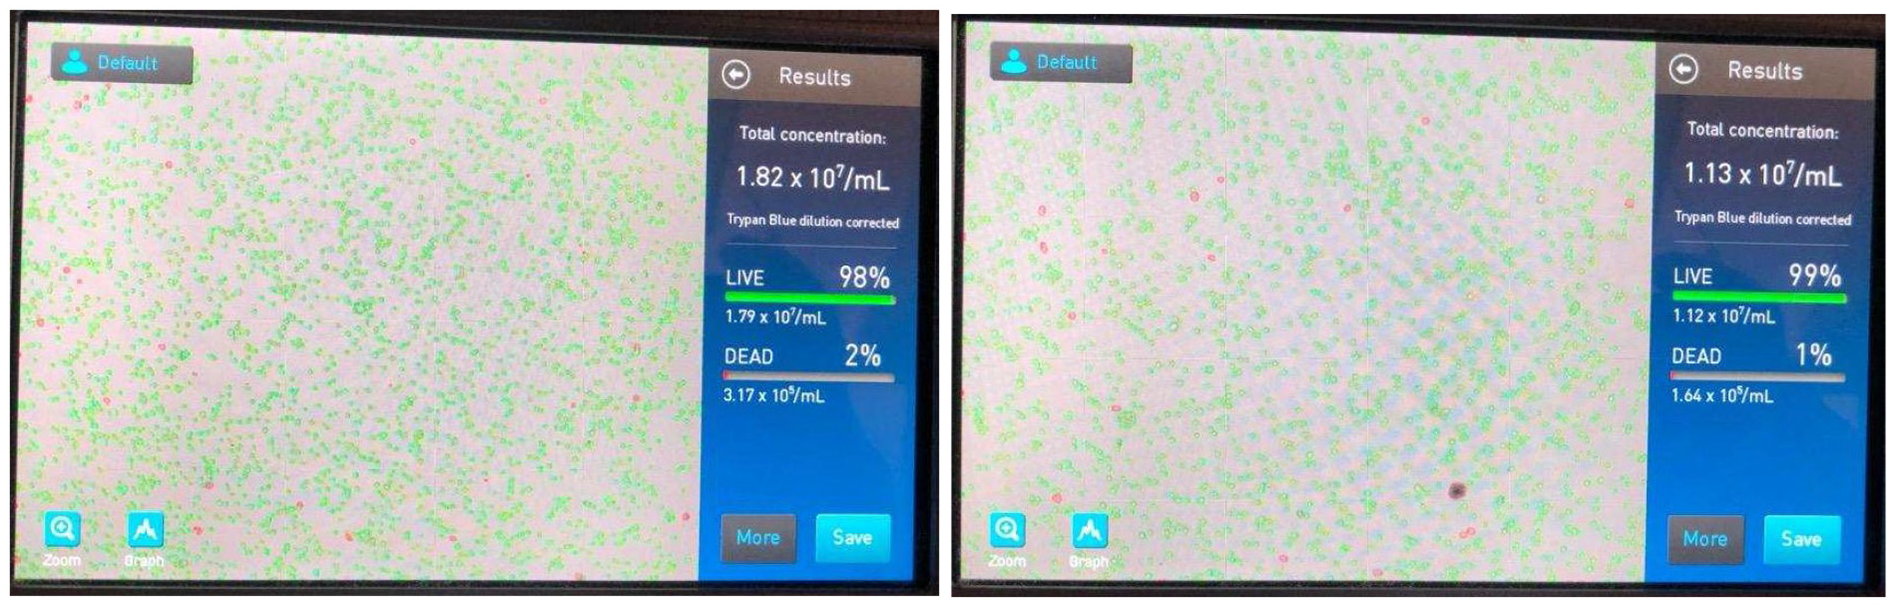
Images of cell counting in 1 mL.
Cells fixation
The last step to get the results was to fix the cells to preserve their 3D architecture so that they could be imaged under SEM. Cells were fixed following the below procedures:
The media was aspirated off.
Cells and scaffolds were washed with 1 mL of PBS (the PBS was aspirated off after washing).
1.5 mL of acetone, Chromasolv Plus, for HPLC, ≥99.9%, was added to the scaffolds.
Scaffolds were left in acetone for 50 min in a room temperature.
Acetone was taken out and replaced with PBS.
After washing the cells and scaffolds, PBS was aspirated off.
Cells were then taken to an SEM machine for imaging.
Results
The SEM images revealed that of the four topologies (Figure 1) used to create the scaffolds, Honeycomb2 was the only one that showed an acceptable cell proliferation. Honeycomb2 300 showed the highest cell proliferation of about 86%, shown in Figure 8(a), (d), and (e). The percentage was an interpretation of the images. Honeycomb2 400 also showed a good amount of cell proliferation, shown in Figure 8(b). However, it was less than Honeycomb2 300. Some cell proliferation was observed in Honeycomb2 500, but it was not as dense as the other two, shown in Figure 8(c). For the remaining three topologies in Figure 8(f) to (n) no cell growth was observed.
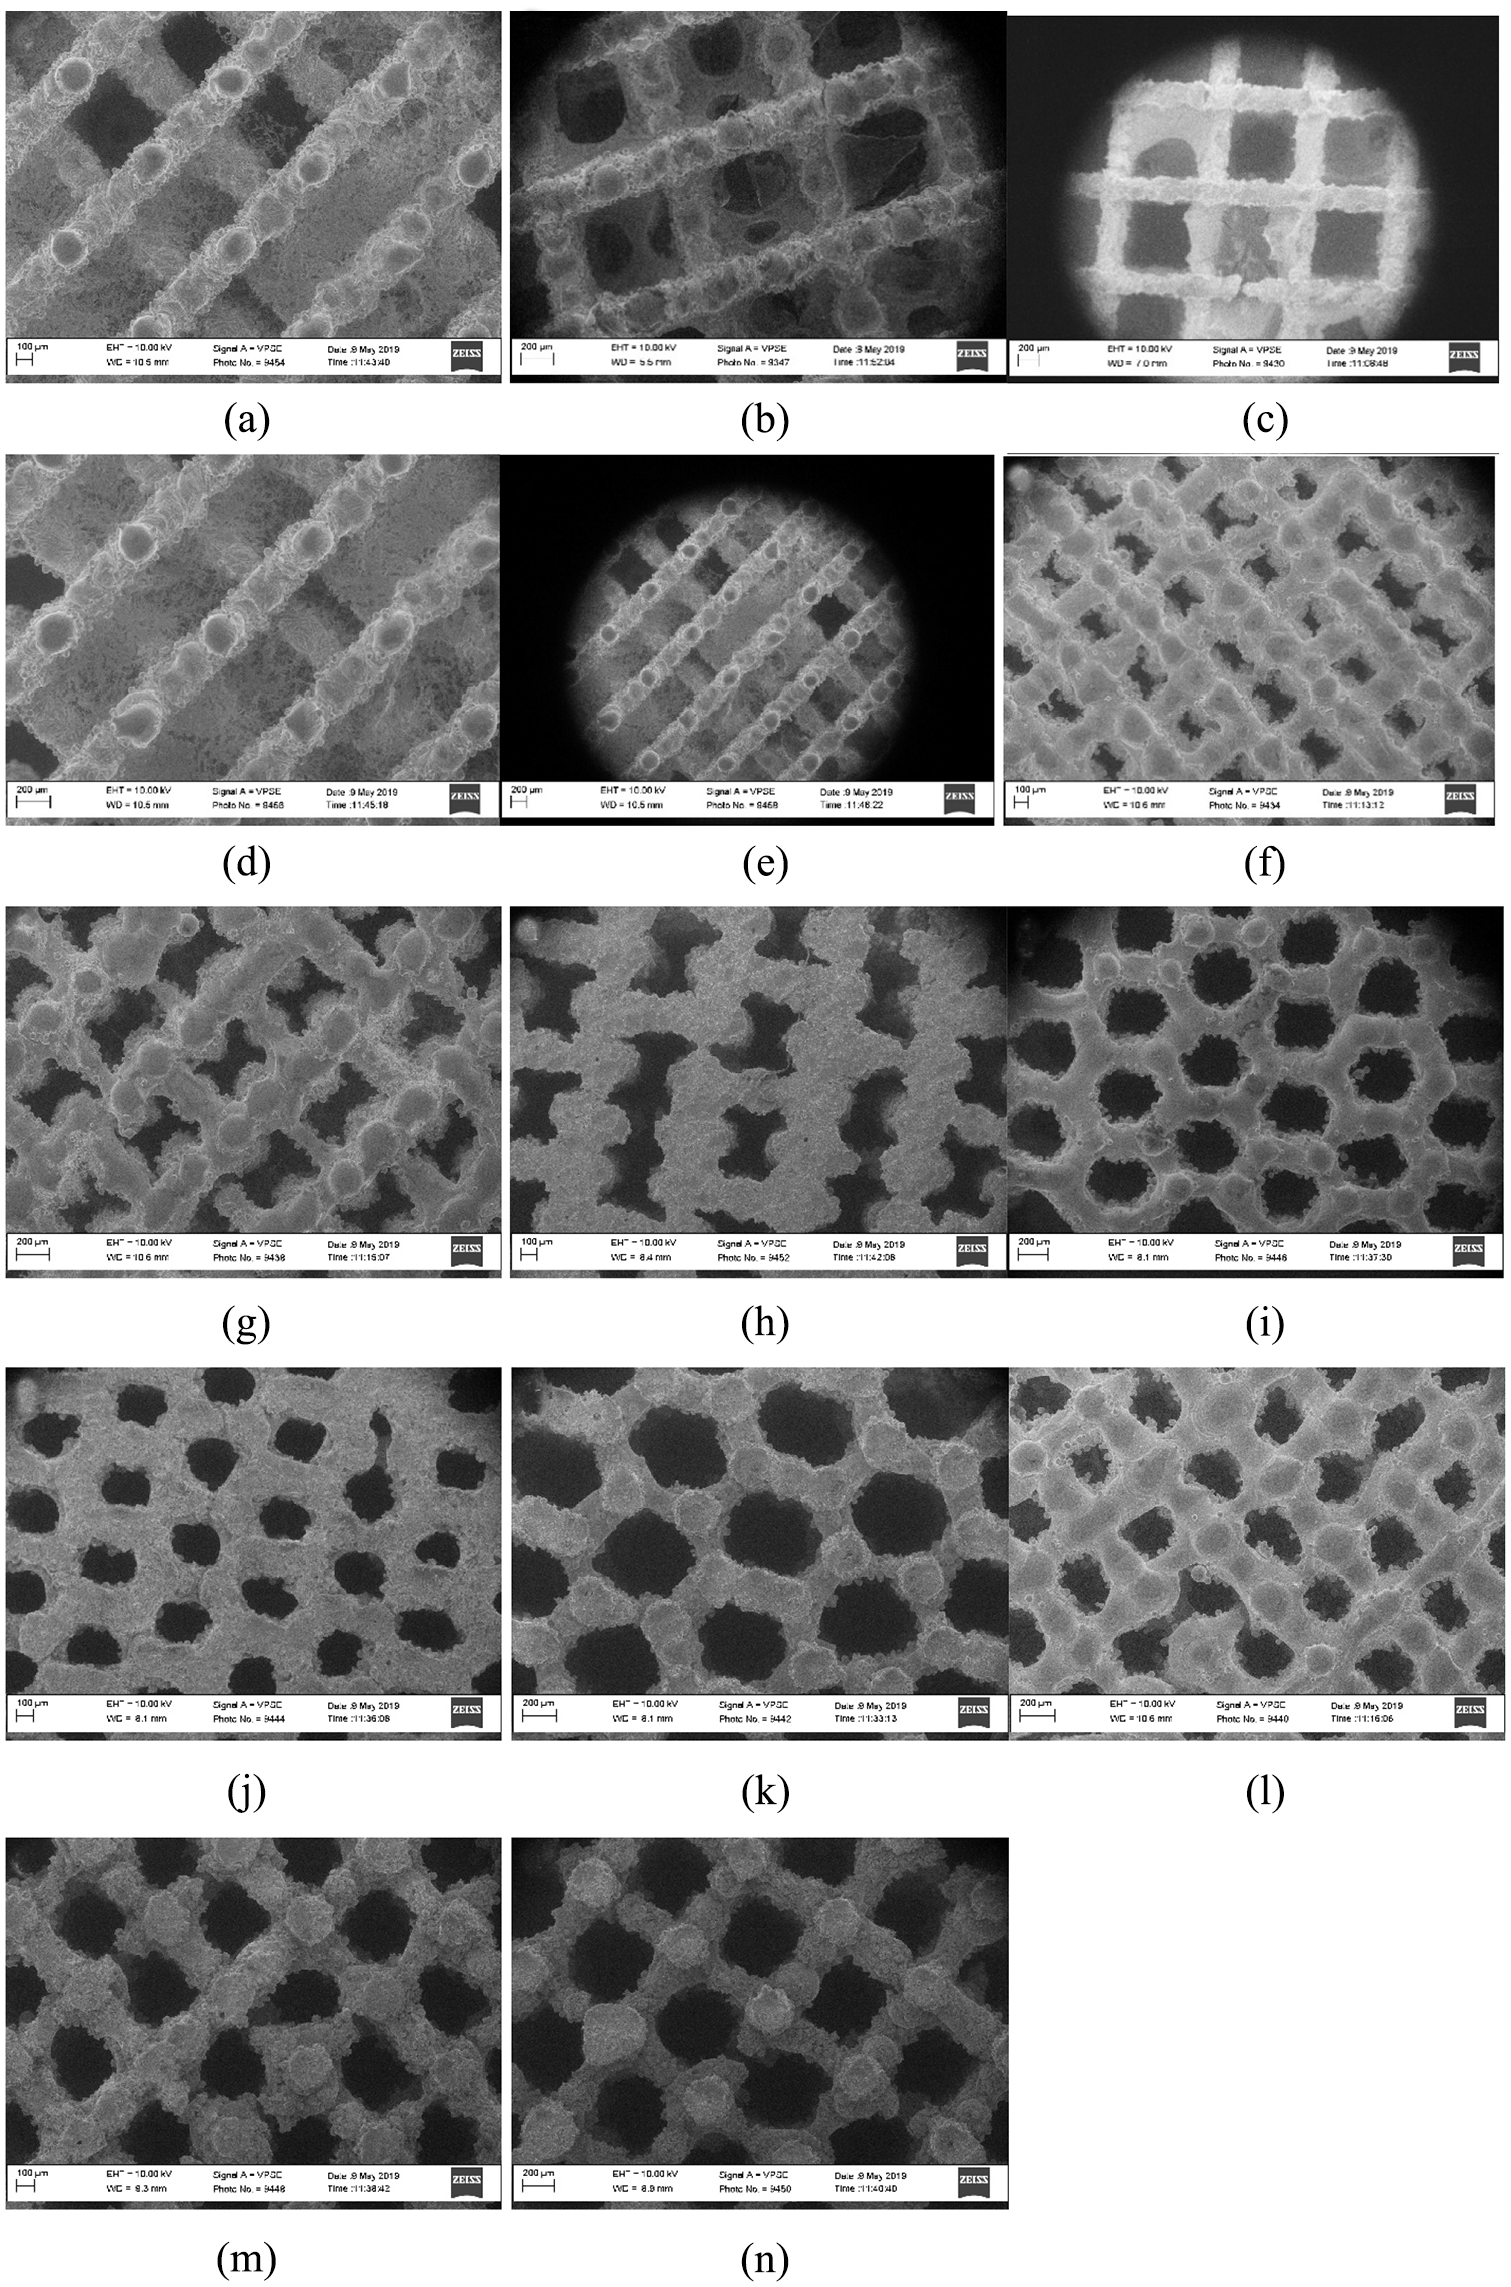
SEM images of scaffolds after 30 days of cell cultures. (a), (d), (e) Honeycomb2 300, (b) Honeycomb2 400, (c) Honeycomb2 500, (f) Honeycomb1 300, (g) Honeycomb1 400, (h) Honeycomb1 500, (i) Grid 300, (j) Grid 400, (k) Grid 500, (l) Diamond 300, (m) Diamond 400, and (n) Diamond 500.
After analysis of data collected during the experiments, of the four different scaffold topologies used in this research, Honeycomb2 300 proved to have the highest amount of cell growth. Within the topology, the scaffold with pore sizes of 300 µm was observed to have the highest comprehensive strength.
Based on the results, bone implants designed using Honeycomb2 topology and pore size of 300 µm will have a faster rate of healing compared with the other three topologies studied in the article.
Conclusion
This article explored the relationship between pore size, shape, and mechanical property of different additively manufactured porous titanium scaffolds while examining their viability for cell ingrowth. Four IntraLattice built-in cells each with three pore sizes (300, 400, and 500 µm) were used to generate 12 scaffolds: (a) Diamond, (b) Honeycomb1, (c) Honeycomb2, and (d) Grid. Compression testing results showed that scaffolds Honeycomb1 300 and Honeycomb2 300 have the highest comprehensive strength, while all three Diamond scaffolds were weaker than human bone’s compressive strength of 170 MPa, and Grid 500 and Grid 400 are on the border line. Cell viability results with study period of 30 days showed that Honeycomb2 300 was proved to have the highest amount of cell growth.
Footnotes
Declaration of conflicting interests
The author(s) declared no potential conflicts of interest with respect to the research, authorship, and/or publication of this article.
Funding
The author(s) disclosed receipt of the following financial support for the research, authorship, and/or publication of this article: This research work is supported by the U.S. DOD AFOSR DURIP grant (FA9550-16-1-0507), NSF IUSE grant (1712391), and NIH NIGMS BUILD (Building Infrastructure Leading to Diversity) PODER (Promoting Opportunities for Diversity in Education and Research) Equipment (8UL1GM118976) and Student (8TL4GM118977).