
Abstract
Alteration of forming and failure limits due to planar anisotropy of the sheet metal significantly affects the safe forming operation region and finally successfully manufacturing of a sheet metal formed component. This article presents the effect of planar anisotropy on uniaxial tensile properties, forming and failure limits of cold-rolled ferritic and dual-phase steels. In-situ three dimensional digital image correlation technique is used to measure the evolution of local strain components during uniaxial tensile test. For both the steels, necking limit is highest for the specimen at an orientation of 90° to rolling direction, while failure limit is highest for those specimen whose orientation is 45° to rolling direction for ferritic steel, and both 0° and 90° to rolling direction for dual-phase steel. Uniaxial tensile deformation path for ferritic steel holds lower slope than dual-phase steel as depicted in major versus minor strain plot.
Introduction
Sheet metal formed structural components and skin panels are extensively used in automobile structure and body. Necking is considered as a major failure mechanism in sheet metal forming operation. The necking/forming limit is normally represented by a failure criterion named as forming limit curve (FLC) and the complete diagram is known as forming limit diagram (FLD). The experimental method to determine FLC was initially established by Keeler and Backofen1,2 and Goodwin. 3 The conventional FLC expresses necking limit in a major strain versus minor strain plot over the various deformation modes ranging from uniaxial tension to plane strain tension to equi-biaxial tension. Figure 1 shows the schematic representation of a typical FLD based on the orientation of the specimen. Two kinds of FLCs are portrayed: FLC along rolling direction (RD) and FLC along transverse direction (TD). ABC (red curve) denotes FLC in RD, while CDE (blue curve) represents FLC in TD. OA and OE represent uniaxial tensile loading along RD and TD, OB and OD correspond to plane strain tensile loading along RD and TD, and OC corresponds to equi-biaxial tensile loading. Different FLCs in RD and TD are noticed due to planar anisotropy of the material. Effect of planar anisotropy is absent for equi-biaxial tensile loading (i.e. along OC), because C point is common for both the FLCs. The effect of planar anisotropy is prominent for uniaxial to plane strain tensile loading (AB for FLC in RD, and DE for FLC in TD).
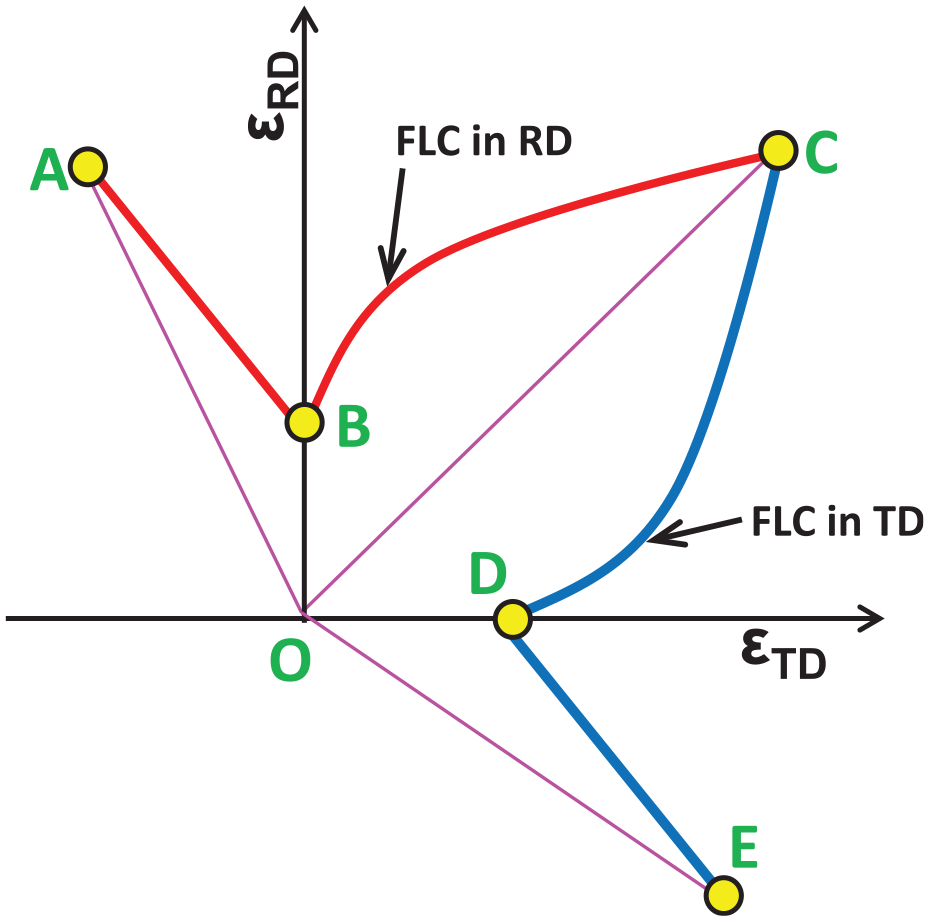
Forming limit diagram for the as-received blank in material orthotropic axes.
Two primary test methods, in-plane4–6 and out-of-plane7–11 formability experiments, are widely adopted to find out the FLDs for sheet metals under different forming situations, including deformation rate and temperature. 12 Various researchers13,14 have also adopted planar biaxial tensile experiments to determine FLDs for sheet metals, since effect of friction is absent and precise control of strain path is possible.13,14 Determination of forming limit from standard uniaxial tensile 15 and uniaxial notch tensile 16 tests in combination with digital image correlation (DIC) technique is a category of in-plane formability experiments.
Figure 2 illustrates the variation of necking limit with coefficient of normal anisotropy (r). OA and OB represent uniaxial and plane strain tensile deformation. The loading path in uniaxial tensile deformation in major strain (ε1) and minor strain (ε2) space can be expressed as
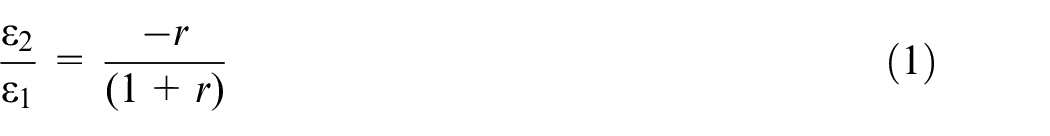
Forming limit diagram: variation of necking limit with coefficient of normal anisotropy (r).
OA and OC represent the uniaxial tensile deformation paths with high and low r-values, respectively. Therefore, necking limit in uniaxial tensile deformation depends on the r-value. In this work, in-depth experimental investigation is done to understand the effect of different specimen orientation to the RD on the necking and failure limits of steels.
Experimentation
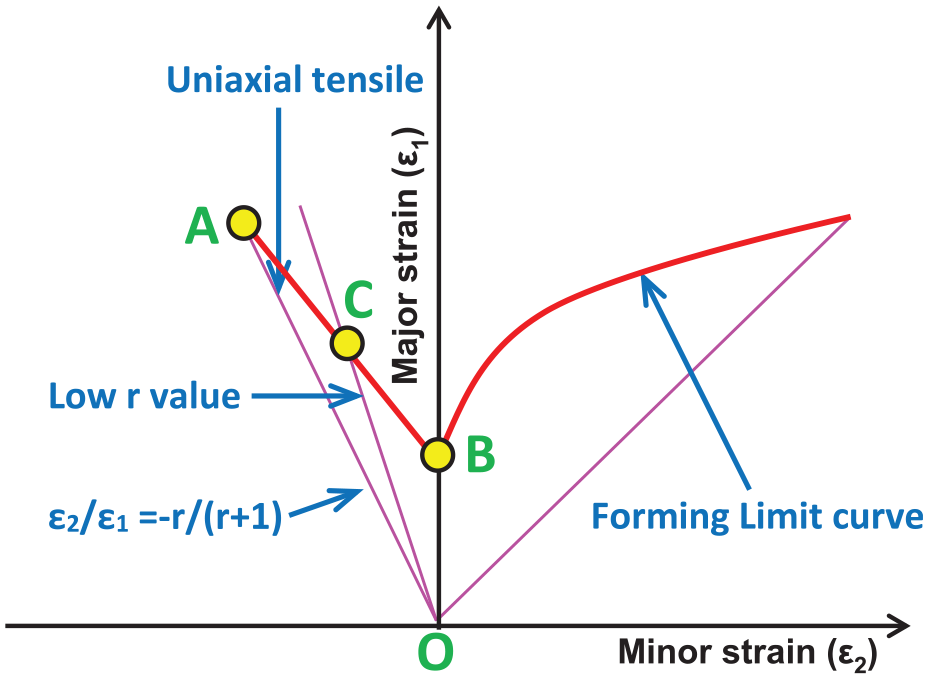
Cold-rolled dual-phase (DP) steel (contains ferrite and martensite phases) and ferritic steel (contains only ferrite phase) are used for the present investigation. The thickness of DP and ferritic steels are 1.4 and 0.7 mm, respectively. All tests are carried out at room temperature in a servo-hydraulic test frame of 25 kN capacity. Experiments are continued until fracture of the specimen. Commercially available three-dimensional (3D) DIC system from LaVision 17 is utilized for local strain measurement. Speckle pattern is made on the specimens before conducting the tensile test. Usually, 1000–2000 images per test are captured to perform detailed analysis of local strains evolved in the specimen. Figure 3 shows the geometry of in-plane uniaxial tensile specimen and fabrication from different directions with respect to RD.
Schematic diagram of sample preparation from rolled sheet along with geometry and dimension.
Results and discussion
Uniaxial tensile stress–strain curves of ferritic and DP steels in different orientations with respect to RD are shown in Figure 4. Yield stress (YS), ultimate tensile stress (UTS), uniform elongation (UEL), and total elongation (TEL) are determined from respective uniaxial tensile stress–strain curves. Variation of YS, UTS, UEL, and TEL with respect to the specimen orientation is plotted in Figure 5(a) and (b) for ferritic and DP steel, respectively. Superior tensile properties are noticed for the specimens tested along 0° and 90° to RD for ferritic steel, while specimens tested along 0° to RD for DP steel. Lowest YS and highest UTS are noticed in 0° to RD for both the steels. Figure 6 shows the details of tensile failure at different specimen orientation for ferritic and DP steels. For ferritic steel, specimen at an orientation of 45° to RD, failure takes place at a clear angle with respect to the laoding axis. However, for tensile specimen DP steel, failure takes place almost perpendicular to the loading axis in all specimen orientations.
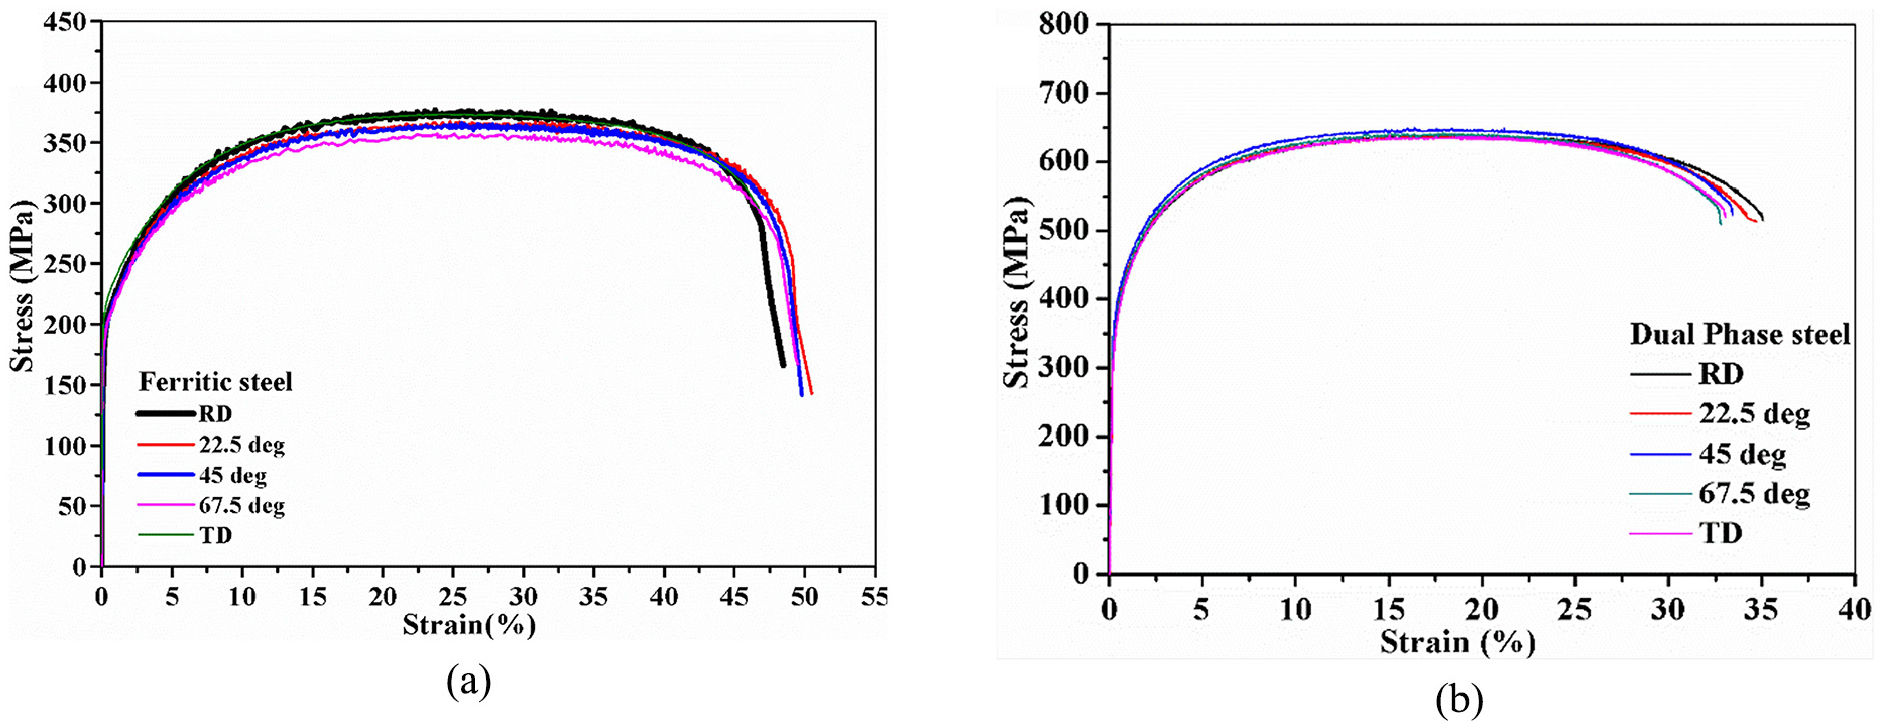
Tensile stress–strain curve in different orientation of specimen axis to rolling direction for (a) ferritic steel and (b) dual-phase steel.
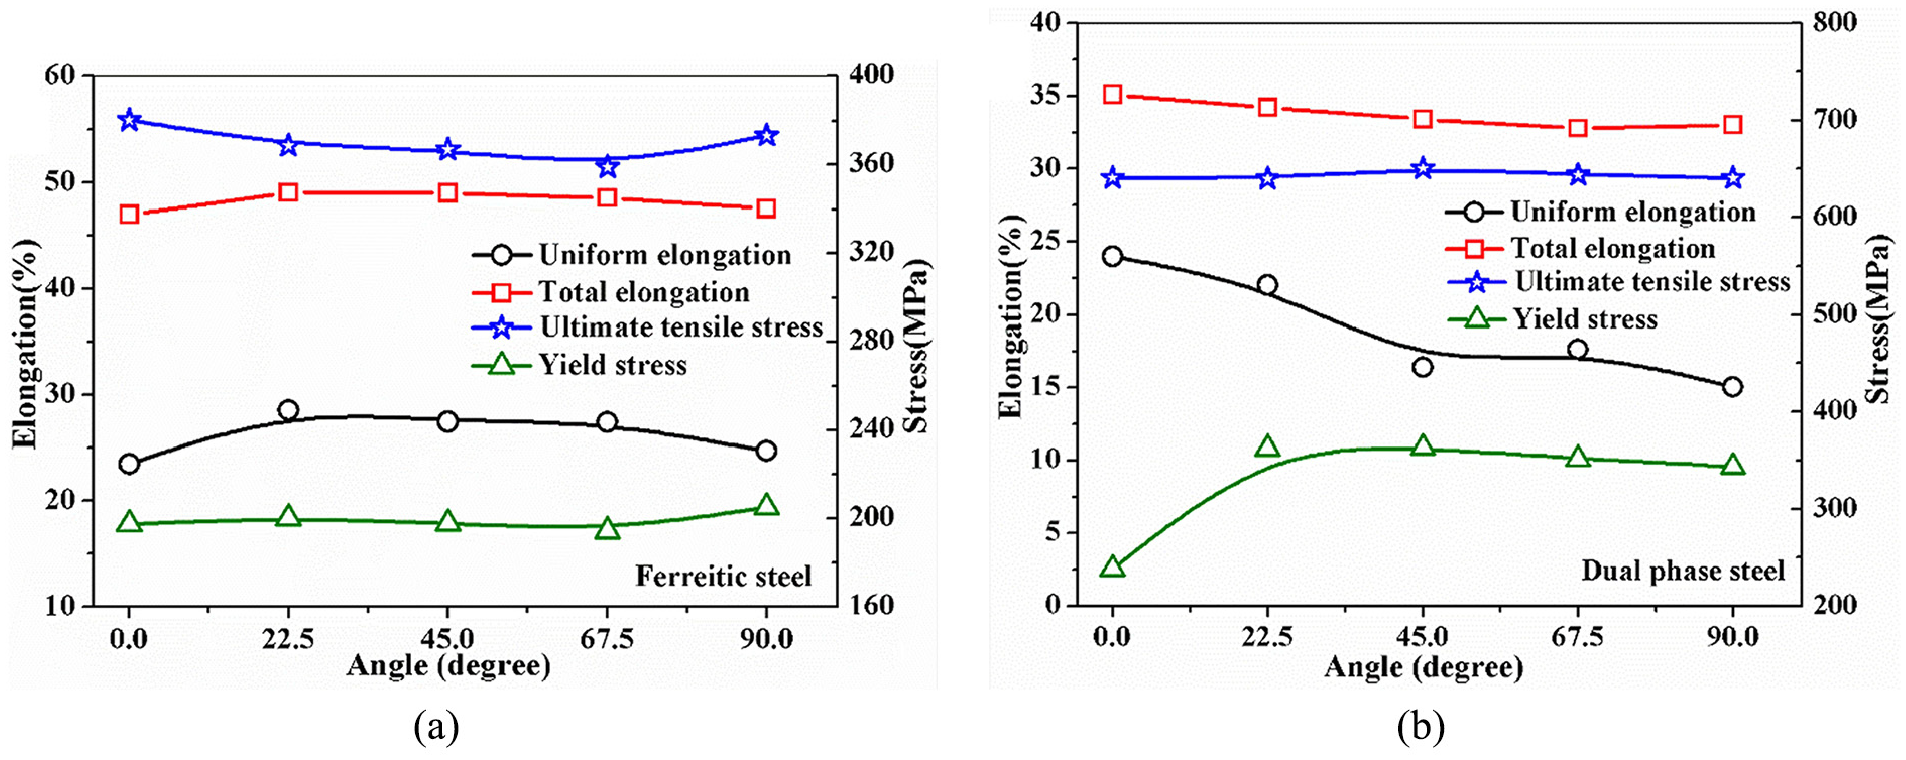
Variation of yield stress, ultimate tensile stress, uniform elongation, and total elongation in various specimen orientation for (a) ferritic steel and (b) dual-phase steel.
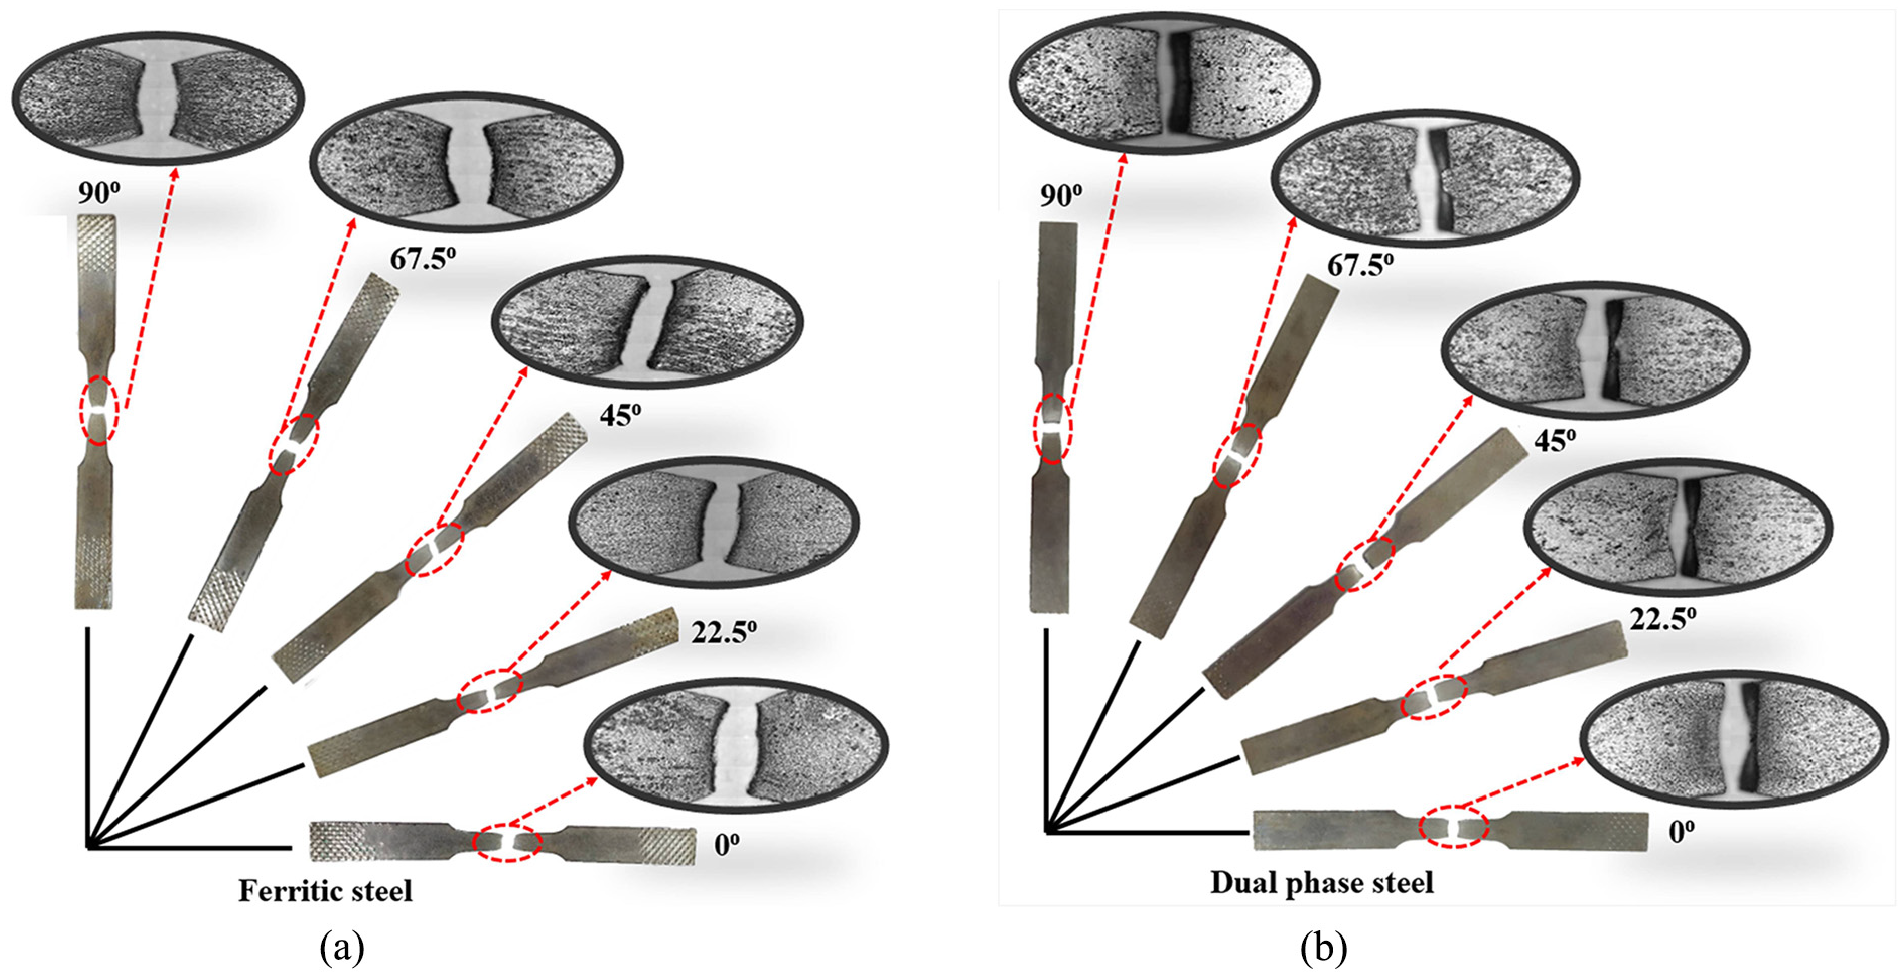
Tensile samples along with failure details in various speciment orientation with respect to rolling direction for (a) ferritic steel and (b) dual-phase steel.
A vertical line in the middle of the tensile specimen gauge section along the specimen axis is selected to investigate the progression of local strain components at different overall tensile strain levels. Figure 7(a) and (b) shows the progression of local strain components (εyy and εxx) along the selected vertical line for ferritic steel specimen at an orientation of 0° to RD. Up to UEL of the material, development of local strain components is roughly homogeneous. However, the deformation is concentrated at the necked region after UEL of the material. After necking, local strain components (εyy and εxx) are observed to increase within the necked zone and remain constant or reduce outside the necked zone. This observation justifies that after necking, deformation/straining is localized in the necked zone only. Similar observation is also noticed in other research works.18,19 Just before the failure, variation of local strain components (εyy and εxx) along the vertical line are selected for further analysis.
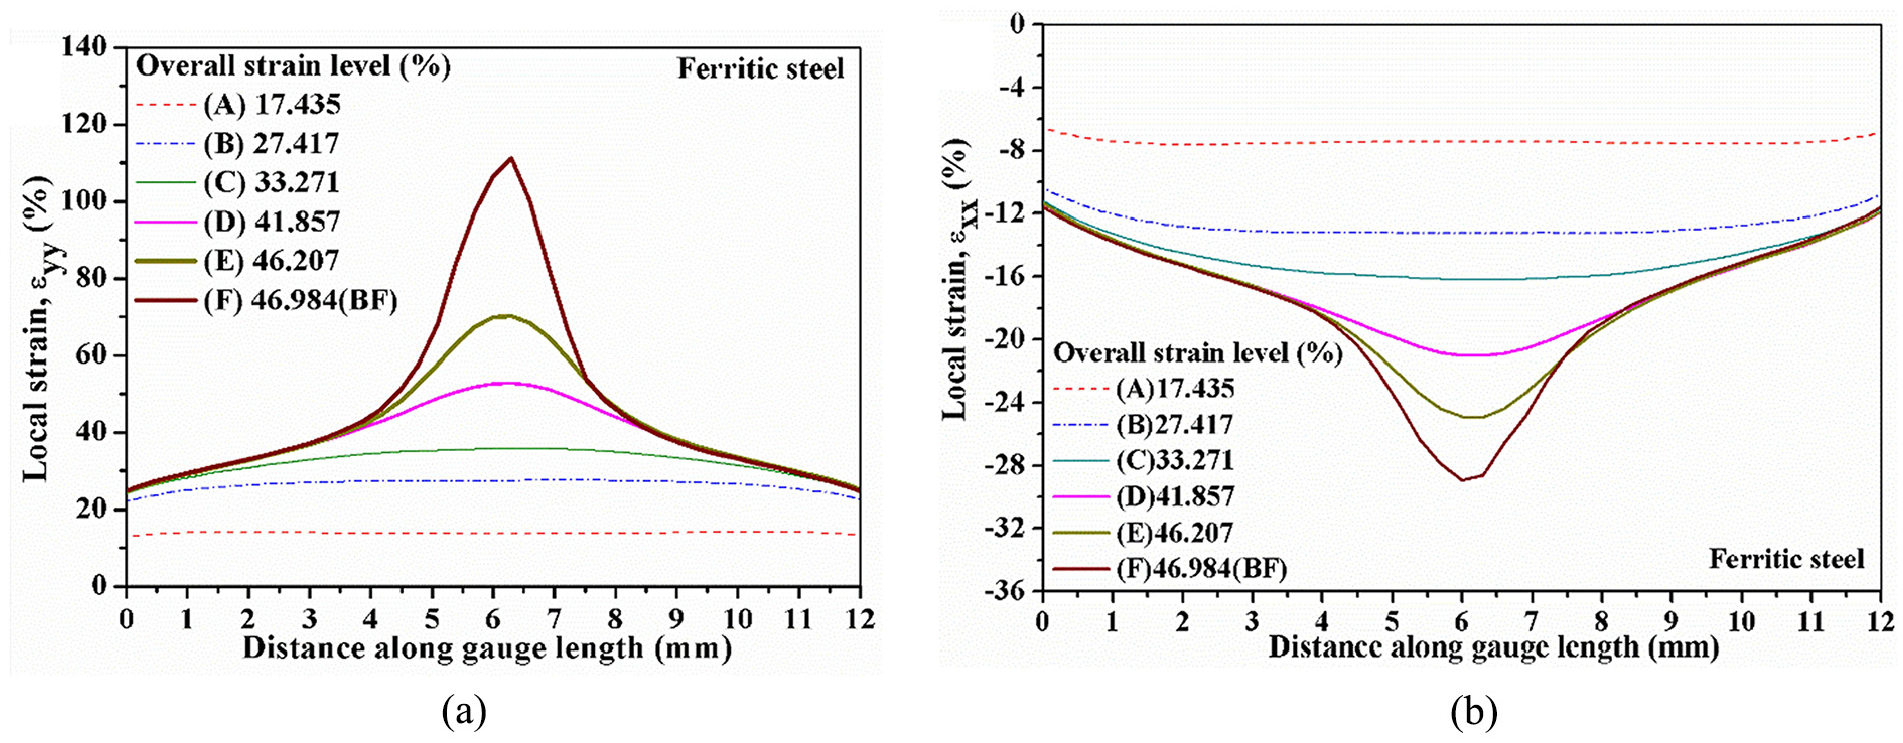
Evolution of local strain components along the rolling direction at various overall strain levels during a tensile test of a ferritic steel: (a) axial strain (εyy) and (b) width strain (εxx).
Determination of necking strain is done using ISO method 20 along the RD during a tensile test of ferritic steel (Figure 8). To do this, the frame just before the failure is selected for the analysis. To find out the crack position, a parabola curve, f(x) = ax2 + bx + c, is fitted to the experimental data and the vertex of the parabola represents the crack position. Inverse best-fit curve, f(x) = 1/(dx2 + ex + f), is fitted on two fit window (located on the left and right sides of the crack position) and finally vertex of the inverse parabola represents the onset of necking point. Figure 8 shows the major (ε1) and minor (ε2) necking strains and failure strains for ferritic steel. Thus, necking limits for different specimen orientation with respect to RD are determined according to ISO method 20 for both the steels.
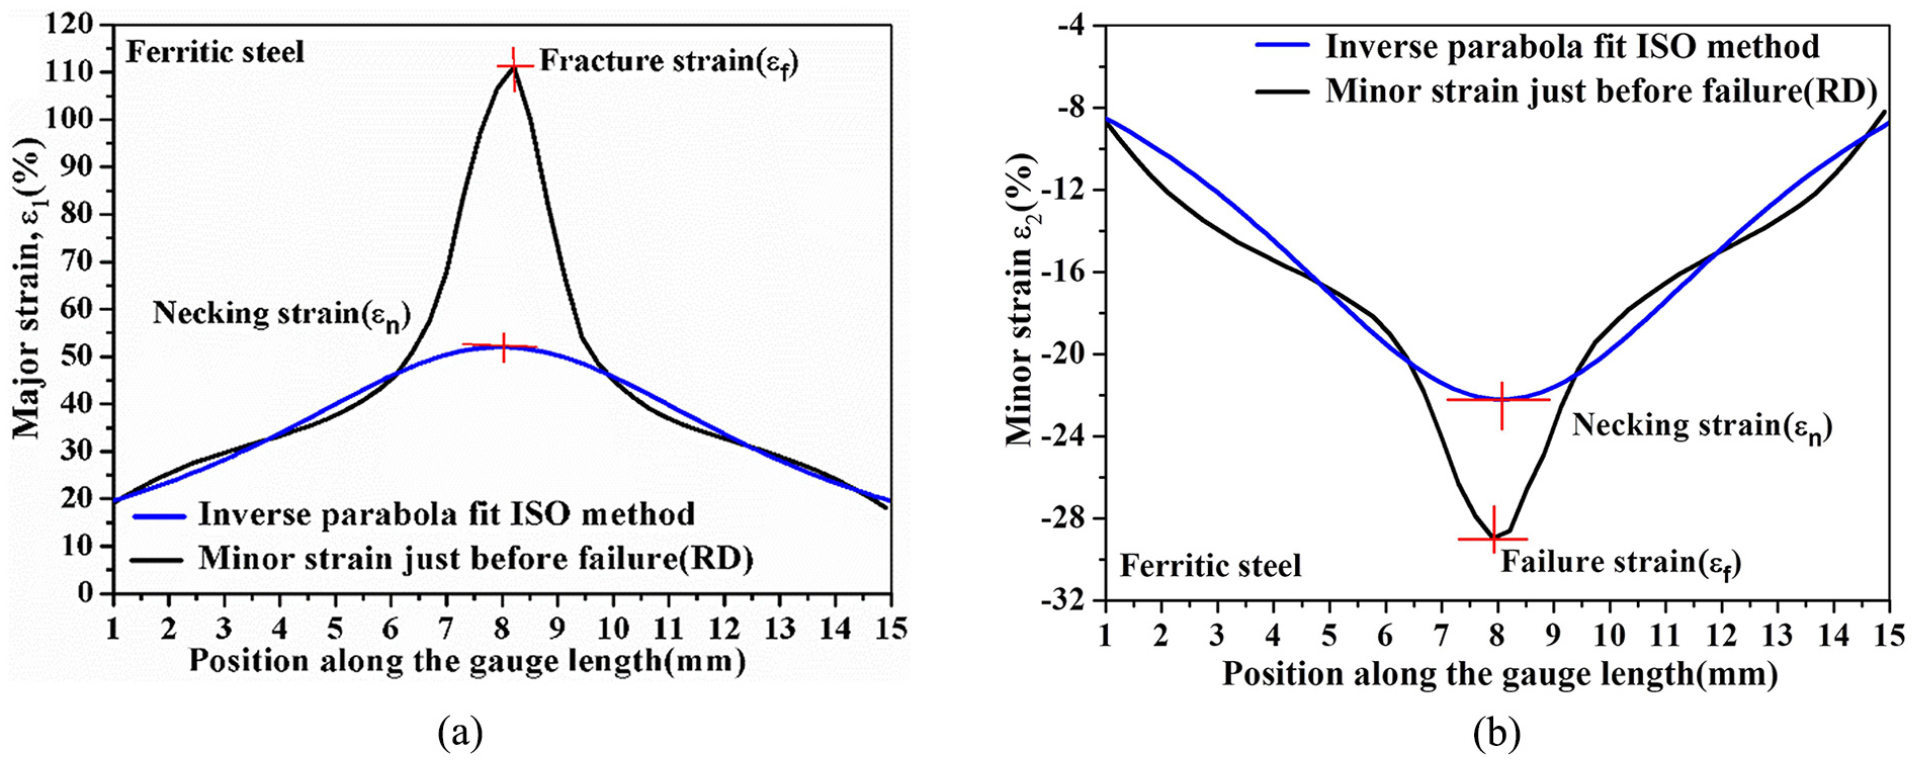
Determination of failure and necking strain using ISO method along the rolling direction during the tensile test of ferritic steel: (a) major strain (ε1) and (b) minor strain (ε2).
Variations of failure and necking strains in a uniaxial tensile test with different specimen orientation to the RD are shown in Figure 9. Figure 9(a) and (b) represents the major and minor necking limit and failure limit for ferritic steel, while Figure 9(c) and (d) are for DP steel. Highest necking limiting strain is noticed at 90° to RD for ferritic steel, while 90° and 0° to RD for DP steel. Maximum failure strain is noticed at 45° to RD for ferritic steel, while 90° and 0° to RD for DP steel. Figure 4(a) shows that the failure occurs inclined to the loading axis for ferritic steel specimen with its axis orientation 45° to RD. Maximum failure strain in specimen orientation of 45° to RD for ferritic steel is also supported by the findings of Figure 4(a).
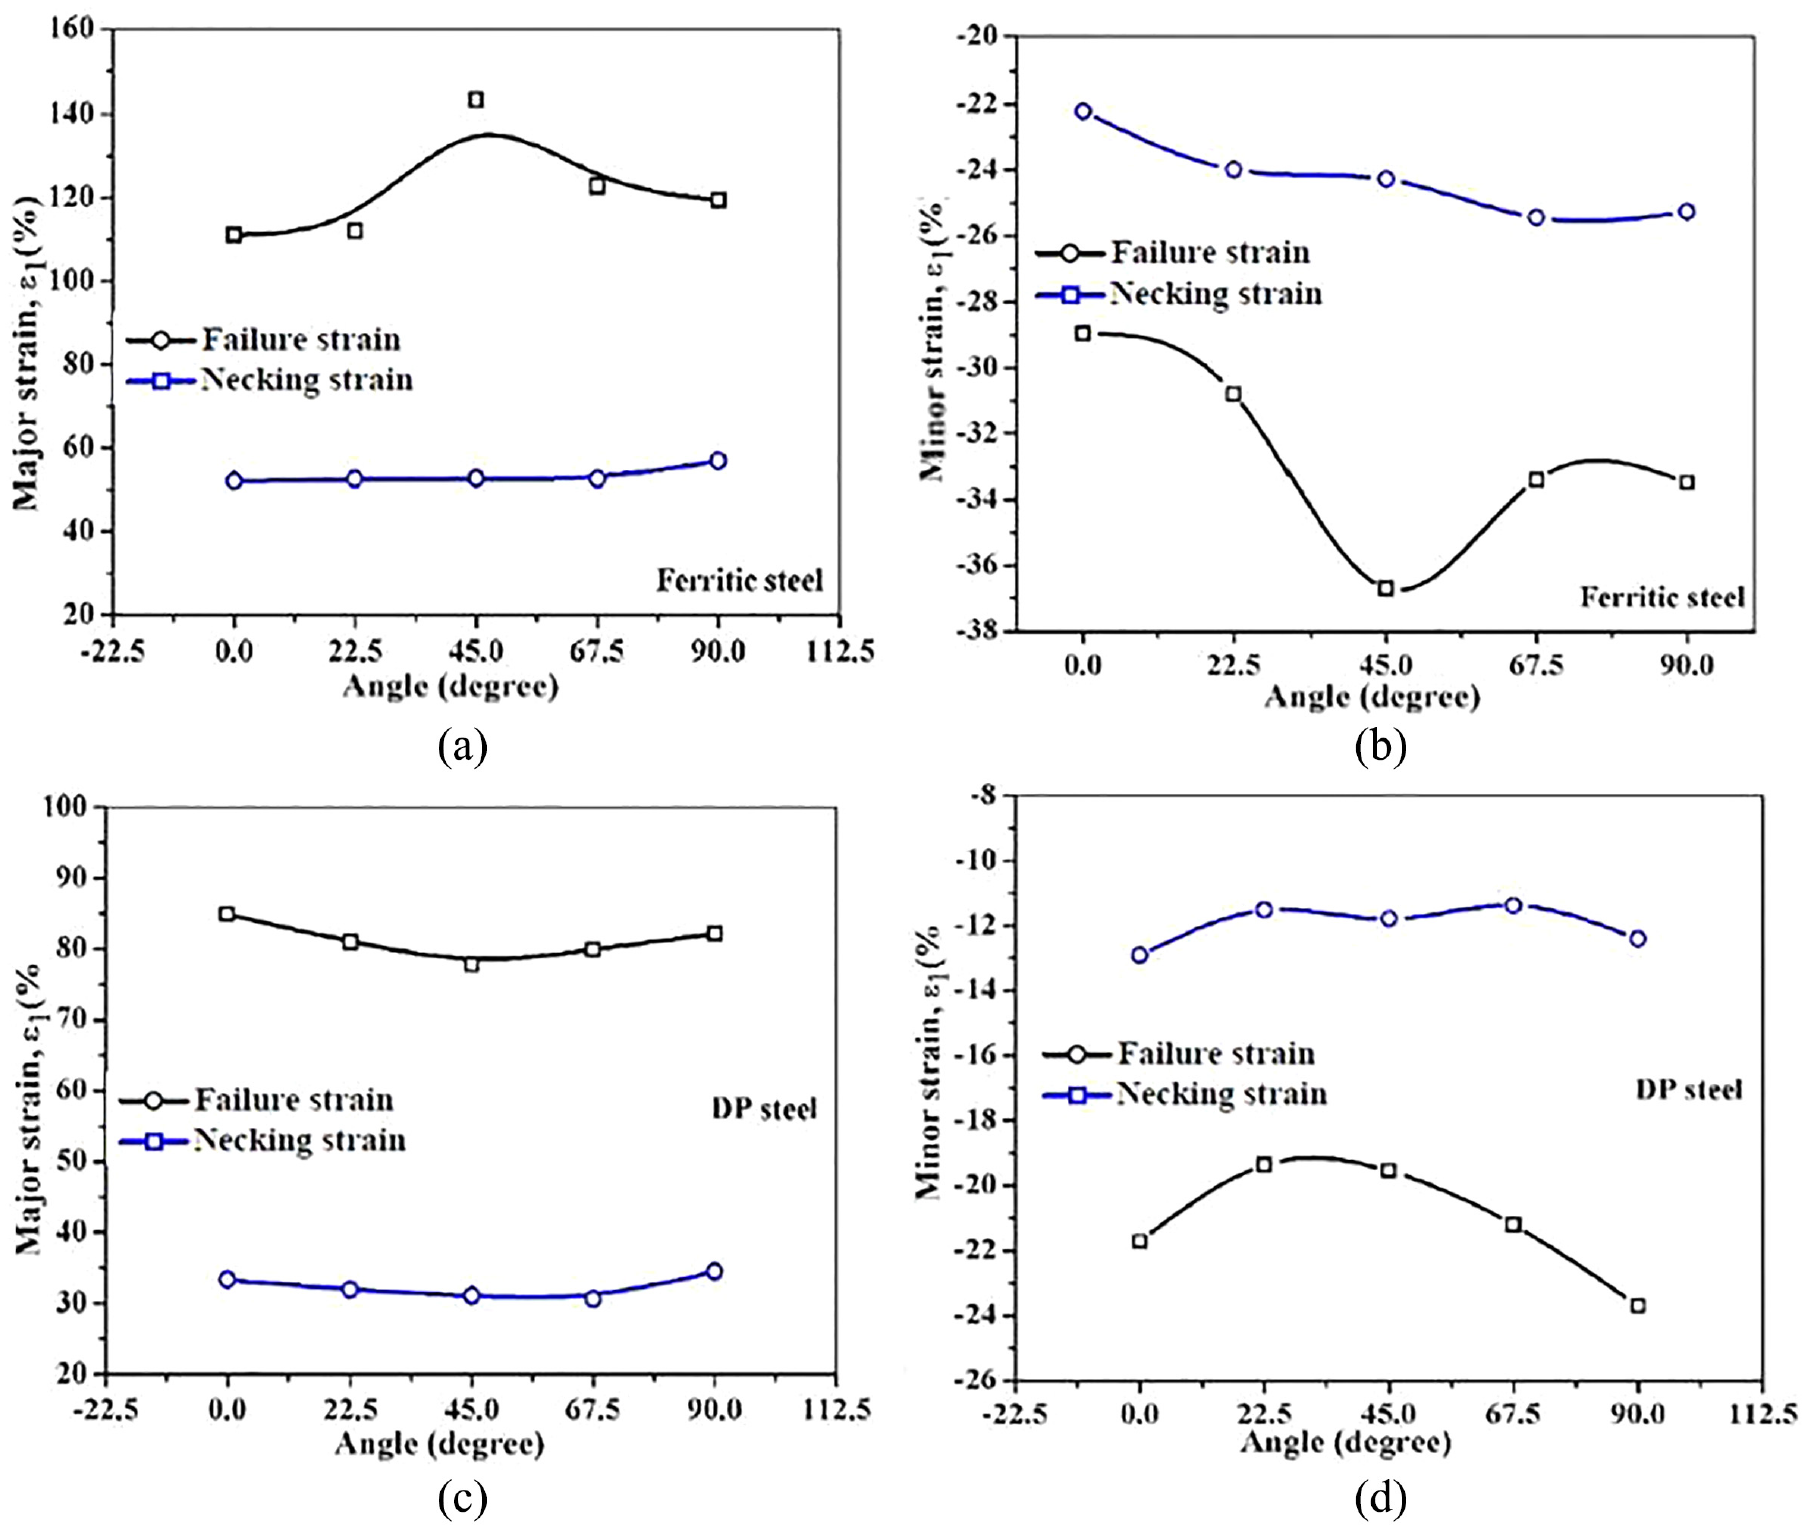
Variation of failure and necking strains with different specimen’s axis angle to the rolling direction during the tensile test: (a) major strain (ε1) of a ferritic steel, (b) minor strain (ε2) of a ferritic steel, (c) major strain (ε1) of a DP steel, and (d) minor strain (ε2) of a DP steel.
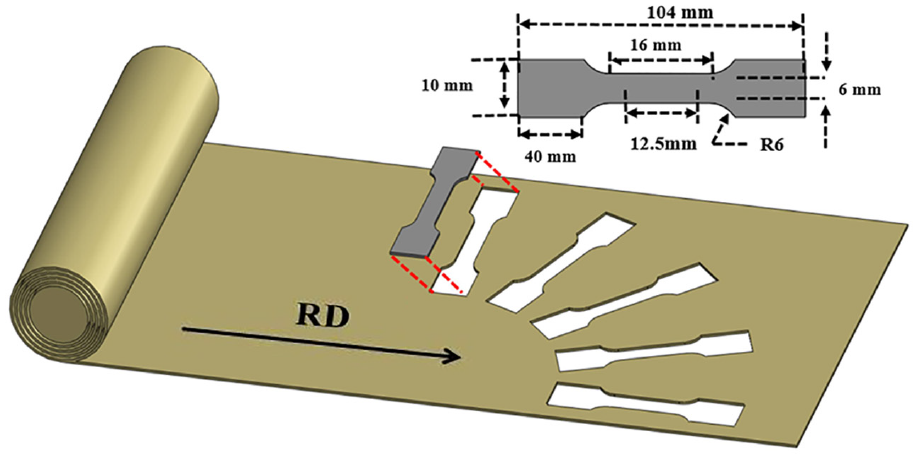
Uniaxial tensile deformation path is plotted in Figure 10 for ferritic and DP steels. The ratio of minor and major strain (ε2/ε1) is related to coefficient of normal anisotropy (r) through equation (1). In major strain versus minor strain plot, higher coefficient of normal anisotropy (r) results in lower slope for ferritic steel. Lower slope of uniaxial tensile deformation path in major strain versus minor strain plot for ferritic steel also justifies the delay in necking and superior forming limit strain.
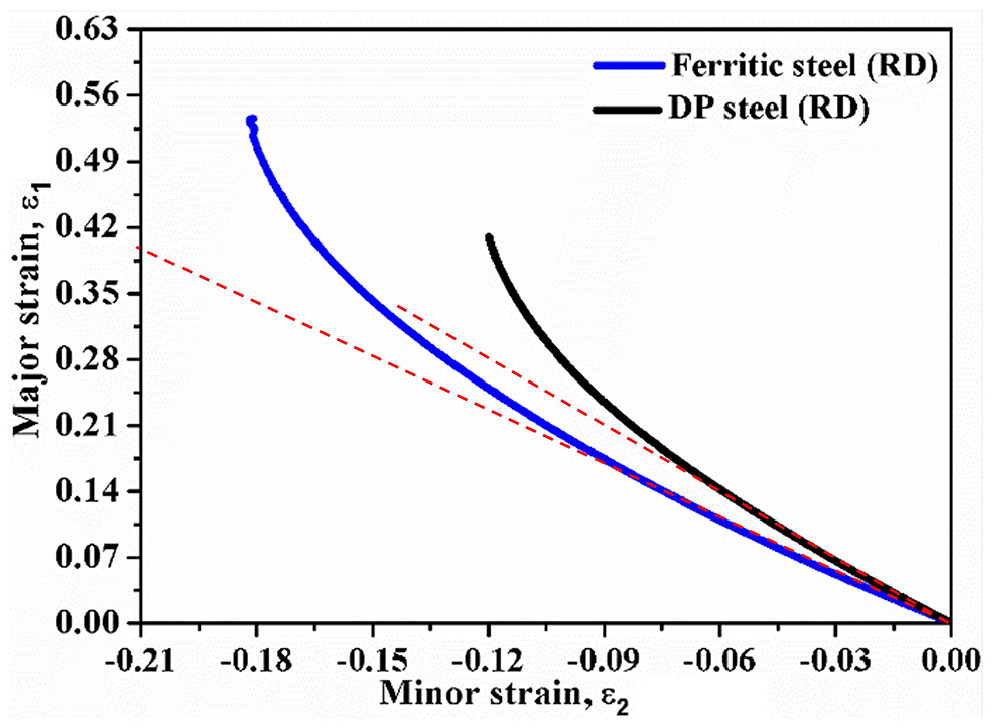
Uniaxial tensile deformation paths in major strain versus minor strain plot for ferritic and DP steels.
Conclusion
In this study, the effect of planar anisotropy on subsequent tensile properties, necking and failure limits are studied for ferritic and DP steels based on 3D DIC technique. Slight variation in tensile properties like YS, UTS, UEL, and total elongation are noticed in different specimen orientation to RD. Necking limit is maximum for specimen along 90° to RD for both ferritic and DP steels. Lower slope of uniaxial tensile deformation path in major strain versus minor strain plot also supports the delay in necking and hence higher forming limiting strain. For ferritic steel, failure limit is uppermost in specimen orientation of 45° to RD. And for DP steel, failure limit is topmost for both specimen orientations 0° and 90° to RD.
Footnotes
Acknowledgements
The authors acknowledge the Ministry of Human Resource Department, Government of India for fellowship of the PhD student. The authors are also thankful to the Indian Institute of Technology Patna for providing necessary equipment and software tool.
Declaration of conflicting interests
The author(s) declared no potential conflicts of interest with respect to the research, authorship, and/or publication of this article.
Funding
The author(s) received no financial support for the research, authorship, and/or publication of this article.