
Abstract
Micro-milling is a micro-mechanical cutting method used to obtain complex and three-dimensional micro geometries. Micro-cutting tools are used in the manufacturing of micro-components and the type of workpiece is also important for good surface quality and minimum burr. In this study, micro machinability of Ti6Al4V alloy which is used most frequently in micro-component production is compared with Ti5553 alloy. Micro-milling of Ti5553 alloy and comparison of the minimum chip thickness with Ti6Al4V were performed for the first time in this study. Using different cutting parameters, the variation of surface roughness, burr width, and cutting forces were investigated. The cutting tests were carried out on a specially designed and high-precision micro-milling test system using a TiCN-coated two-flute end mill of 0.6 mm diameter. According to the results, minimum chip thickness is approximately 0.3 times the edge radius of the cutting tool and does not vary with the alloy type. At feed rates smaller than the minimum chip thickness, both the cutting forces increase and the surface quality decreases. For both alloys, reduced feed rate and increased depth of cut lead to increased burr width. The burr widths in Ti6Al4V alloy are higher. At the end of the study, the limits of the cutting parameters where plowing occurred for the both alloys are clearly determined. In addition, the limits of the cutting parameter causing plowing have been confirmed by cutting forces, surface roughness, and burr formation.
Introduction
Micro-mechanical machining is the manufacturing method for miniaturized precision devices and components of sizes ranging from microns to several millimeters. Micro-mechanical cutting is kinematically similar to conventional cutting operations. Micro-milling is the most widely used method of machining in micro-mechanical machining. The manufacturing speed is high, and the cost of production is low in micro-milling. A wide variety of complex micro-components and micro geometries can be easily produced by this method. Not only the product size in micro machining but also the cutting tool size (25–999 µm) is also very small. For this reason, high spindle speeds are required for cutting with cutting tools with such small diameters.
In micro-cutting conditions, the microstructure of the material, the grain size, the geometry of the cutting tool (especially the edge radius), and the rapid tool wear become more important. The tool edge radius is the most decisive geometric parameter in micro cutting. The cutting edge rotates around a center, while at the same time it also moves. As a result of these two movements, the chip cross-section changes continuously. In full slot cutting, the chip section changes from zero to maximum and again to zero (Figure 1(a)). At the first moment when the cutting edge starts to cut, the chip thickness is very close to zero (Figure 1(b)). The edge radius of the tool is larger than the thickness of the chip. Therefore, the cutting process can be likened to a cutting tool with a negative rake angle. In this case, since the chip thickness is smaller than the minimum chip thickness, a complete cutting operation does not occur. 1 This is called ploughing or plowing. The plowing continues until the chip thickness is equal to/greater than the minimum chip thickness. Therefore, the ratio of the chip thickness to the tool edge radius is a decisive factor in whether the cutting process takes place or not. This ratio affects the surface quality as well as the burr formation. At the same time, elastic deformation occurs on the surface of the workpiece and additional forces act on the tool.2,3 In order to minimize the impact of the plowing, it is not enough to choose only the cutting parameters correctly. The type of workpiece and the cutting conditions (dry or wet) also affect plowing. In order to determine the minimum chip thickness, the surface roughness and force change are generally considered.4,5 In areas where plowing occurs, the quality of the machined surface also deteriorates. This usually occurs at locations where the cutting edge starts cutting and finishes cutting. Aslantas et al.6,7 showed that the surface roughness changed along the width of the machined slot. It is clearly shown that the Ra and Rz values are higher in the regions where the cutting edge starts to cut and leaves the workpiece. In cases where the feed rate is smaller than the edge radius, the plowing effect is greater.
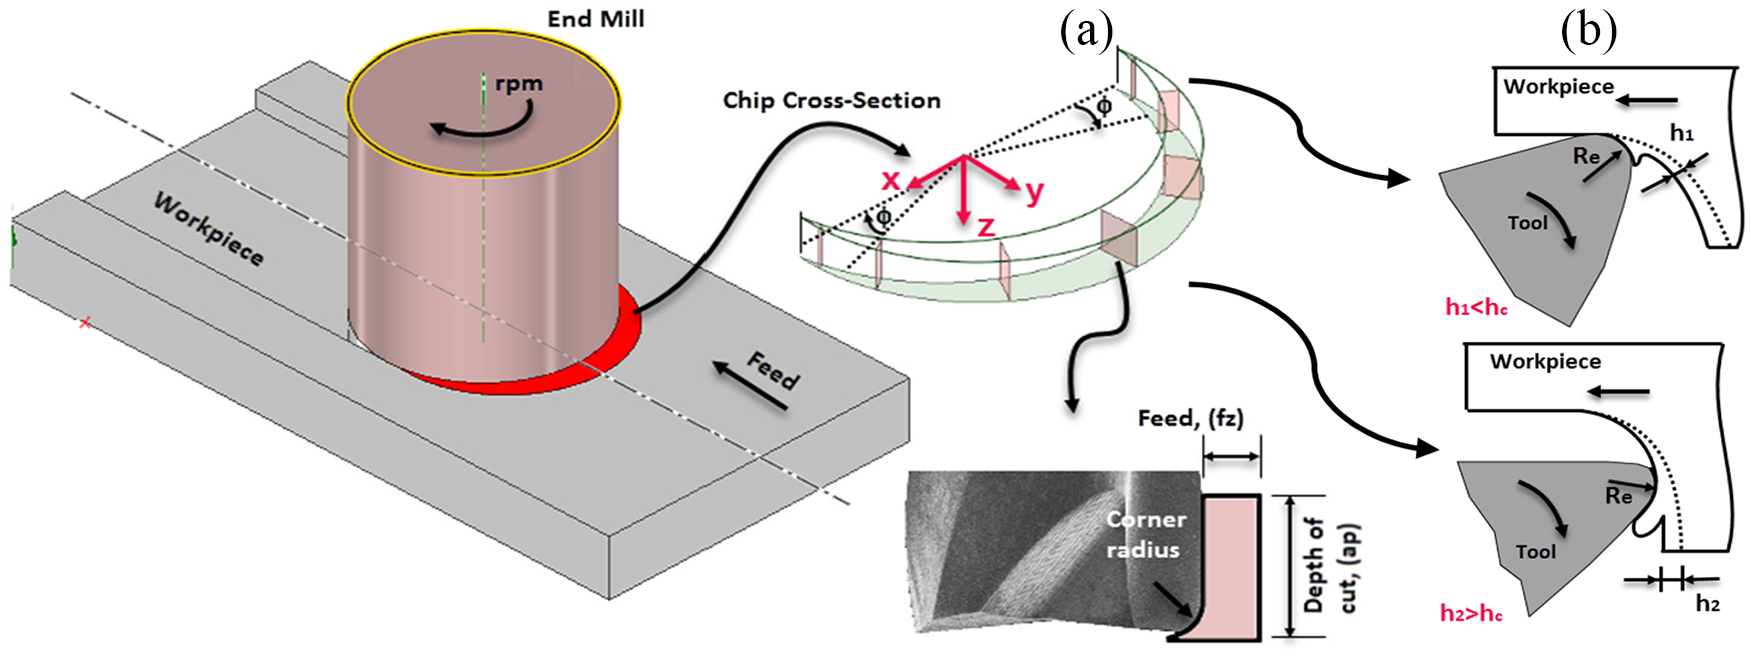
(a) The change of chip cross-section in micro-milling process. (b) Comparison of cutting edge radius (Re) and chip thickness (h).
Analytical and numerical studies have also been carried out to determine the minimum chip thickness in the micro-milling process. Bissacco et al. 8 have developed a cutting force model that takes into account the edge radius. The study also showed that the use of the Stabler rule in micro-milling gives reasonable results. Lai et al. 9 modeled the effect of the cutting edge radius using the finite element method. In the study, finite element simulation results were used to develop the analytical model. It is concluded that the minimum chip thickness for the copper workpiece is 0.25 times the tool edge radius. Sahoo and colleagues10,11 used the mechanistic modeling method to model the size effect in the micro-milling process. An improved undeformed chip thickness algorithm has been presented by considering tool run-out and minimum chip thickness. Sahoo et al. 12 proposed a hybrid approach for prediction of cutting forces in micro-end-milling of titanium alloy Ti6Al4V. In the micro-milling process, the authors developed an undeformed chip thickness model that can be used for each run-out value in the cutting tool.
All mechanical machining processes leave burrs on the machined component. However, in micromachining processes, the burrs formed are significantly smaller than in the conventional machining process. With a second operation, it is very difficult to clean these burrs. Therefore, in the micro-milling process, as far as possible, it is possible to optimize the cutting parameters and minimize this burr formation. A relationship between the minimum chip thickness and burr sizes was also demonstrated by a study. 13 It is stated that the burr width is increased in both the down-milling and the up-milling side when the feed values are smaller than the minimum chip thickness. Burr formation is also closely related to the type of material being machined. Niknam and Songmene 14 stated that the size of the burr was greater in more ductile aluminum alloy. The burr size of Ti6Al4V alloy under micro-cutting conditions has been discussed in various studies.15,16 In addition to the commercial Ti6Al4V alloy, titanium alloys with ultrafine grain structure have been the subject of both experimental and numerical studies. The machinability of these alloys has been investigated by using new material models especially for the cutting force and temperatures that occur during cutting.17,18 Sahoo et al. 19 found that the critical value of the ratio of chip thickness (h) to edge radius (re) is in the range of 0.25 to 0.33. It was emphasized that both burr formation and surface roughness values increase at rates less than h/re = 0.25.
In this study, the hardness value of the workpiece material and burr dimensions are taken into account in determining the minimum chip thickness. Variation of the specific cutting force is obtained for Ti6Al4V and Ti5553 alloys. In this study, for the first time, the minimum chip thickness for the Ti5553 alloy was determined and compared to the Ti6Al4V alloy. In order to determine the effect of the cutting parameters, a wide range of cutting tests was performed. With these in mind, this study will fill an important gap in the literature, as it takes into account all the factors that may affect the minimum chip thickness. In addition, the results may increase the productivity in industrial applications (especially in the biomedical, aerospace and aerospace fields) and in areas where micro-mechanical manufacturing is used.
Experimental procedures
Workpiece materials
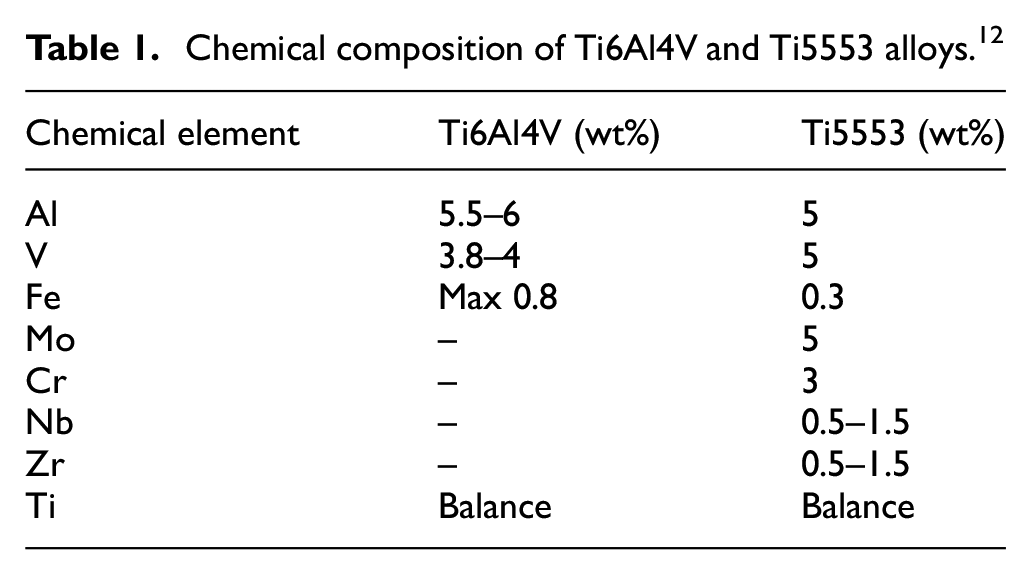
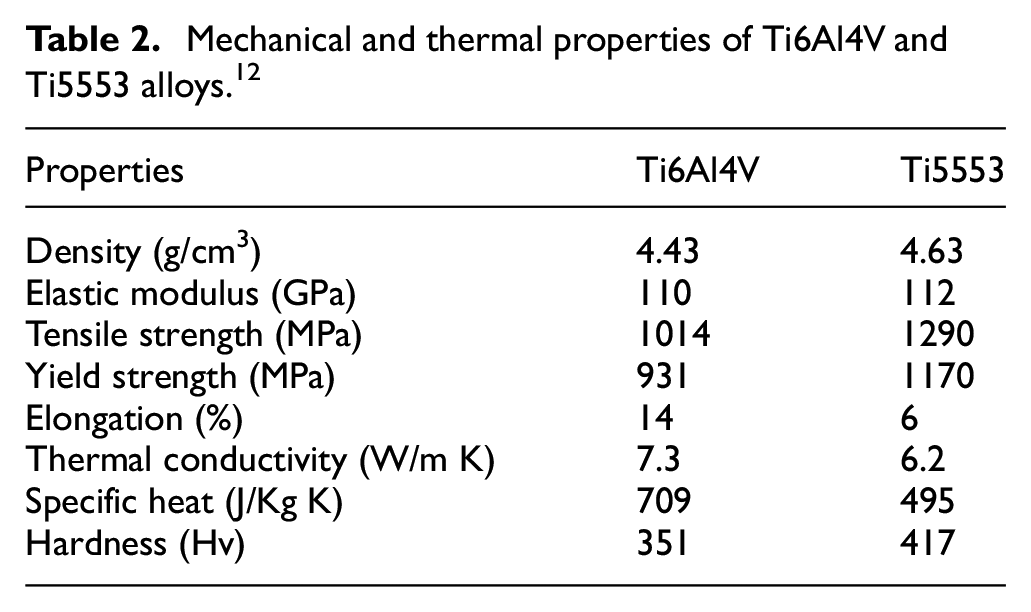
The commercial Ti6Al4V and Ti5553 alloys used in the study are mainly titanium-based. As stated in the previous section, many studies have been carried out on micro-milling of Ti6Al4V alloy. No studies on the machinability of the Ti5553 alloy in micro conditions have been encountered. Both alloy materials used in this study are titanium-based. However, Ti5553 alloy additionally contains Mo and Cr. Ti6Al4V alloy has a hexagonal closed-pack structure, while the Ti5553 alloy is body-centered cubic. The Ti6Al4V alloy contains mainly α phase, while the Ti5553 alloy contains the predominant β phase. Ti5553 alloy is appreciably more difficult to cut than Ti6Al4V alloy because of its phase compounds. 20 The optical photographs of the microstructures of both materials are given in Figure 2. A comparison in terms of their chemical composition and mechanical properties is also given in Tables 1 and 2. The reason why Ti5553 alloy has higher strength values is that it has a greater amount of β-stabilizers (Mo and V). 21
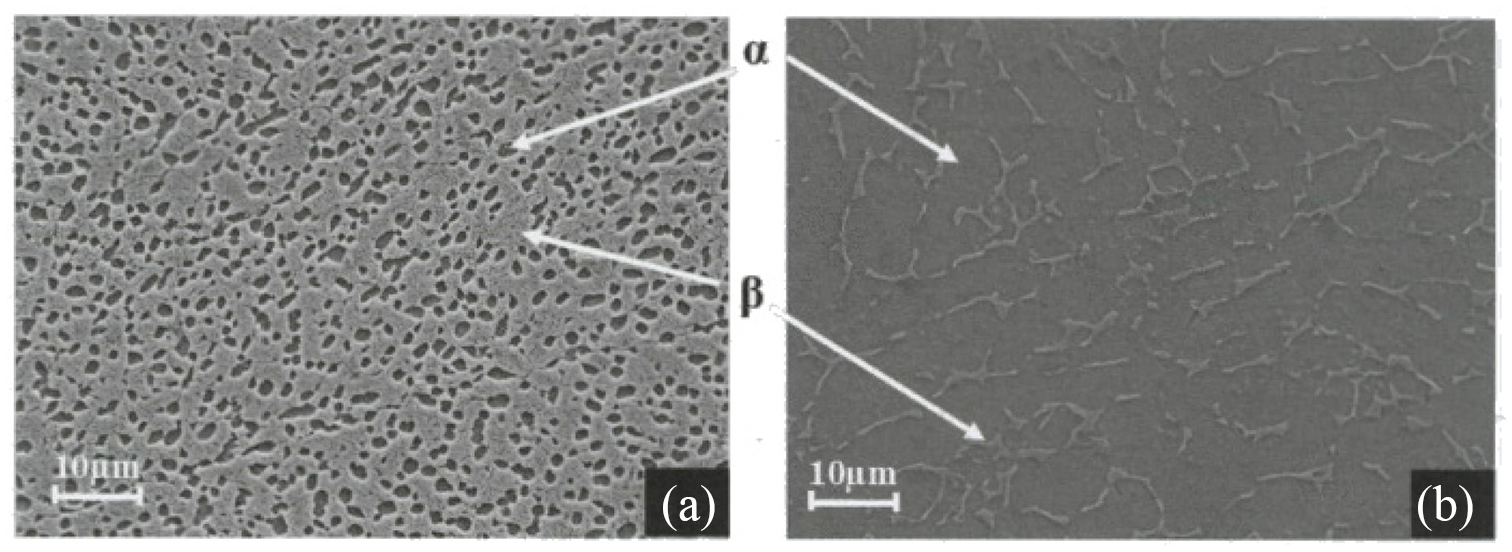
An example of the SEM images of microstructure of (a) Ti5553 and (b) Ti6Al4V.
Chemical composition of Ti6Al4V and Ti5553 alloys. 12
Mechanical and thermal properties of Ti6Al4V and Ti5553 alloys. 12
Cutting tool geometry
For the cutting test, a two-flute carbide micro-end mill with a diameter of 0.6 mm (F2AH0060AWM30L090) from Kennametal was used. The micro-cutting tools used are TiCN-coated and the coating thickness is approximately 2 µm. Prior to the cutting tests, both the tool diameter and the tool edge radius were determined from the SEM photographs. The tool diameter is approximately 600 ± 20 µm, the tool edge radius and nose radius are Re = 3.2 ± 0.18 µm and Rε≅ 6 ± 1 µm respectively. In order to minimize the effect of the tool wear on the cutting forces, surface roughness, and burr formation, a new cutting tool was used for each cutting test. The geometrical properties of the micro-end mill are given in Figure 3(a). The EDX analysis result of the coated micro-end mill is also given in Figure 3(b).
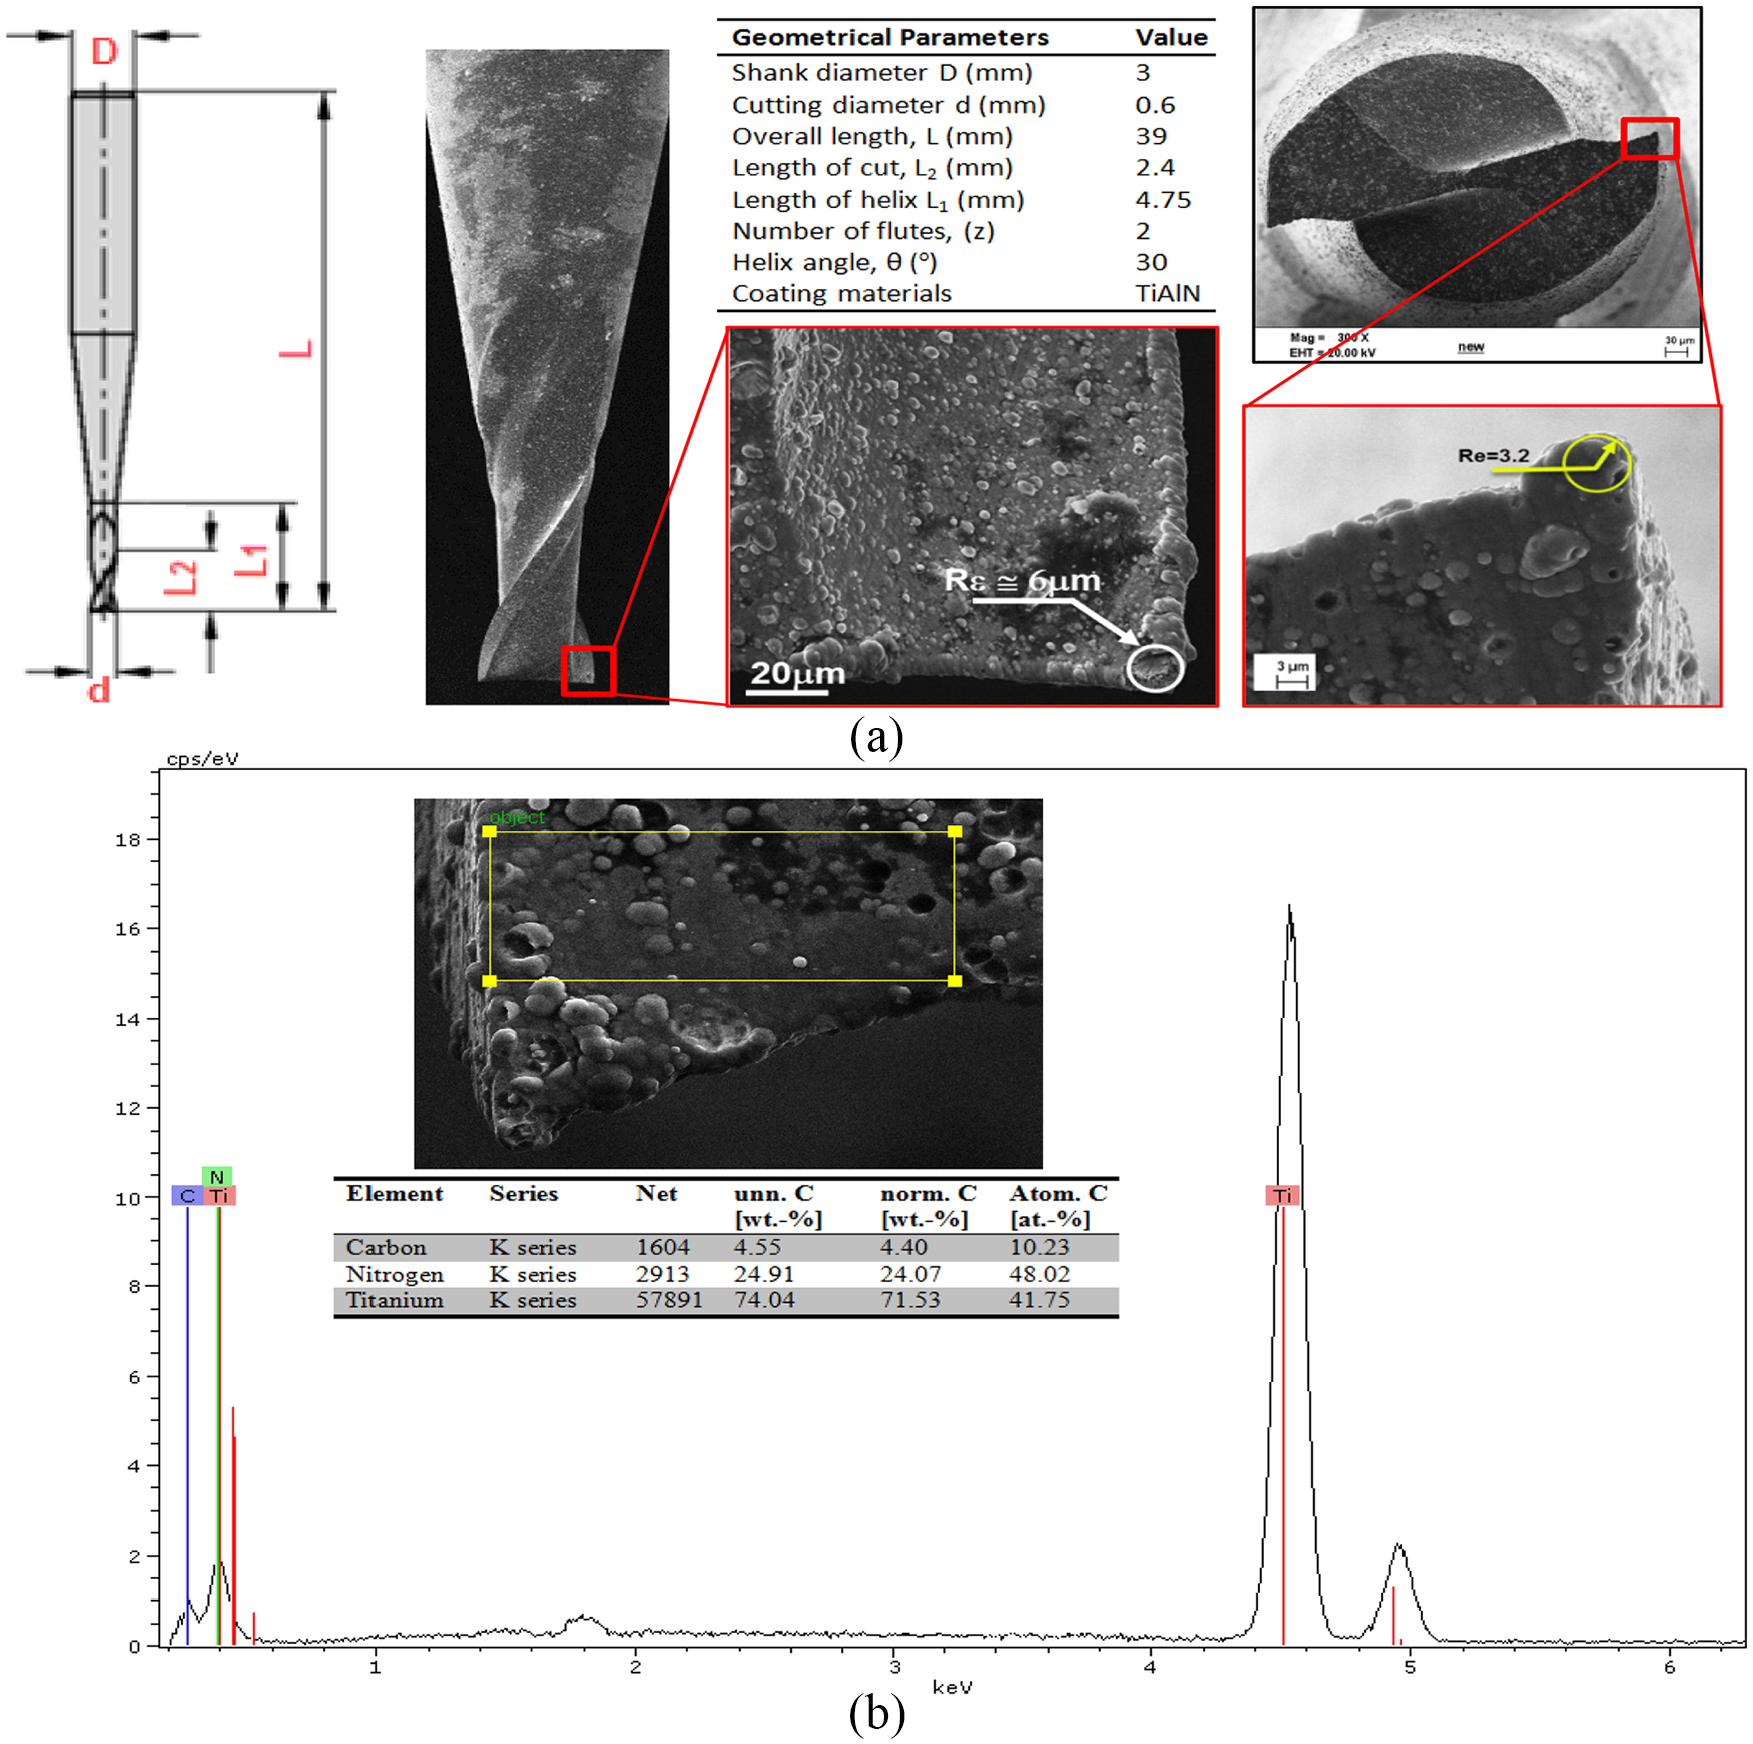
(a) Geometrical properties and SEM images of micro-end mill used in cutting tests (Re: Edge radius, Rε = Nose radius) and (b) EDX analysis result of coated end mill.
Experimental setup and cutting parameters
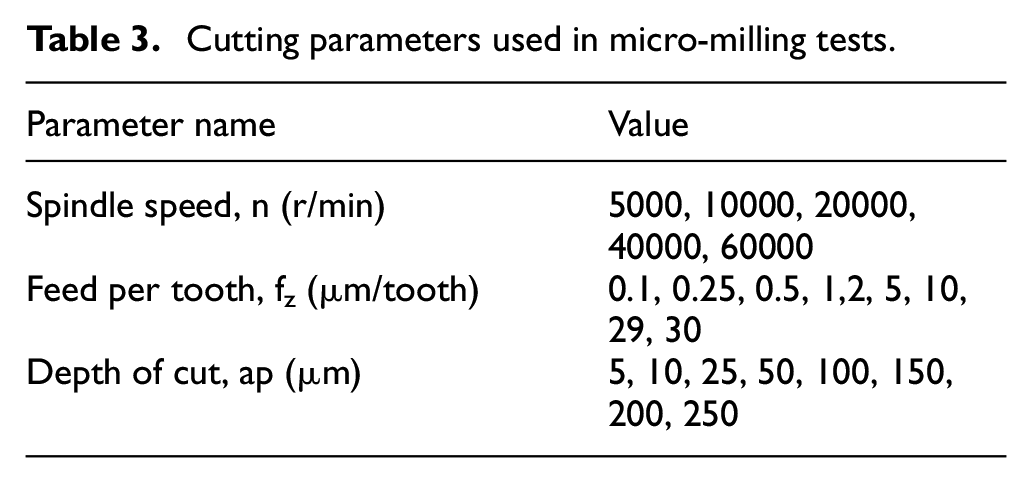
For micro-milling tests, a specially designed micro machining test equipment was used. An IMT spindle (max speed 60,000 r/min) was used. Linear slides (Thorlabs) supported by micro stepper motors are used for axis movements. The maximum travel distance of the slides is 150 mm and the sensitivity is 0.1 µm. In the experiments, a USB microscope (Figure 4(a)) with magnification of 50–800 was used to be able to clearly observe the cutting area. The entire system is mounted on a non-vibrating optical table. The workpiece is fixed to the dynamometer from four different points, and a torque meter is used for the equal tightening torque (Figure 4(b)). The cutting tests were carried out at the same ambient temperature. For both alloys, different speeds, feed rates, and depths of cut were used to determine the effect of the cutting parameters on the cutting force. The cutting parameters used are given in Table 3.
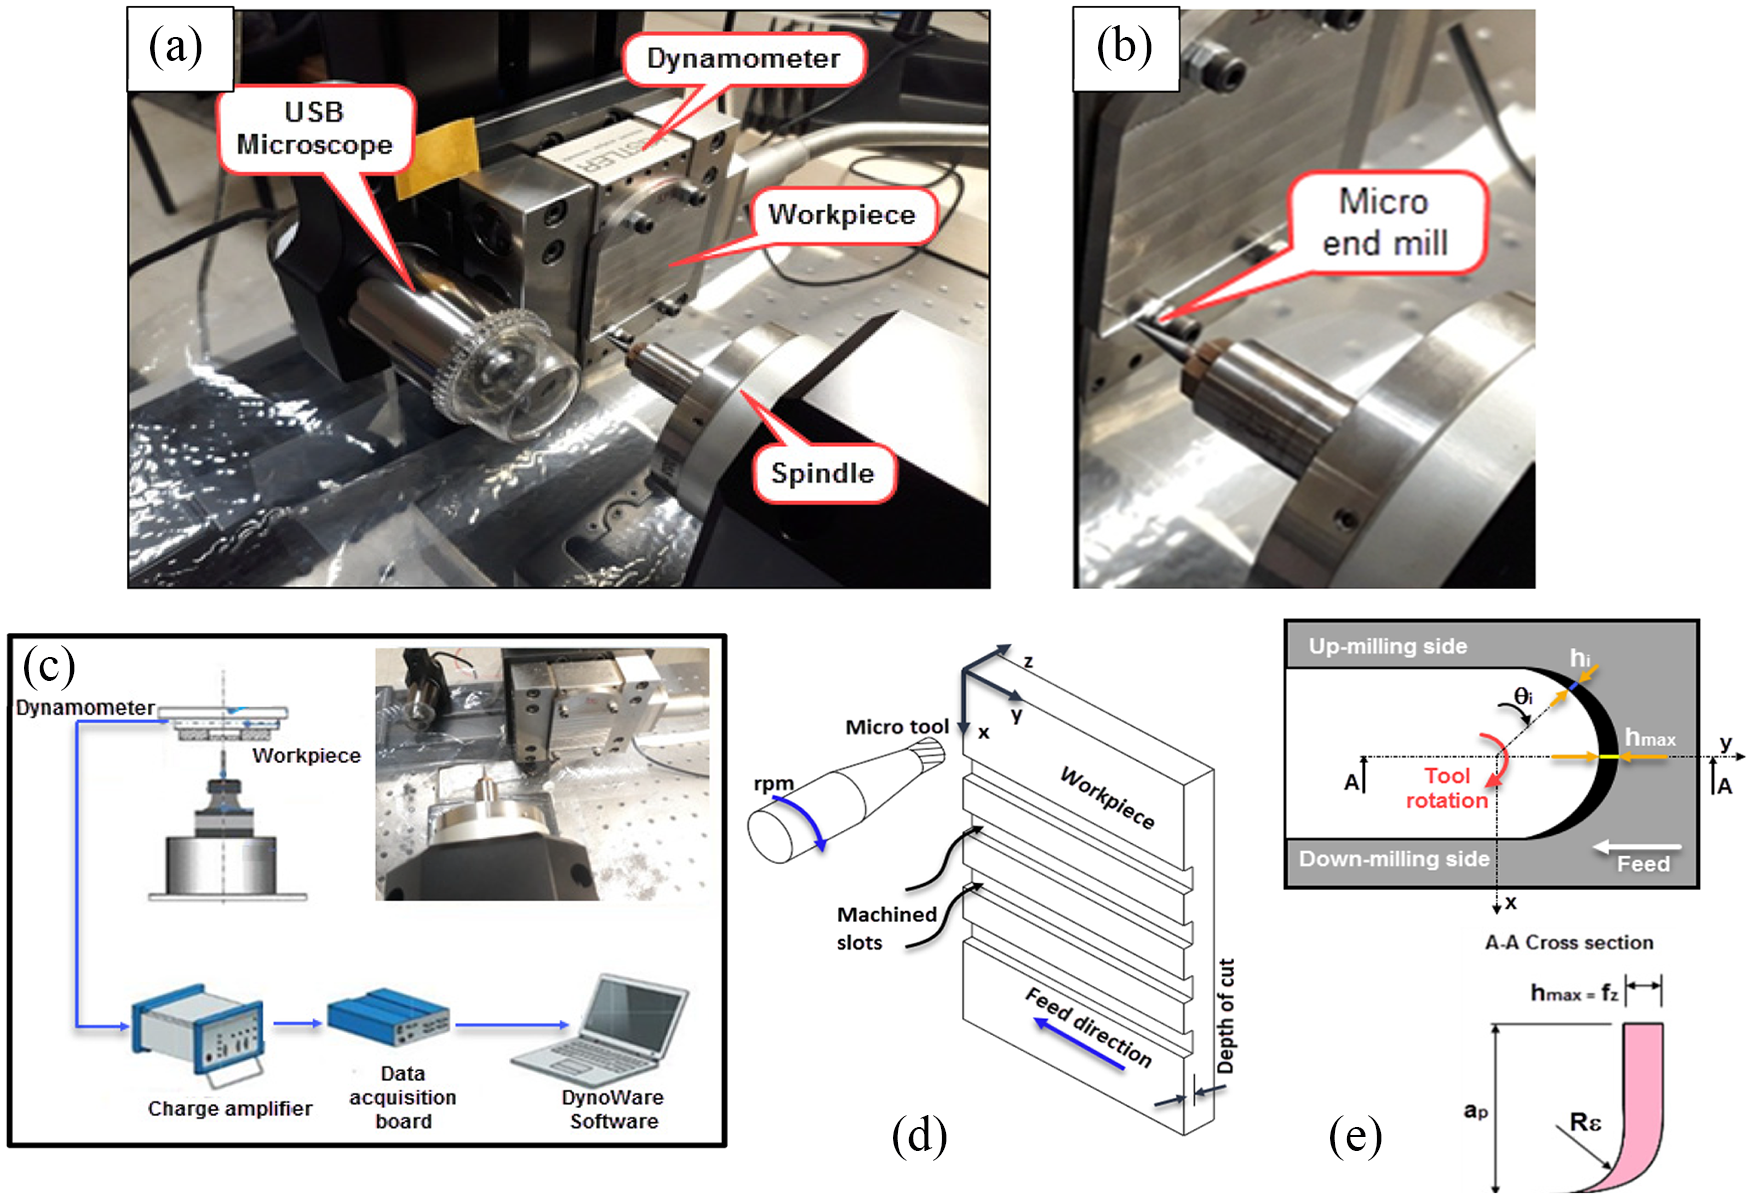
(a) Experimental setup used in micro-cutting tests. (b) Micro-end mill and workpiece material. (c) Schematic representation of cutting force measurement. (d) Coordinate system for cutting tests. (e) Cutting area per revolution.
Cutting parameters used in micro-milling tests.
The cutting forces were acquired with a Kistler MiniDyn 9119A1 three-component dynamometer with its charge amplifier (type 5070). Dynoware software was used to save the cutting force data. The sampling rate of the cutting force measurements was 7 kHz. All cutting tests were repeated at least three times. Where different results were obtained, additional experiments were performed. The cutting distance is kept short to eliminate the effect of the tool wear. Cutting distance is between 2 and 5 mm for low feed rates. Cutting distance 10 mm is taken for high feed rates (fz = 10 and 20 µm). Since the tool used was TiCN coated, tool wear was at low levels. Figure 4(c) shows the setup used for the force measurement experiments. In Figure 4(d), the tool and workpiece feed direction and the coordinate system during cutting are given. Figure 4(e) shows the chip cross-section and down-milling and up-milling sides.
Surface roughness and burr measurement
A Nanovea optical profilometer was used for surface roughness measurements. An optical scan was performed along the slot width to obtain the Sa and Sz values. Three-dimensional profile images of the slot were also obtained (Figure 5(a)). The measurement dimensions taken from the slot are also shown in Figure 5(a). SEM images were used for burr measurements (Figure 5(b)). After cutting, the burr widths at the slot edges were measured separately for both the down-milling and the up-milling sided. The burr width (Wb) was measured with ±2 µm precision using the Screen Caliper software. From the different locations of the machined slot, the average of five different burr widths was taken into account.
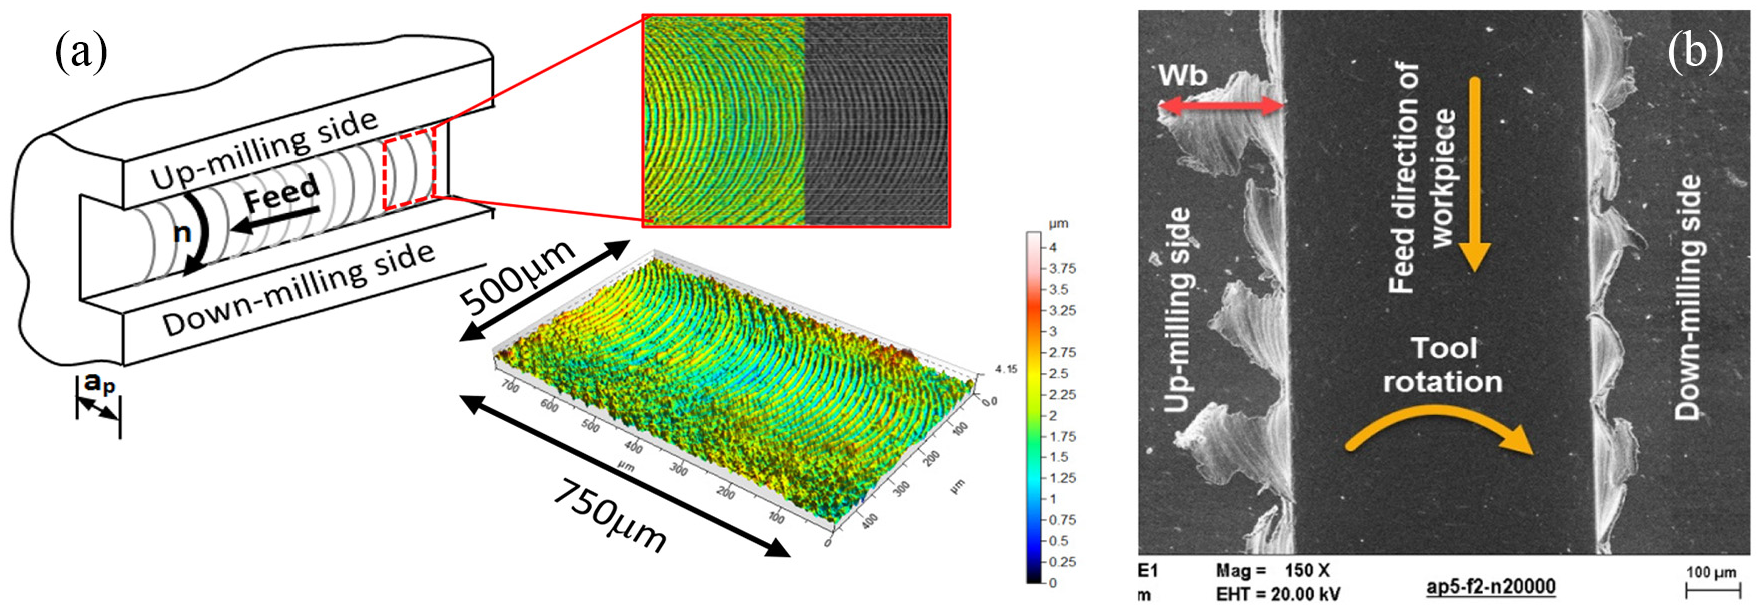
(a) Example of the surface topography of the machined slot. (b) Down and up-milling sides and burr width measurement.
Calculation of specific cutting force
The specific cutting force (SCF) is the amount of required force that is applied to unit cutting area. 22 In particular, since the uncut chip thickness in the micro-milling process and the cutting edge radius are of comparable size, the change of the SCF is used to determine the minimum chip thickness. When the uncut chip thickness is smaller than the cutting edge radius (i.e. h/Re < 1), the SCF shows a nonlinear increase, due to plowing. 5 The SCF is obtained by dividing the average cutting force by the chip section. In this study, SCF was calculated by considering the resultant force of Fx and Fy.
Results and discussion
Effect of spindle speed
Figure 6 shows the change of the maximum cutting forces with increasing spindle speed. Similar to conventional milling, the high-speed rotation of the cutting tool in the micro-milling process results in a reduction of the cutting forces. The Fx and Fy forces show a significant decrease (Figure 6(a) and (b)), while the decrease in the Fz force is negligible (Figure 6(c)). Increased spindle speed causes an increase in temperature in the cutting zone. The higher temperature leads to a decreasing of workpiece hardness (thermal softening) and thus to a decrease of cutting forces. Because the Ti5553 has higher hardness and strength values, the cutting forces are larger. At high speeds (n>20,000 r/min) the cutting forces obtained for both alloys are very close to each other. Therefore, at high cutting speeds, the strength and hardness values of the workpiece can be said to have no importance in terms of cutting forces. The range where the speed is 10,000 to 20,000 r/min is defined as the transition zone. This is because, before the transition zone, the difference between the cutting forces for both alloys increases, while after the transition zone, the difference is minimum.
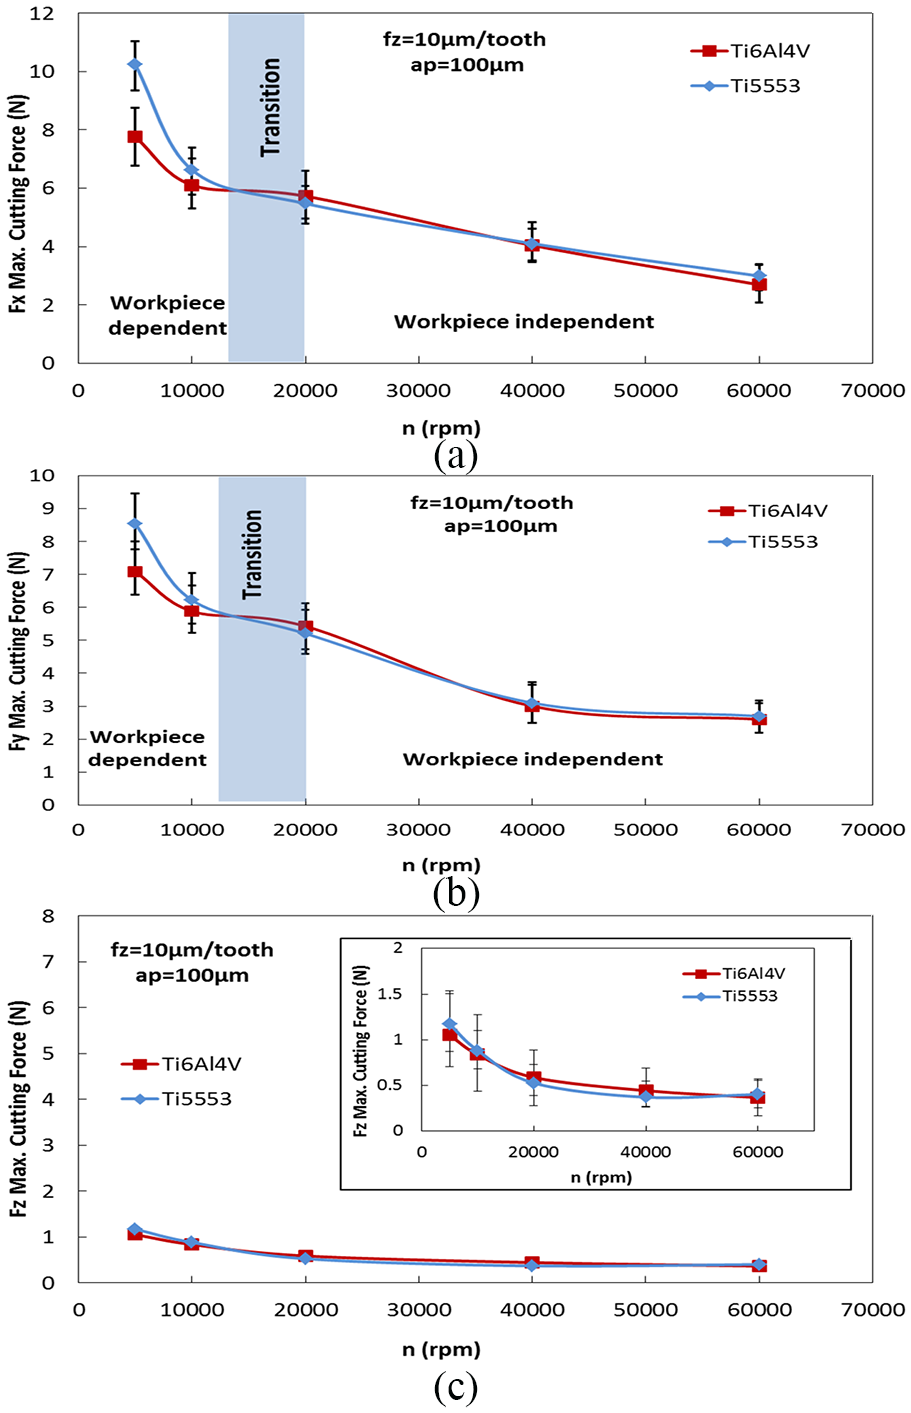
Effect of spindle speed on maximum cutting forces at fz = 10 µm/tooth and ap =100 µm. (a) Fx forces. (b) Fy forces. (c) Fz forces.
Effect of feed rate
For both alloys, the feed rate in a wide range (fzmin = 0.1 µm/tooth and fzmax = 30 µm/tooth) was selected to determine the minimum chip thickness. In micro-milling, the feed rate directly affects both the cutting forces and the surface roughness. Figure 7 shows the variation of the cutting forces Fx and Fy depending on the different feed values for both titanium alloys. The cutting forces show a sharp increase for fz≤ 0.5 µm/tooth. For both alloys, the fz = 1 µm/tooth can be considered a transition point between the sliding and plowing mechanisms. In a study by Liu et al., 23 a similar transition point was obtained for materials with ferrite and pearlite phases. For Ti6Al4V alloy, the transition between the plowing and sliding mechanism is more clearly observed. In the Ti5553 alloy, the cutting force is increased for fz < 1 µm/tooth. There is no reduction in cutting force, and only the slope of the graph changes. At feed rate values smaller than the minimum chip thickness, since the cutting tool radius is much larger than the chip thickness, a dominant plowing cutting occurs. 24 This causes the cutting force to increase. In Figure 7, this is the reason why the cutting forces obtained in the Ti6Al4V alloy for fz≤ 1 µm/tooth are larger. With the increasing feed value, the difference between the cutting forces obtained for both alloys is reduced. For fz > 14 µm/tooth, the cutting forces obtained in the Ti5553 alloy are higher. The most important result that can be drawn from Figure 7 is that, regardless of the edge radius of the cutting tool, the plowing occurs in the micro-milling of the Ti6Al4V alloy for the fz≤ 14 µm/tooth. In the case of Ti5553 alloy having higher hardness, this elastic deformation is minimal. As a result, only the minimum chip thickness or smaller thicknesses do not result in elastic deformation. Elastic deformation can also occur at greater feed values (fz≅ 4. Re) than the edge radius. This feed value is shown in Figure 7 as the “plowing limit.” When machining is performed at fz > 14 µm/tooth, the effects of plowing and elastic recovery are insignificant enough to ignore, and the cutting mechanism is considered to be shearing.
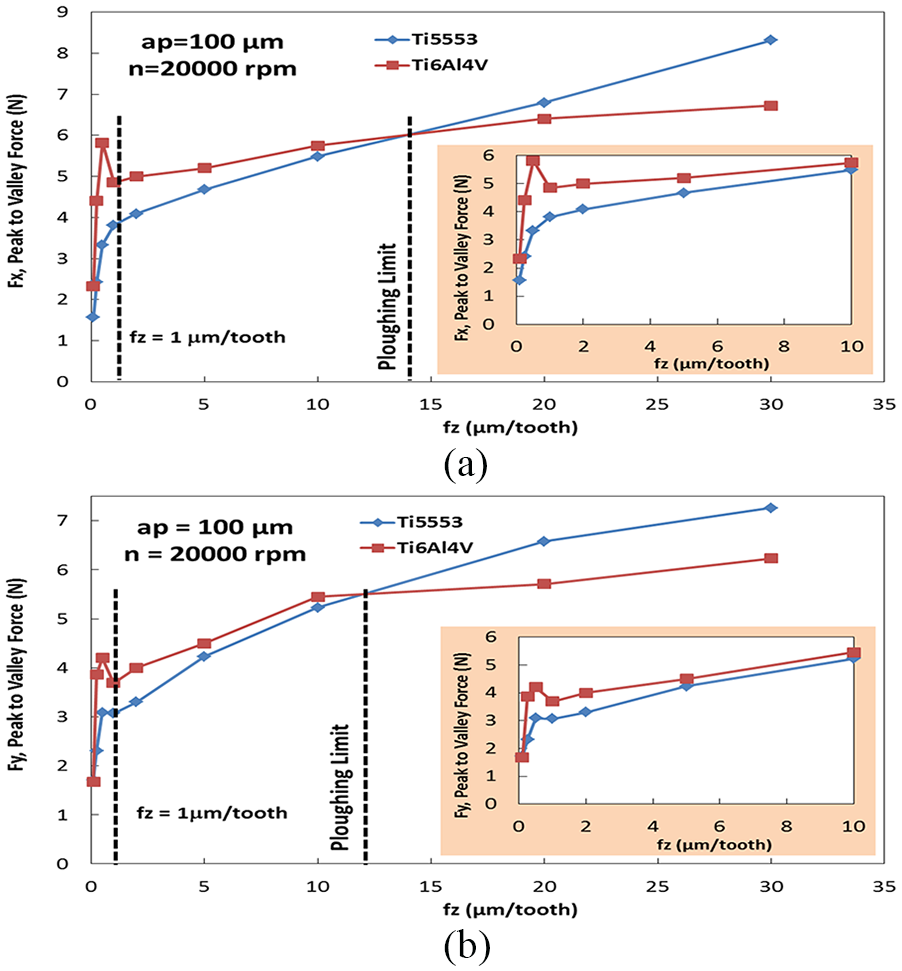
Variation of Peak-to-Valley cutting forces with feed per tooth: (a) Fx force. (b) Fy force.
Effect of depth of cut
Figure 8 shows the change of the cutting forces Fx and Fy obtained for both alloys, depending on the increased depth of cut. For both titanium alloys, the cutting forces increase linearly, depending on the increased depth of cut. Figure 8 shows the variation of the forces Fx and Fy for two different feed values (2 µm/tooth and 20 µm/tooth). For fz = 2 µm/tooth, the cutting forces for the Ti5553 material are lower. But for fz = 20 µm/tooth, the cutting forces for Ti5553 are higher. The results obtained in Figure 8 confirm the results obtained in Figure 7. The cutting forces obtained for the Ti6Al4V alloy are higher at the feed values closer to the minimum chip thickness. This is because the material having a lower hardness has higher plowing forces. For fz > 15 µm/tooth, the cutting can be said to occur as a result of shear mechanism. Therefore, higher cutting forces were obtained in the Ti5553 alloy having a higher hardness at feed rate of 20 µm/tooth.
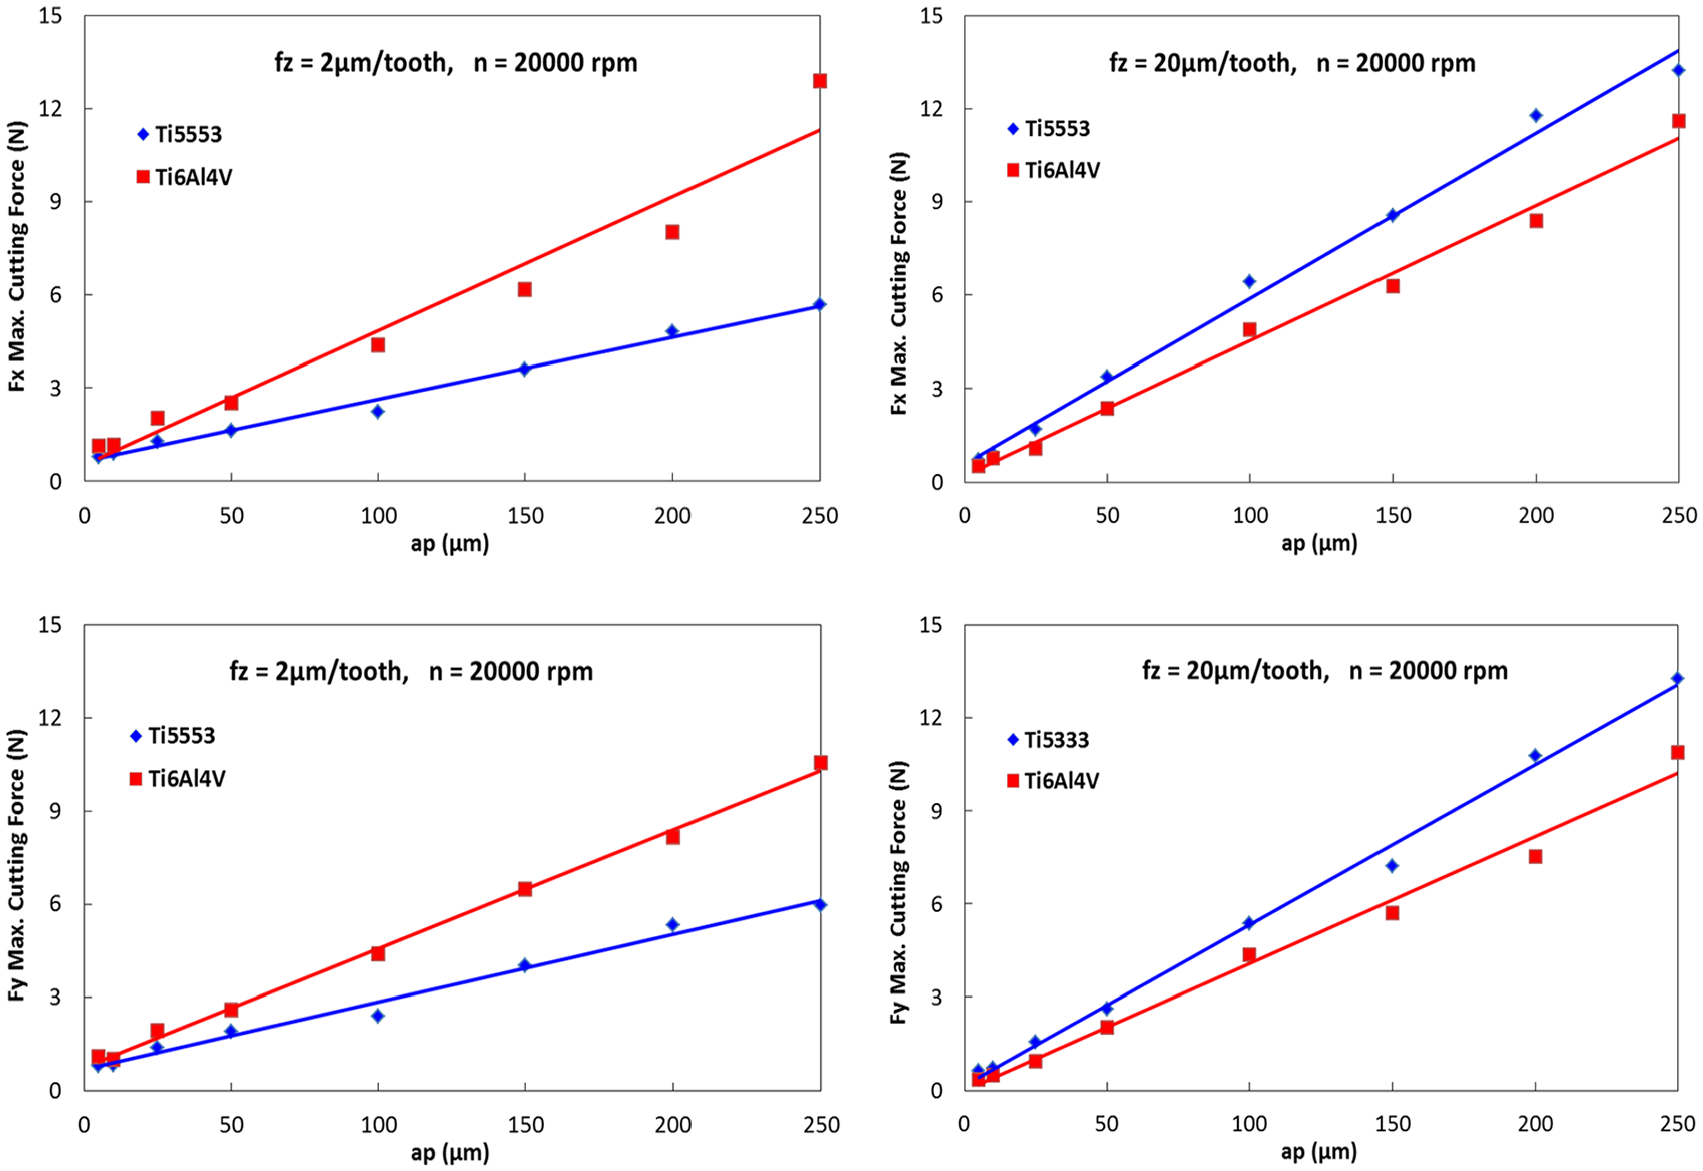
Depth of cut versus maximum Fx and Fy cutting forces for two different feed rates (fz = 2 and 20 µm/tooth).
Variation of SCF
To determine the minimum chip thickness, the feed rate per tooth was incrementally increased. Therefore, the minimum chip thickness was determined depending on the change in the SCF. Besides, the change in the SCF was also investigated due to the increased depth of cut. As shown in Figure 9, the SCF increases asymptotically, depending on the decreasing feed rate value. In the small graph in Figure 9, for the fz = 2 µm/tooth, the change of the SCF is given in more detail. The SCF for fz = Re varies very little and the difference of the alloy does not change the result. For fz = 2 µm/tooth, the SCF shows a significant increase. It is possible to define this area as plowing. In this region, the cutting is not carried out by the shear mechanism. The plowing mechanism is more dominant. In this case, the maximum elastic deformation occurs, which means an increase in the cutting forces acting on the micro tool. The Ti6Al4V alloy has a higher SCF. In the plowing region, it can be deduced that the Ti6Al4V alloy is more difficult to cut and requires more energy to cut.
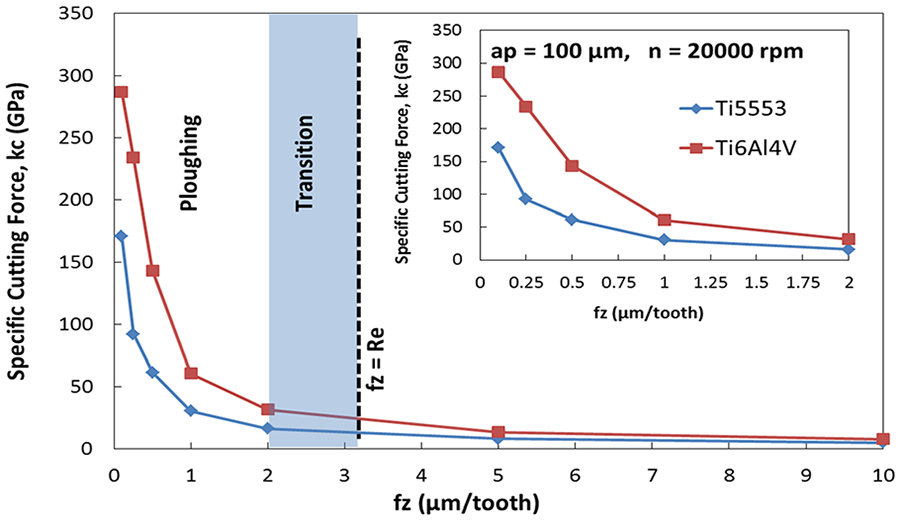
Variation of SCFs with feed per tooth for Ti6Al4V and Ti5553 alloys.
Surface roughness
Figure 10 shows the variation of the surface roughness (Sa) of the machined slot surface with the feed rate. The Sa values of both titanium alloys show a similar trend. Especially, the surface roughness values increase rapidly for fz≤ 2 µm/tooth. This means that the surface quality deteriorates. This is because the cutting process is mainly the result of the plowing mechanism. For fz≤ 2 µm/tooth, the cutting tool causes plowing on the surface of the workpiece rather than cutting with the shear mechanism. In Figure 10, in terms of surface roughness, the minimum chip thickness is about 2 µm and does not change with the hardness/strength of the alloy. The Sa values obtained for the Ti6Al4V alloy are slightly higher. In addition, the Sa value for fz > 2 µm/tooth increases linearly. In terms of surface roughness, it can be said that the cutting process for fz > 2 µm/tooth is predominantly a result of the shear mechanism.
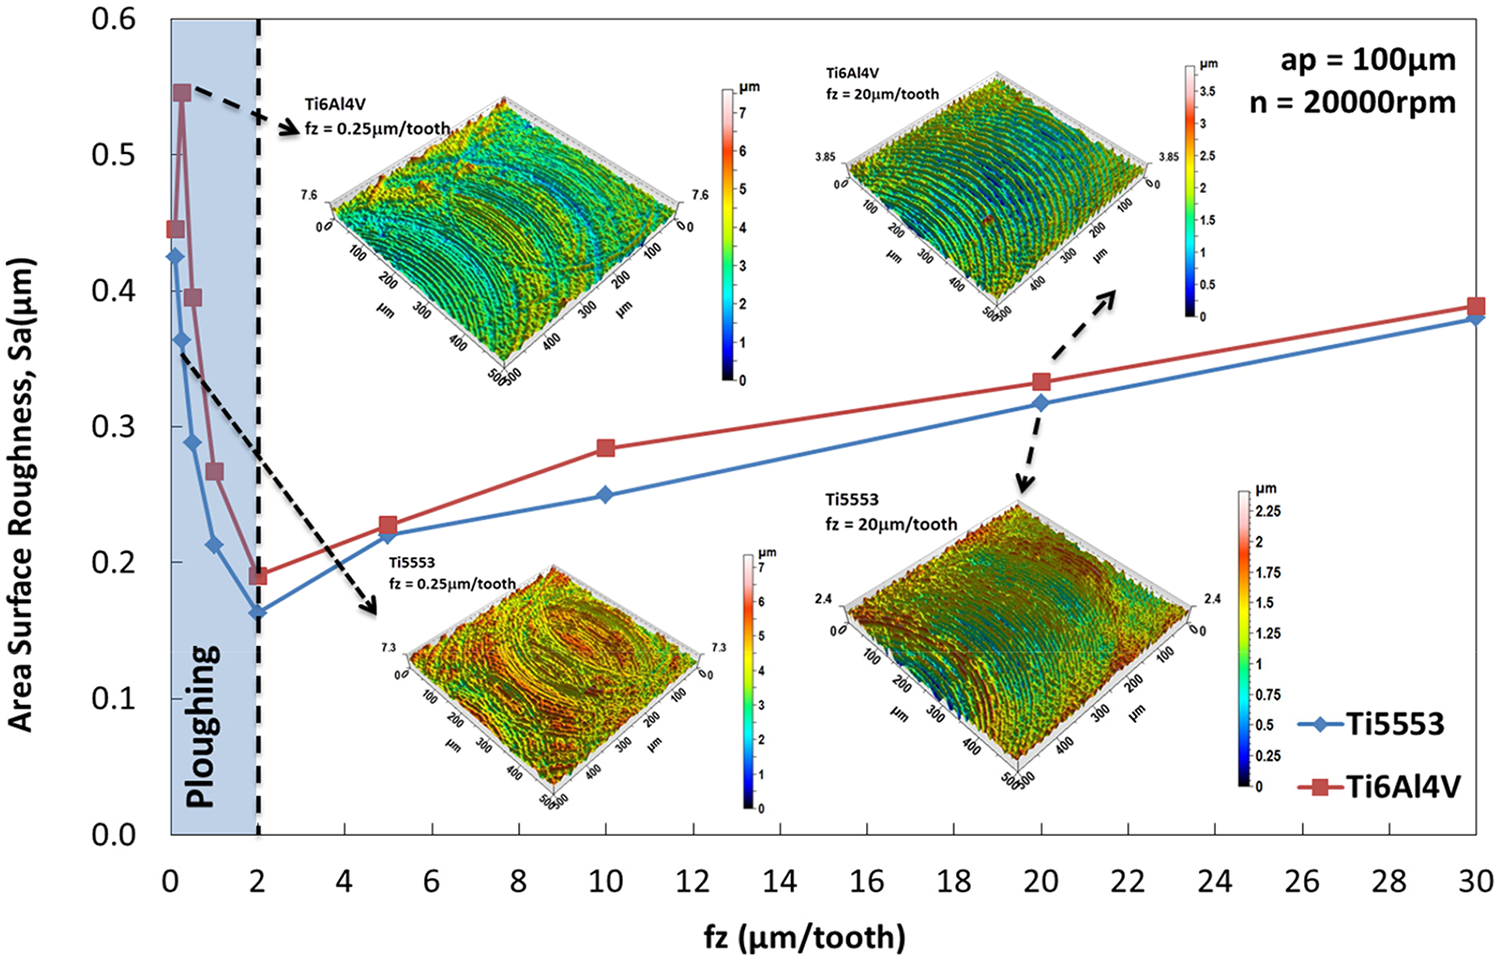
Variation of area surface roughness depending on feed rate, and 3D surface profile examples for machined surfaces.
Figure 11(a) shows the variation of surface roughness values for different spindle speeds. The surface roughness decreases with increasing speed. In cutting operations up to 15,000 r/min, the Sa values tend to decrease significantly. For Ti6Al4V alloy, the Sa value decreases from 0.5 µm to about 0.22 µm. A similar trend is also present in the Ti5553 alloy, but it is not as clear as for Ti6Al4V. For Ti5553, the minimum Sa is about 0.3 µm. The surface roughness in the range of 15,000–40,000 r/min for the Ti6Al4V material is slightly increased. From 40,000 to 60,000 r/min, the Sa values remain constant. For both materials, cutting above 15,000 r/min can be advantageous in terms of surface roughness. Therefore, taking into account the tool life, cutting at a speed in the range of 15,000–40,000 r/min results in better surface quality and a longer tool life. In Figure 11(b), for both alloys, the effect of the depth of cut on the surface roughness is given. The Sa values obtained for the Ti6Al4V material are higher than those obtained for the Ti5553. For both alloys, the Sa values follow a similar trend. The interesting point is that the Sa values do not change significantly for ap < 150 µm. For ap > 150 µm, the Sa values increase asymptotically. For this reason, the area where the depth of cut is smaller than 150 µm is named as the “area which is independent of the depth of cut.” Increased cutting depth causes elastic deflection in the micro-end mill. Since the elastic deflection in the cutting tool results in increasing the radial deflection of the tool and the surface quality also deteriorates.
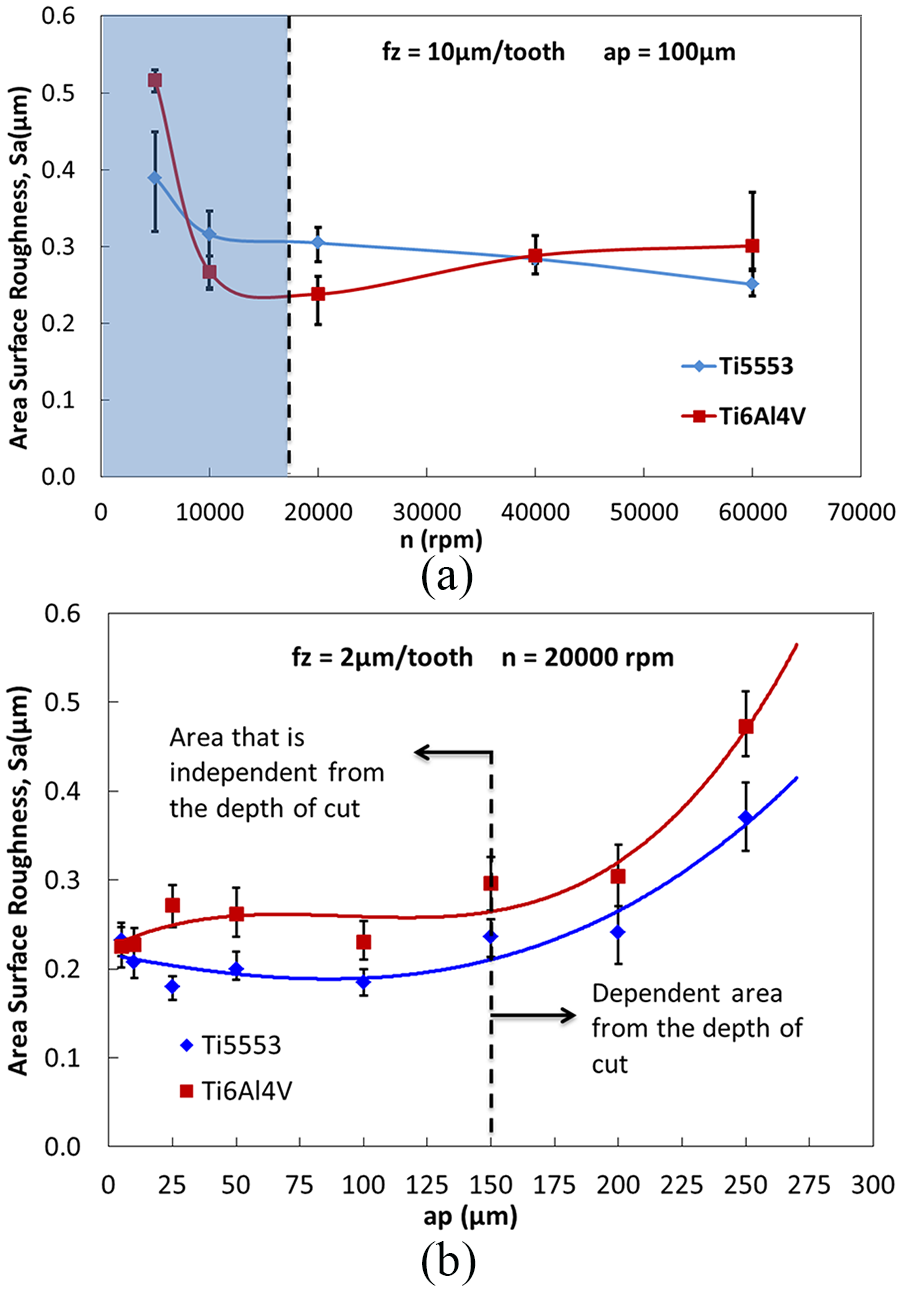
(a) Effect of spindle speed and (b) Depth of cut on area surface roughness for both alloys.
Figure 12 shows three-dimensional surface profile images of the machined slot surfaces for both alloys. The scale on the right side of the images shows the distance between the maximum and minimum heights. For both materials, this value is about 6–6.5 µm at 5000 r/min, and 2.75–3.75 µm at 40,000 r/min. With increasing speed, the difference in height between surface marks means that the surface is of better quality. At 5000 r/min, a height difference is noticeable in the middle of the slot with the points where the cutting starts and ends. This is a clear indication that plowing has occurred. Along the width of the slot, the depth of the slot also varies. While the central region of the slot was deeper, the regions nearer to the edge remained shallower. The depth difference at 5000 r/min is 4.15 µm and 5.16 µm for the Ti5553 and Ti6Al4V alloys respectively. At 4000 r/min, it is measured as 1.57 µm and 1.82 µm. At a low speed, the micro tool is subjected to radially greater deflection at the points where the cutting starts and ends. This deflection occurs due to unstable cutting and plowing. This amount of deflection is greatly tolerated by the rotation of the tool at high speeds. Therefore, the depth difference at high revolutions remains lower.
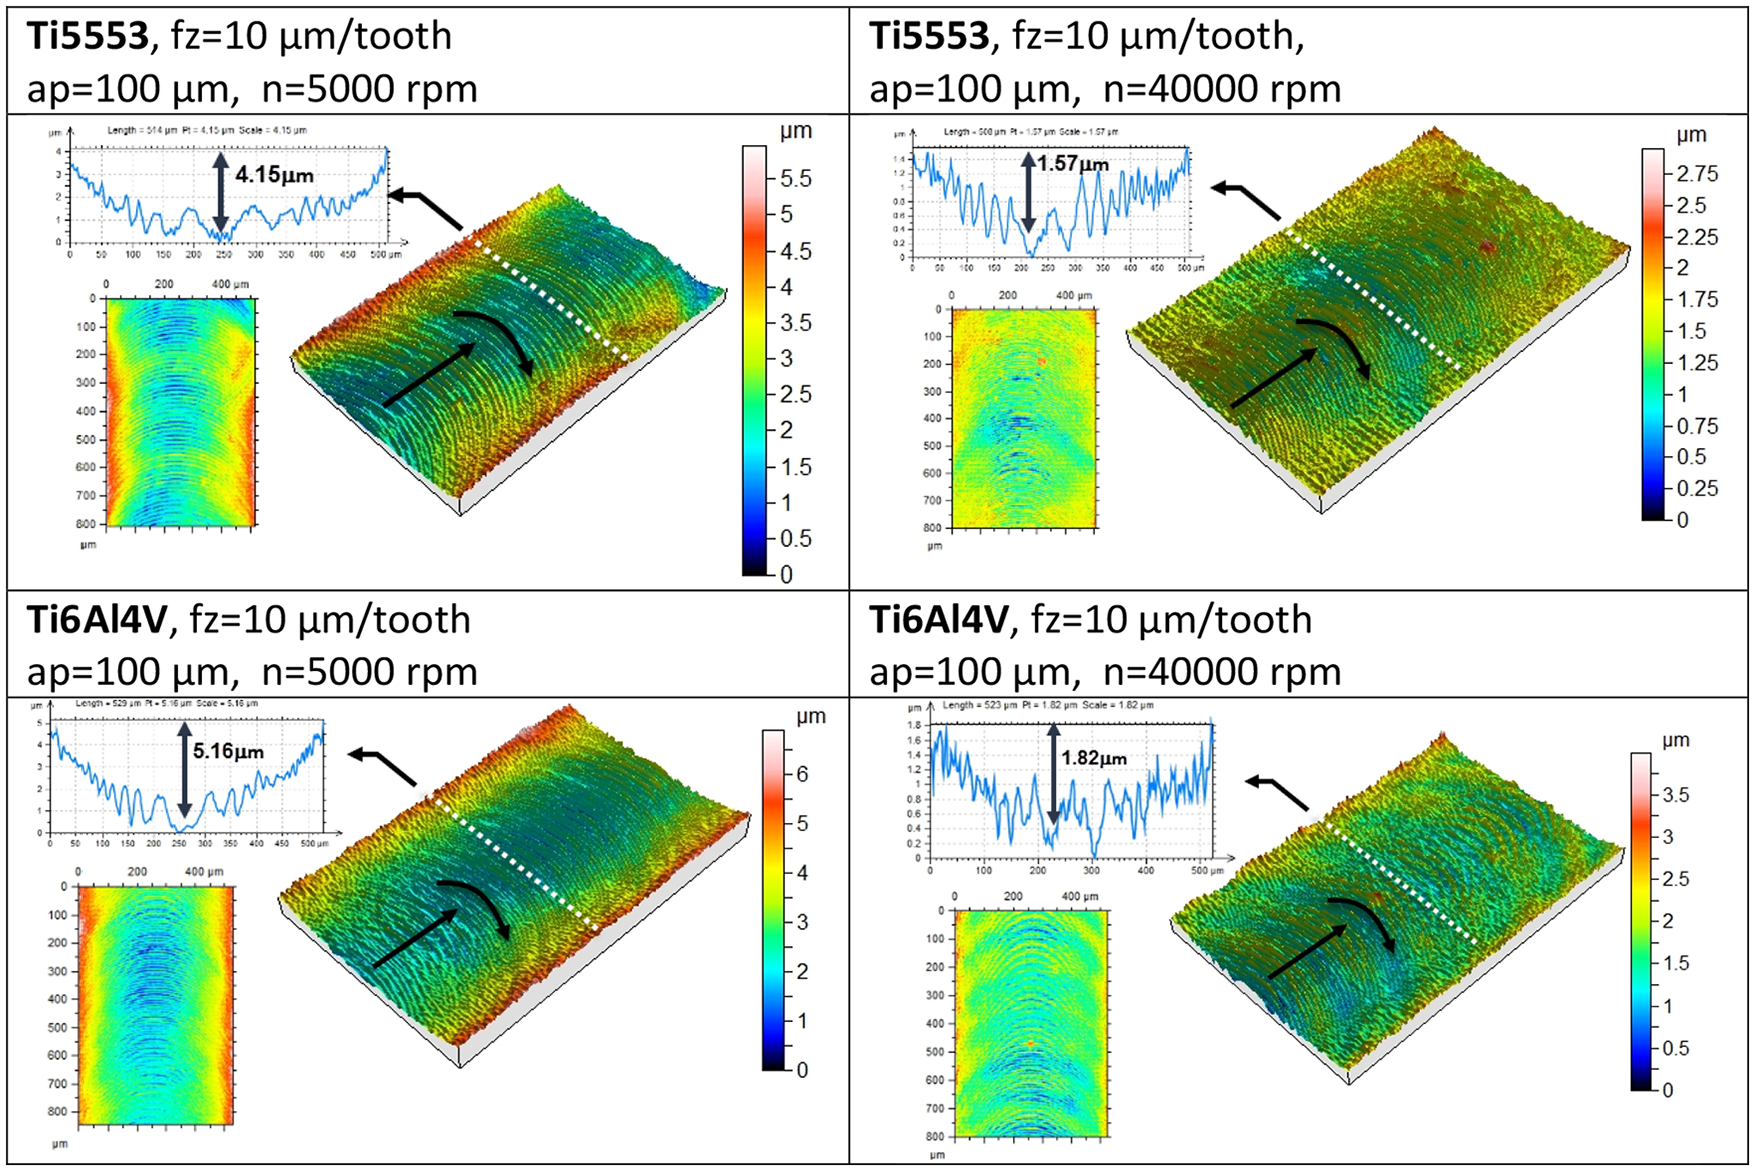
3D surface images obtained after cutting at two different speeds for both alloys.
Burr formation
At the end of the cutting process, the burr width at the machined slot edges was measured from the SEM images. Screen Caliper software was used for the measurement process. The burr width of the machined slot on both sides (down-milling and up-milling) was measured. The burr width measurement was performed at five different positions on the machined slot edges and the averages of these measurements were taken into account. Figure 13(a) shows the variation of the burr width, depending on the feed rate for the down-milling. Figure 13(b) shows the change of the burr width for up-milling. On the down-milling side, the maximum burr width for Ti6Al4V was obtained at fz = 0.5 µm/tooth and fz = 1 µm/tooth for Ti5553. On the up-milling side, the maximum burr width for Ti6Al4V and Ti5553 was 1 and 2 µm/tooth respectively. In terms of the burr width, the minimum chip thickness is different for the two alloys. Moreover, the minimum chip thickness also varies with the milling direction. On the up-milling side, the minimum chip thickness is two times higher than on the down-milling side. Due to the plowing-dominated cutting process, both the burr width is increased and chip smearing is produced. Therefore, the burr width obtained in the Ti6Al4V alloy is larger. For fz = 0.1 µm/tooth, the burr width of the Ti6A4V alloy is approximately three times greater than the Ti5333 alloy. On the up-milling side, the minimum chip thickness increases for both alloys. At the down-milling side where the tool leaves the workpiece, both the burr width is larger and the minimum chip thickness is smaller. On the other hand, when the tool penetrates the workpiece, on the up-milling side, the burr width is smaller, while the minimum chip thickness is larger. According to Figure 13 for the fz > 20 µm/tooth, the burr width is minimum and does not change depending on the type of alloy.
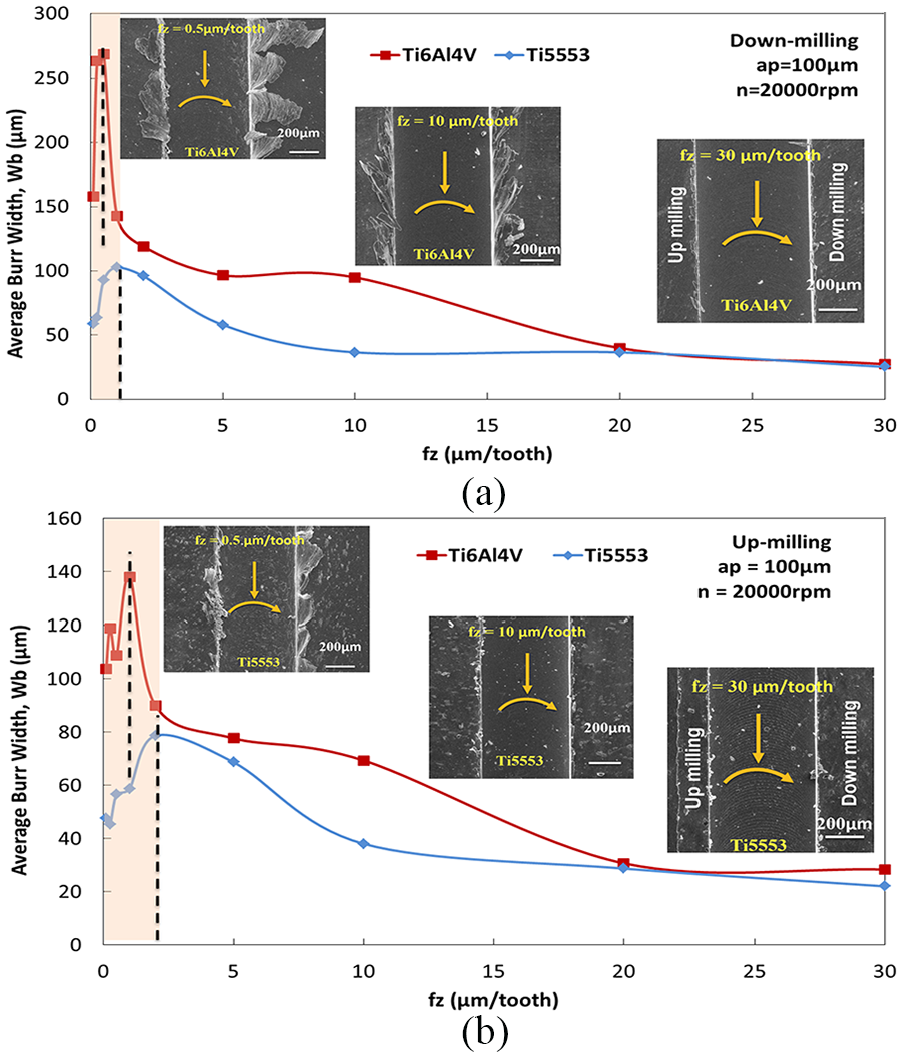
Effect of feed per tooth on average burr width for (a) down-milling side and (b) up-milling side.
Figure 14 shows the variation of the burr width with the depth of cut for down-milling and up-milling. In the down-milling, the burr width obtained in Ti5333 is very low compared to Ti6Al4V alloy. With the increased depth of cut, the burr width change in Ti5333 is also low compared to Ti6Al4V. For Ti6Al4V material, the burr width is significantly increased at the depth of cut above 150 µm. The burr width of Ti6Al4V alloy at 250 µm depth is three times higher than Ti5553 alloy. With the increase of the depth of cut, the axial distance of the chip increases. In the angular position of the tool before leaving the workpiece, the chip thickness approaches zero. With the increase in the axial depth of cut, the amount of chip forced into the slot edge without cutting is increased. This results in an increased burr width. In Figure 14, for up-milling the burr width changes with the depth of cut. An interesting point here is that the burr width obtained in Ti5553 for ap > 100 µm is much higher. In addition, the burr widths obtained for both materials in the range of 100 µm < ap < 200 µm are minimal and close to each other.
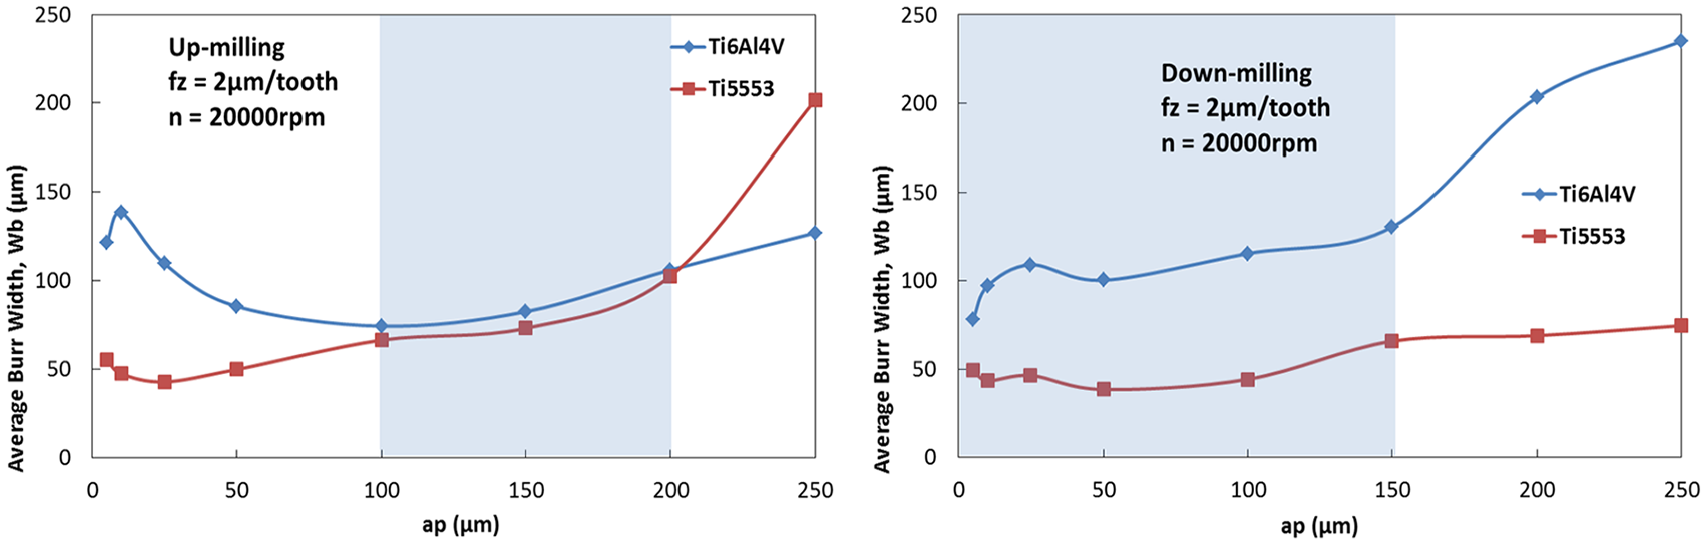
Effect of depth of cut average burr width for down and up-milling sides.
Figure 15 shows the SEM images of the burr widths obtained for different depths of sawdust. It is seen that the burr images obtained in Ti5553 alloy are very low for ap < 150 µm. For ap = 25 µm, the burr widths of both alloys are equal in both cutting directions (up and down-milling). However, the burr width obtained in the Ti6Al4V alloy is twice as high. At ap = 150 µm, the burr widths are increased for both alloys. This increase is more clearly observed in the Ti5553 alloy. The burr width obtained in Ti6Al4V is greater, especially in the down-milling region. An interesting result in Figure 15 is the formation of burrs obtained for ap = 250 µm. In the up-milling area of both alloys, the burr is formed inside the channel, not on the side of the channel. However, the Ti5553 alloy has a higher burr width in the channel. In the up-milling side, the cutting tool stacks the burr on the slot wall instead of removing it from the slot. This also shows that due to high chip loads tool helix fails to carry the cut chips upward. Increasing the depth of cut for both alloys causes the burr width to increase and the burr geometry changes significantly. Especially for ap = 250 µm, the burr occurs not on the edge of the slot but on the surface of the machined slot. Naturally, the cleaning of such a burr is almost impossible.
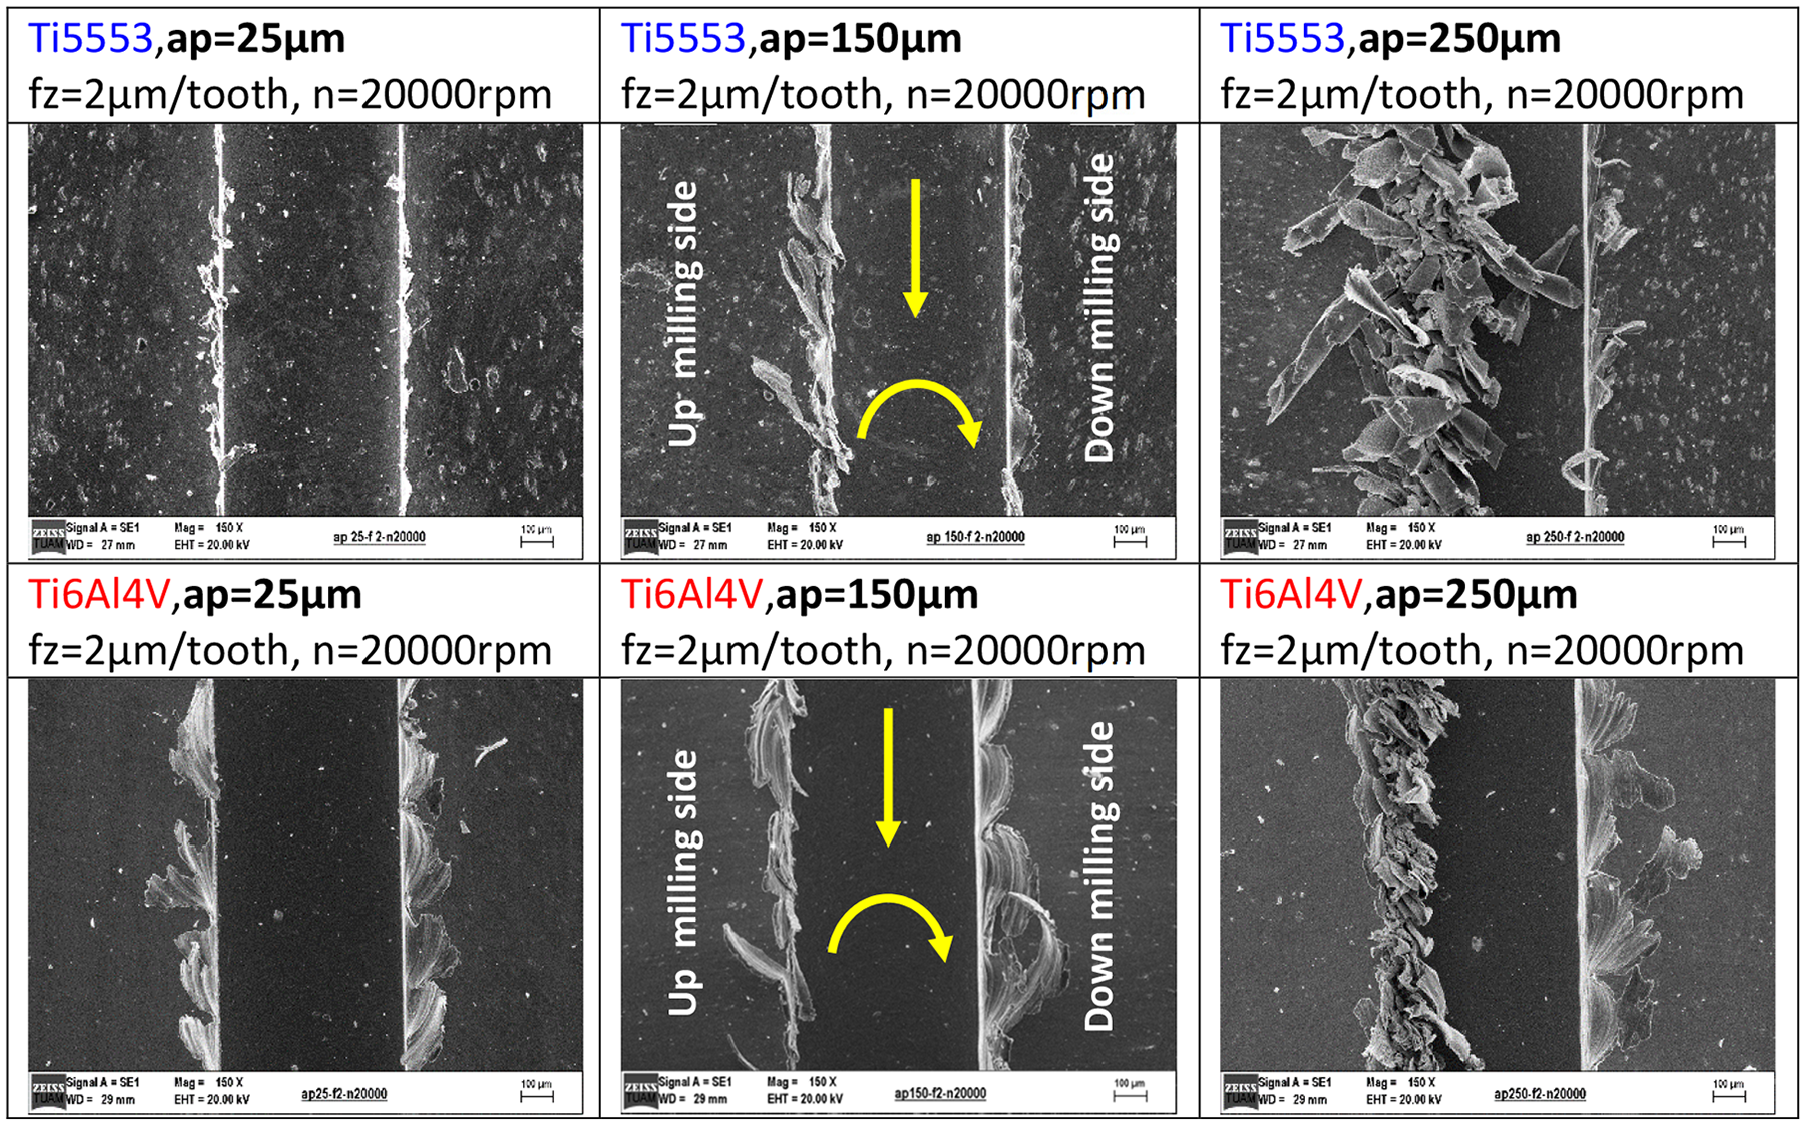
SEM images of machined slots for different depths of cut for both alloys at fz = 2µm/tooth, n = 20,000 r/min.
Discussion
In the Ti5553 alloy, which has high hardness, the radial and tangential cutting forces are higher, but the fz force is very similar for both alloys. Cutting at low speeds (n < 10,000 r/min) may cause the radial deflection of the cutting tool to increase. 25 Naturally, the radial deflection in the tool reduces the quality of the treated surface. Considering the tool life with the Sa values, it can be said that the appropriate speed for both Ti6Al4V and Ti5553 alloy is 20,000 r/min and above. It is possible to deduce that the minimum chip thickness is 1 µm from the variation of Fx and Fy forces with feed rate (Figure 5). The difference between the forces obtained for both alloys increases for fz≤ 1 µm/tooth. The reason for the greater cutting forces in the Ti6Al4V alloy is the plowing. Because the Ti6Al4V alloy has a lower hardness, the higher plowing forces cause greater recovery force. An interesting point in this study is that the cutting forces obtained in the Ti5553 alloy for fz≤ 15 µm/tooth are higher. In fact, the expected cutting force for Ti5553 is higher in the values above the minimum chip thickness (fz≥ 1 µm/tooth).
The minimum Sa values were obtained for fz = 2 µm/tooth. Therefore, in terms of surface roughness, it can be assumed that the minimum chip thickness is 2 µm. This result is compatible with the minimum chip thickness (2 µm) obtained for SCF. The increased cutting speed results in an increase in minimum chip thickness due to thermal softening, and a decrease in minimum chip thickness due to deformation hardening. 26 Decreasing spindle speed causes both built-up edge (BUE) formation and increased cutting force. The increased cutting force results in an increase in elastic deflection of the micro tool in the feed direction. Both the BUE and the elastic deflection of the tool are the main reasons for the deterioration of the surface quality. In terms of surface roughness, it would be more appropriate to select n > 15,000 r/min for both alloys.
In micro-milling, burr formation is closely related to the ability of the material to deform. The reason for the higher burr width in the Ti6Al4V alloy is that the percent elongation of the Ti6Al4V alloy is higher. Considering the burr width, the minimum chip thickness varies for both alloys. The average cutting temperature in micro-milling of Ti6Al4V alloy with a tungsten carbide cutting tool is in the range 150°C–200°C. 27 When the cutting temperature increases from 20°C to 200°C, the flow stress value of Ti6Al4V alloy decreases by approximately 14%. 28 Therefore, the material is more easily deformed. This leads to an increase in burr width.
Conclusion
In this study, size effect was studied for the first time in micro-milling of Ti5553 alloy. Unlike the Ti6Al4V alloy, Ti5553 alloy contains Cr and Mo. Considering the cutting parameters, surface roughness, SCF, and burr width, minimum chip thickness was determined and compared to Ti6Al4V alloy. The plowing and transition regions are determined for both alloys and the most suitable cutting parameters range is determined. It is possible to state the results as follows:
The minimum chip thickness for both alloys has been verified by surface roughness, SCF, and burr width.
When considering SCF and surface roughness, the ratio of minimum chip thickness to edge radius is approximately fz/re = 0.3 for both alloys.
At feed rate values close to the minimum chip thickness, the cutting forces in Ti6Al4V alloy are greater than those of Ti5553 due to the plowing force.
The burr width is significantly affected by the feed per tooth and the maximum burr is obtained at feed values close to the minimum chip thickness.
In both down-milling and up-milling zones, the burr width in the Ti6Al4V alloy is 2.5 and 1.75 times larger than the burr width in the Ti5553 alloy, respectively.
Due to the plowing, the SCF value is higher in the more ductile Ti6Al4V alloy. However, the SCF values in both alloys for fz = Re are close to each other.
Footnotes
Declaration of conflicting interests
The author(s) declared no potential conflicts of interest with respect to the research, authorship, and/or publication of this article.
Funding
The author(s) received no financial support for the research, authorship, and/or publication of this article.