
Abstract
The cutting forces will generally suffer massive complex factors, such as material deformation, tool eccentricity and system vibration, which will inevitably induce many great difficulties in accurately modeling the cutting force predictions that are very significant to investigate cutting processes. Therefore, the genetic algorithm optimized back-propagation and particle swarm optimization neural networks will be adopted to effectively construct cutting force prediction models. In these two back-propagation prediction models, the main milling parameters will be defined into their input vectors, and the transient milling forces along three different directions will be selected as their output vectors, then the implicit relationships between input and output vectors can be directly generated through practically training and learning these two built back-propagation models with a set of experimental milling force data. Meanwhile, the finite element analysis method will be also used to predict milling forces through programming two easy-to-operate plug-ins that can efficiently construct finite element analysis models, conveniently define processing parameters, and automatically perform mesh generation. Subsequently, the milling forces predicted by the established genetic algorithm optimized back-propagation and particle swarm optimization back-propagation models will be analytically compared with finite element analysis simulations and experiments; also the stress distribution and chip formations of finite element analysis and experiments will be comparatively investigated. Finally, the obtained results clearly indicate that these two back-propagation models built by artificial neural networks can well agree with finite element analysis simulations and experiments, but the particle swarm optimization back-propagation model is superior to the genetic algorithm optimized back-propagation model, which clearly demonstrate the particle swarm optimization back-propagation model has higher efficiencies and accuracies in predicting the average and transient cutting forces for different milling processes on aluminum alloy 7050.
Keywords
Introduction
Generally, the cutting forces, which originate mainly from the plastic deformations and the contact frictions between cutting tools and chips, will determine the surface qualities, forming accuracies and tool wear. Therefore, an increasing number of prediction approaches have been constantly developed to effectively and accurately predict the complex cutting forces for various widely-used machining processes like turning, milling, and drilling, such as empirical formulas, finite element analysis (FEA) simulations, artificial neural network (ANN) predictions, and mathematical micro-cutting predictions. Although the existing mathematical models of cutting forces can analytically explain and describe the cutting motions between tools and workpieces based on the geometric relations and mathematical operations, 1 the complex cutting forces have strongly non-linear and highly uncertain correlations with the dominant processing parameters, such as cutting parameters (like spindle speed, feed rate, cutting temperature, and depth of cutting), material mechanical properties, tool parameters, tool chatter, and tool eccentricities. Obviously, these complex factors will tremendously increase the difficulties in precisely modeling the cutting forces of different machining processes, and a large number of difficulties and tediousness on the differential integral operations also greatly restrict the effective constructions of cutting force models.2,3 In view of various ANN algorithms have been broadly employed in massive significant fields like system modeling, function optimizing, and intelligent controlling processes because of their unusual benefits in numerical approximation, parallel distributed processing, and self-learning operations. Based on the training and learning operations of the milling experiment data set containing the behavior of the cutting system, the ANN algorithm can be also adopted to accurately and clearly describe the implicit relationship between the parameters (input vector) and the cutting force (output vector) to build the cutting force prediction model.
Currently, many ANN algorithms have been widely adopted to effectively model and accurately predict the complex cutting forces of different machining processes. For example, Sharma et al. 4 used the ANN method to construct the cutting forces prediction model for machining the difficult-to-cut adamite steel. Hanafi et al. 5 also employed the ANN method in predicting the cutting forces for the turning processes of carbon fiber-reinforced polymer composites. Imani et al. 6 also adopted an ANN algorithm combined with experimental data to build a prediction model for investigating the cutting forces and surface roughness for machining Inconel 738, as well as optimizing the processing parameters with the genetic algorithm (GA). Moreover, Cus et al. 7 used the ANN algorithms to effectively develop the cutting forces estimation models of ball-end milling processes. Although the ANN algorithms can achieve accurate estimations on the actual cutting forces of most machining processes in these studies, it also suffered certain crucial problems, such as the local minima in convergence error space, over-fitting phenomenon, poor generalization ability, and so on.
Consequently, an increasing number of modified ANN algorithms have been further developed and used to more accurately build various cutting forces prediction models. For example, Elhami et al. 8 proposed a new type of genetically optimized neural network system (GONNS) to predict the cutting forces of machining high-silicon austenitic stainless steel. Hao et al. 9 used a genetic algorithm optimized back-propagation (GA-BP) neural network to construct the cutting forces model for investigating the self-propelled rotary tools, then the effectiveness of this GA-BP model was fully verified by a series of cutting experiments. Zhou et al. 10 adopted the general BP model and GA-BP model to predict the grinding forces for the deep grinding processes on titanium-based alloy, the obtained results show the GA-BP model has higher prediction accuracy. Besides, Zheng et al. 11 also adopted a particle swarm optimization back-propagation (PSO-BP) neural network to predict the cutting forces by linearly decreasing its inertia weight. For predicting the cutting forces of drilling nanocomposites and general steels, Soleymani Yazdi et al. 12 constructed a cutting force model based on the PSO neural network (PSONN). Farahnakian et al. 13 adopted a modified PSONN to predict the cutting forces of machining nano-composites, the obtained results indicate that these modified PSO-BP models can more accurately predict the cutting forces than other ANN models. In addition, the Levenberg-Marquardt optimized back-propagation (LM-BP) method was also employed in constructing the cutting forces prediction model,14,15 whose predicted cutting force results have fine agreement with experimental values. Subsequently, a growing number of ANN models have been continuously improved by using other optimization algorithms to investigate the complex cutting forces of different machining processes, such as multilayer perceptrons (MLP), differential evolutions (DE), and scaling conjugate gradient (SCG) feedback-propagation algorithms,16–18 which will be expected to greatly improve the reliabilities, precisions, and efficiencies of constructed cutting force prediction models. Although the optimizations on various ANN models have already made significant progress in cutting force predictions, most of the existing studies have mainly focused on the effective predictions of time-independent average cutting forces (namely static cutting forces) rather than the dynamical predictions of time-dependent transient cutting forces that are more significant to investigate various complex cutting processes on different workpiece materials.
Based on the above, for comparatively analyzing the accuracies and efficiencies of FEA-based simulation, GA-BP, and PSO-BP neural networks in predicting the more significant transient cutting forces of various machining processes, this article will analytically reveal and compare the predicting performances of cutting force models established by these three different methods, as shown in Figure 1. Based on the FEA software ABAQUS 6.14, this article will firstly construct the three-dimensional (3D) FEA milling models to cost-effectively characterize the milling forces, chip formations, and stress distribution, then a series of milling experiments with different processing parameters will be practically conducted on aluminum alloy 7050 to verify the FEA simulations in terms of cutting forces and chip formations. Specifically, two easy-to-operate plug-ins will be respectively programmed to rapidly and effectively construct the two-dimensional (2D) and 3D FEA-based cutting models, which can conveniently install material, tool, and cutting parameters, as well as automatically perform the mesh generation. Eventually, the average milling forces predicted by these three constructed models will be compared with the actual milling experiments, then the transient milling forces predicted by built GA-BP and PSO-BP models will be compared with the FEA simulations and milling experiments. The obtained results can clearly indicate that both the average and transient cutting forces have good agreements among two established ANN prediction models (GA-BP and PSO-BP), FEA simulations, and experiment validations, which can well demonstrate the feasibilities and efficiencies of the three cutting force prediction models (namely the GA-BP, PSO-BP, and FEA) in characterizing the average and transient milling forces with different processing parameters.
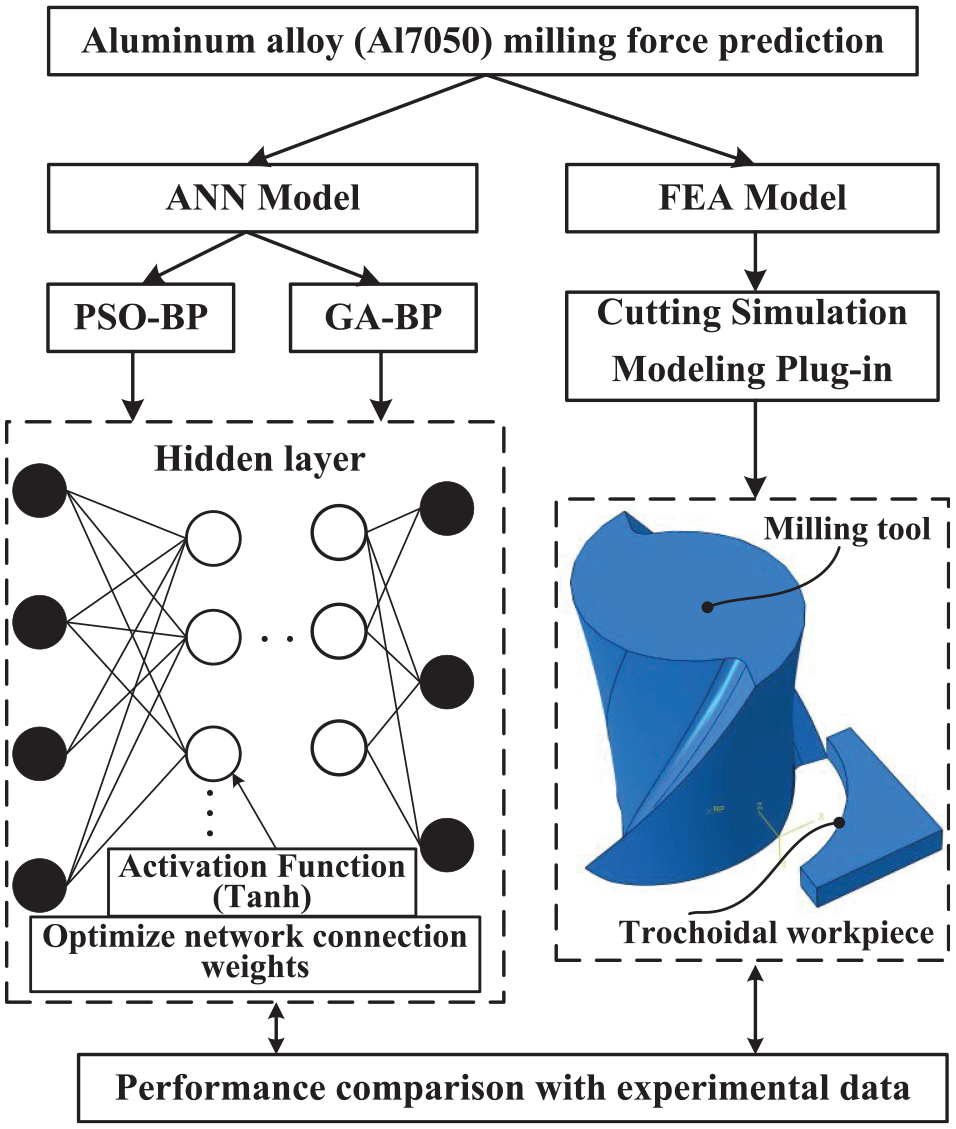
Flow chart of milling process prediction with different methods. ANN: artificial neural network; FEA: finite element analysis; PSO-BP: particle swarm optimization back-propagation; GA-BP: genetic algorithm optimized back-propagation.
Mathematical derivations of ANN algorithms
As one of the most effective method to solve complicated problems, the GA was first proposed by professor Holland19,20 in 1962, which is a type of highly parallel and random search algorithms through the biomimetic-inspired simulations on biological evolution mechanisms, such as natural selection, genetic mechanism, and biological evolution. At present, the GAs have been broadly employed in optimizing the weight and threshold of BP neural network, namely the GA-BP, which consists of three crucial parts: the BP neural network structure, GA optimization, and BP neural network prediction. Wherein, the structure of the BP neural network will depend on the number of input and output parameters of the used fitting function used, so that the individual length in the GA can be determined, and each individual in the population will contain the ownership value and threshold of the neural network. In the GA optimization processes, the GA is used to optimally search the better individuals that have the excellent fitness values through conducting selection, intersection, and mutation, but the individuals with poor fitness values are further eliminated to form the new groups that can inherit the information of previous generation; these individuals in this new group should be superior to their previous generation, ultimately to obtain the best individuals for BP neural network.
As another of the most effective group intelligence optimization algorithms, the particle swarm optimization (PSO) was firstly proposed by Eberhart and Kennedy
21
in 1995, which has been adopted to optimize the BP neural networks through imitating bird predation behaviors, namely the PSO-BP, which can improve convergence speed and strengthen versatility. For the PSO algorithm, the solution to each optimization problem will be mathematically abstracted into a series of particles in a N-dimension space, the position and velocity of the i-th particle in the N-dimensional space can be mathematically expressed as
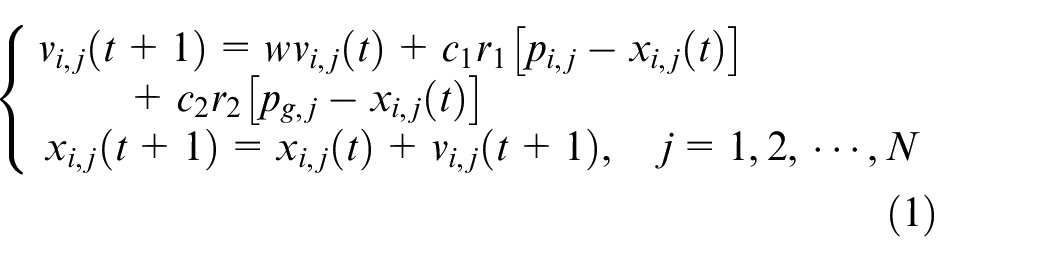
where, xi, j and vi, j denote the position and velocity of the i-th particle in the j-th dimension space, respectively. Here, w represents the inertia weight, c1 and c2 denote the learning factors, r1 and r2 stand for the random values that are uniformly distributed from 0 to 1.
In PSO algorithm, the inertia weight w is the most important parameter, a larger inertia factor is beneficial to jump out of the local minimum value and improve the global search capability of PSO algorithm, but a smaller inertia factor is conducive to accelerate convergence and increase the local search accuracy in current search area. Therefore, the PSO algorithms with linearly varying weights have been constantly developed to conquer the shortcomings of traditional PSO algorithms, such as easy-to-produce premature convergence, low search precision, and low efficiency of later iterations. Generally, the inertia weight w of PSO algorithms can be linearly reduced from maximum value wmax to minimum value wmin for more excellent optimizing performances, thus the variation of key inertia weight w with the number of iteration steps can be mathematically expressed in equation (2)
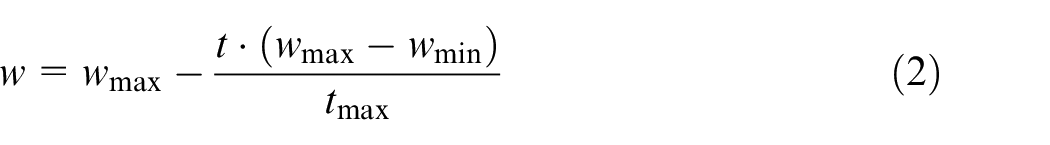
where, wmax and wmin represent the maximum and minimum values of the inertia weight, respectively, t denotes the current iteration step, and tmax represents the maximum number of iteration steps.
Finally, an average prediction error (APE) will be newly introduced to more rationally estimate the accuracies of different built ANN models in predicting complex cutting forces; its corresponding mathematical expressions will be defined as given below
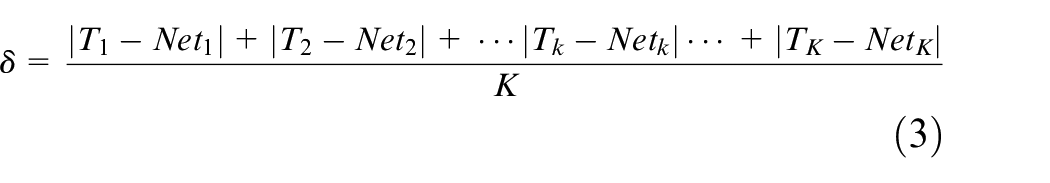
where, δ stands for the APEs of established ANN models. Tk and Netk present the k-th experimental value and the k-th predicted value, respectively. K is the total number of samples.
Construction of milling experimental system
In order to verify the accuracies and efficiencies of different established ANN prediction models for complex milling forces, a series of milling experiments with different processing parameters will be practically conducted on the widely-used aluminum alloy 7050. The established experiment setup is illustrated in Figure 2, a vertical machining center (VDL-1000) will be employed, its cutting speed in the X, Y, and Z directions range from 1 to 10,000 mm/min, and spindle speed range is 45~8000 r/min. The workpiece material is chosen as aluminum alloy 7050 that is widely used in manufacturing various aerospace equipments. The cutting tools will adopt the uncoated cemented carbide end-milling tools, whose diameters, helix angles, and radial rake angles are chosen as 10 mm, 35°, and 7°, respectively. Meanwhile, a three-component piezoelectric dynamometer (Kistler 9129A) is installed between the workpiece and working platform to measure the actual cutting forces of milling processes with different cutting parameters in real time. Then a multi-channel charge amplifier (Kistler 5075) and a data acquisition system (Kistler 5697A) are used to conduct the signal condition and data collection of milling forces, the sampling frequency of force sensor is set as 5000 Hz, the software DynoWare is adopted to effectively process and store the collected milling force data. In addition, it should be noted that all of the conducted milling experiments will adopt the dry cutting to avoid the influences of cutting fluid or coolant, which are difficult to be considered in FEA-based milling simulations.
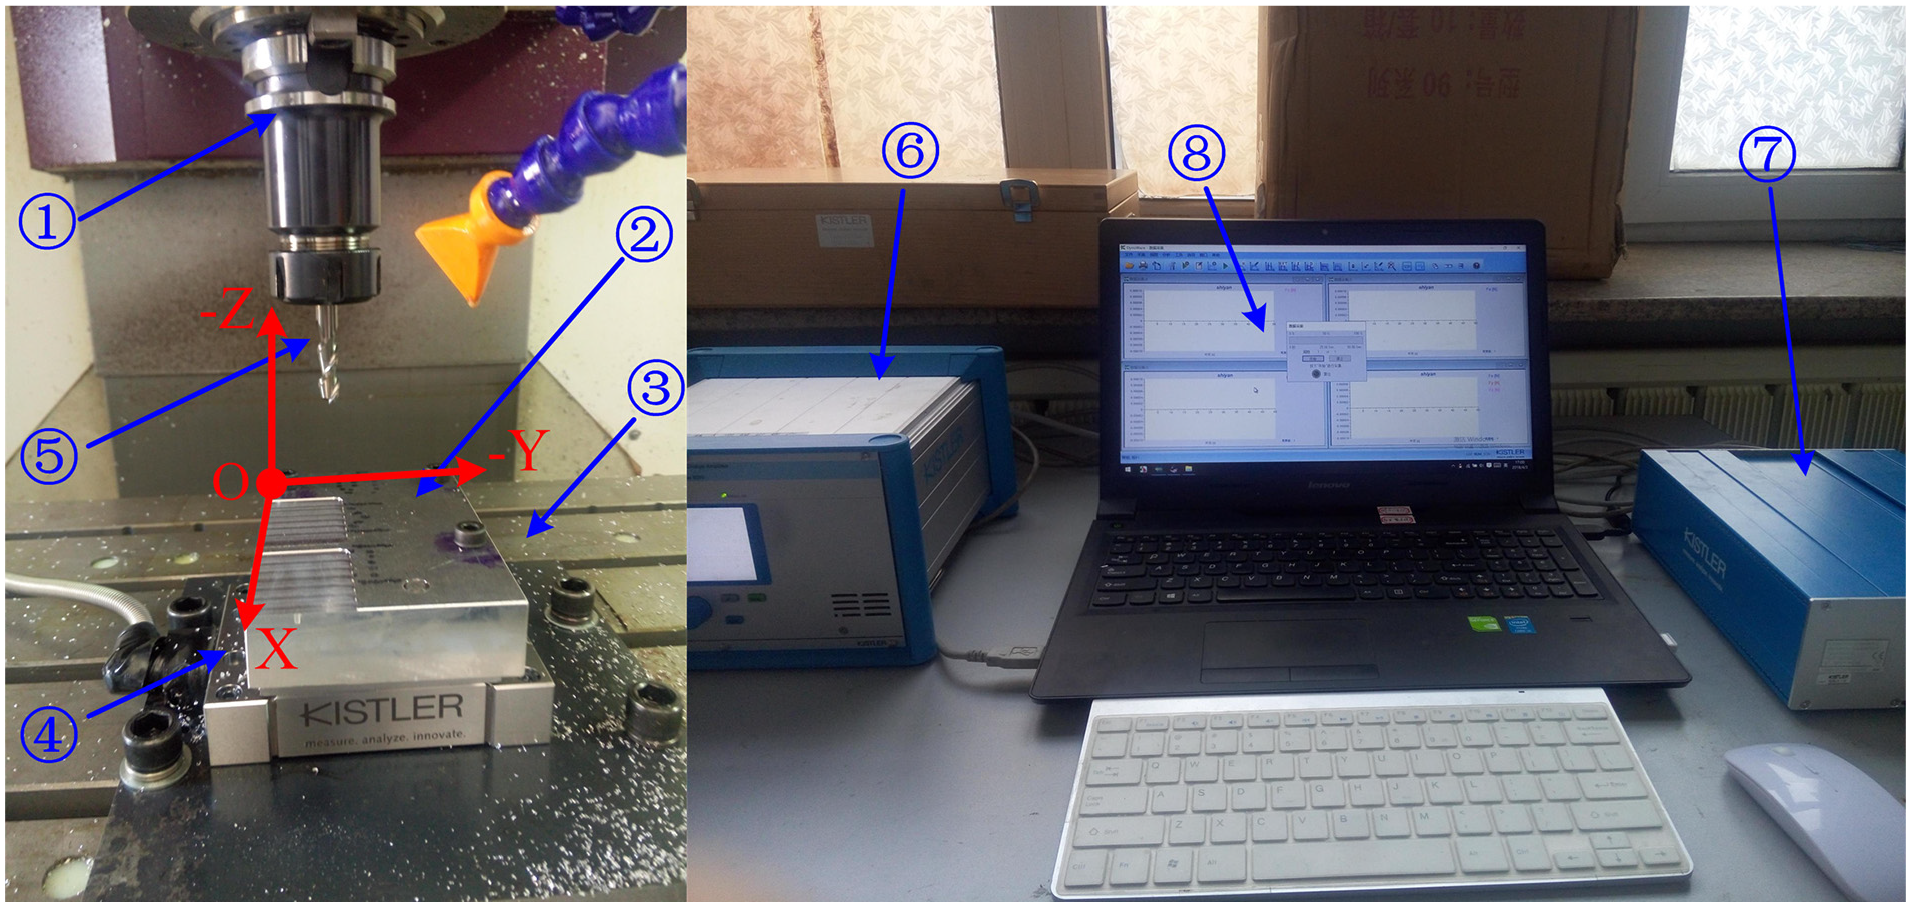
Experiment setup.
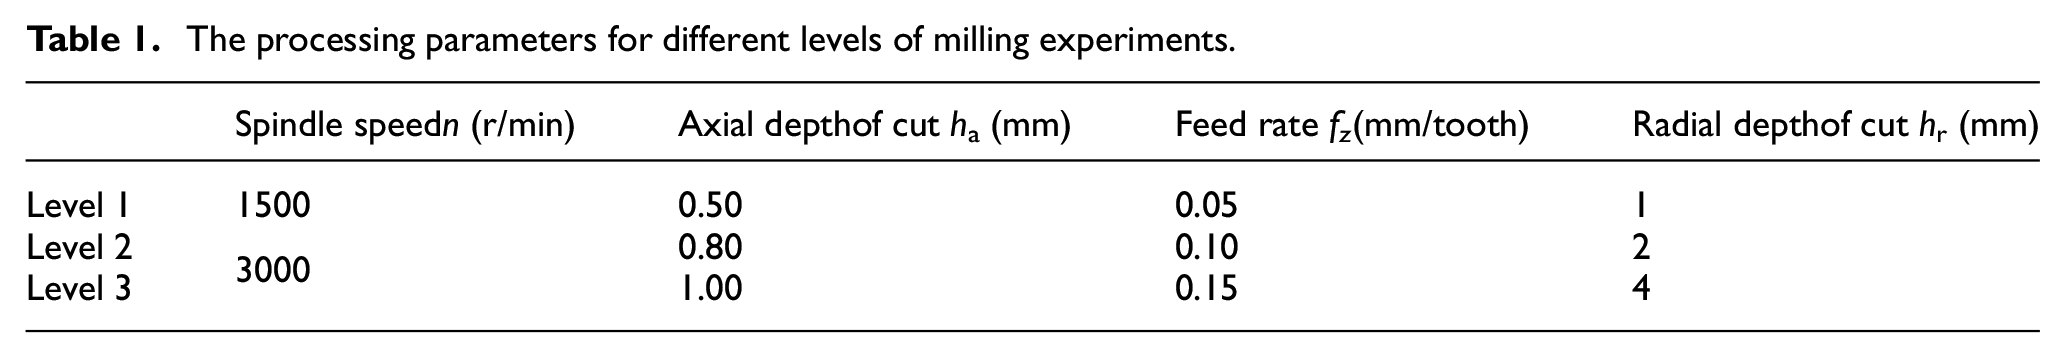
This article will adopt the multi-factor experimental protocol to investigate the influences of four dominant process parameters on the milling forces, involving spindle speed n, axial depth of cut ha, feed rate fz, and radial depth of cut hr. Concretely, the spindle speed will employ two levels, the other three milling parameters will adopt three levels, thus the total number of all milling experiments that need to be conducted is 2×3×3×3 = 54, their cutting force data will be measured and collected in real time. The processing parameters of milling experiments and their employed levels are listed in Table 1.
The processing parameters for different levels of milling experiments.
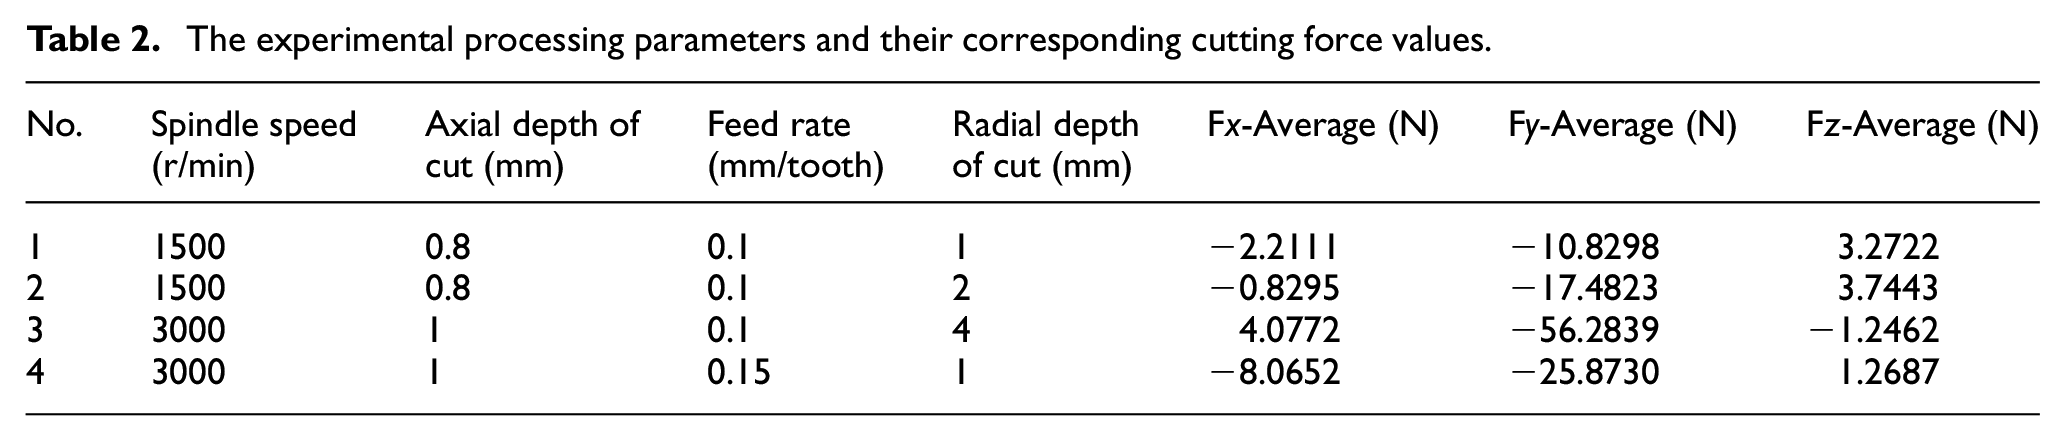
In order to guarantee the measuring accuracies of milling forces predicted by built ANN models, the force measurements need to select a relatively stable cutting cycle with a duration of 0.2 s, so that the collected force data can be used to precisely calculate the average milling forces of Fx, Fy, and Fz along the X, Y, and Z directions, respectively. The dynamometer’s sampling rate is chosen as 5000 Hz, thus 1000 points of experimental milling force data will be extracted to construct the GA-BP and PSO-BP cutting forces prediction models, which are also sufficient in calculating the average cutting forces of Fx, Fy, and Fz. For all sets of experiment tests, the average cutting forces of Fx, Fy, and Fz can be calculated with a similar method. Among them, 50 sets of experimental data will be selected to construct the GA-BP and PSO-BP cutting force prediction models, the remaining four sets of experiment data will be adopted to verify the accuracies and availabilities of these two built ANN prediction models. The selected processing parameters and their corresponding average milling force values of Fx, Fy, and Fz along the X, Y, and Z directions are listed in Table 2.
The experimental processing parameters and their corresponding cutting force values.
FEA-based investigation for milling processes
A large number of existing studies declared that the FEA method has been very extensively used in investigating the complicated machining processes, which can achieve very good agreements with actual cutting forces. 22 Meanwhile, the FEA method can also be adopted to investigate the evolution of cutting stress distribution, influence of residual stress, and formation cutting chip.23–25 Currently, several commercial FEA softwares like ADVANTEDGE, ABAQUS, MSC.MARC, ANSYS, and DEFORM can very cost-effectively investigate the cutting forces, cutting temperature, tool wears, stress distributions, and chip formations,26,27 but most of the existing FEA simulations have largely concentrated on the simple predictions of time-independent average cutting forces (namely static cutting forces) and the 2D FEA models in which the milling tools have been simplified to the micro-turbine tool, only a few of 3D FEA milling models that have been constructed with whole-milling cutters can be found and reported at present.
Building 3D FEA-based milling models with ABAQUS
With the popular ABAQUS 6.14, this article will construct the 3D FEA-based models to cost-effectively investigate the cutting forces, stress distributions, and chip formations of different milling processes. In the FEA-based modeling processes, the thermo-plastic behaviors of workpiece material (Aluminum alloy 7050) will be defined based on the widely used Johnson-Cook (J-C) model, which can be mathematically expressed by below 28
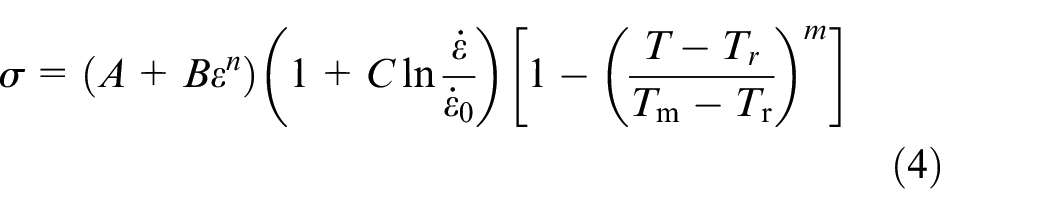
where,
The Johnson-Cook material constitutive model parameters of aluminum alloy 7050. 28
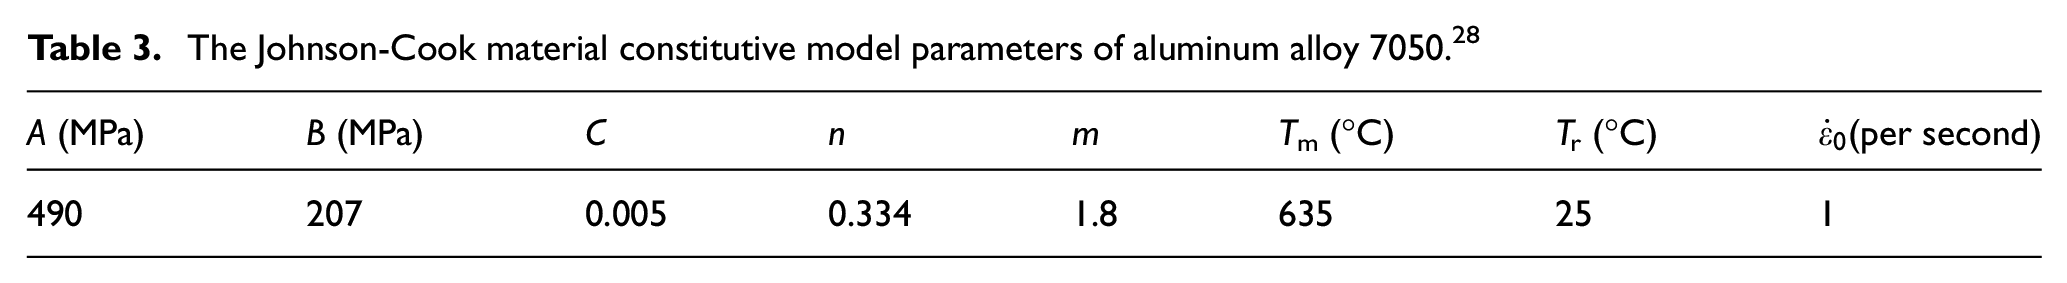
A: yield strength of workpiece material (Aluminum alloy 7050); B: strain of workpiece material (Aluminum alloy 7050); C: strain sensitivity of workpiece material (Aluminum alloy 7050); n: strain hardening index; m: thermal softening index; Tm: melting temperature of material; Tr: room temperature;
Subsequently, all of the milling processes will be simulated in the dynamic temperature-coupled FEA by using the explicit integration in ABAQUS/ Explicit module. With the software CATIA V5R21, the 3D geometric models of workpieces can be constructed with cycloidal trajectory equations, the 3D geometric models of two-edge end-mill tools are also constructed. Then the mesh element shape is selected as the hexahedron and its mesh type is defined to be C3D8RT, as shown in Figure 6(a). Meanwhile, the rigid constraints are respectively exerted to the cutting tools and its reference points, and the feed motion along the X axis and the rotary motion of the milling cutter around the Z axis are applied to the tool reference point.
Creating plug-ins for 2D/3D FEA cutting models
Generally speaking, before conducting the FEA-based cutting simulations, we have to spend a great deal of time and energy to repeatedly and monotonically construct the essential FEA cutting models with the ABAQUS 6.14 pre-processing module, and it is also necessary to pay more attention to strictly conduct the parameter setting and mesh generating operations. In response to these problems, the ABAQUS.JNL file will be first programmed by using the Notepad++ software to define the key functions that include cutting parameters, material properties, workpiece sizes, and tool dimensions, so that these crucial but intricate steps can be integrally encapsulated in a kernel file. Then, the convenient dialog boxes that can be used to set dominant processing parameters will be generated by using the RSG Dialog Builder of ABAQUS. Eventually, the main processing parameters in the programmed dialog boxes will have inline relations with above kernel scripts, further to create two easy-to-operate plug-ins for conveniently constructing the 2D and 3D FEA-based cutting models, as shown in Figure 3.
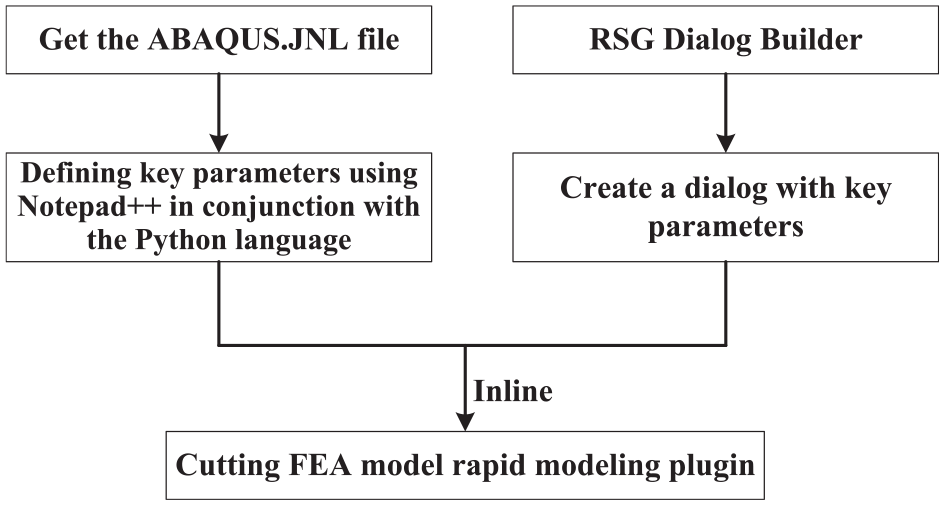
The flow chart of creating plug-ins for FEA cutting models. FEA: finite element analysis.
In the 2D FEA modeling plug-in for cutting processes, the geometric parameters and their mesh sizes of the workpieces and cutting tools need to be firstly defined, as shown in Figure 4, and then the FEA models can be rapidly completed by simply setting the cutting parameters and other task parameters. In the 3D FEA modeling plug-in for cutting processes, the 3D models of trochoidal workpieces and milling tools can be similarly constructed from the default catalogs, as shown in Figure 5; the imported 3D models can be further assembled and converted into an accurate FEA cutting model. Finally, both the 2D and 3D FEA-based cutting modeling plug-ins can expediently define material properties and automatically generate appropriate meshes for the chosen workpieces and tools, which can improve the efficiencies and accuracies in constructing the troublesome FEA-based cutting models relative to the conventional modeling processes, as well as reduce the modeling complexities.
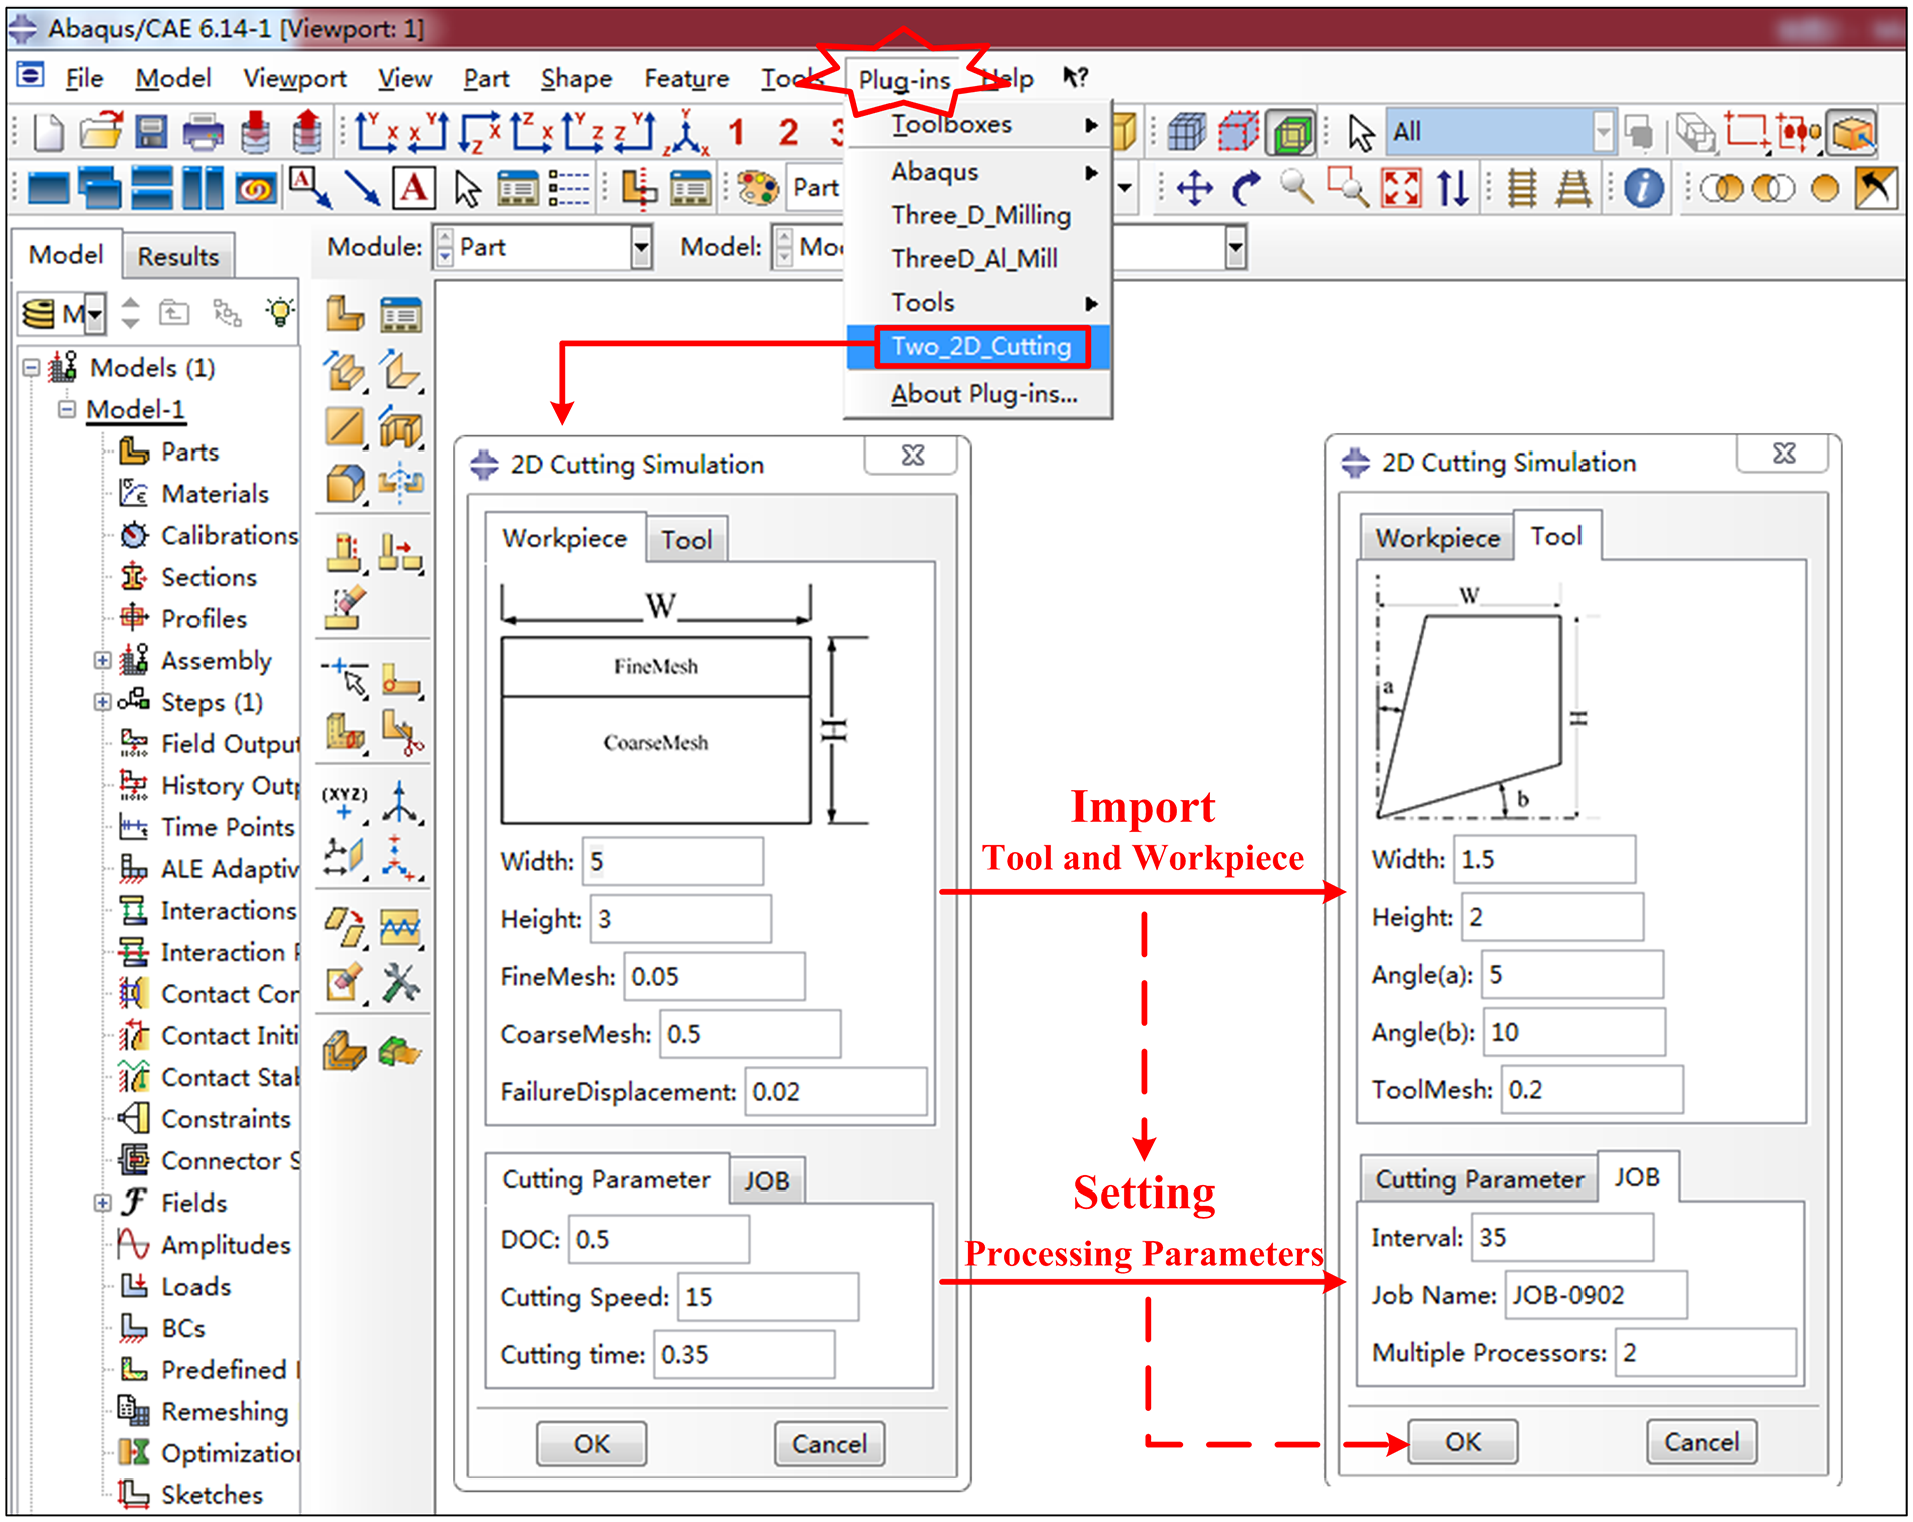
The programmed plug-in for two-dimensional (2D) cutting FEA simulations.
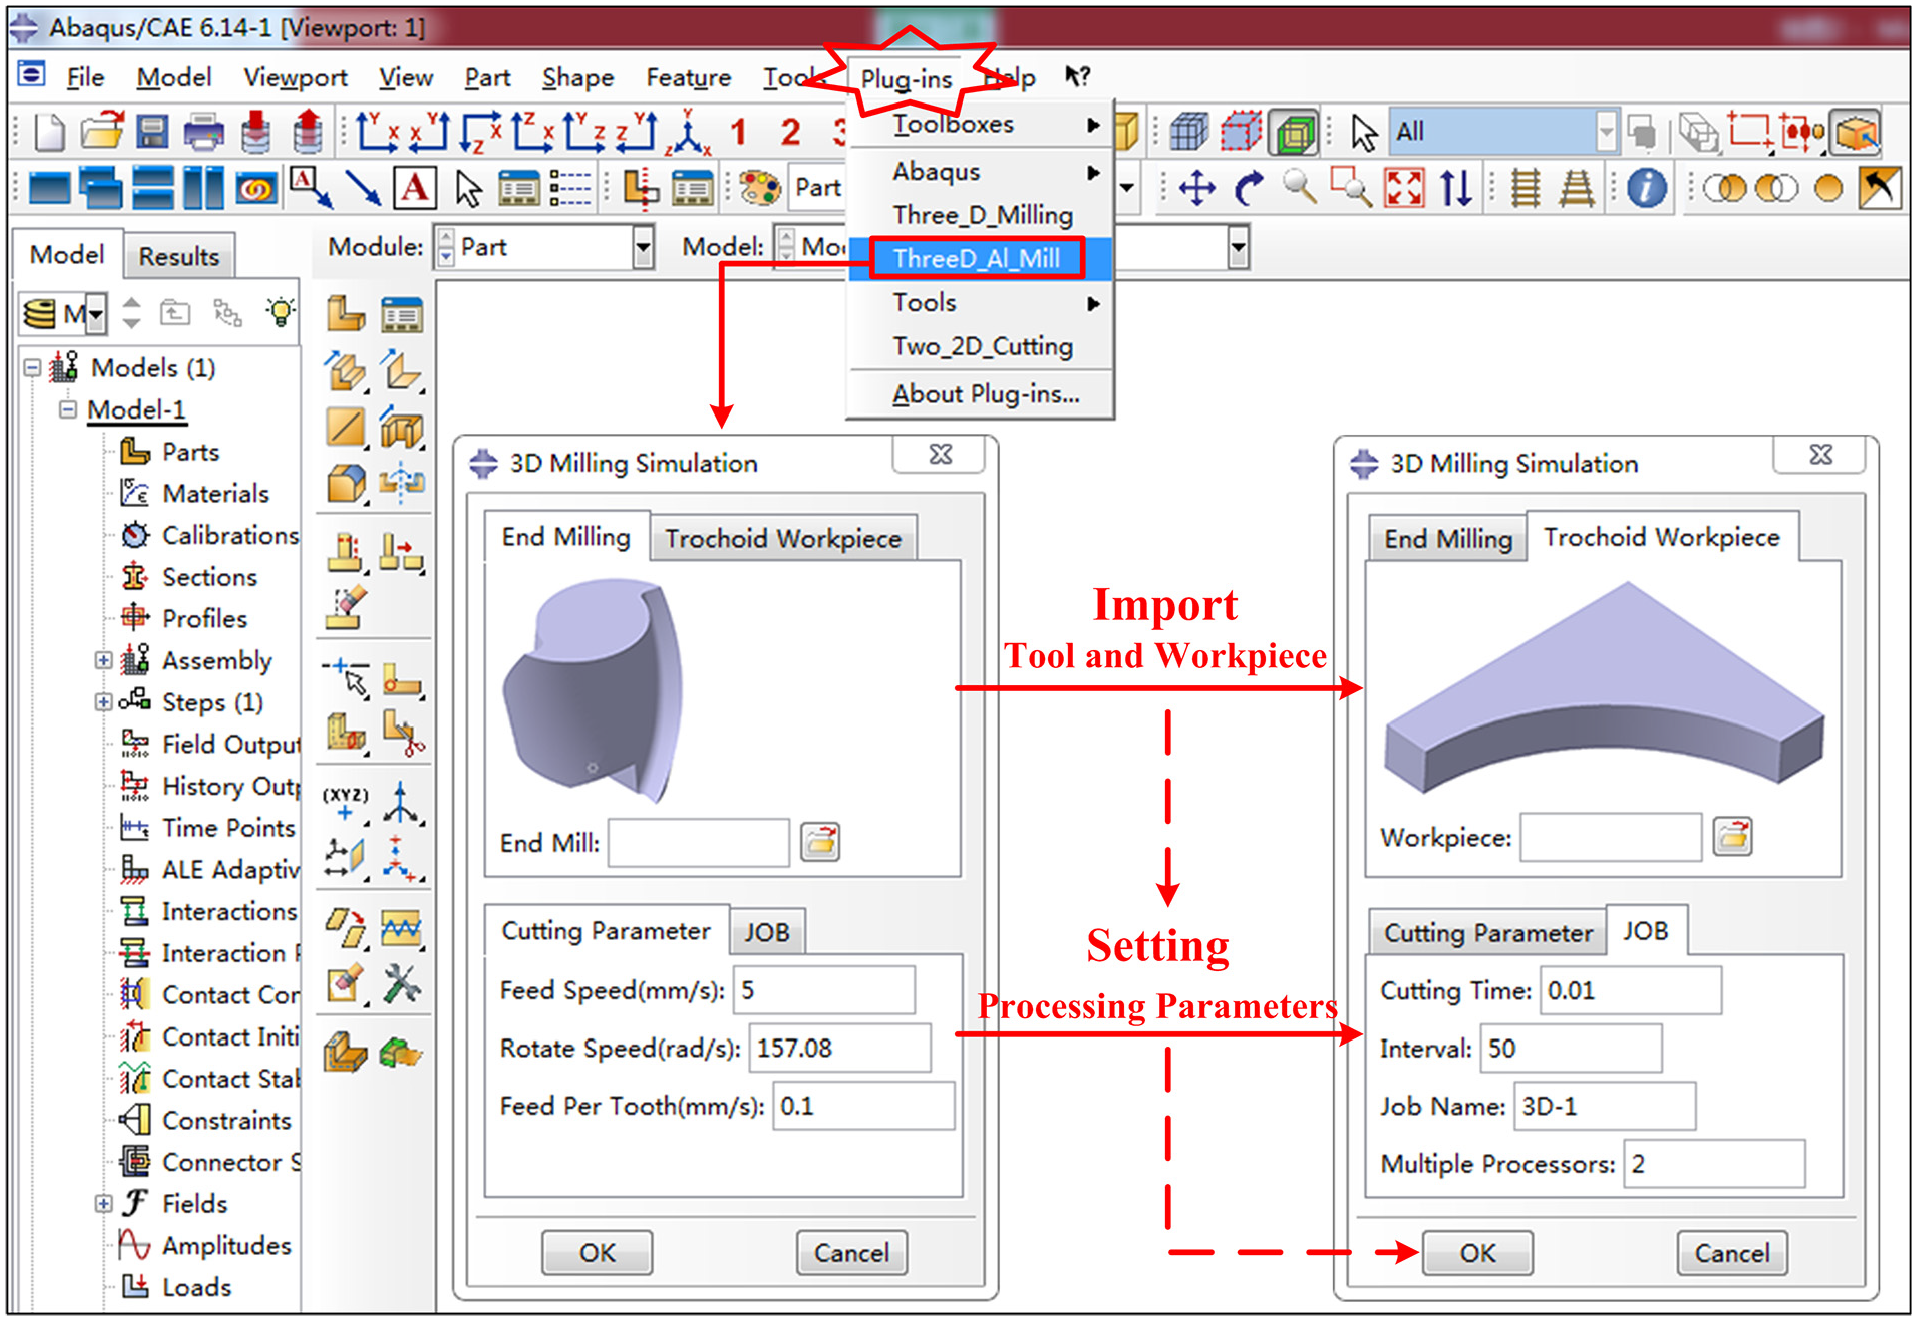
The programmed plug-in for three-dimensional (3D) milling FEA simulations.
The discussion of FEA simulation results
From the Mises stress distributions obtained by conducting the 3D FEA simulations on different milling processes, the strongest stresses of workpieces are always located at the root segments of chips, which also deepen into the interior of workpieces, further leading the chips to remain in yielding states and forming the continuous chips, namely the areas shown in Figure 6(b) and (c). The high stress areas of chip formations not only have movements with tool rotation, but also are highly localized in the contact areas between tools and chips. Moreover, the Mises stress distributions of all workpieces exhibits significant boundary phenomena, a sector-shaped high-stress region will emerge on the upper surface of machined workpiece because of the directional stress extensions, such as the Zone 2 and Zone 4 shown in Figure 6(b) and (c). Meanwhile, the depth of cutting stress on the upper surfaces of workpieces will gradually increase with increasing chip formations, as illustrated in Zone 5 shown in Figure 6(f). After the milling tools separate with the workpieces, the residual stress will still unevenly distribute along the trochoidal removal profiles of workpieces, and the depth of residual stress will positively correlate with the unformed chip thickness of unprocessed workpiece, this is mainly because the trochoidal distributions of residual stress will highly rely on the cutting forces that have positive correlation with the gradual increases of cutting chip thicknesses, as shown in Figure 6(f).
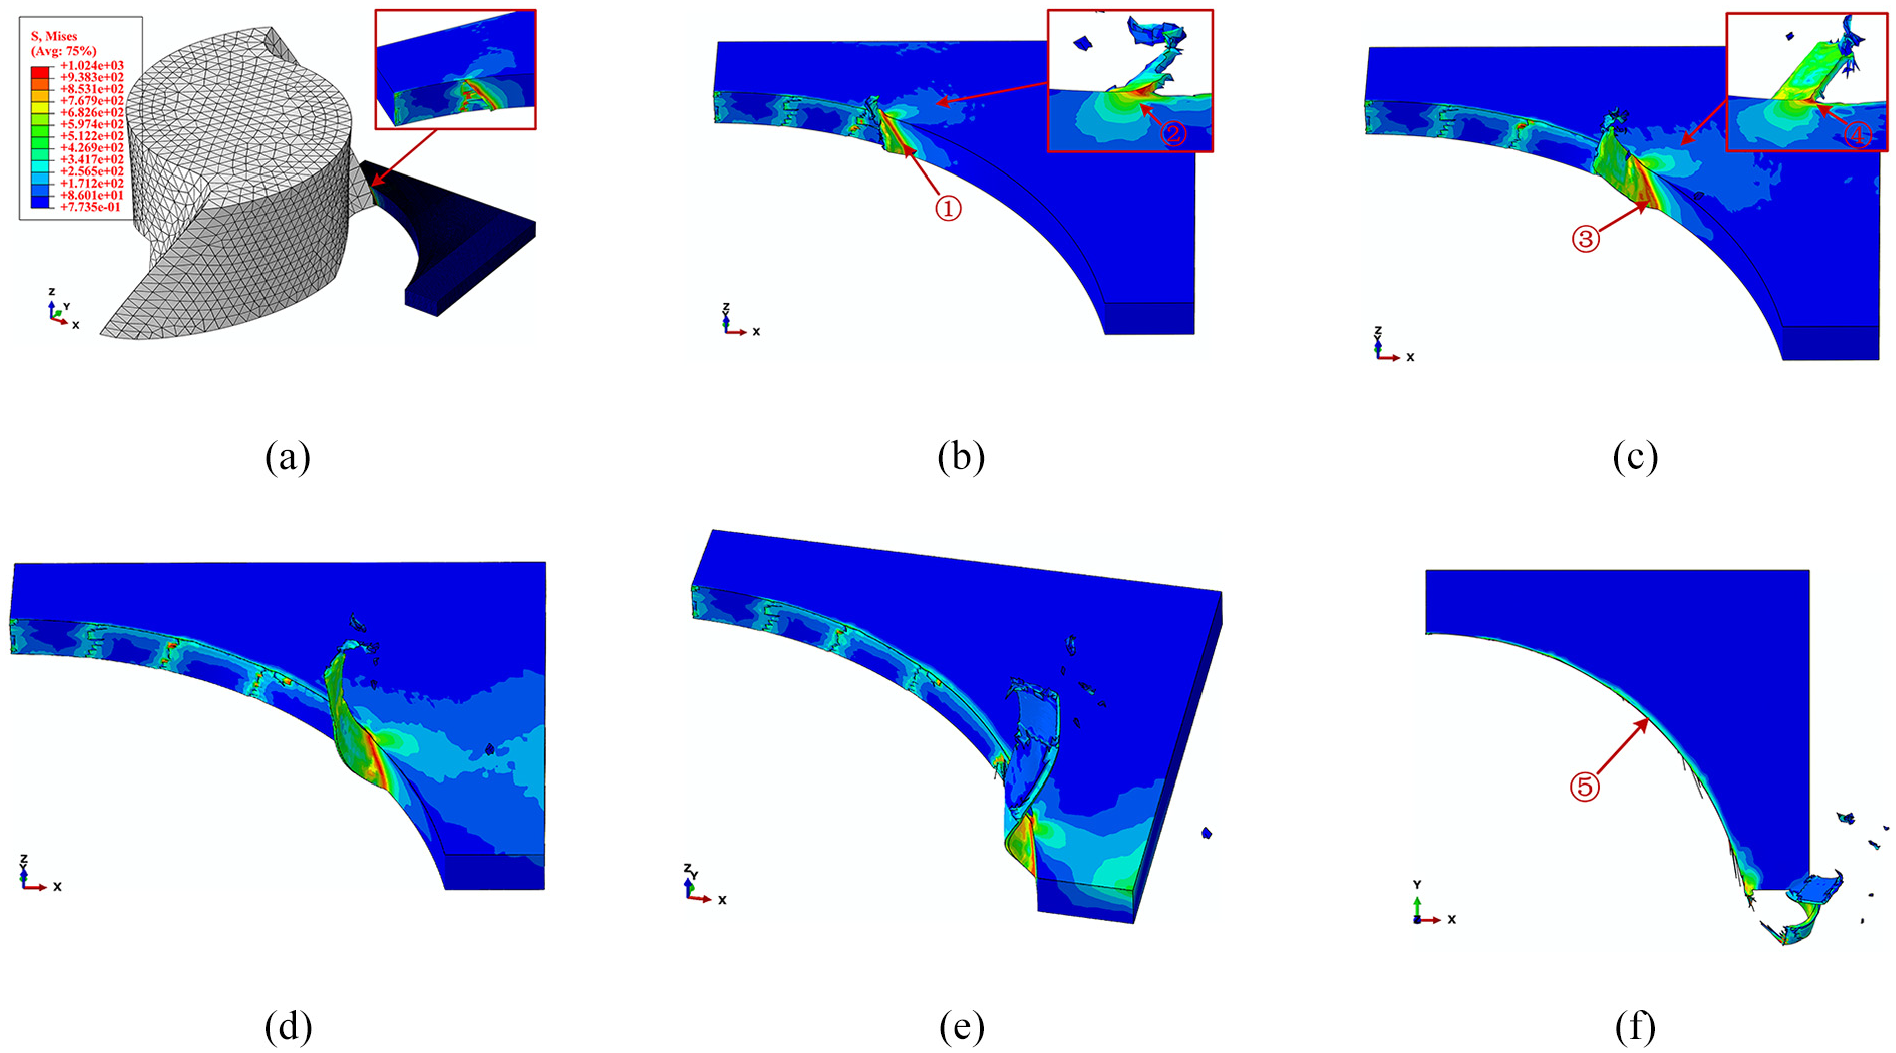
Mises stress distributions and chip formations of different frames in FEA-based milling simulations. (a) The fourth frame, (b) the eighth frame, (c) the twelfth frame, (d) the sixteenth frame, (e) the twentieth frame and (f) the twenty-seventh frame.
Besides the cutting forces and stress distributions, the chip formations are also very important to investigate various machining processes. Therefore, the chip formations obtained by the FEA simulation and milling experiments are comparatively investigated in detail, and the real cutting chips of milling experiments are observed by an optical microscope, as shown in Figure 7. Obviously, the chip formations obtained by FEA simulations are very similar to those of milling experiments, especially their serrated wrinkles and spatial crimps. However, the chip formations obtained by FEA simulations and cutting experiments also have some slight differences that stem mainly from various complex factors, such as the grid settings, material models, and cutting environment of FEA models. Obviously, the serrated wrinkles on the chip surfaces can be observed both in the FEA simulation and cutting experiments, which are derived from the large friction between tool and chip, the high temperature of cutting area, and the great material deformation when the cutting chips flow through tool rake face. However, the similarity degree of the chip formations can also intuitively reflect the accuracies and effectiveness of the constructed FEA-based simulations in characterizing different milling processes; the good agreements of the crumpled and curled chips between milling experiments and FEA-based simulations can well demonstrate that the actual milling processes are relatively balanced and stable, it is also very significant to investigate the complex machining processes through the cost-effective FEA-based cutting simulations instead of the laborious and time-consuming cutting experiments.
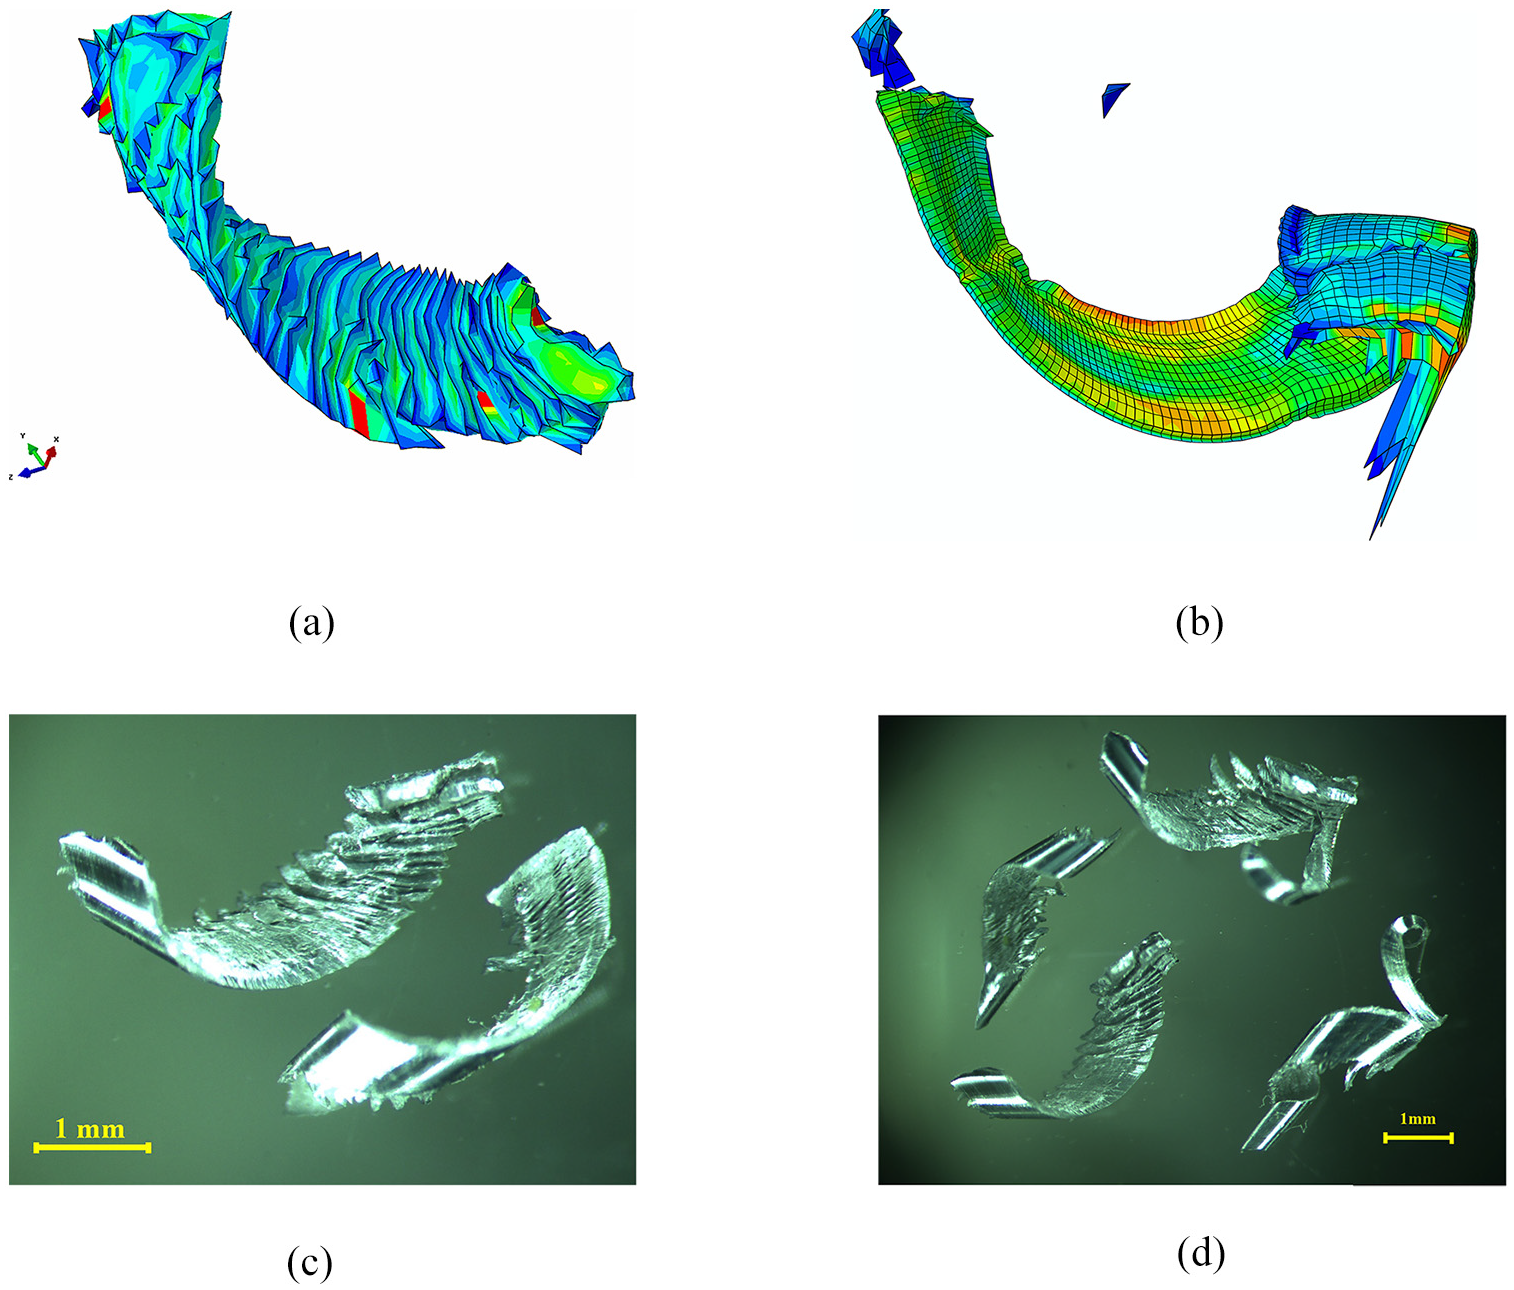
The comparison between the FEA-simulated and experimental chip formations. (a) The formation of FEA-simulated chip 1, (b) the formation of FEA-simulated chip 2, (c) the formation of experimental chip 1 and (d) the formation of experimental chip 2.
Constructions and comparisons of milling force models
Constructions of average milling force models
With the experimentally measured cutting force data, the neural network structures optimized by the GA and PSO algorithms can be constructed, respectively. Concretely, the four main milling parameters in the experiment and the corresponding experimental milling force data are selected as the input variables and output vectors of these two neural network structures (GA-BP and PSO-BP). Specially, for improving the prediction accuracies, three single-output ANN models are separately constructed to characterize each component of average cutting forces in three different directions. Obviously, this modeling approach can actively adjust the neuron number of hidden layers according to the variation characteristics and complexities of different cutting forces Fx, Fy, and Fz. Eventually, the predicted cutting forces of the two built ANN models are further compared with the FEA-based simulations. As listed in Table 4, their corresponding APEs are calculated with equation (3), and then the performances of FEA, GA-BP, and PSO-BP models are graphically compared in Figure 8.
The predicted values for different average (AVE) cutting forces Fx, Fy, and Fz.
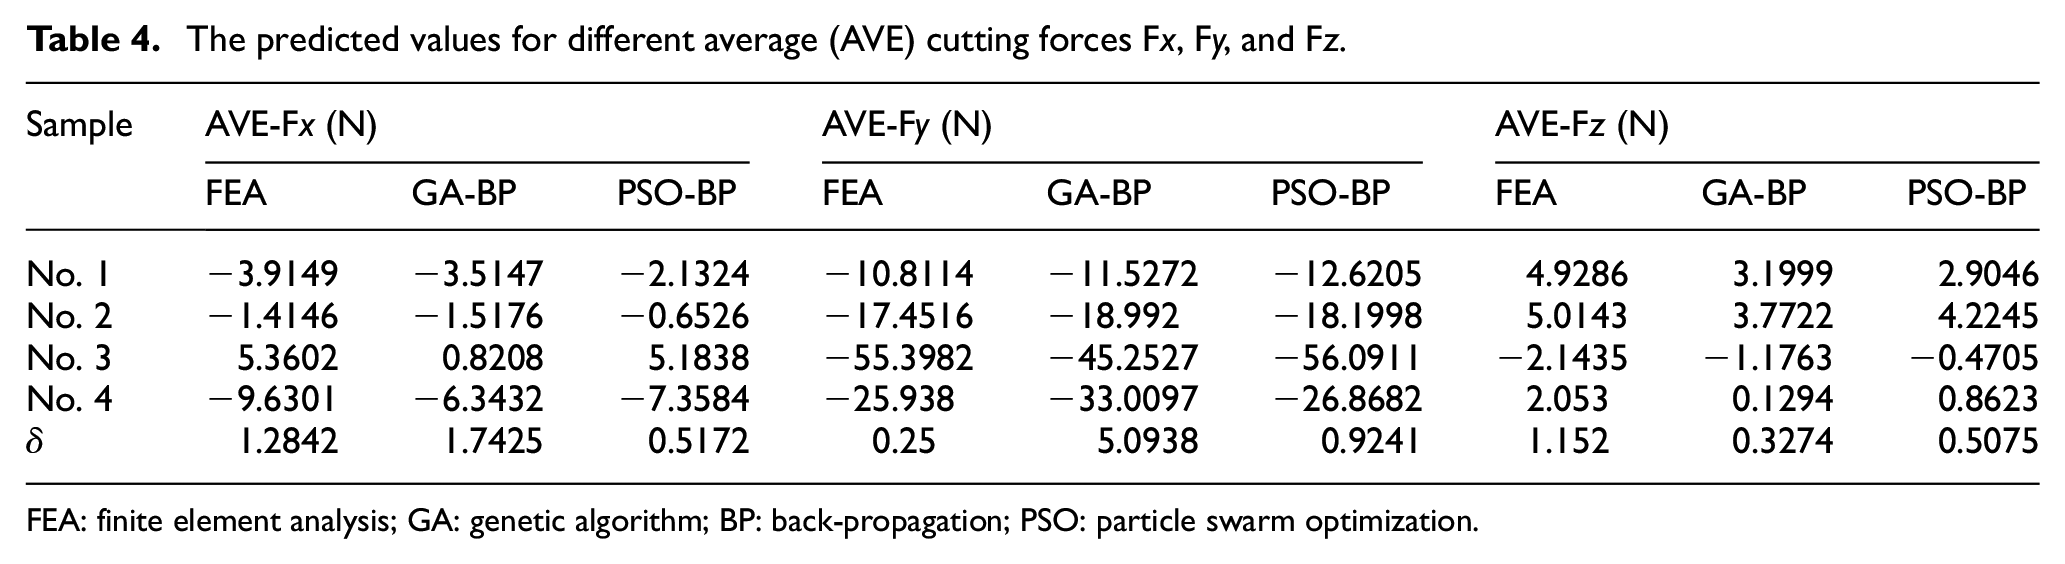
FEA: finite element analysis; GA: genetic algorithm; BP: back-propagation; PSO: particle swarm optimization.
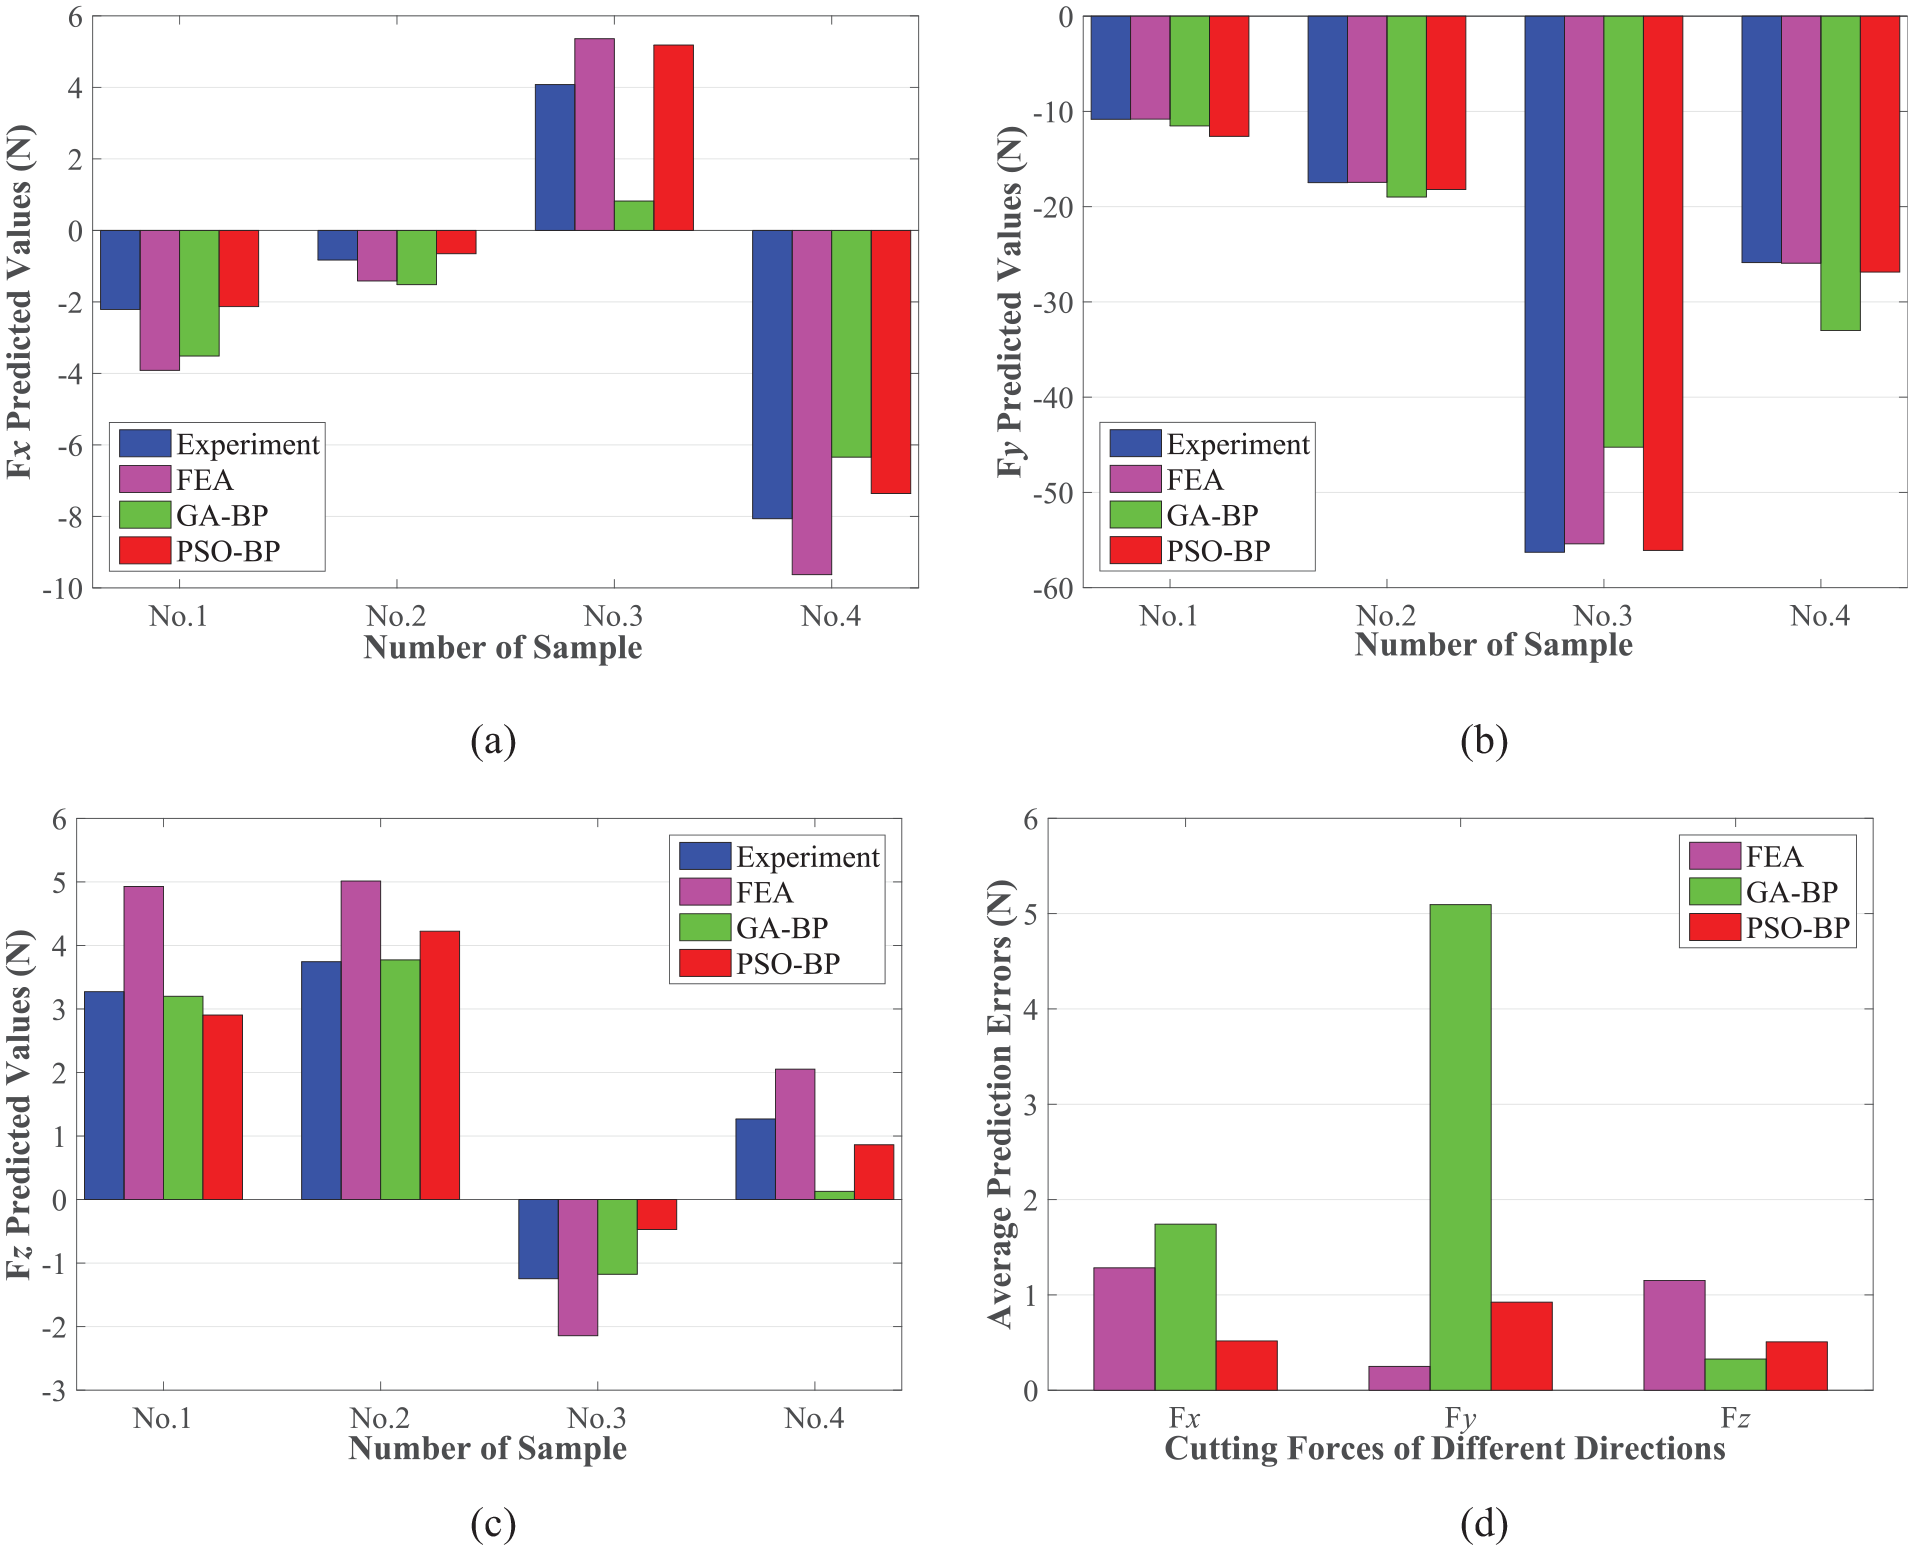
The comparison among the average milling forces of ANN predictions, FEA simulation and experiments. (a) Average milling forces in the x direction (Fx), (b) average milling forces in the y direction (Fy), (c) average milling forces in the z direction (Fz), and (d) prediction errors of average milling forces (δ). ANN: artificial neural network; FEA: finite element analysis, PSO: particle swarm optimization; GA: genetic algorithm; BP: back-propagation.
From the predicted milling forces shown in Figure 8 and listed in Table 4, both the established ANN models have excellent performances on predicting the complex milling forces that generally undergo inevitable tool eccentricities and vibrations. The prediction accuracy of the FEA model is highly dependent on the mesh quality, and the tool eccentricity data are difficult to obtain, so the FEA model cannot achieve the perfect prediction effect. For the GA-BP model, its network-predicting capacity after optimization cannot be significantly improved or even worse, this is mainly due to the small size and uneven distribution of used data samples. However, the PSO-BP algorithm employs the linear decreasing weight method in improving its inertia weight, which can thus solve the problems that the PSO algorithm is prone to prematurely fall into the local optimum and the late iterative efficiency, further balancing the PSO algorithm’s abilities in global search and local search. For the average cutting forces in the X, Y, and Z directions, their APEs of FEA simulations are 1.2842 N, 0.25 N, and 1.152 N, respectively. Meanwhile, the APEs of GA-BP model are 1.7425 N, 5.0938 N, and 0.3274 N, while the APEs of PSO-BP model are 0.5172 N, 0.9241 N, and 0.5075 N. For the cutting forces Fx and Fy, the predicting accuracies of GA-BP model are obviously worse than the PSO-BP model and FEA simulation, and the PSO-BP model possess the best prediction accuracy. For the cutting force Fz, their prediction accuracies of PSO-BP model are slightly inferior to those of GA-BP model, but which still locates within the acceptable range. As shown in Figure 8, between these two constructed BP models, the predicted milling force values of PSO-BP model are overall closer to the experimentally measured results (as listed in Table 2) of the milling forces along three different directions, as shown in Figure 8(d), which can well demonstrate that the PSO-BP model has higher effectiveness and stronger feasibility than the GA-BP model in predicting the complex cutting forces that suffer a larger number of intangible and indeterminate factors.
Constructions of transient milling force models
In order to more accurately characterize the complex milling forces, one cycle of experimentally collected data that have the most stable milling forces will be selected. Meanwhile, four dominant milling parameters, namely the spindle speed, axial depth of cut, feed speed, and rotation angle will be selected as the input vectors of GA-BP and PSO-BP neural networks model. In the selected cycle of stable milling process, 51 data points of experimental cutting forces will be chosen as the prediction values that are set as the output vectors of GA-BP and PSO-BP neural networks. Ultimately, all the 54 sets of data points of experimental milling forces will be adopted to train the GA-BP and PSO-BP neural networks, then the rotation angle (0~2π) of milling tool will be assumed as a time-dependent variable in characterizing transient cutting forces. In view of the numbers and levels of processing parameters in the planned experimental protocol, as listed in Table 1, the total number of required experimental data points will add up to 51×54 = 2754 points (54 sets of data points, 51 points per set). Among them, 52 sets of data points will be used to train GA-BP and PSO-BP models, and the rest two sets of data points will be used to verify and compare the accuracy of these two constructed ANN models. In addition, the feed-direction (Y-direction) cutting forces Fy of experimental measurements will be much more significant and distinct than the cutting forces Fx and Fz along the X-direction and Z-direction, this is because the cutting force Fy along the Y-direction is the dominant components of cutting forces in the side milling processes, thus one cycle of data points of transient cutting forces Fy will be chosen as the output vectors of these two constructed PSO-BP and GA-BP prediction models for investigating milling forces. According to equation (3), the APEs of these two PSO-BP and GA-BP models will then be calculated to comparatively investigate their prediction performances of cutting forces relative to the FEA simulations and machining experiments, respectively. Their corresponding performance comparisons of the transient milling forces Fy under two different series of processing parameters will be conducted on aluminum alloy 7050, as shown in Figure 9(a) and (b).
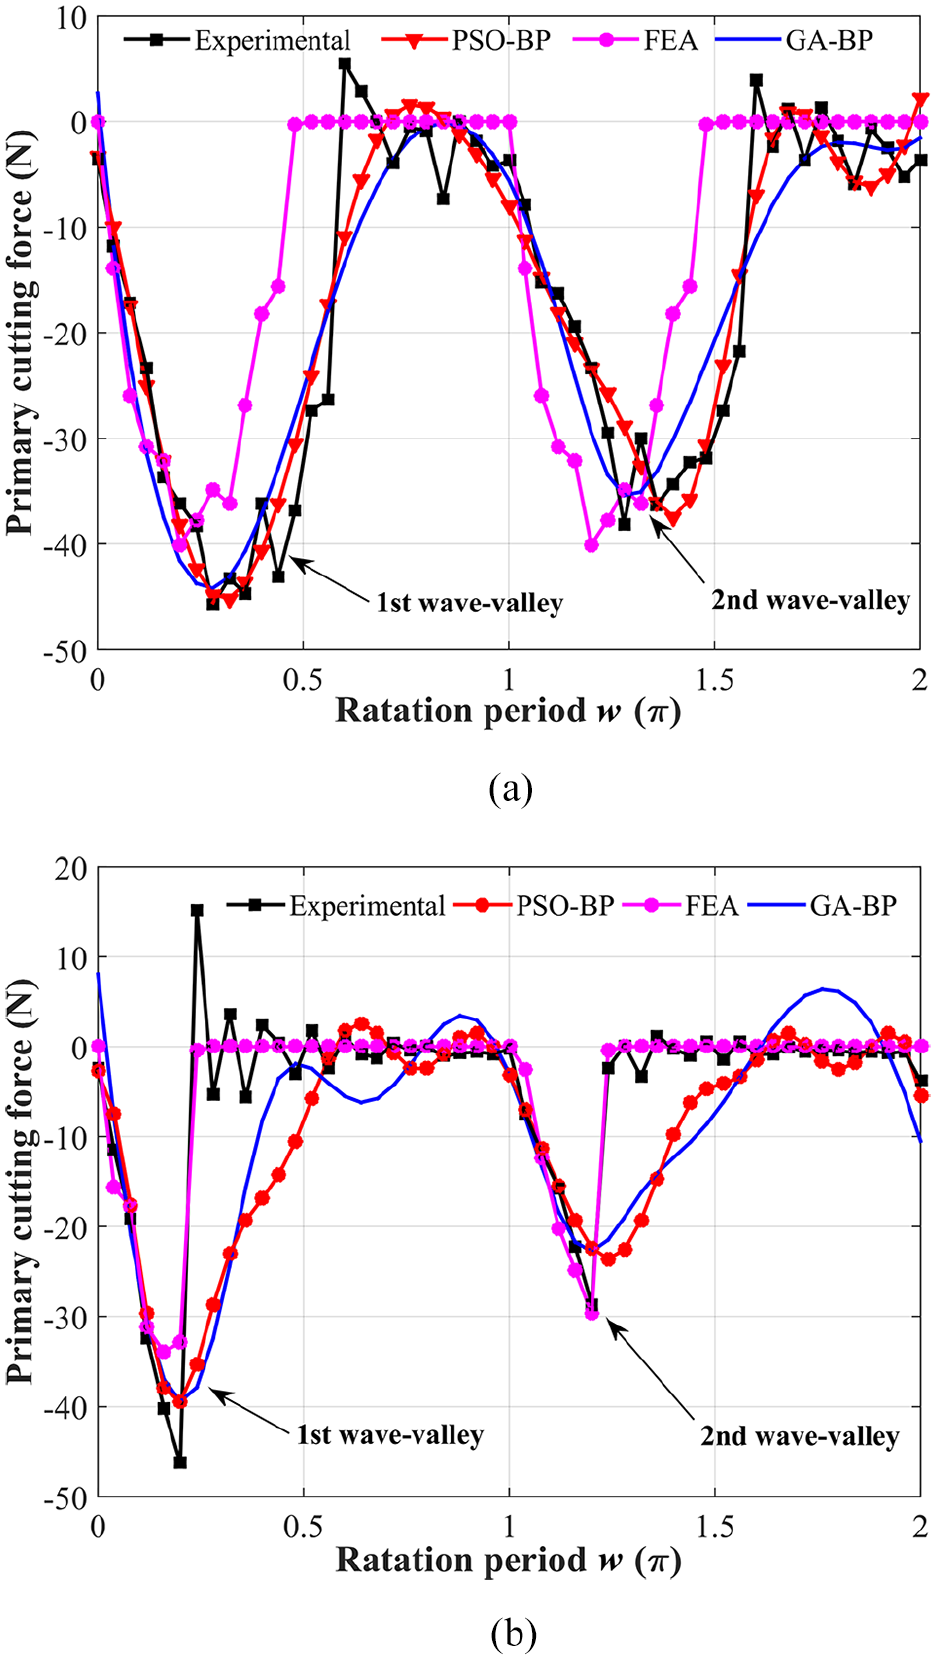
The comparison of cutting forces predicted by different models under two series of processing parameters. (a) n =3000 r/min, ha = 0.5 mm, fz = 0.05 mm/z, hr = 4 mm and (b) n =1500 r/min, ha = 0.5 mm, fz = 0.05 mm/z, hr = 1 mm. FEA: finite element analysis, PSO: particle swarm optimization; GA: genetic algorithm; BP: back-propagation.
As shown in Figure 9(a), under a set of processing parameters (spindle speed n = 3000 r/min, axial cutting depth ha = 0.5 mm, feed rate fz = 0.05 mm/z, and radial cutting depth hr = 4 mm), the transient cutting force can be predicted by the established PSO-BP and GA-BP models and compared with the experimental value, and then calculated, the APE relative to the experimental milling force is 3.4829 N and 4.5479 N. Similarly, under another set of processing parameters (n = 1500 r/min, ha = 0.5 mm, fz = 0.05 mm/z and hr = 1 mm), the transient cutting forces of built PSO-BP and GA-BP models are also compared with real experiments, respectively, and their corresponding APEs on the milling forces are 6.4575 N and 7.2371 N, as illustrated in Figure 9(b). Obviously, the milling force curves of constructed PSO-BP and GA-BP models cannot completely approximate to the experimentally measured milling forces. Although their corresponding APEs are both located within an acceptable range, the PSO-BP model can more accurately characterize the complex milling forces than the GA-BP model. In addition, the cutting force curves of built PSO-BP and GA-BP models both present two different wave valleys within one cycle of milling process that used the two-edged milling cutter, but their first wave-valley values of cutting forces are both greater than the second wave-valley values, which is mainly due to the undesired spindle eccentricity and tool vibration. In a word, all the obtained cutting force curves can well demonstrate that both the constructed PSO-BP and GA-BP models not only can effectively and accurately predict the milling forces under different cutting parameters, but also the influences of spindle eccentricity and tool vibration on the reliabilities and accuracies of ANN milling force prediction model are slight and negligible. On the other hand, the cutting force curves of FEA-based simulations have obvious inconsistency with the experimental cutting forces, as shown in Figure 9, and its corresponding APEs under two different sets of cutting parameters are 9.0986 N and 2.1508 N, respectively, which clearly indicate that the FEA-based simulations can effectively characterize the milling forces with an available range. Unlike the constructed GA-BP and PSO-BP models, the cutting force curves of FEA-based simulations will present identical wave-valleys within a cycle of milling processes, this is mainly because the spindle eccentricity and tool vibration are very difficult to be considered into the FEA-based milling models. Relative to the GA-BP model and FEA simulations, the constructed PSO-BP model can more accurately characterize the milling forces with different cutting parameters and their variation regularities with the time-dependent tool rotation.
Conclusion
In the milling processes, the cutting forces are synthetically determined by a larger number of sophisticated factors, such as material deformation, spindle eccentricity, and tool vibration, so that the complex cutting forces are difficult to be effectively characterized by mathematical models. Therefore, this article employs the ANN and FEA in effectively conducting the cutting force prediction models based on with the experimental cutting force data. Furthermore, the comprehensive comparison among the milling forces obtained by ANN-based predictions, FEA-based simulations, and milling experiments are conducted on aluminum alloy 7050 under different series of processing parameters. In addition, the FEA method is further adopted to comparatively investigate the stress distributions and chip formations.
The FEA software ABAQUS 6.14 is employed in constructing the FEA cutting models and creating two convenient plug-ins for the 2D/3D cutting models, then corresponding cutting forces, stress distributions, and chip formations can be obtained and revealed. From the FEA simulations on milling processes, the sector-shaped high-stress regions have appeared on the upper surfaces of workpiece because of the stress distributions extend from chips toward the inside of workpiece. Meanwhile, the highest stress is always located at the root segments of chips, which leads the chips to remain in the yielding states, this is conducive to form the continuous chips. Moreover, the FEA-simulated chip formations are very similar with milling experiments, particularly in some distinctive features of chip formations like their spatial curls and serrated wrinkles.
The ANN algorithms adopt the Tanh function as the activation functions, their weight and threshold are optimized by GA and PSO algorithms, then the APEs are defined to comparatively estimate the performances of two constructed ANN models in predicting cutting forces. Based on the selected cutting parameters and experimental cutting force data, the GA-BP and PSO-BP prediction models for the average and transient cutting forces can actually constructed, respectively. Concretely, the four cutting parameters involved in the experiment are used as input vectors to construct a neural network model to predict each component of the cutting force in three different directions. In the constructed ANN transient milling force model, four dominant cutting parameters (namely the spindle speed, axial cutting depth, feed speed, and rotation angle) are defined to be the input vectors, and the corresponding experimental transient cutting forces in the feed direction are selected as the output vector. For more accuracy and reliability, the ANN prediction models for transient cutting forces must select one cycle of fine experiment processes that have stable and reliable data points.
The FEA simulation, GA-BP and PSO-BP algorithms are respectively adopted to effectively predict the cutting forces of different milling processes on aluminum alloy 7050, then the overall performances of these three cutting force prediction models are comparatively investigated with the experimental measurements, the obtained results can clearly show that the built PSO-BP model has higher accuracies than the FEA simulation and GA-BP model in predicting the average milling forces along three different directions. The transient cutting forces predicted by PSO-BP, GA-BP, and FEA simulations are not completely consistent with the actual cutting forces, and their calculated APEs of these three different prediction models are well within an acceptable range, but the PSO-BP model shows the best performance for predicting the transient cutting force in the feed direction (Y direction). In conclusion, the PSO-BP model has higher accuracies than the FEA simulation and GA-BP model in characterizing the milling forces and their variation regularities, which well demonstrates that the constructed PSO-BP model has excellent capacity and feasibility in predicting the milling forces of different cutting processes.
Footnotes
Declaration of conflicting interests
The author(s) declared no potential conflicts of interest with respect to the research, authorship, and/or publication of this article.
Funding
The author(s) disclosed receipt of the following financial support for the research, authorship, and/or publication of this article: The authors are very grateful to the financial support from the National Science and Technology Major Project (2016ZX04002002) and the Department of Science and Technology of Jilin Province (20190103060JH).