
Abstract
Assembling variations caused by assembling system reliability degradation are the root causes of poor-assembled product reliability, and the reliability loss is the barometer of assembling quality risks. However, few studies have integrated reliability loss with assembling quality risk analysis. Therefore, a modeling approach of assembling quality risk regarding product reliability loss is expounded in this work. First, the assembling quality risk is divided into systematic, exterior, and interior risks, and a formation mechanism of assembling quality risk is presented. Second, the fusion framework of big operational data in assembling is described, an assembling reliability–quality–reliability chain is established, and the parameters of the chain constitute assembling system reliability (R), assembling process quality (Q), and assembled product reliability (R). Third, on the basis of the reliability–quality–reliability chain, the risk priority number is adopted to quantify the assembling quality risk, which is extended by quantifying the undetectable rate of the assembling system, the occurrence possibility of process variations, and the product reliability loss. Finally, an assembling quality risk of a circuit maintenance cover of a car is conducted to validate the effectiveness and advancement of the presented approach. The result shows that the proposed method can systematically quantify the assembling quality risk.
Keywords
Introduction
Reliability is the significant dimension of quality, and the decline in manufacturing quality is an important factor leading to product reliability degradation. 1 Therefore, product reliability modeling and assurance must be integrated into the manufacturing process. 2 Assembling quality is directly related to the product reliability; thus, the high quality of assembling is a prerequisite to output qualified products with high reliability. 3 Therefore, to ensure that reliable products are manufactured in batch productions with low risks, manufacturing engineers have to continuously improve the assembling quality. 4
The newly released ISO9001:2015 standard emphasizes the application of risk-based thinking on the quality assurance of products, thereby making integrated risk management an unavoidable trend. 5 Therefore, to reduce potential assembling risk with regard to product reliability, assembling quality should be controlled with the aid of risk thinking. During the assembling phase, the transmission and accumulation of process variations are the main factors leading to the product reliability degradation,6,7 but the focus should limit not only the assembling operation process but also the uncertainty of the upstream assembling system and the downstream assembled products. Currently, an analysis model that combines risk analysis and assembling quality has not received sufficient attention, and few studies and applicable methods are available regarding the integration of risk analysis and assembling quality control. 8
Currently, quality risk has two main definitions: cause-oriented and result-oriented thinking. Cause-oriented thinking considers quality risk as the cause of quality decline; 9 however, result-oriented thinking considers quality risk as the potential result of quality variations. 10 Correspondingly, assembling quality risk modeling has two main ideas. For cause-oriented modeling, Lee et al. 11 proposed a method combining the Petri net framework and simulation technology to conduct risk modeling and assessment for distributed manufacturing systems. Liu et al. 12 proposed a method based on comprehensive failure mode and affect analysis to evaluate the risk under uncertain conditions to improve the reliability and quality. But the capability to identify and analyze adverse factors of these methods is bound to decline with the gradual improvement of process technology until it is out of line with the production of modern enterprises. 13 For the result-oriented method, Thornton and colleagues14,15 proposed a risk-oriented management approach called variation risk management for quantifying the assembling quality problem. Zhang et al. 16 used the positive and negative aspects of the quality variation analysis method to innovate quality risk analysis technology and to suggest a new mass loss function. He et al. 4 proposed a quantitative risk method in consideration of product reliability by analyzing the low quality in assembling processes. Based on the cost of quality risk, Mo et al. 17 sort the process errors that lead to quality risks and to determine the priority of risk control to reduce the quality risk of the composite fiber–reinforced plastic assembly process.
For the assembling process, process variations are the main sources of assembling quality risks. The studies related to the impact of process variations on assembling quality include the following. Jin and Shi 18 developed an effective variation transfer model for multistage assembling processes. Huang et al. 19 proposed a stream of variation (SOV) model and a dimensional displacement model, wherein the variation control and prediction method based on SOV theory improved the automotive assembling reliability. Wang et al. 20 proposed a positioning variation model of aircraft panel assembly based on elastic deformation theory to improve the aerodynamic performance of the aircraft. Mei et al. 21 proposed an assembly variation modeling and analysis method based on elasticity mechanics and interval method to solve the problem of insufficient information available in the variation source. However, most of the current literature considers the adverse effect of assembling variations on assembling process quality only; the impact of assembling process quality on the reliability of the final product is still ignored. 22 For the error compensation of thin-walled workpieces, Si and Wang 23 proposed a research method of error compensation to improve the reliability of thin-walled products. Jiang et al. 24 considered the influence of workpiece variation accumulation on the current process. Based on the analysis result of machining variation, a workpiece positioning adjustment method under multi-tolerance conditions is proposed to reduce the adverse effect of variation on process quality. Research attention is given to assembling process variations only; assembling system failures and product manufacturing defects are not being considered. This condition is not conducive to prevent assembling quality risk from the source. In summary, a precondition required for comprehensively solving the problem of product reliability loss caused by poor-assembling quality is the establishment of a quantitative relationship between assembling system failure, assembling process variation, product manufacturing defects, and assembling quality risk.
Therefore, a reliability loss–oriented assembling quality risk analysis model based on a reverse assembling reliability–quality–reliability (RQR) chain is developed, and the main contributions are as follows:
Based on the relationship between assembling system, assembling process, and assembled product, the connotation and formation mechanism of assembly quality risk are expounded from the perspective of risk origin, transmission, and influence.
The quantitative metric and fusion method of the big operational data of assembling for risk quantification is explained, and the assembly RQR chain is proposed.
The risk priority number (RPN) is extended by analyzing big operational data of assembling to synthesize risk.
The remainder of this article is organized as follows. The connotation and formation mechanism of assembling quality risk are expounded in section “Analysis basics of assembling quality risk.” The data fusion framework and assembling RQR chain is proposed in section “Assembling RQR chain based on big operational data of assembling.” The RPN extended to quantify the assembling quality risk is given in section “Assembling quality risk modeling based on extended RPN,” and a case study is provided in section “Case study.” Finally, conclusions and directions for the future research are given in section “Conclusion.”
Analysis basics of assembling quality risk
Connotation of assembling quality risk
According to the systems’ engineering principle, the assembling stage comprises three main management objects: assembling system, assembling process, and assembled product. The three objects can affect each other, and any variation or error in the management objects will lead to an increase in product assembling quality risk. The connotation of assembling quality risk is shown in Figure 1.
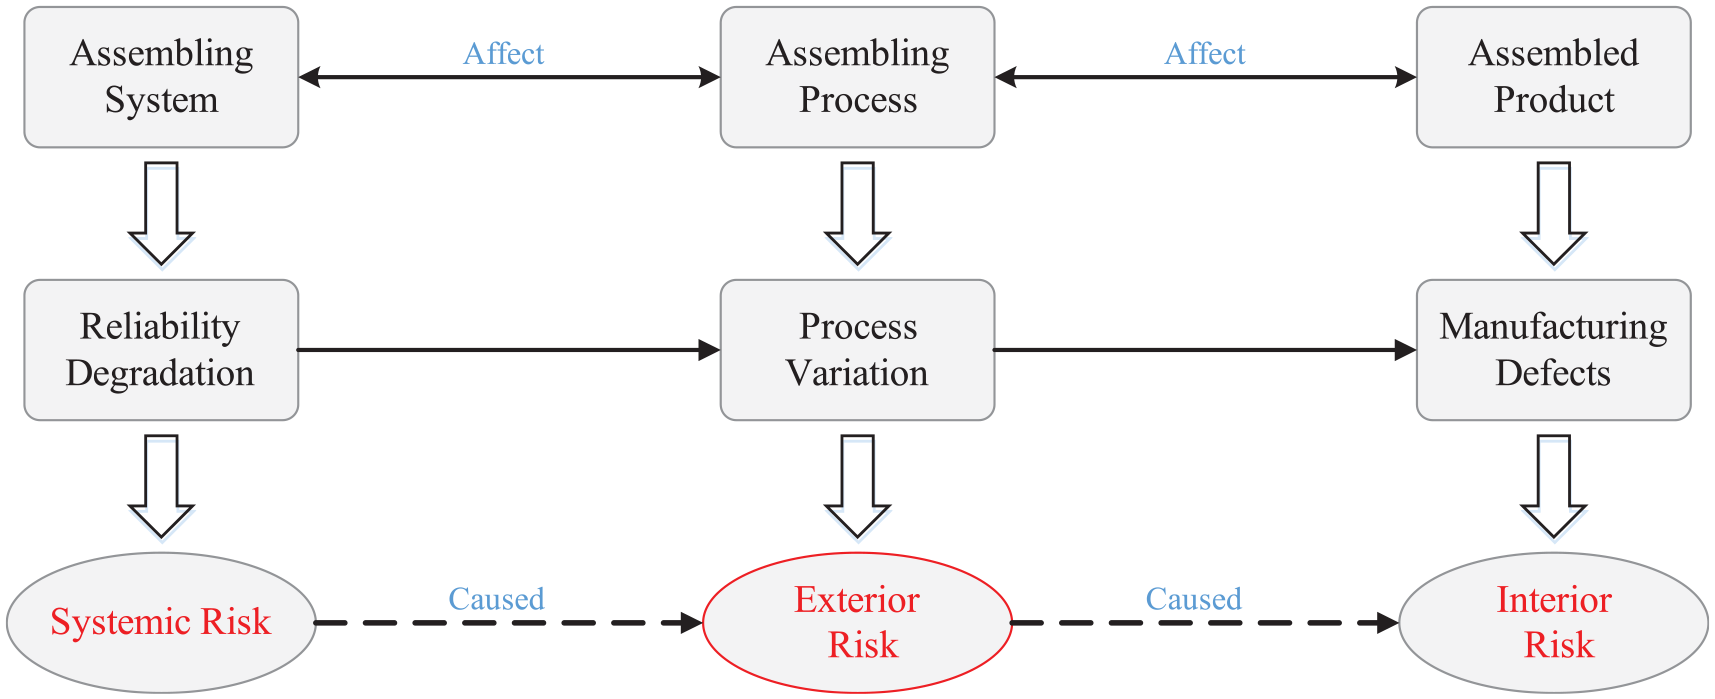
Connotation of product assembling quality risk.
As shown in Figure 1, the top level reflects the interrelationships between the three management objects in assembling phase, and the three latter levels expound the causes and control ideas of assembling quality risk from top to bottom. As shown in the first level, the assembling system, assembling process, and assembled product can affect each other. Meanwhile, the second and third levels show that when the assembling system fails, system reliability is degraded, and a systemic risk is formed. When the equipment begins to operate, the systemic risk affects the assembling process, resulting in the process quality decline and the occurrence of key process variable (KPV) assembling variations, and the exterior risk is formed. This risk is the main manifestation and the most important component of the assembling quality risk in the assembling stage. It can be viewed as a narrow version of assembling quality risk. With the operating multi-station assembling process, variations are gradually transmitted and accumulated, and the exterior risk gradually enlarges and acts on the assembled products, resulting in production defects and the formation of interior risks. The three risks work together to constitute assembling quality risk, which ultimately leads to product reliability loss. Therefore, assembling quality risk originates from the assembling system, appears in the assembling process, and acts on the assembled product.
Formation mechanism of assembling quality risk
Product assembling quality risk is an integrated risk. The formation mechanism is shown in Figure 2.
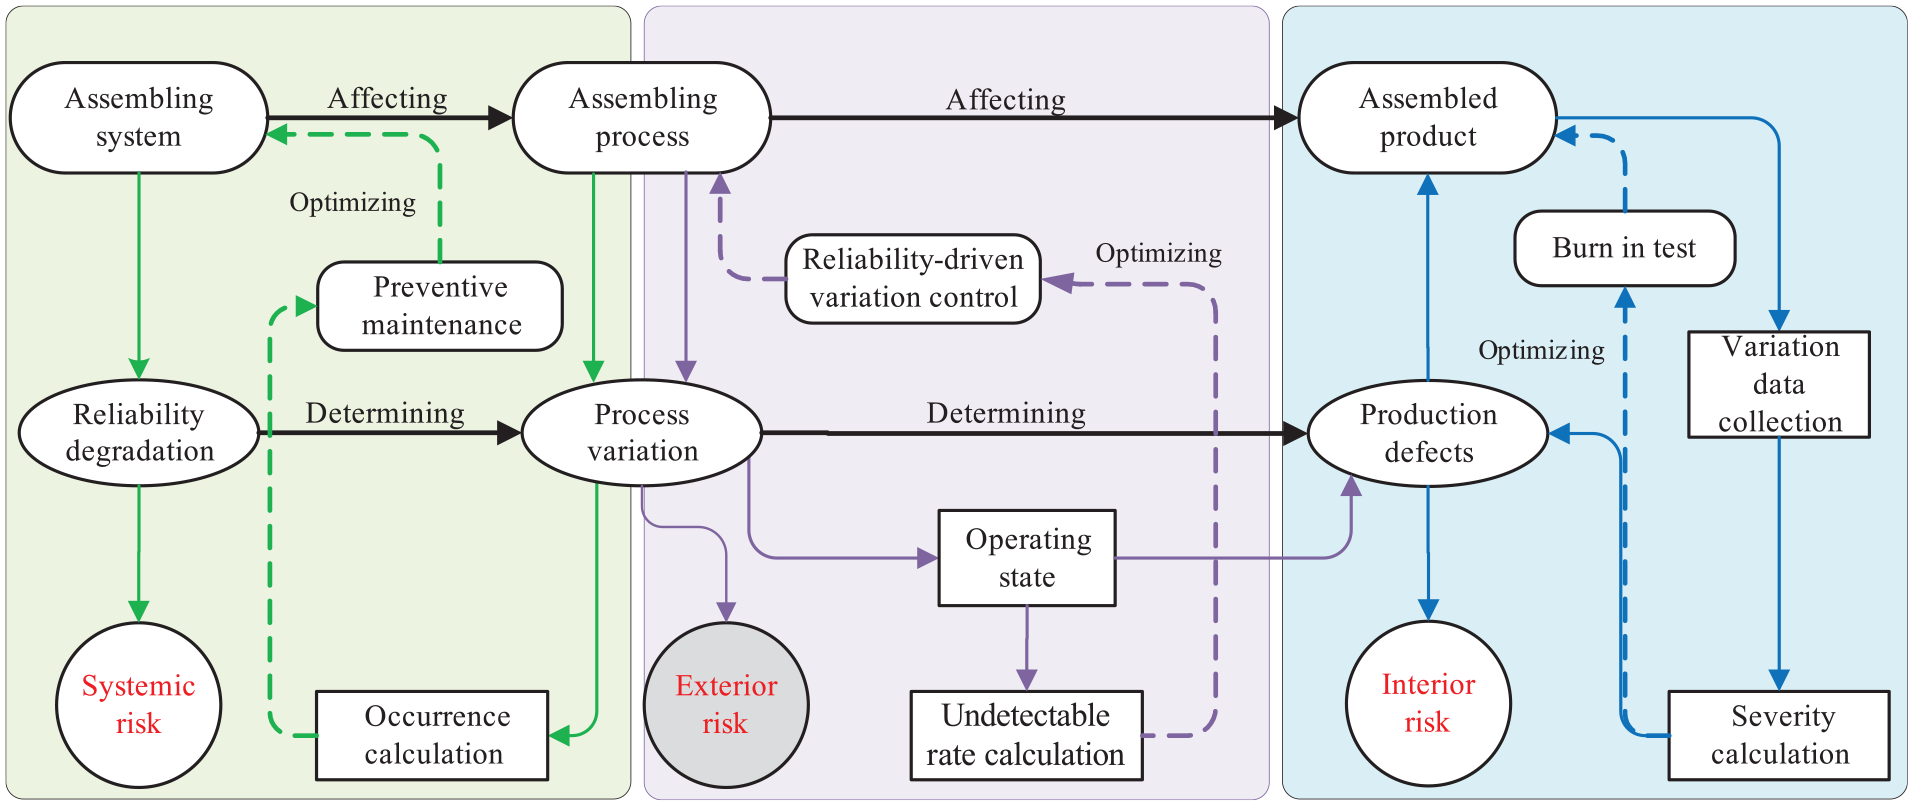
Formation mechanism of product assembling process quality risk.
As shown in the left part of Figure 2, in the actual engineering operation, the influence of external stresses often leads to assembling equipment defects, which cause assembling system reliability degradation. The existence of such defects will affect the assembling process quality and lead to process variations. This risk is caused by assembling system defects and is called systemic risk, from which assembling quality risk originates. However, identifying systemic risk in an actual assembling stage is difficult. As shown in the middle part of the figure, systemic risk leads to assembling variations, and with the proceeding multi-station assembling process, the previous station process variations will continue to be transmitted downward. Meanwhile, the new variations in the next station produce and cause accumulated variations. According to axiomatic domain mapping, the key quality characteristics (KQCs) can be mapped to the KPVs. Once the KPV variations occur, they will gradually accumulate, resulting in KQC variations and creating exterior risk. The process variation can be discovered and the exterior risk can be controlled by reducing the process variation. As shown in the right part of the figure, after the assembling process, the assembled product is formed. The exterior risk will affect the final product reliability; specifically, the actual reliability of the product is declined compared with the design process. Then, product internal defects occur, and interior risk forms. However, the interior risk can be discovered only after the product has been assembled, which causes substantial economic losses to the company. Among the risks, the systemic risk is the hardest to control because of its fuzziness. Exterior risk is the kernel of the assembling quality risk and easy to control. Meanwhile, any attempt to control interior risk is futile because by then, product reliability can no longer be improved, and large economic losses will be incurred. Thus, exterior risk is most valuable in the control of assembling quality risk.
Assembling RQR chain based on big operational data of assembling
The fusion framework of big operational data in assembling
With the continuous development of intelligent manufacturing, sensors for process data acquisition and processing are becoming increasingly intelligent, which could help manufacturers collect more data for analysis easily.
The big operational data of the assembling collected by smart sensors reflect the origin, formulation, and propagation of assembling quality risk. Therefore, the big operational data of assembling process can be integrated and analyzed to quantify the risk, and the risk analysis results can be used to find the weak links in the assembling stage, which provides a possible means to control the assembling quality risk and makes the proactive control feasible. The process of using the big operational data of assembling is shown in Figure 3.
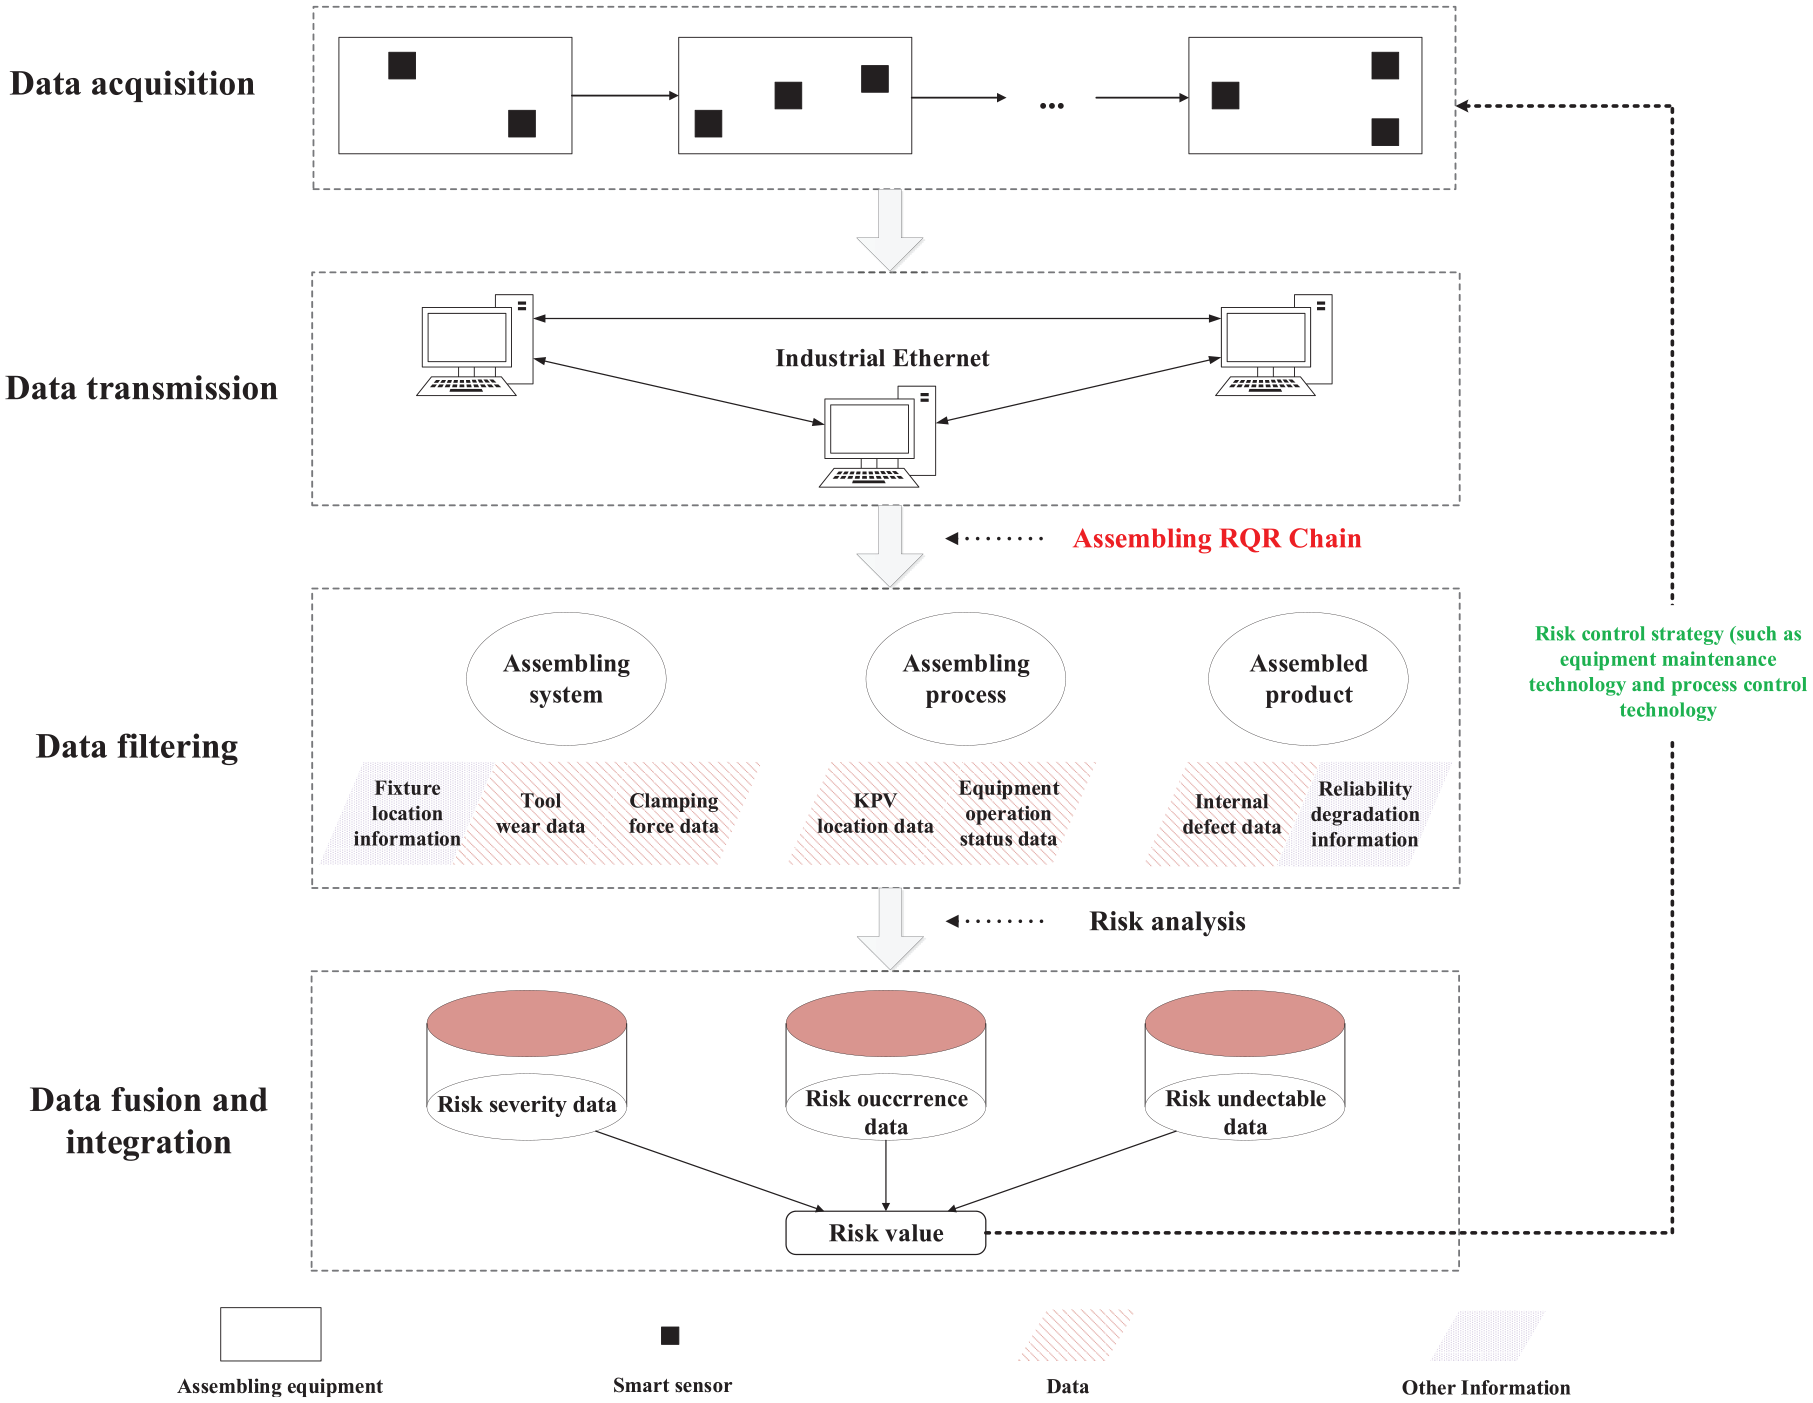
The flow chart of big operational data fusion in assembling.
As shown in this figure, the use process of big data can be divided into four stages, namely, data acquisition, data transmission, data filtering, and data fusion and integration: First, collection of data includes multiple data types such as equipment, process, and product data. Second, the data are transmitted through industrial Ethernet. Third, based on the type of data needed by the assembling RQR chain, the big data are filtered. For this article, the required data mainly include the degradation data of the assembling system (such as the clamping force data of the fixture and the positioning pin positioning data) and the assembling process quality data (such as the assembling process variation data of work in process (WIP)). Then, data fusion and integration are needed to use complex data for risk analysis and quantification. Finally, based on the analysis result, the risk control strategy is formulated and implemented from the perspectives of equipment maintenance and process control to achieve continuous reduction of assembling quality risk.
Assembling RQR chain
The big operational data of the assembling could provide solid data support for risk assessment algorithms, and thus, a bidirectional chain structure assembling RQR chain is proposed with the aid of the collected data, and its conceptual model is shown in Figure 4.
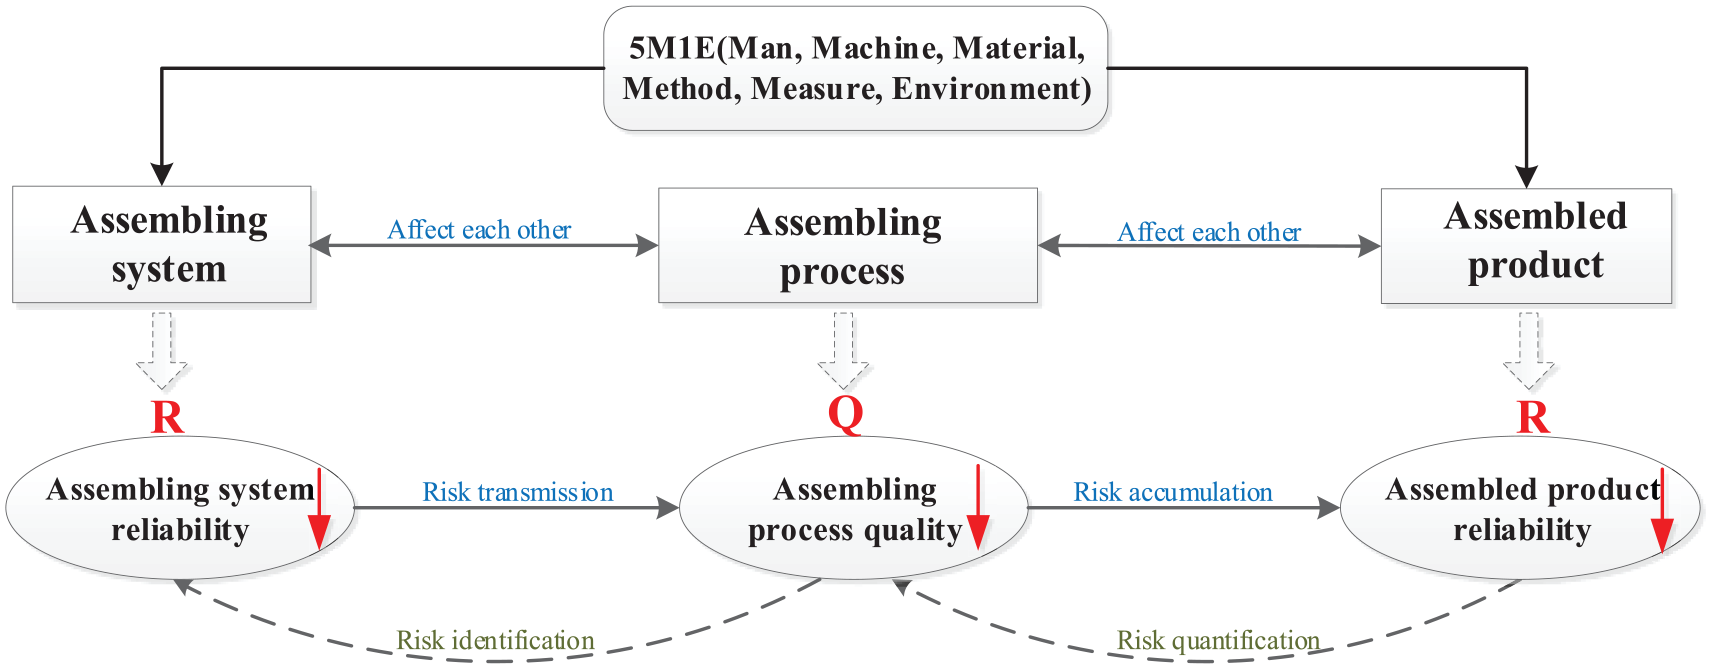
Conceptual model of assembling RQR chain.
As shown in the upper portion of Figure 4, the assembling system, the assembling process, and the assembled product can affect each other during the multi-station assembling. To quantify the assembling quality risk by using the big operational data of assembling, three quantifiable objects are proposed: assembling system reliability (R), assembly process quality (Q), and assembly product reliability (R). The three objects constitute the assembling RQR chain.
As indicated in Figure 4, the left-to-right positive assembling RQR chain is a result-oriented risk transfer chain that describes the process of assembling quality risk creation, transmission, and presentation. The effect of external factors leads to assembling quality risk, and then, it is transmitted along the forward assembling RQR chain; the reverse RQR chain (right to left) is a cause-oriented risk-tracking chain that provides solutions for risk quantification and control. When product reliability loss occurs, it can be traced according to the reverse assembling RQR chain for risk traceability.
Assembling quality risk modeling based on extended RPN
Modeling framework of assembling quality risk
The analysis framework that is based on an extension of RPN is proposed for assembling quality risk. This framework is shown in Figure 5 and includes risk identification, quantification, and ranking.
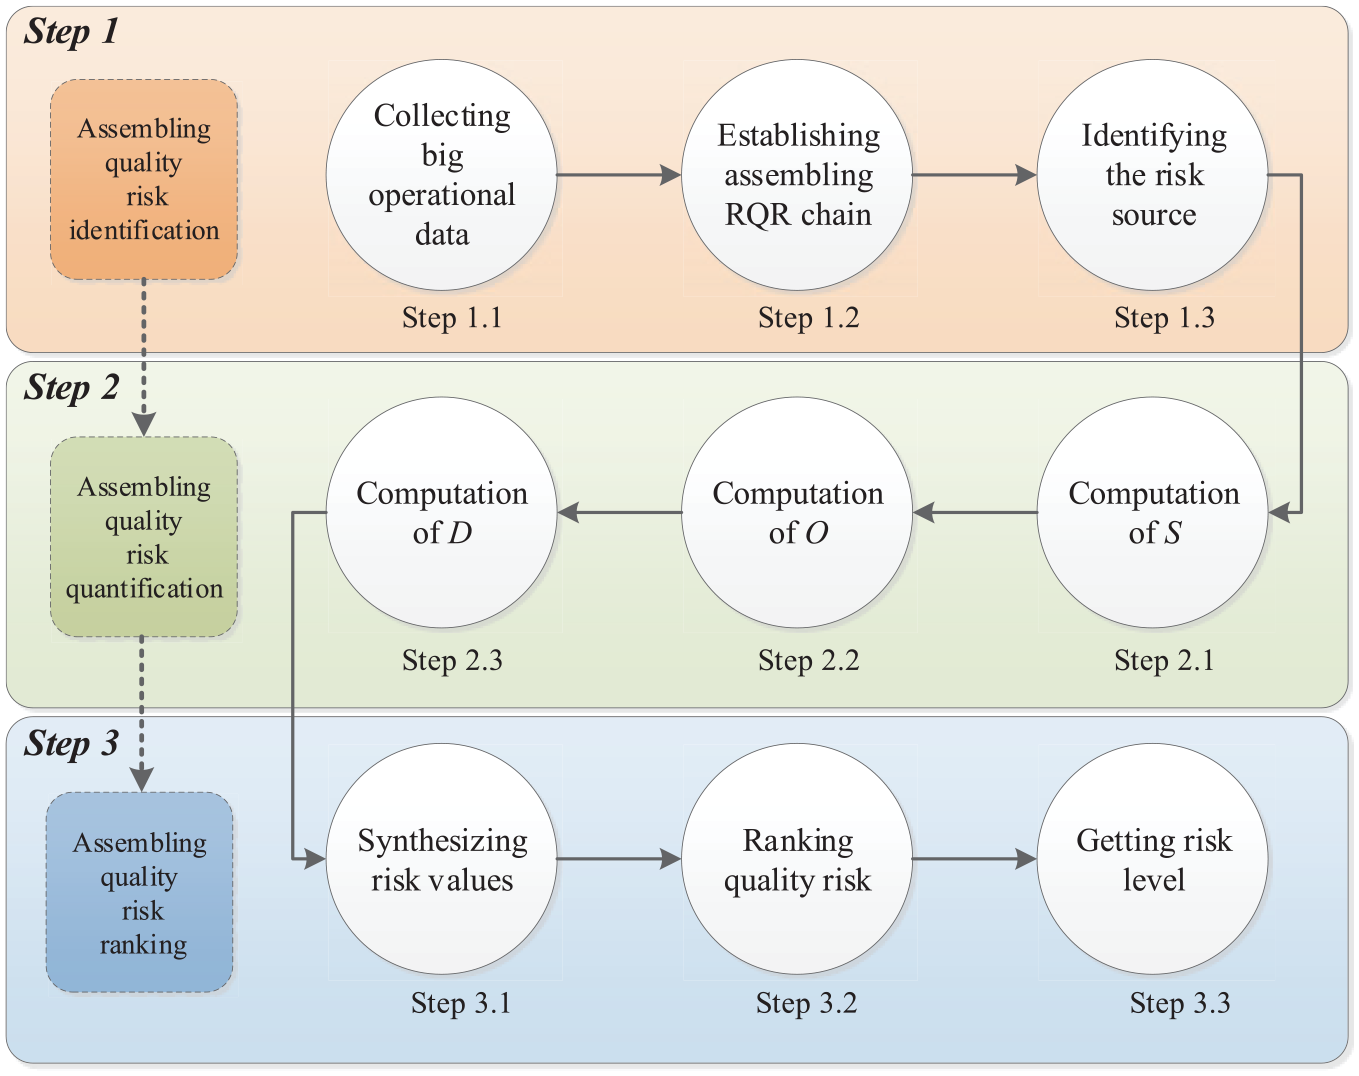
Framework of product assembling quality risk quantification based on RPN.
Step 1. Risk identification
Collect real-time assembling data with smart sensors to build data foundation. Then, establish assembling RQR chain and identify the risk source.
Step 2. Risk quantification
Considering the impact of actual data on the objectivity of risk quantification, the RPN method is extended to quantify product assembling quality risk in this study. The parameters are quantified by the big operational data of assembling. (The detail is discussed in section “Computation of RPN.”).
Step 3. Risk ranking
According to the value of
Computation of RPN
Combined with the big operational data and the mechanism of assembling quality risk, the extended RPN calculation framework is proposed and shown in Figure 6.
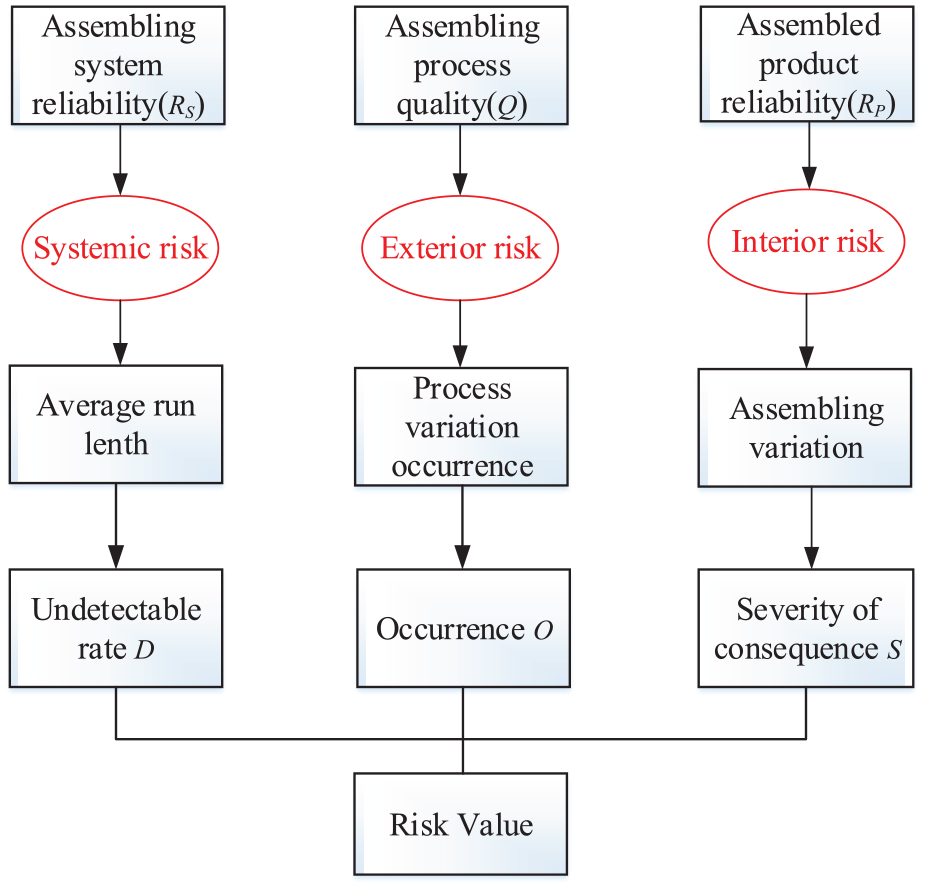
Extended RPN calculation framework.
As shown in Figure 6, starting from the three management objects of the RQR chain, the traditional RPN value is extended to determine the value of the parameters

where
The novel calculation methods of
Severity S computation based on reliability loss
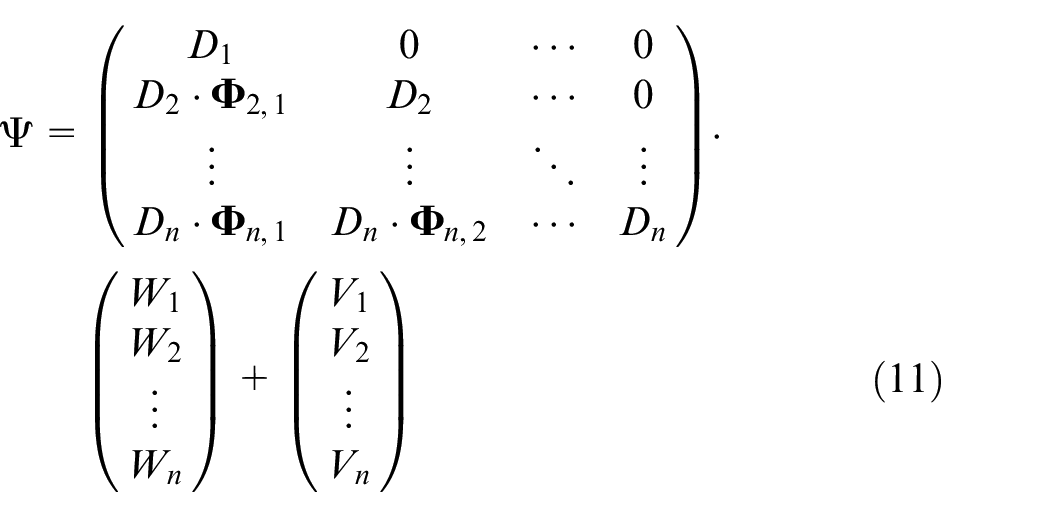
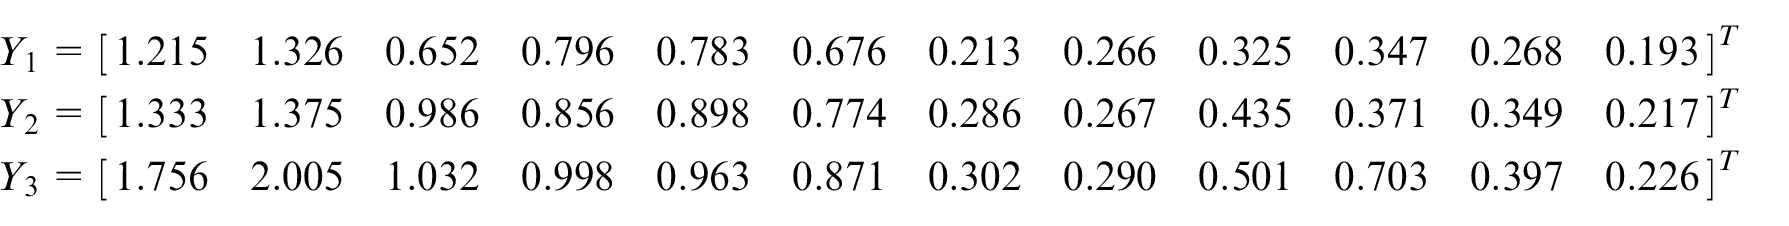
The difference between the actual product reliability and the design reliability is called as reliability loss and results from product assembling quality risk. The most significant component of product reliability loss is product assembling defect. Therefore, the consequence severity S of the assembling quality risk is determined by the assembled product reliability
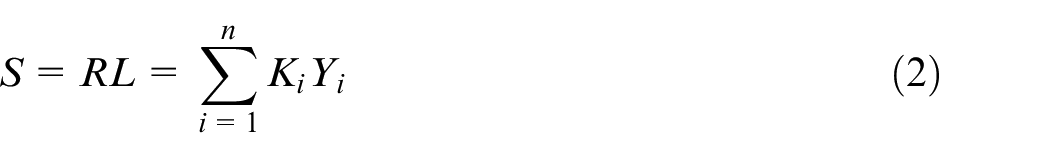
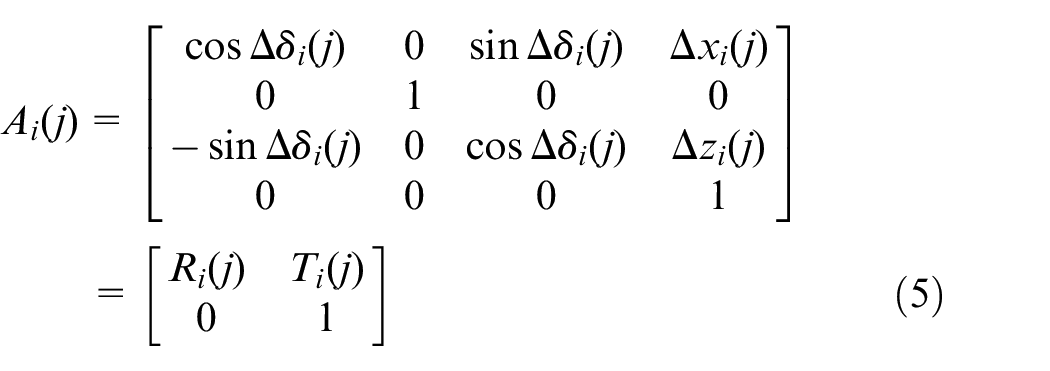
where

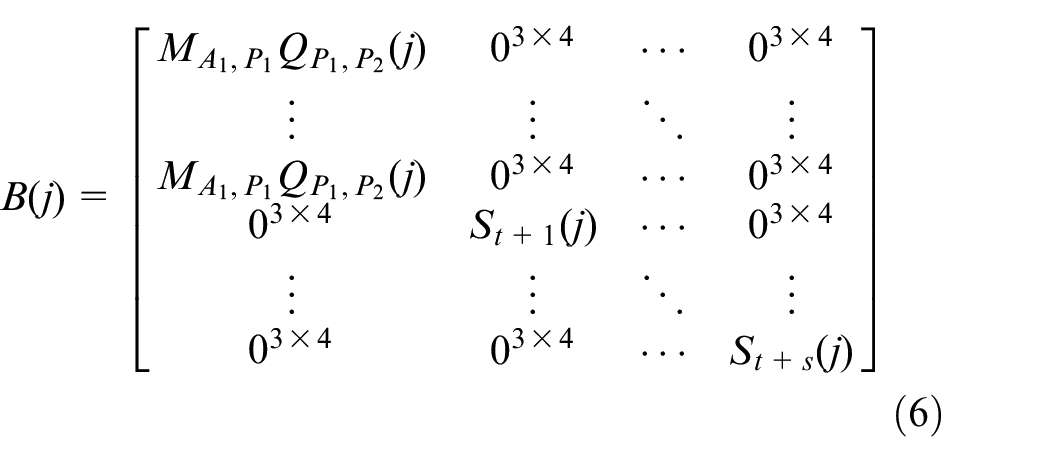
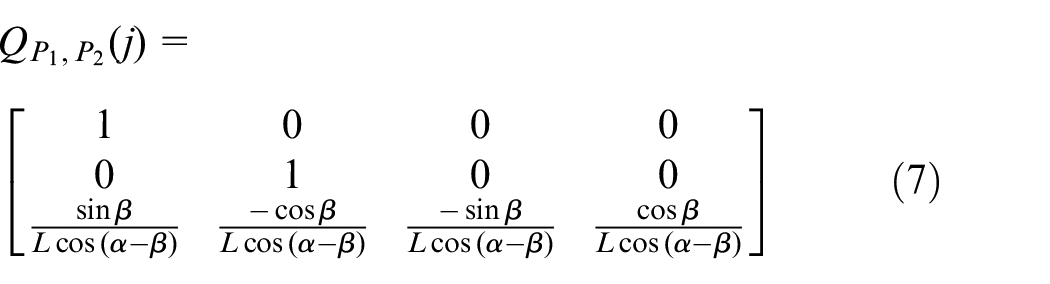
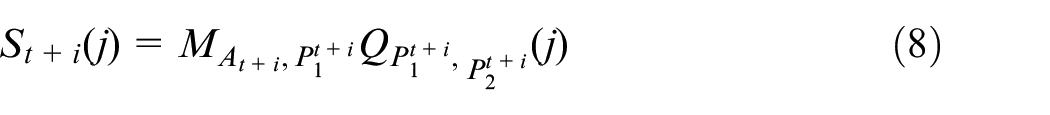
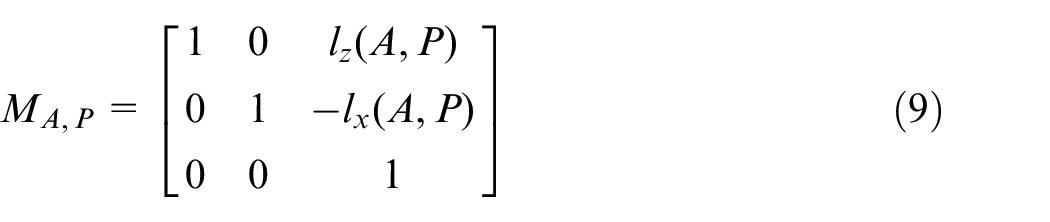
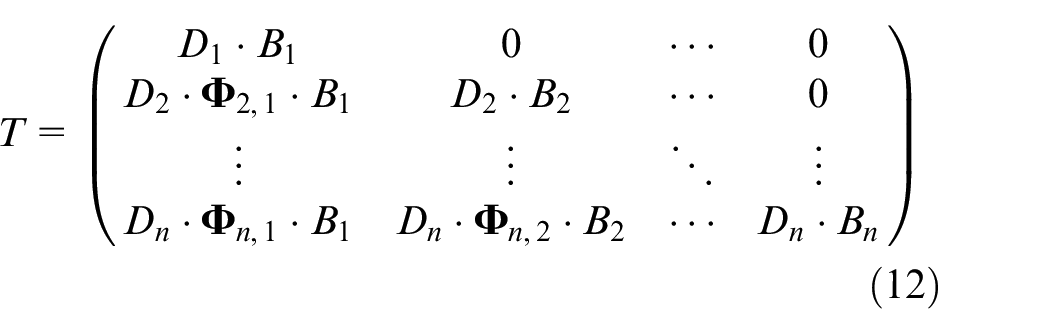
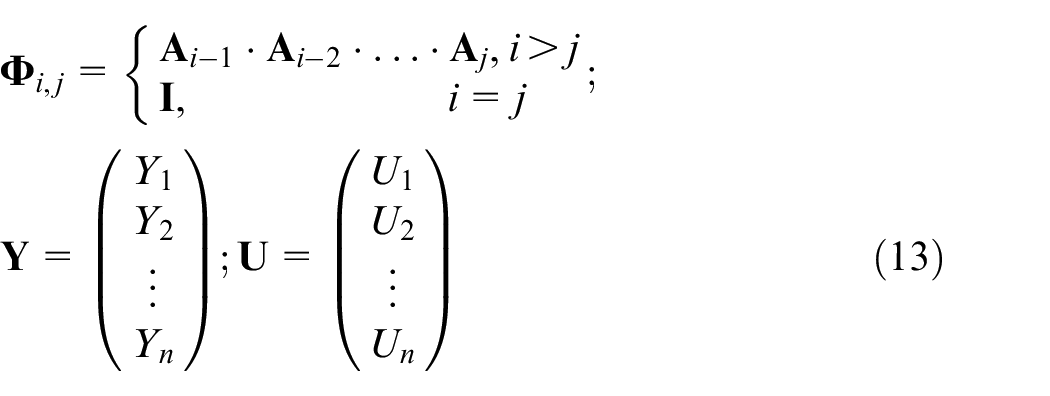
where the measurement matrix

where
where
where
where
After the aforementioned process,

where
Then, the analytic hierarchy process is used to determine the weight of each station k.
On the basis of the axiomatic domain, the
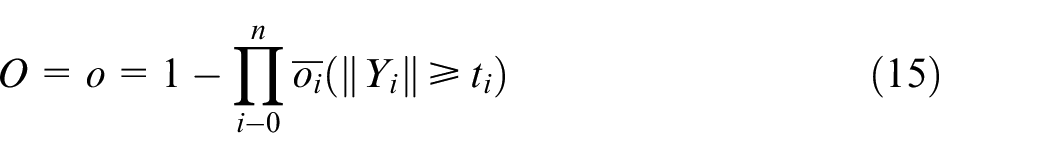
Occurrence O calculation based on frequency of process variation
The reverse assembled RQR chain is traced back to the product assembling process, the low quality of which is the main reason for the reliability loss of downstream products. Specifically, when the assembling process quality
First, monitor KPV changes at each state in real time. Then, the minimum KPV variations (modulus of KPV variation threshold vector, hereafter called threshold) on each station that will lead to product reliability loss are determined via a consultation with experts’ experiences and referral to historical data of quality risk accidents.
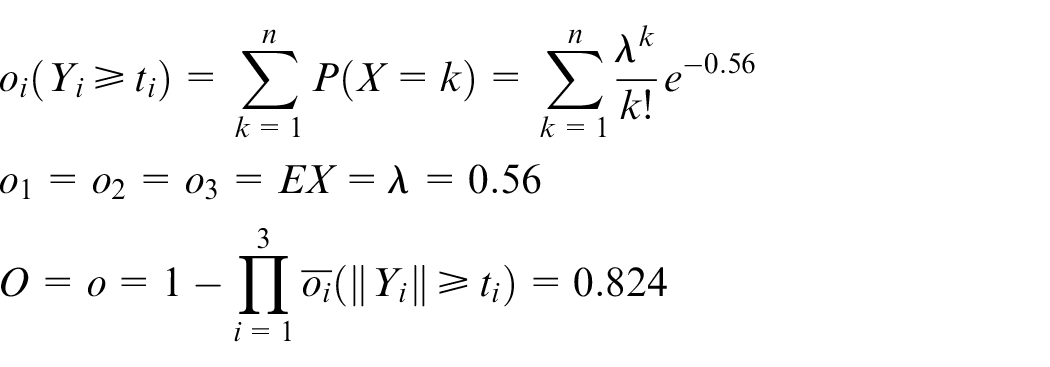
Second, the probability of the variations is quantified. Given that the occurrence of KPV assembling process variations on each station is random and each KPV is independent, the occurrence probability of variation is subject to the Poisson distribution. Then, according to the KPV variation threshold condition of each station, the Poisson distribution is used in following equation (14)
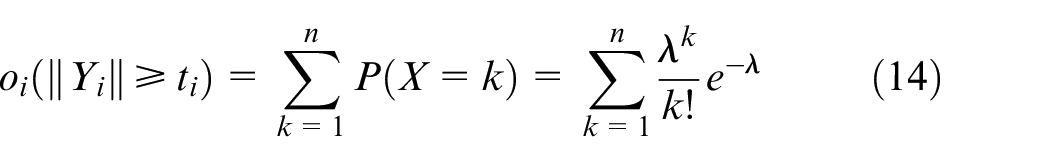
where
Finally, the modulus of KPV variation vector not less than the threshold generated during the entire assembling process is recorded as
where
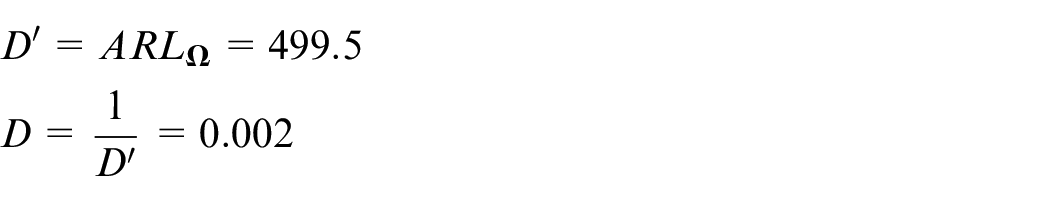
Undetectable rate D assessment based on average running length
Relying on the RQR chain reverse operation mechanism, the risk is traced further. The source of assembling quality risk is assembling system reliability degradation. Specifically, when the assembling system reliability
As mentioned in section “Occurrence O calculation based on frequency of process variation,” the KPV variations in the list are monitored in real time. Once the variation threshold is exceeded, alarm can be issued. That is, as long as an

where
This study considers the bilateral control limits, and the control chart is divided into five areas: the target area
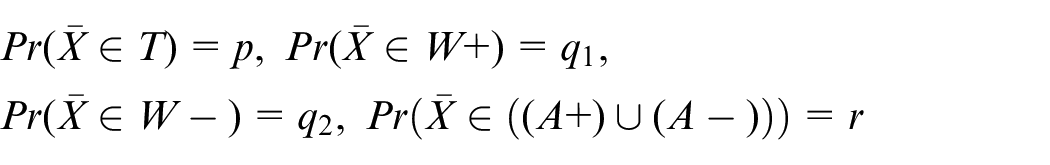
where


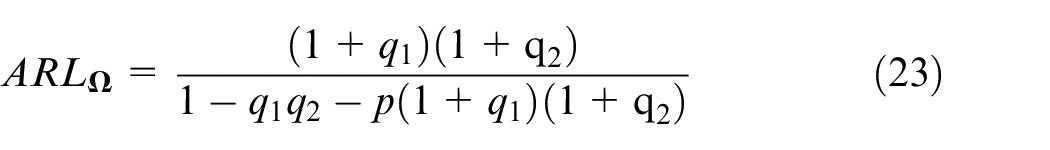
The ARL calculation formula is as follows
Case study
Background
In Chinese automobile manufacturing companies, product quality accidents frequently occur on the front cover of a car, which reduces the reliability of the car and results in substantial economic losses. Companies intend to adopt quality control methods in the assembling process to decrease the assembling quality risk and thus improve product reliability.
After a preliminary analysis of a company, technicians discover that quality accidents are related to the failure mechanism of the maintenance cover inside the front cover. In engineering practice, daily maintenance and vibration activities cause lid edge wear, and variations in its size during assembling accelerate wear, resulting in a gap between the lid and its corresponding counterpart clearance groove, causing dust accumulation in internal control circuit and resulting in malfunction.
The approach proposed in this study is used to identify and quantify the assembling quality risk of circuit maintenance cover. The specific assembling process design in this case study and the distribution of measurement points for each station are shown in Figure 7. Four components are assembled at stations I and II, and the final assembling is checked for surface finish, joint quality, and dimensional defects in station III.
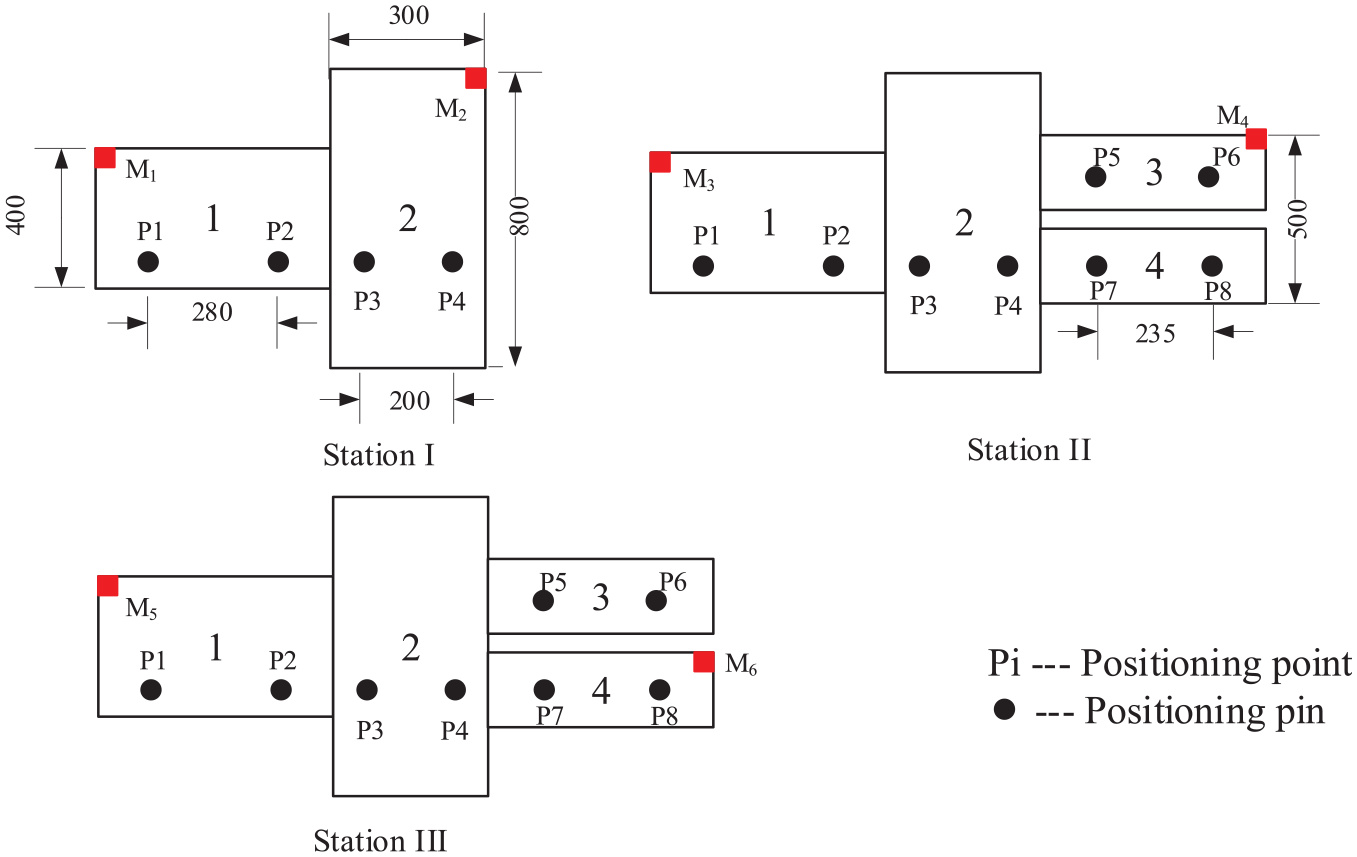
Assembling process and measurement point diagram.
Numerical examples
In this section, the proposed approach is verified with the circuit maintenance cover of a car.
Completing the risk source determination, the data results are shown in Table 1.
Initial coordinates of fixture pins and measurement points (unit: mm).
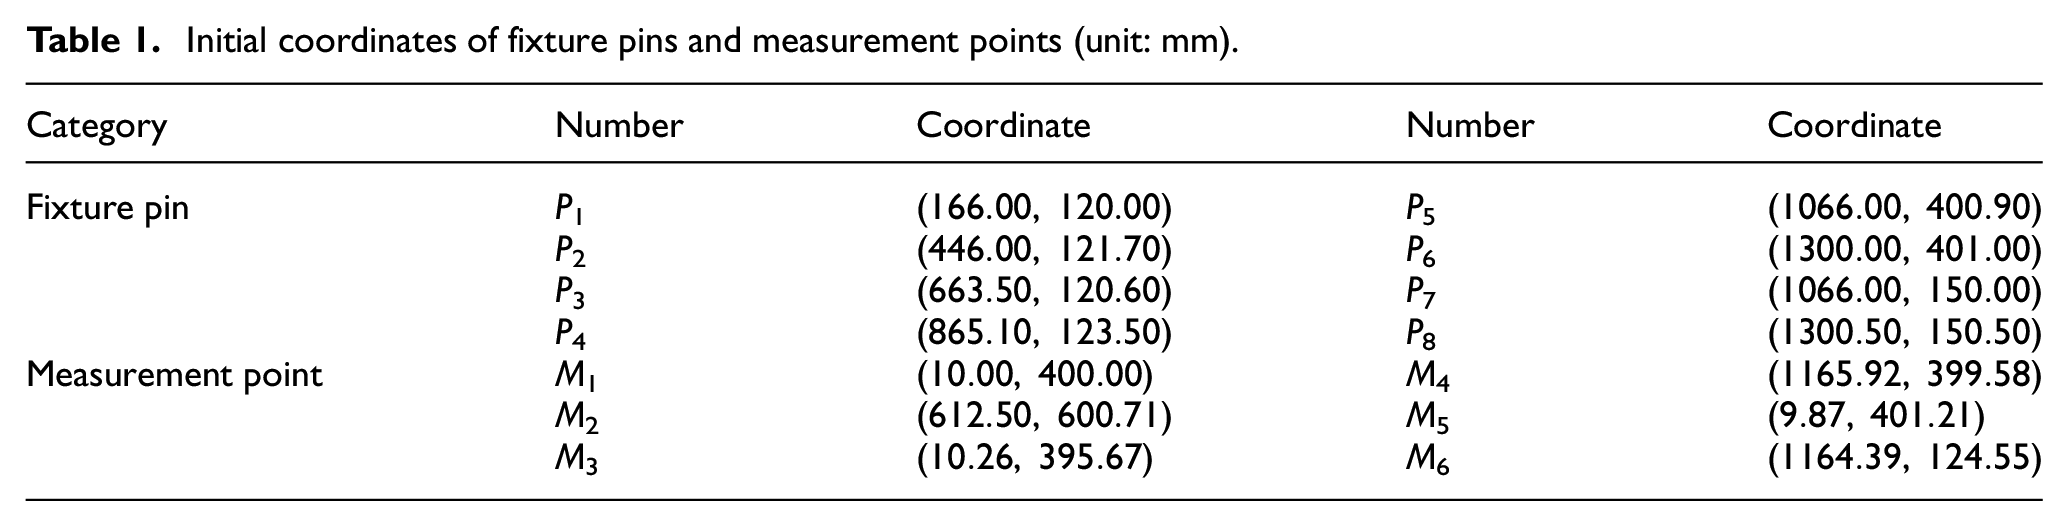
Three stations comprise during the assembling process. Each station has two measurement points, and each point is represented by
After calculation
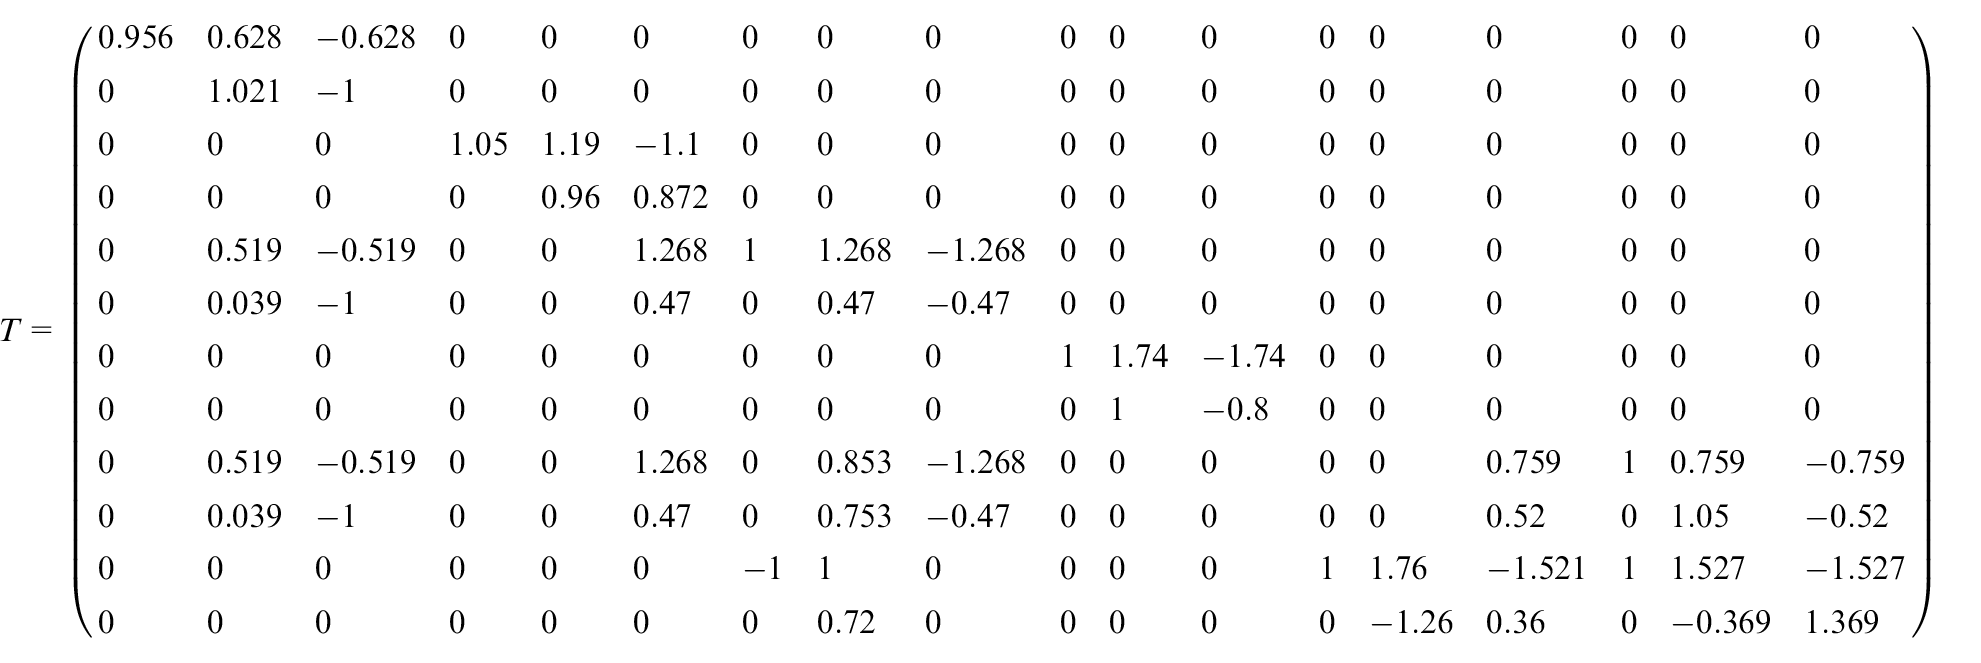
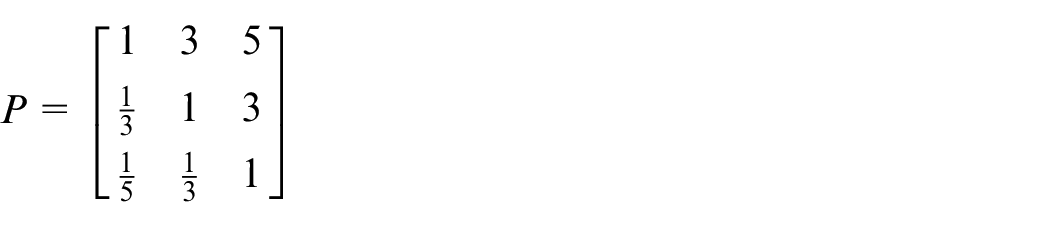

The weight matrix is constructed from the variation vector
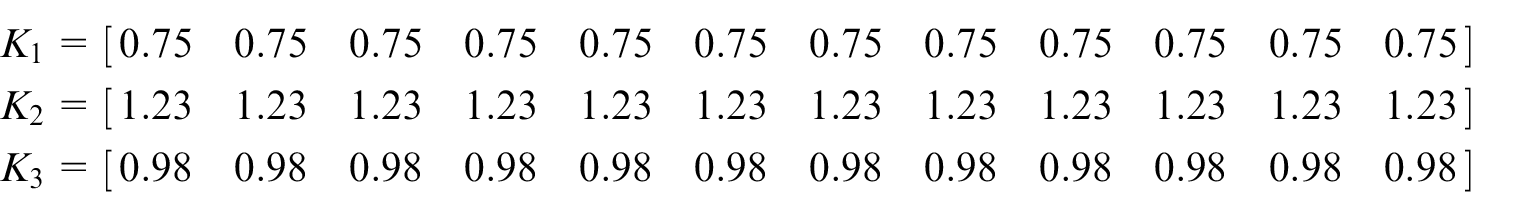
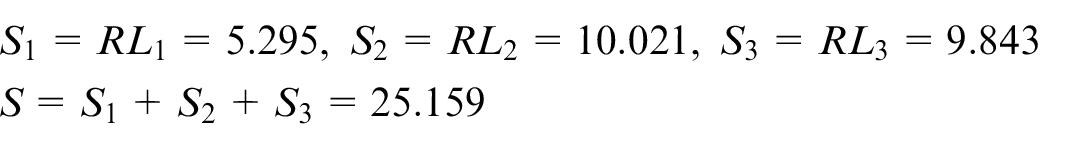
The severity of the consequences of each station S is calculated
According to the experts’ experiences and historical data, Table 2 is obtained.
Improved KPV variation threshold list.
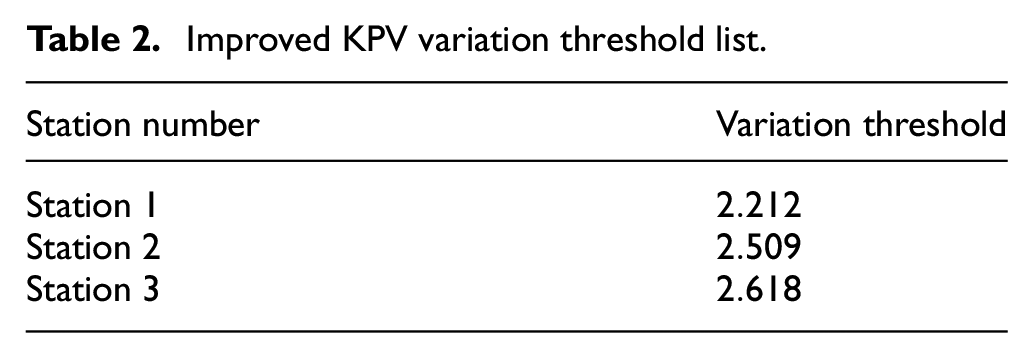
According to the relevant information and data,
Finally, according to the historical data, the values of

Therefore
Thus

According to the engineering data and experts’ experiences, the risk ranking table is obtained, as shown in Table 3.
Assembling quality risk ranking table.
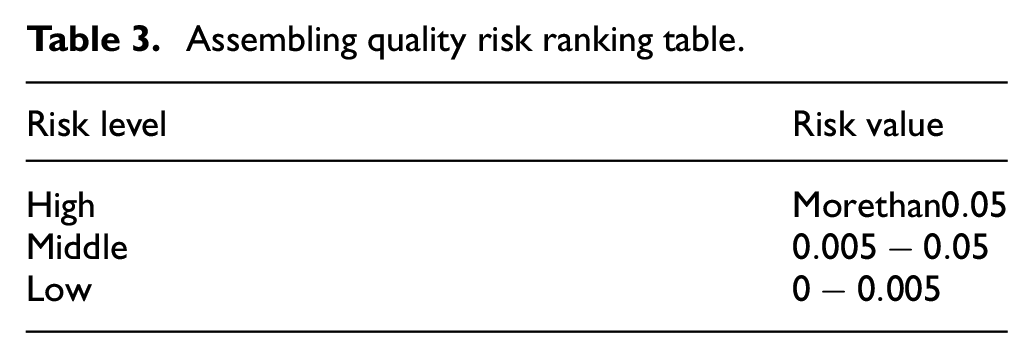

Therefore, the risk is at middle risk level.
Comparative study
The traditional RPN method is not objective in terms of parameter value. Therefore, the extended RPN method is compared with the traditional RPN method.
In the traditional RPN method,
Assume that there are two maintenance covers: a and b, and the two different RPN methods are used to determine the value of
First, the traditional RPN method is used to determine the parameters of assembling quality risk of two covers. The values of

The proposed RPN method is then used to determine the parameters of two covers by analyzing the big operational data of assembling. The
Finally, the results obtained by the two methods are compared, as shown in Table 4.
Comparison of two methods’ risk calculation results table.
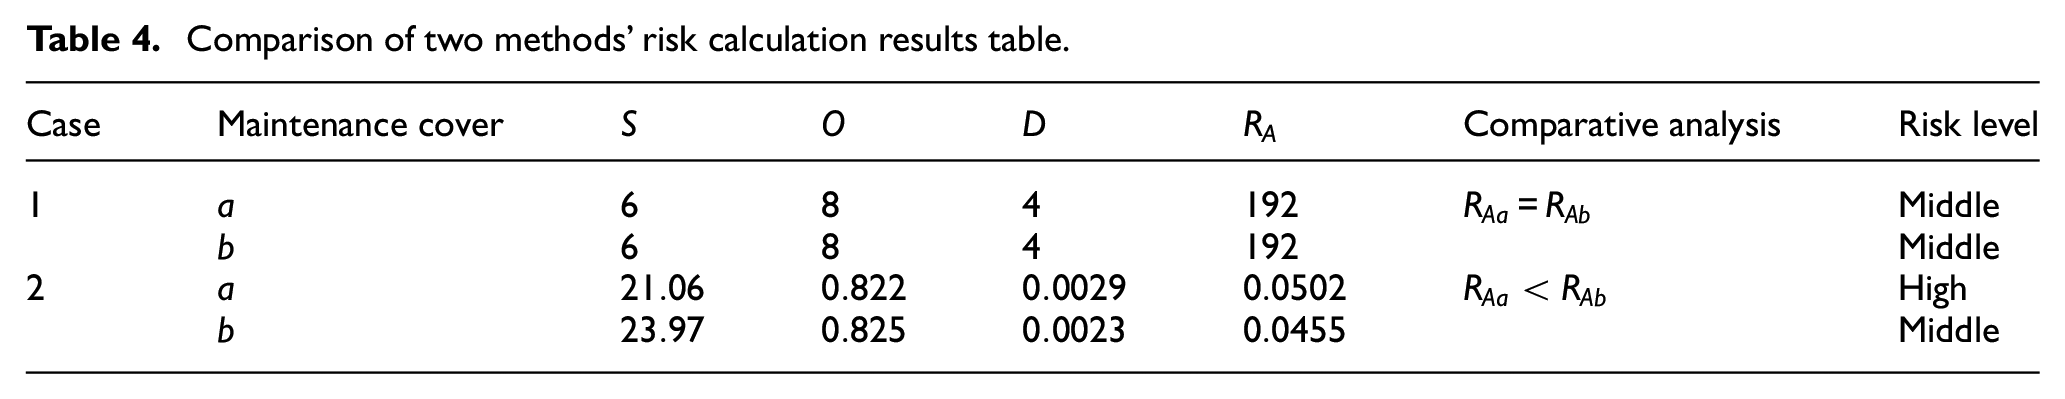
When the traditional RPN quantifies the risk, the two covers’ risks are same and at middle level. Thus, the decision in actual engineering process is to implement middle-level risk prevention and control measures for both covers. When the risk is quantified by the extended RPN, the risk value of cover a is large and at the high risk level and the risk value of cover b is small and at the middle risk level. The decision in actual engineering process is to implement high risk prevention and control measures for a and middle risk prevention and control measures for b.
According to the aforementioned results, the proposed RPN is practical in engineering practice and has far-reaching significance for risk control.
Conclusion
This study considers product reliability loss, adopts risk thinking to deal with assembling quality, and presents the concept of product assembling quality risks. The use of the concepts of systematic, exterior, and interior risks from the assembling system, assembling process, and assembled product, respectively, is proposed for describing the connotation and formation mechanism of the assembling quality risk. Correspondingly, on the basis of the relationship between assembling system R, assembling process Q, and assembled product R, an assembling RQR chain is proposed. First, the assembling quality risk source is identified, and the traditional RPN is extended according to the assembling RQR chain; second, the values of the parameters
The following aspects are possible directions in the future work:
The contribution size of the three parameters in the extended RPN to the risk of assembling quality can be further explored.
According to the reverse operation mechanism of the assembling RQR chain, risk control measures can be researched.
Footnotes
Declaration of conflicting interests
The author(s) declared no potential conflicts of interest with respect to the research, authorship, and/or publication of this article.
Funding
The author(s) disclosed receipt of the following financial support for the research, authorship, and/or publication of this article: This study was supported by the National Natural Science Foundation of China (Grant No. 71971181) and the general project (No. JZX7Y20190242012401) funded by the National Defense Pre-Research Foundation of China.