
Abstract
Drawbacks of electrochemical machining can be conquered to a large extent with the introduction of electrochemical milling technique. In this method, a simple shaped tool follows a predetermined tool path and material gets removed atom-by-atom from anode workpiece by electrochemical reactions through layer-by-layer approach. Keeping in mind the rising trend of electrochemical milling technique, this research work focuses to investigate the impact of major process parameters of electrochemical milling, for example, feed rate and milling layer depth on foremost responses like material removal rate and width overcut during electrochemical milling of Nimonic-263 alloy. In this research work, three different types of featured tools have been utilized and for each tool, ANSYS simulation has been carried out for analysing their impact on machining accuracy. Furthermore, these obtained simulated results have been confirmed by experimentation. Finally, an attempt has been made to produce more accurate ‘L’-shaped features on Nimonic-263 alloy with the aid of tool rotation and inner-spraying featured tools. This study confirms that mixed electrolyte, that is, NaCl(1M) + NaNO3(1M), tool rotation with internal flushing, number of outlets and the structure of the end face of the tool generate excellent machining accuracy with super finished surface with Ra value in the order of 0.07–0.08 µm during electrochemical milling of Nimonic-263 alloy.
Keywords
Introduction
Day by day, more intricate-shaped products of high strength-to-weight ratio and temperature resistance materials like titanium, nickel and cobalt alloys are taking attention with the advancement of different fields, for example, defence, biomedical industry. Due to the excellent material properties, for example, resistant to corrosion, retaining higher strength at elevated temperature and excellent machinability, nickel and its different alloys are one of the best-known materials so far for those applications. These alloys can only be machined employing various non-traditional machining (NTM) processes, for example, electro-discharge machining (EDM), laser beam machining (LBM) and electrochemical machining (ECM). Tool wear, heat-affected zone (HAZ), enduring stresses and on occasion a few surface cracks in the workpiece are also present when machining with those thermal processes, that is, EDM and LBM but not with ECM. Contrast to the conventional sinking ECM process, in electrochemical (EC) milling, comparatively larger area can be milled using a simple geometric tool by controlling the tool as well as the job movement so; no extra effort is required to design a complex three-dimensional (3D)-shaped tool. Thus, EC milling is one of the most able non-contact type NTM processes where machining can be done by anodic dissolution with excellent surface finish. Here, material can be removed atom by atom from the anode workpiece without any tool wear, thermal and residual stresses.1,2
The mechanism of material removal of EC milling is alike to the conventional ECM process which is very much proficient to machine any type of 3D-shaped features, contour profiles with precision by a simple shaped tool on any electrically conducting material without depending on their mechanical properties. 3 Researchers had already studied the influence of two important process parameters, for example, feed rate and frequency on the different machining performances, for example, width overcut (WOC), machining depth, side angle, corner radius and surface roughness during fabrication of ‘L’-shaped features on Ti6Al4V by EC milling using three different combinations of electrolytes. 4 During EC dissolution of mild steel using NaNO3 solution, influence of the breakdown time of a passive film had been investigated. Based on the study, the process of formation and breakdown of the passive film had been studied at different current densities. 5 Researchers had also reported two types of methods for EC milling, one is the scanning machining layer-by-layer method and another is the sinking and milling method. In case of sinking and milling method, one slot is produced in a single pass and there is a chance of end deviation at the initial point; thus, in EC milling scanning layer-by-layer technique is the best choice. 6 Using sodium nitrate–based electrolyte and under direct current (DC) voltage source, researchers had produced an intricate-shaped products by EC milling process in the macro domain. 7 Experiments on cylindrical and flat surfaces using ball end tool electrode had already been performed. 8 In jet EC milling by adjusting the jet shape, stray corrosion on the edge was reduced considerably. Based on the investigations, a deep groove of 1.208 mm with a sharp edge and smooth surface was fabricated on Inconel 718 plate through multiple-pass EC milling process. 9 Researchers had reported EC milling on Inconel-718 with flow channel structure for rotating tool with a dead-end tube where some electrolyte outlets were located in the side wall of the electrode. Experiments showed that the material removal rate (MRR), quality of the surface and the consistency of the machining gap were significantly improved with an increased feed rate. Researchers concluded that by the flow field analysis, the number of electrolyte outlets could be determined sensibly good with the aim of more uniformly distribution of the electrolyte flow. 10 To improve the machining efficiency, different structures had been successfully machined on TB6 by thin hollow cathodes. In this study, flow field had been designed numerically by fluid dynamics to optimize the cathode structure, and therefore, experiments had also been carried out to prove the correctness of the numerical analysis. 11 In EC milling, a mathematical model had been developed by the researchers to predict the volumetric material removal for generation of various complex shapes on Ti6Al4V followed by experimental verification. 12 Researchers had also reported cathode design in ECM mathematically by optimizing the design plane based on the 3D potential distribution in the inter-electrode gap (IEG) followed by simulating the formation of blade leading edge using ANSYS. 13 During generation of stepped profiles by EC milling of Ti6Al4V, optimization of the five most important process parameters had been done using Taguchi and grey relation analysis (GRA) on five different performance characteristics. 14 During EC milling, experiments had also been performed on Nimonic-263 alloy to study the influence of feed rate, milling layer depth (MLD) and tool rotation on the responses like machining depth, side angle, surface roughness and quality of the machined profile. 15 In micro-EC milling, experiments had been carried out on GH3030 plate and in situ cylindrical electrode was fabricated utilizing EC etching process. Effects of machining parameters on the side gap variation had been studied experimentally followed by fabrication of some two-dimensional (2D) as well as 3D complex micro-structures with the dimension of several 10 μm. 16
Hence, from the literature survey, it can be stated that till date very few studies have been carried out in EC milling. Therefore, it is the time to explore the potential use of EC milling technique not only to understand the rising trend of EC milling but also to generate accurate 3D shaped profiles on high-strength temperature-resistant (HSTR) nickel alloys. Therefore, with the development of an indigenous EC milling setup, this article intends to look into the impact of major process parameters, for example, feed rate and MLD on various responses, for example, MRR and WOC by EC milling process on Nimonic-263 alloy. A comparison has also been made with and without tool rotation and the corresponding effects of tool rotation on those responses of EC milling have been presented. For three different types of featured tools, ANSYS simulation has been carried out to analyse the influence of electrolyte flow pattern on the accuracy of the EC milled profiles. Finally, an attempt has been made to produce more accurate profiles on a Nimonic-263 alloy with aid of tool rotation and inner-spraying featured tools. At first to analyse the influence of electrolyte flow pattern on the accuracy of the EC milled profiles in the next section, ANSYS simulation has been carried out for three different types of featured tools.
Simulation of electrolyte flow pattern of different featured tools
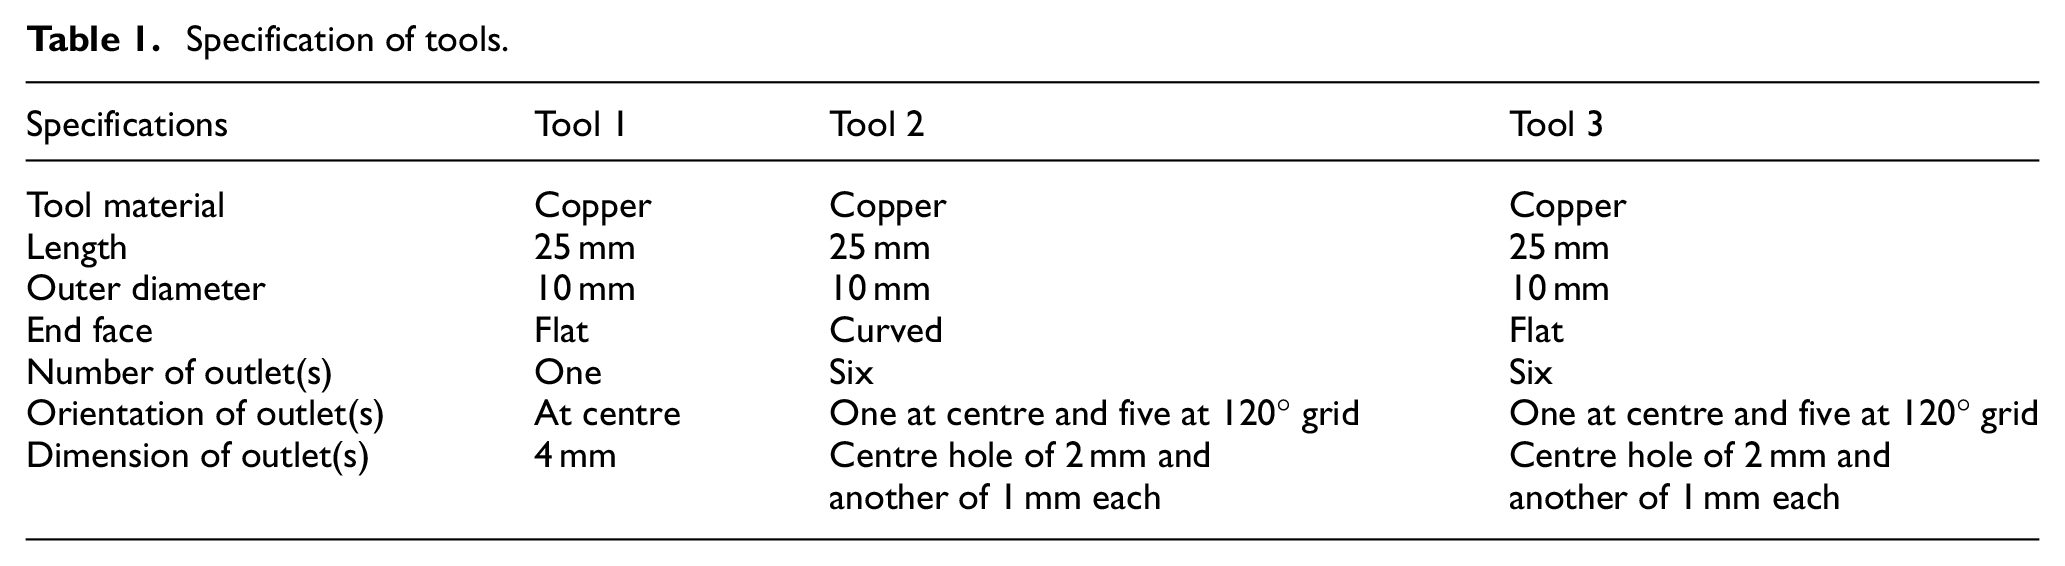
In this section, simulation of electrolyte flow pattern for three different featured tools has been done by computational fluid dynamics (CFD) technique utilizing ANSYS FLUENT. From the literature review, it can be understood that the structure of the tool tip and the pattern of the electrolyte outlets have more influence on the distribution of the electrolyte flow which is again related to removal rate and the accuracy of the machined profile. 10 Therefore, in this experiment, three different types of featured tools have been fabricated with different patterns of hole at the end surface of the tool which has been shown in Figure 1. As shown in Figure 1, Tool 1, Tool 2 and Tool 3 are having same dimension, that is, 10 mm in outer diameter and 25 mm in length which has been made of pure copper but the dimensions, centre distance, number of outlets and end surface are different. The detail specifications of the copper tools have been listed in Table 1.
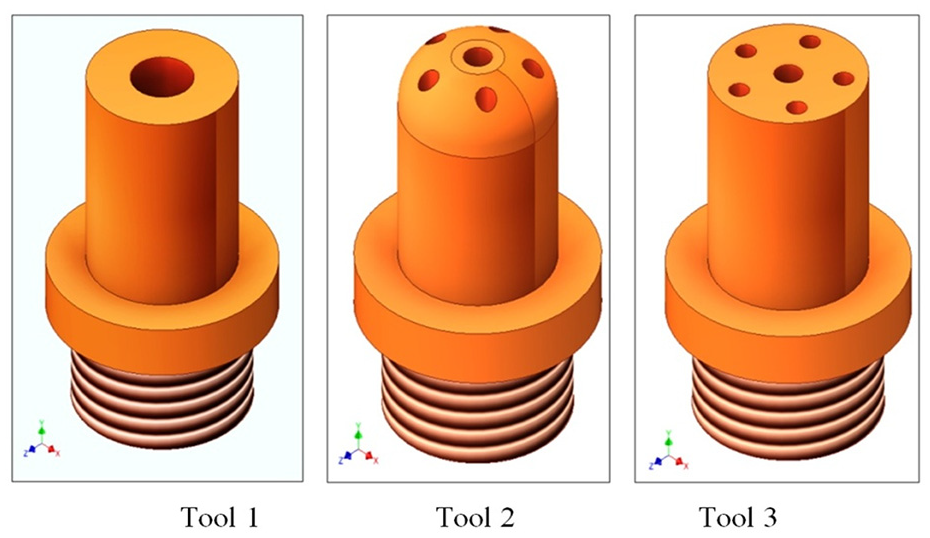
Different types of featured tools.
Specification of tools.
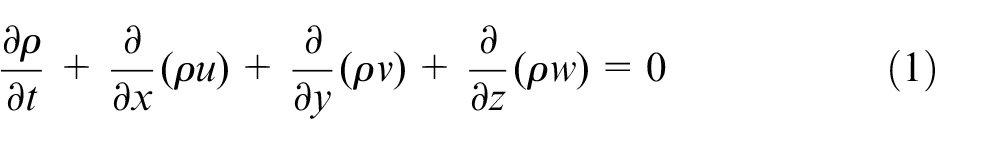
In ANSYS, flow field is described using a turbulent two-phase flow field model with the phase field interface. The interface of these two phases is governed by continuity equation and momentum equation and solved by ANSYS with finite element method. Continuity equation for conservation of mass describes the mass of fluid enters in a certain volume remains same at the exit of that certain volume. In 3D Cartesian coordinates, the continuity equation can be written in differential form as
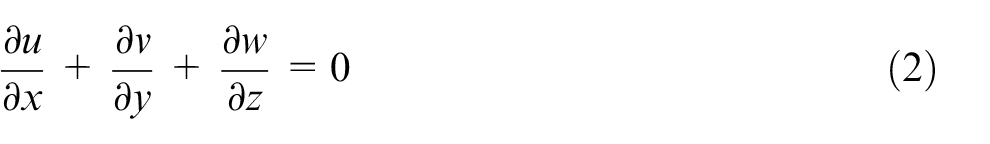
However, for incompressible fluid flow, this equation can be reduced to
Momentum equation tells about the balance of pressure forces and the viscous forces that act on the fluid. This momentum equation is often called as the Navier–Stokes equation. This is a commonly used mathematical equation to describe fluid flow. In 3D Cartesian coordinate, the governing Navier–Stokes equation for incompressible fluid flow can be written as
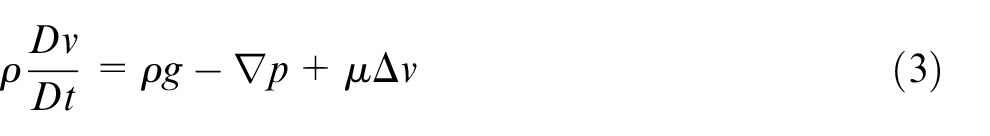
where v = (u, v, w) is the velocity flow field in x, y and z directions; Δ is the Laplacian operator; ρ and µ are the density and dynamic viscosity of the fluid, respectively; g is the acceleration due to gravity. The Navier–Stokes equation has been decomposed by ANSYS with the help of above-mentioned equations.
In the practical scenario of this study, fluid passes through a small gap in between tube, that is, tool and the solid interface, that is, workpiece; thus, streamline of the fluid is fully turbulent rather than laminar. Therefore, for better prediction of the outlet velocity, standard k-–ε model has been adopted. Only assumption in the derivation of the k–ε model is that the flow is fully turbulent when the effects of molecular viscosity are negligible. The standard k–ε model is therefore valid only for fully turbulent flows. The turbulent or eddy viscosity, μt, is computed by combining k and ε as follows
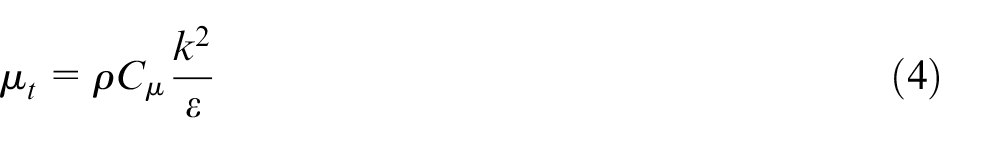
where ρ is the density of the fluid, k is the turbulence kinetic energy, ε is its dissipation rate and Cμ is a constant which is empirically set to a value of 0.09 for better approximation.
In this study, fluid flow patterns at the outlet for three different featured tools have been studied by CFD analysis utilizing ANSYS FLUENT R19.1. Actual data have been used for the boundary as well as initial conditions of this flow analysis as listed in Table 2. Geometry has been drawn in the software exactly as it has been already depicted in Figure 1. For this simulation, all the real situation, for example, dimension and materials of the tools, initial gap, that is, IEG, fluid properties, inlet velocity, actual boundary conditions and all the solid–fluid interfaces have been considered; however, in the mesh analysis, only the fluid domain has been shown.
Process parameters.
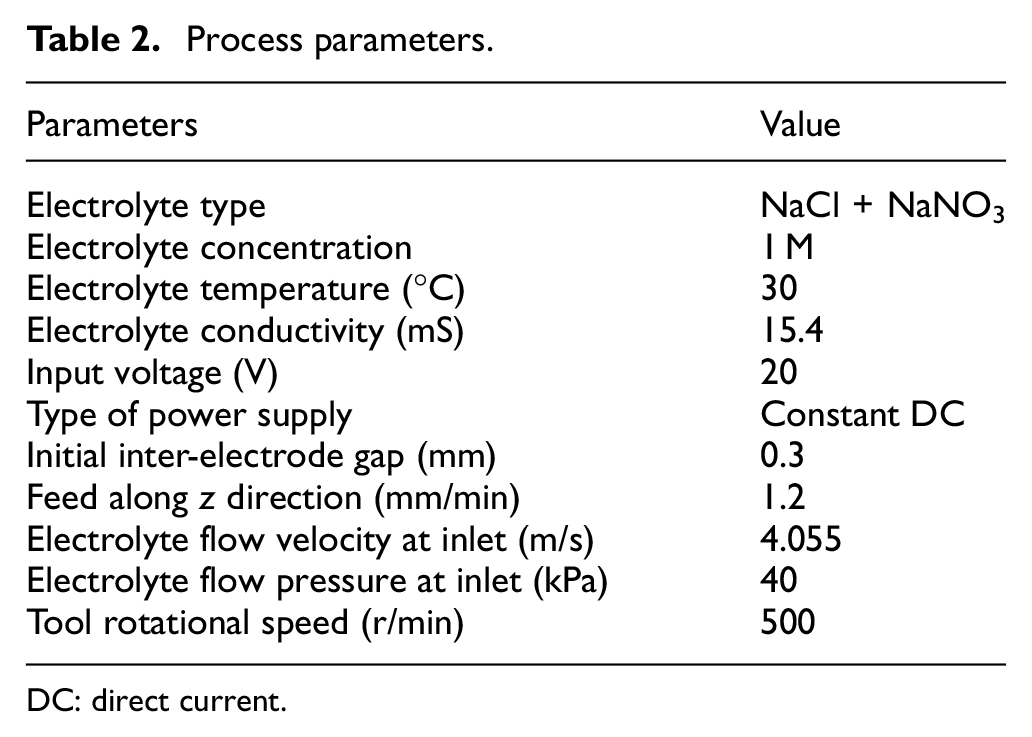
DC: direct current.
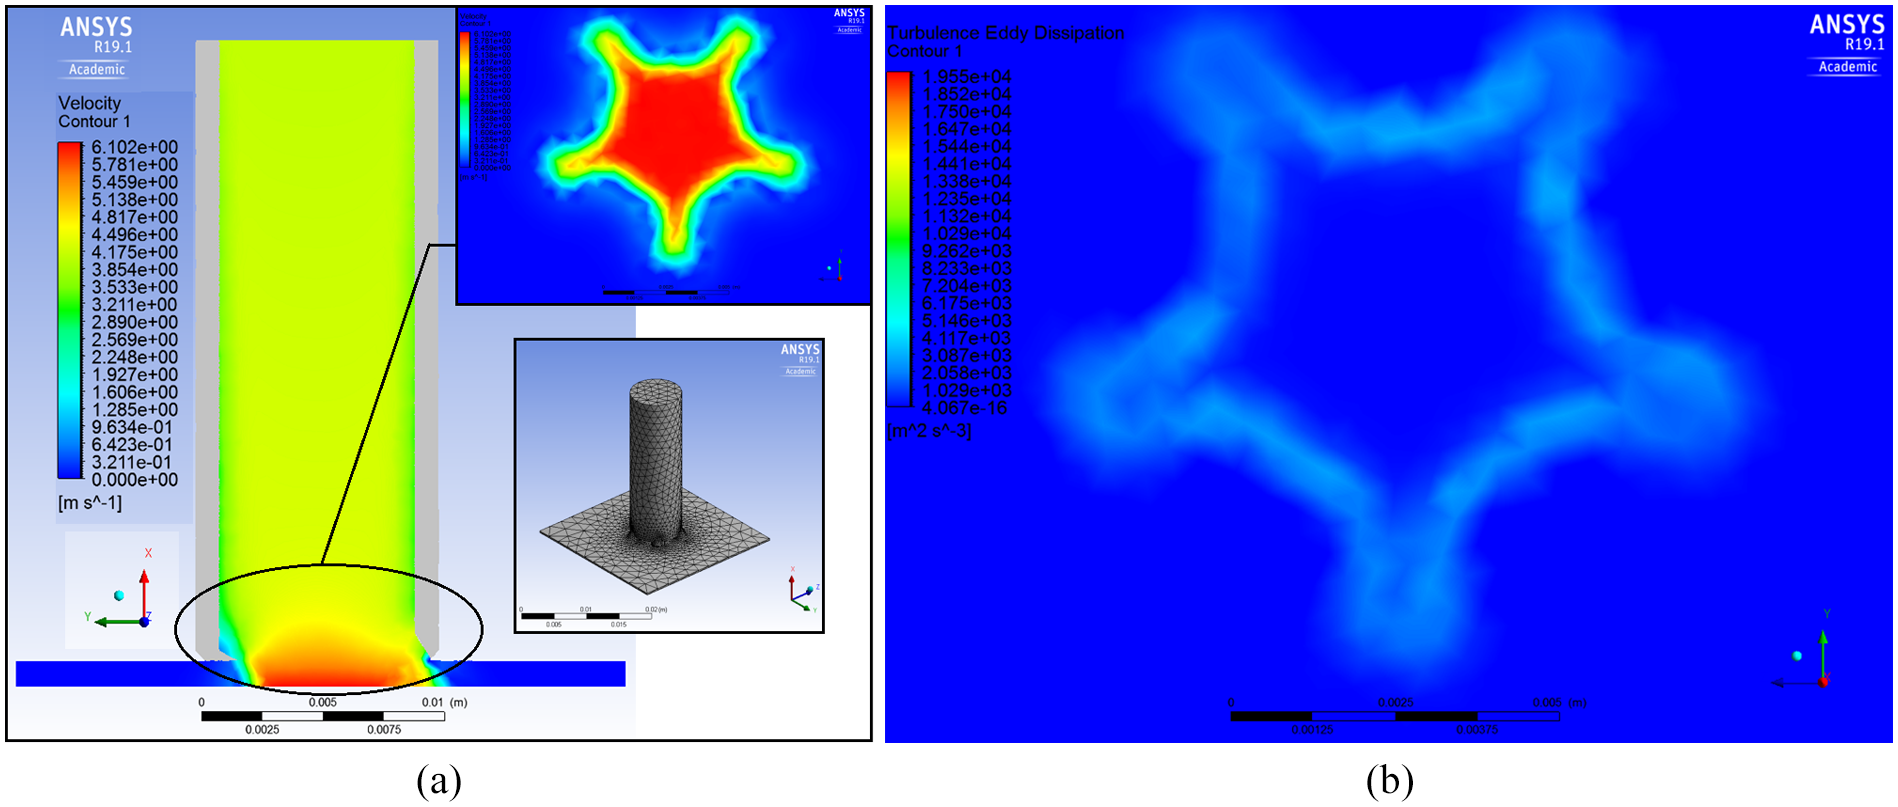
Figure 2 depicts the cross-sectional view of velocity contour at electrolyte domain, velocity contour at outlet, meshing for fluid domain and the contour of turbulence eddy dissipation when fluid passes through Tool 1. Sectional view has been taken at a plane which is in the middle of the fluid domain and parallel to the x-axis. The isometric view of the tools has been depicted in Figure 1 and already discussed about the detail geometrical features of the tools. It has been observed from Figure 2(a) that the velocity has been increased and more concentrated at the outlet compared to the inlet. The velocity at the inlet is 4.055 m/s whereas at the outlet it is 4.614 m/s. It also depicts the meshing of the interfaces before post processing. In the figure, coarser meshing has been shown for a better understanding of the mesh changing region at the outlet; however, for the analysis, very fine meshing has been done. Size of the each element is 4 × 10⁻⁶ m. In Figure 2(b), contour of turbulence eddy dissipation has been shown. In this research work, fluid needs to be passed through a narrow gap in between tool and the workpiece at the rotating condition of the tool; thus; in the pipe, due to high pressure, turbulence of fluid has been created and observed as a back flow.
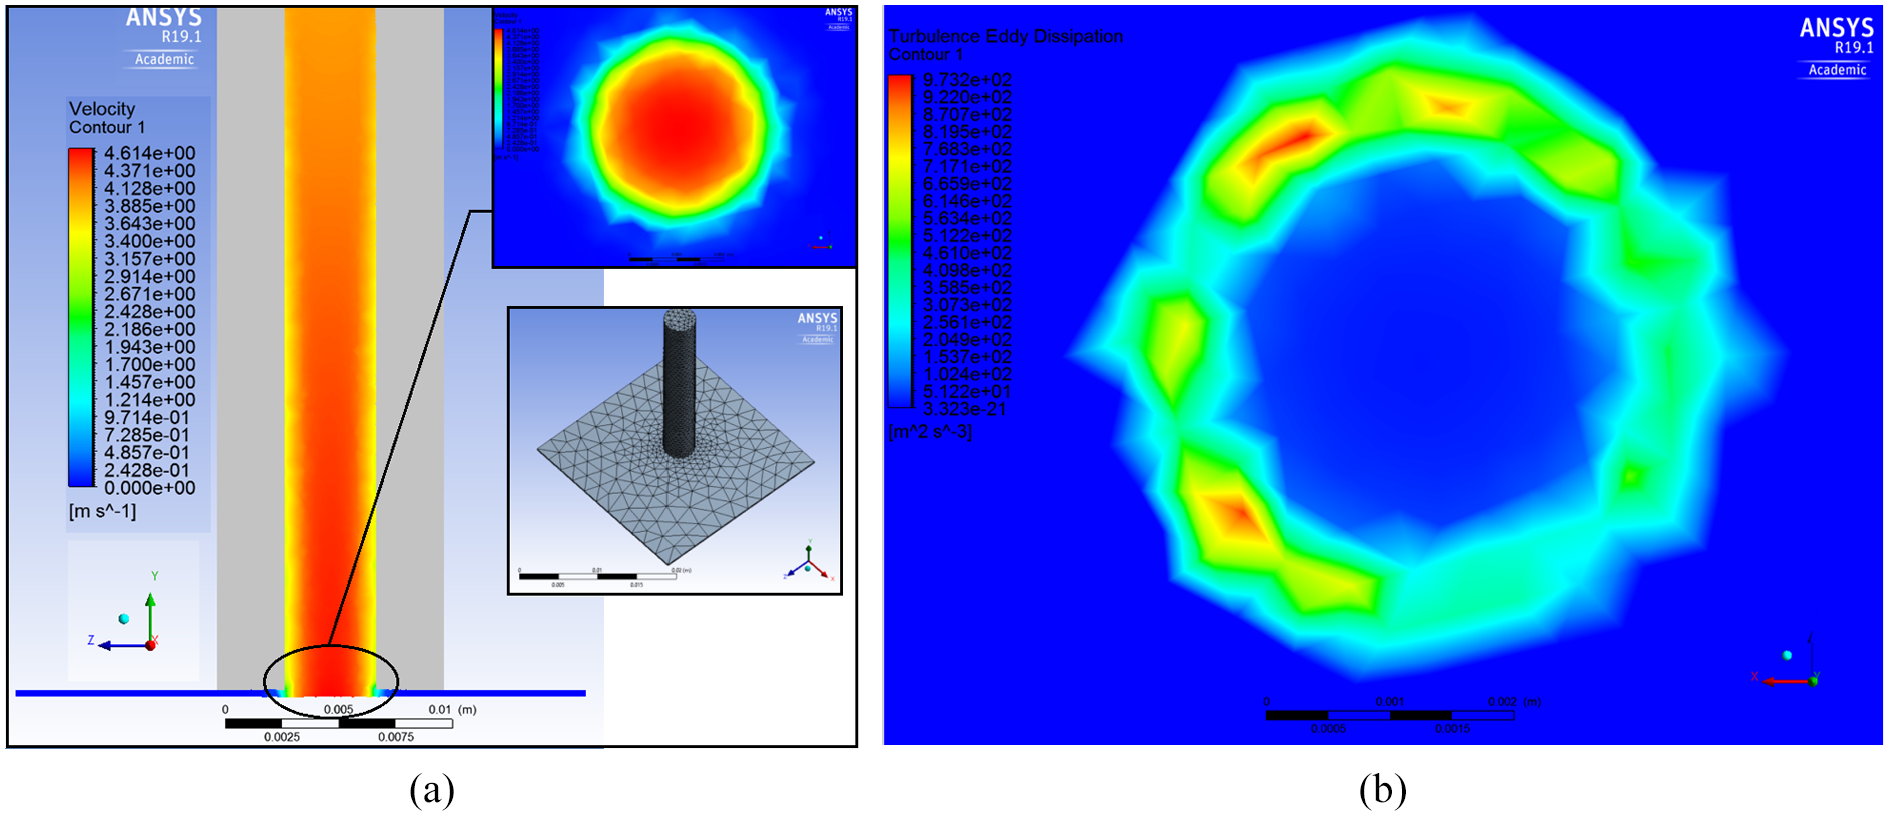
CFD analysis for Tool 1: (a) cross-sectional view of velocity contour with velocity contour at outlet with meshing for fluid domain and (b) contour of turbulence eddy dissipation.
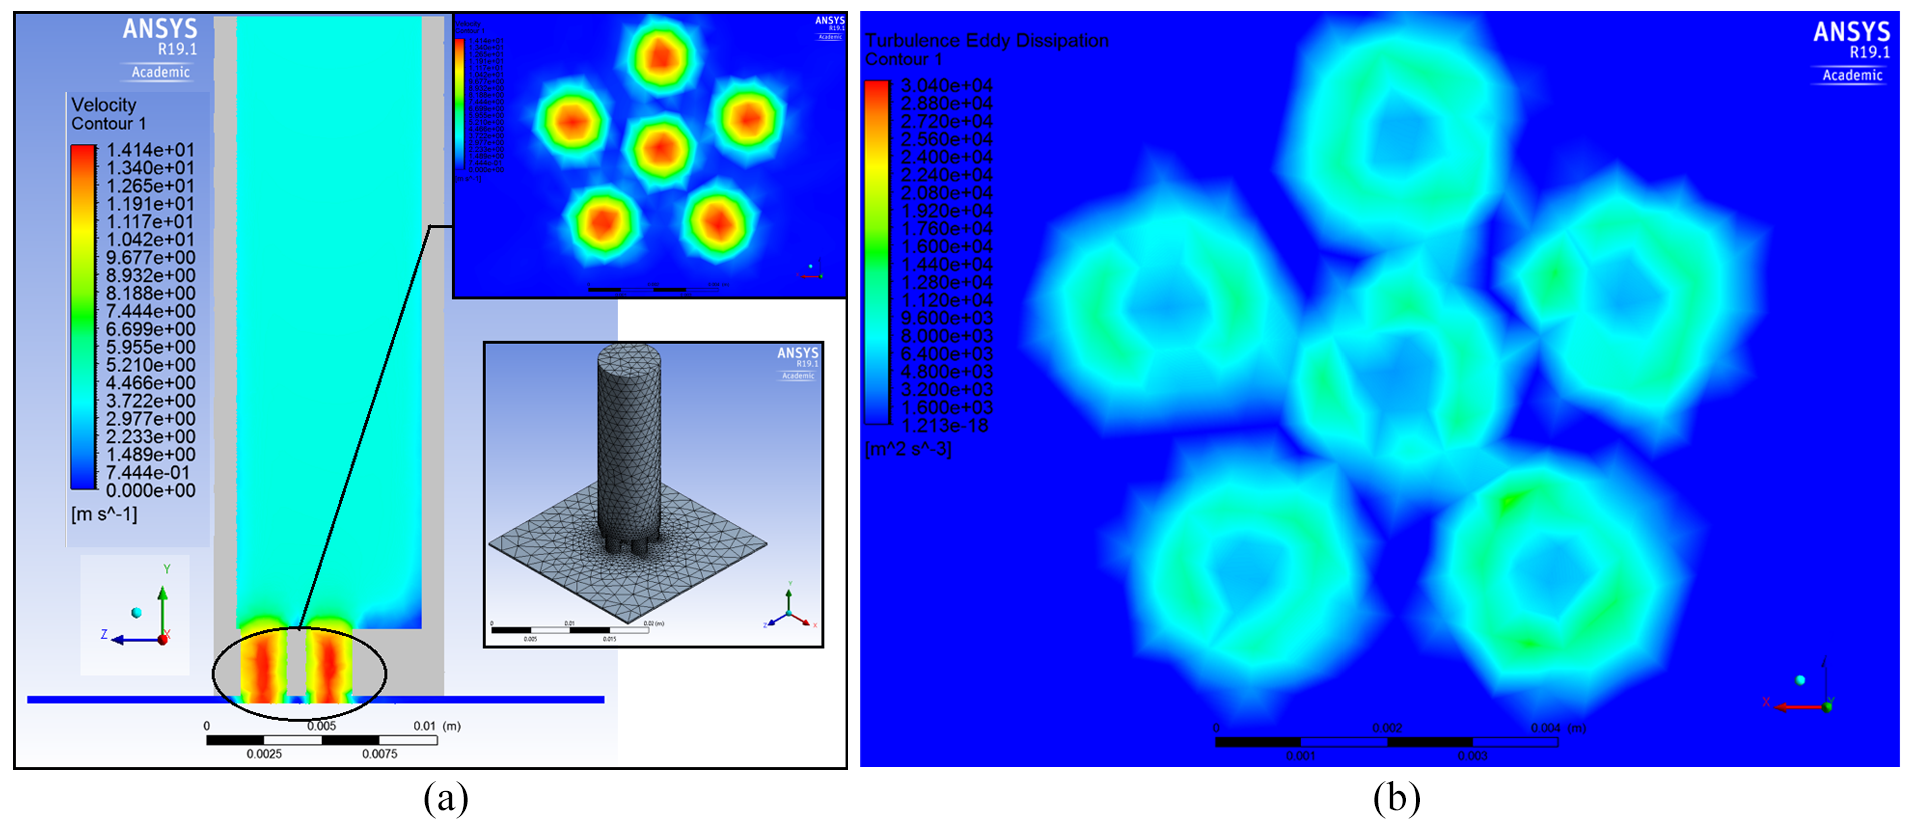
As the diameter decreases and the number of outlets increases, velocity has been increased, as shown in Figure 3(a). As shown in Figure 1, the number of the outlet of Tool 2 is more, that is, 5, than that of Tool 1. CFD analysis for Tool 2 indicates the increment of the velocity at the outlet region, that is, 6.102 m/s with compare to Tool 1, that is, 4.614 m/s, whereas inlet velocity at the inlet was same, that is, 4.055 m/s. It has also been observed that due to the non-flat surface of Tool 2, contact region of the solid and fluid has also been increased and thus, in the outlet velocity contour, no individual sign of the outlets has been observed. Due to the increment of contact region of the solid and fluid, divergence of the fluid has been increased which may lead to more overcut at the machining zone. From Figure 3(b), it has also been noted that the magnitude of the turbulence eddy dissipation has been increased with compare to Tool 1, that means, chances of stay of liquid at the vicinity of the outlet–workpiece interface have been decreased.
CFD analysis for Tool 2: (a) cross-sectional view of velocity contour with velocity contour at outlet and meshing for fluid domain and (b) turbulence eddy dissipation.
Similarly, Figure 4 depicts the cross-sectional view of velocity contour, velocity contour at outlet, meshing for fluid domain and the contour of turbulence eddy dissipation during CFD analysis of Tool 3.
CFD analysis for Tool 3: (a) cross-sectional view of velocity contour with velocity contour at outlet and meshing for fluid domain and (b) turbulence eddy dissipation.
In spite of being the same number of outlets, the velocity has been noticeably increased, that is, 14.14 m/s with compare to Tool 1, that is, 4.614 m/s and Tool 2, that is, 6.102 m/s in spite of keeping same inlet velocity at the inlet, that is, 4.055 m/s as shown in Figure 4(a). It may be due to the difference in end surface of the tools which leads to higher magnitude of turbulence eddy dissipation at the outlets as depicted in Figure 4(b). From the figure, it has also been observed that at the velocity contour of outlet, individual sign of the outlets has been observed due to the flat end surface of Tool 3. As the contact region of the solid and fluid has been decreased due to the flat surface of Tool 3, divergence of the fluid has been decreased, which may lead to less overcut at the machining zone.
From Figure 4(b), it has also been noted that the magnitude of the turbulence eddy dissipation has been increased with compare to Tool 1 and Tool 2, leads to decrement of stay of liquid at the vicinity of the outlet–workpiece interface. From the ANSYS simulation for three different featured tools, it can be understood that three unlike featured tools have different impacts on the machining zone which has been verified by experimentation and in-depth discussions have been made in the following section.
Experimental planning
For carrying out this research work, a flexible EC milling setup has been developed indigenously which allows fabricating any complex profiles irrespective of any materials and its mechanical properties. Design, development and fabrication of such versatile setup in-house are very much challenging due to incorporation of internal flushing, current and rotation to the tool simultaneously. The developed set-up consists of several subunits, for example, mechanical machine unit, power supply unit, electrolyte supply system and control unit. Among all these subunits, fabrication of electrolyte supply system is one of the toughest challenges due to its complexity. Considering all these constraints and keeping challenges of EC milling in mind, an XYZ-CNC controlled EC milling set-up has been designed and indigenously developed, as shown in Figure 5. During all the experimentation in EC milling, a DOPF 20V-100A DC power supply made by Matsusada Inc., Japan has been used.
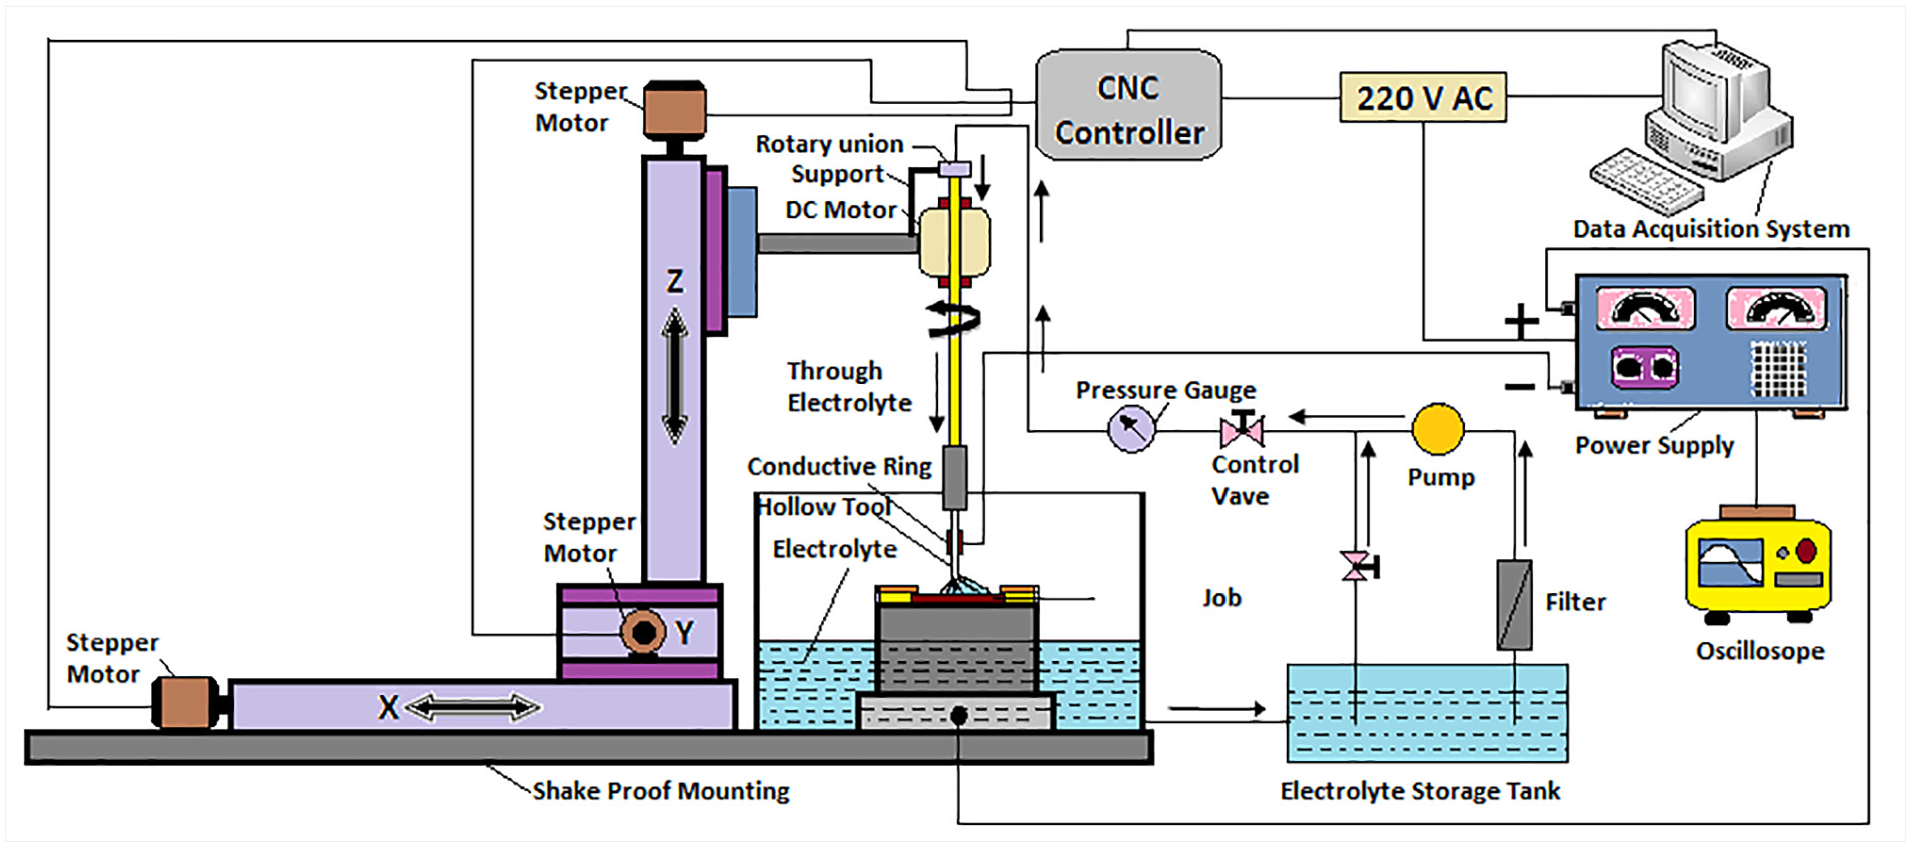
Schematic representation of in-house developed EC milling setup.
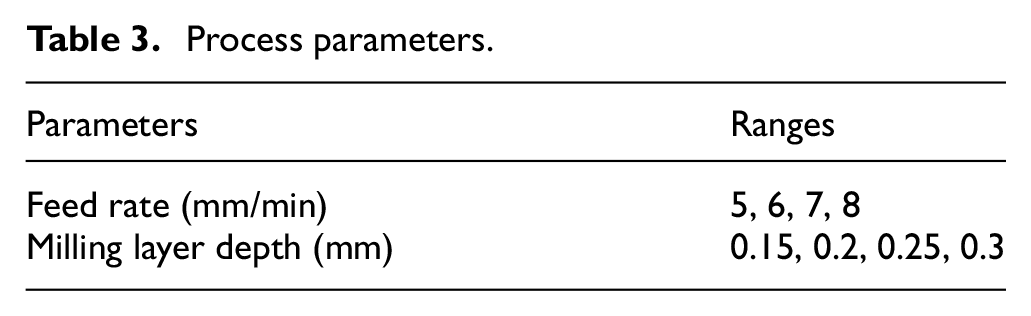
In this research work, two most significant process parameters of EC milling have been selected. One is tool feed rate and another is MLD and experiments have been performed by ‘one factor at a time method’. In EC milling, tool feed rate is defined by the velocity of the tool at which it moves over the workpiece and expressed in millimetre per minute. MLD is the depth which is given to the tool after completion of each pass to achieve the desired depth, expressed in millimetre. Pilot experiments have been conducted at different tool feed rates and MLD to produce grooves on the workpiece and range of the taken parameters has been chosen carefully. It has been stated in the authors’ former research work that EC milling of Nimonic-263 alloy using NaCl (1M) and NaNO3 (1M) mixed electrolyte generated excellent surface finish in the order of 0.06–0.08 μm; 15 thus, for this study, same electrolyte has been utilized. Fixed process parameters have been kept constant as listed in Table 2 and variable process parameters have been listed in Table 3. It is worth to mention that during all the experimentation, Tool 1 has been utilized as it seems to be a conventional inner-spraying tool and it has the same impact with compare to other two types of tools as far as measured responses of EC milling have been concerned and as observed from the pilot experiments. However, this tool has limitations on the accuracy and quality of the machined surface which can be eliminated by the other type of featured tool and these have been discussed in details in the following section.
Process parameters.
Experiments have been performed on a special type of nickel-based (nickel–cobalt–chromium–molybdenum) superalloy, that is, Nimonic-263 alloy to identify the impact of process parameters on the various responses of EC milling. This alloy is ideal for aircraft parts and gas turbine components for instance, where the pressure and heat are extreme, for example, turbine blades and exhaust nozzles of jet engines. In this study, milling of a simple slot with length of 30 mm and depth of 1.2 mm has been fabricated on Nimonic-263 alloy. To study the effect of rotation on the various responses, experiments have been repeated at the same set of parameter settings with the incorporation of tool rotation. In this experiment, MRR is calculated simply by the weight difference of the workpiece before and after machining divided by the time taken for that particular machining. It is expressed in the following equation
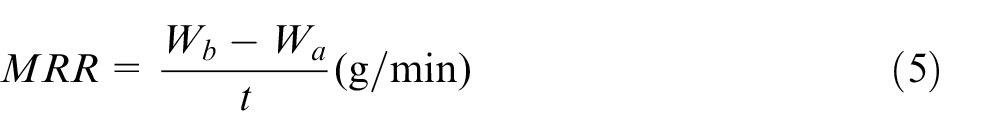
where Wb is the weight of the workpiece before machining, Wa is the weight of the workpiece after machining and t is the time taken for that particular machining. Figure 6 represents schematic of the EC milling technique with WOC.
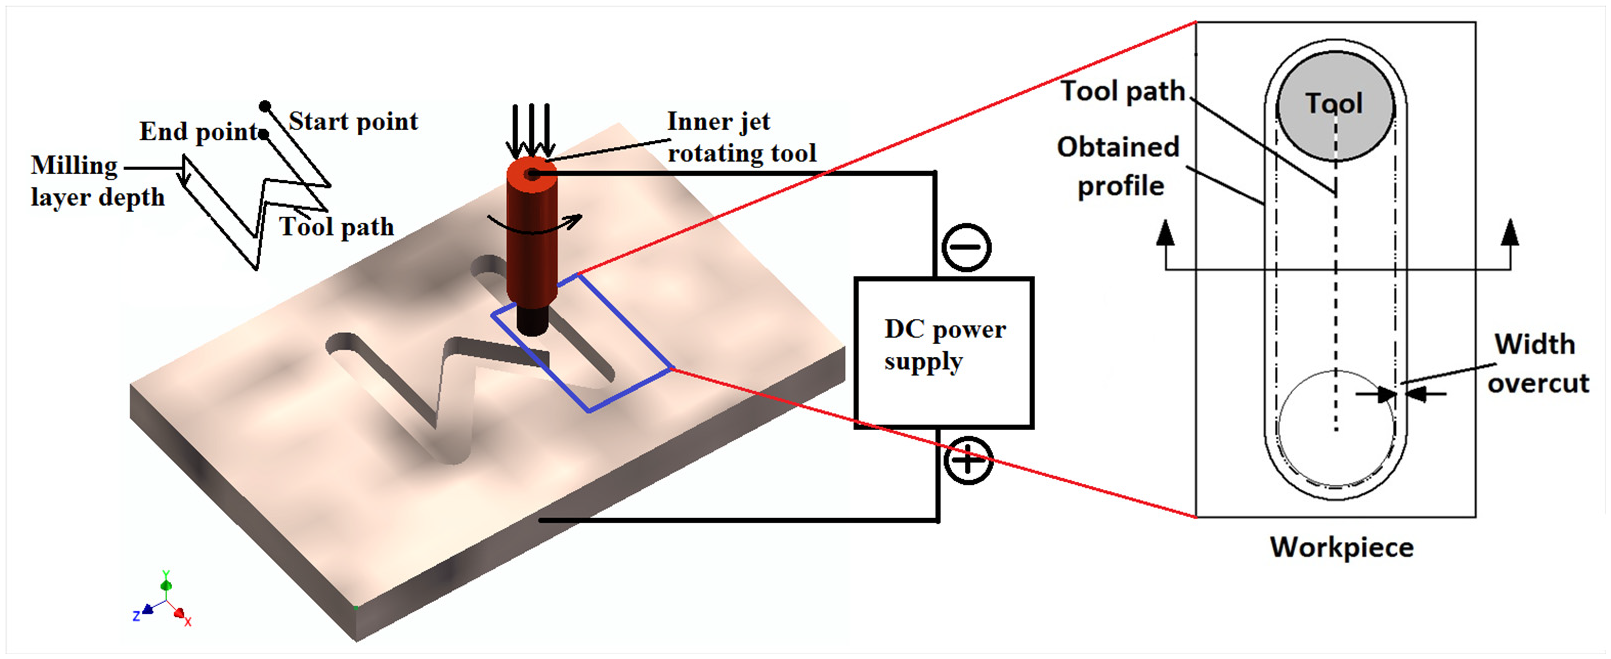
Schematic representation of the EC milling technique with width overcut.
Equation (6) is used for calculating WOC where b is the obtained width of machining zone and d is the diameter of the tool as follows
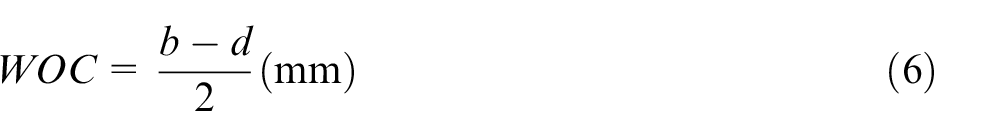
To evaluate the quality of the fabricated machined profile, that is, overcut, a contour scope (CONTRACER-CV-3200; Mitutoyo, Japan) has been used. Lieca DM-2500 optical measuring microscope has been utilized for imaging and measuring different features of the machined profiles. All the responses have been taken from the average of three samples on the same machining condition and the error graph has been plotted accordingly.
Results and discussion
Influence of feed rate and MLD with tool rotation on MRR
For any kind of machining operation, MRR is an important response because it directly reflects the production cost of a particular product. It is well known fact that MRR is inversely proportional to the time taken for machining, so higher the MRR, lower the time taken for that particular machining. In EC milling, MRR is mostly influenced by two process parameters, that is, MLD and feed rate; however, tool rotation has also major impact on MRR. Figure 7(a) depicts the influence of MLD on MRR with a comparison between machining with and without rotation of tool. From the figure, it can be seen that MRR has been improved with the increment of MLD. As mentioned, MLD is the depth which is given to the tool after completing each pass to achieve a desired final depth which means, if the MLD increases, the total number of required passes decreases to achieve a desired final depth that directly leads to shorten the machining time and increment of MRR.
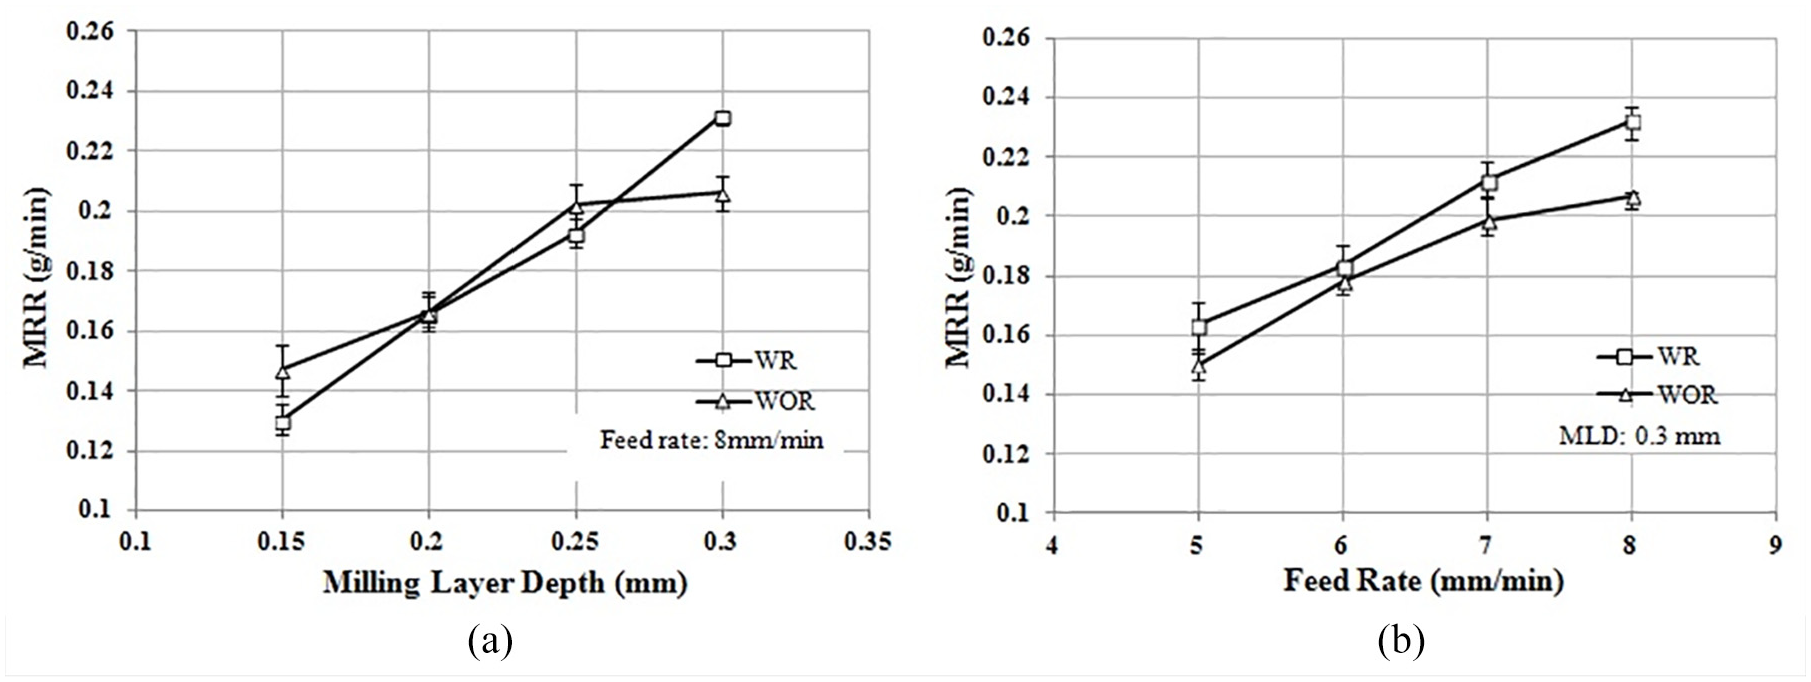
Effect of (a) milling layer depth and (b) feed rate on MRR.
From Figure 7(a), it can also be observed that with the incorporation of tool rotation, MRR has not been improved up to a certain level. From 0.15 to 0.25 mm of MLD, tool rotation has no positive impact on MRR but beyond that value MRR increases. With the aid of tool rotation, effective sludge removal is possible due to the high radial outward force of electrolyte and supply of fresh electrolyte at every instantaneous machining zone leading to higher removal of materials. At a constant feed rate, higher MLD means more amount of material needs to get removed at a single pass and as time progresses, IEG has been reduced which leads to increment of pressure of the dielectric fluid as well as current density. At higher MLD with tool rotation, higher current density, high pressure and high radial outward force of the electrolyte enhance the flushing ability considerably which leads to increment of the MRR.
In EC milling, feed rate is defined by the velocity of the tool at which it moves over the workpiece. As the feed rate increases, time taken for completing each pass decreases which directly improves the MRR which can be observed from Figure 7(b). This figure also reveals that with all the values of feed rate, implementation of tool rotation gives higher MRR than that without tool rotation. This happens because when feed rates have been studied, MLD has been kept constant at its maximum value of 0.3 mm, and MRR has been found to be higher as compared to that with no tool rotation condition. This trend has been followed for all the values of feed rate. In this study, highest MRR, that is, 0.23207 g/min, has been achieved at 0.3 mm of MLD and feed rate of 8 mm/min with tool rotation condition.
Impact of feed rate and MLD with tool rotation on WOC
In ECM, WOC occurs due to the stray current. Figure 8(a) shows that overcut has been continuously dropped off with the increment of feed rate keeping the MLD constant at 0.3 mm. The reason behind this is with the increment of feed rate, unit area of the workpiece reacts with the tool for a shorter duration so total amount of material removed decreases which leads to decrement of overcut. From Figure 8(b), it is also cleared that overcut has been varied significantly for varying MLD when feed rate has been fixed at 8 mm/min following almost same trend as in the case of feed rate. The reason behind that is with the increment of MLD, more material needs to be removed in a single pass, which leads to decrement of total machining time. As the MLD increases, total number of passes to achieve the desired depth decreases which results in decrement of total machining time as well as total interaction time in between tool and the workpiece.
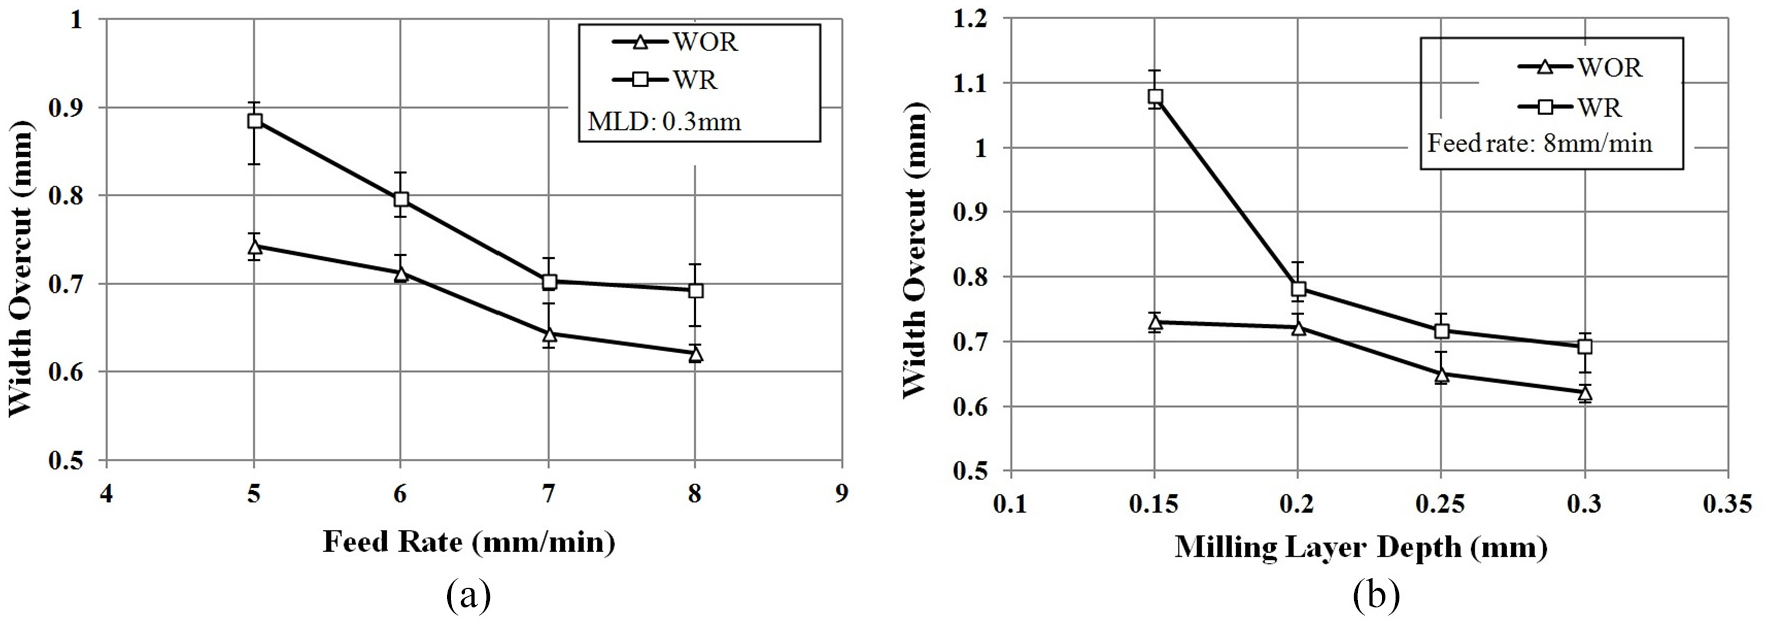
Effect of (a) feed rate and (b) milling layer depth on width overcut.
From Figure 8(a) and (b), it has also been observed that the value of WOC is smaller in case of without tool rotation compared to tool rotation. The electrolyte present in the neighbour of the machining zone and current flux concentration is mainly responsible for stray current effect which leads to machining in the undesired zone. Availability of excess amount of electrolyte at the surrounding of the machining zone and higher current flux associated with rotating tool always results in higher over cut than stationary tool. Due to the in-house development of the rotational unit of the setup, centre of the tool tip is little bit eccentric from its axis of rotation, which may be another reason of the slight increment of WOC in case of tool rotation. Lowest value of WOC, that is, 0.62128 mm, has been achieved at 8 mm/min feed and MLD of 0.3 mm without any rotation of the tool. From the figure, it has also been observed that at 8 mm/min of feed and 0.3 mm of MLD with tool rotation, the variation of WOC is very little (about 90 micron). It is also worth to mention that EC milling without any tool rotation produces some unwanted impressions of the flow lines at the machined surface which deteriorates the quality of machined surface. 15 For this reason for further study, that is, improvement of accuracy of the machined profile with different featured tools, 8 mm/min feed rate and MLD of 0.3 mm with rotation of the tool has been kept constant.
Influence of different types of featured tools on quality of the machined profiles
From the ANSYS simulation, it has also been observed that number of outlets and the geometry of the end face of the tool have great impact on the flow velocity and turbulence eddy dissipation of the electrolyte. The detail geometric features of these three tools have already been discussed. EC milled samples of Nimonic-263 with three different featured tools, that is, Tool 1, Tool 2 and Tool 3, has been shown in Figure 9. Using these tools, ‘L’-shaped features have been machined in order to detect better accuracy. In this study, machining has been done using the same electrolyte with the feed rate of 8 mm/min and with 0.3 mm of MLD with the rotating condition of the tool. It has been clearly seen that all three types of featured tools have generated three different types of profiles on Nimonic-263.
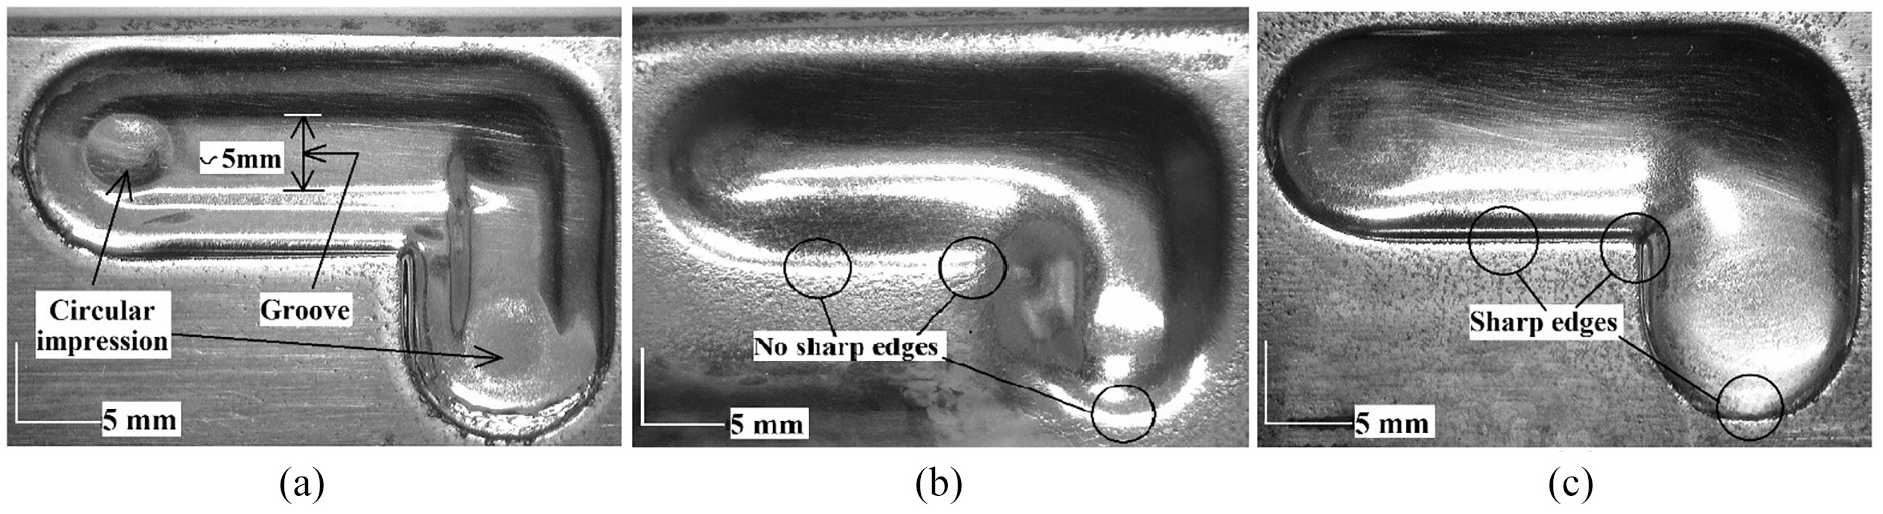
Fabricated EC milled profile on Nimonic-263 alloy: (a) with Tool 1, (b) with Tool 2 and (c) with Tool 3.
As Tool 1 is having 10 mm of outer diameter with 4 mm of inner hole and flat surface at the end so, after machining with this tool, a higher depth slot, that is, formation of groove of near about 5 mm width, has been observed at the middle with a circular impression at two extreme ends of the machined profile, as shown in Figure 9(a). From Figure 2(b), it has been seen that as the magnitude of the turbulence eddy dissipation for Tool 1 is least with compare to other tools so, stay of turbulent fluid at the vicinity of the outlet–workpiece is longer. Prolonged stay of this turbulent fluid is responsible for excess depth as well as some impression on the machined surface at the no tool rotation condition. From the CFD analysis for Tool 1, it could be stated that due to the concentric flow from one outlet, this excess depth could not be resolved as the direction of the concentric flow has not been changed even after tool rotation. Therefore, with the tool rotation, these flow lines could be removed but this excess depth could not be resolved even after tool rotation.
Tool 2 is having a curved surface at the end and five outlets are at the curved surface; thus, the distribution of the electrolyte and the current concentration at the side wall area is more comparable to the other tools as a results no sharp edge has been found at the edge of the EC milled profile as shown in Figure 9(b). Moreover, by CFD analysis of Tool 2 and from Figure 3(a) and (b), it has also been observed that due to the non-flat surface of Tool 2, contact region of the solid and fluid interface has also been increased. Due to the increment of a contact region of the solid–fluid interface, the divergence of the fluid has been increased which may also responsible for formation of no sharp edge at the machined profile. Due to the increment of outlets at the tooltip, effective removal of sludge can be possible which directly reflected the machined surface of the profile.
From Figure 3(a) and (b), it has been observed that the magnitude of the velocity as well as turbulence eddy dissipation for Tool 2 is more compared to Tool 1 leads to good removal of sludge and shorter stay of turbulent fluid at the vicinity of the outlet–workpiece. Thus, machining by Tool 2, quality of the machined profile has been improved with compare to Tool 1. But still, there is some limitation with the sharp edge. EC milling of Nimonic-263 with Tool 3 generates the best quality of the machined profile with great precision, as shown in Figure 9(c). The problem that has been encountered with Tool 1 is the undesired impressions with excess depth groove at the middle and Tool 2 is the issue with sharp edge could be overcome by Tool 3.
From the CFD analysis of Tool 3, it has also been observed that turbulence eddy dissipation at the outlet as well as the velocity has been noticeably increased as compared to Tool 1 and Tool 2, in spite of being same number of outlets as shown in Figure 4(a) and (b). This eliminates the undesired impressions by the effective removal of sludge and produces sharp edge of the machined profile. However, it has also been observed from the analysis that due to the flat end surface of Tool 3, the contact region of the solid and fluid has been decreased; thus, divergence of the fluid has been decreased, which may also lead to sharp edge at the machining zone. Therefore, with this tool, side angle and the corner radius have been improved considerably, as shown in Figure 9(c). From this study, it can be concluded that Tool 3 has high potential to machine the best quality profile with great precision as well as generates super finished surface.
Conclusions
This study confirms that EC milling of certain features, that is, ‘L’-shaped features, is feasible with tools of very simple geometry by the indigenously developed EC milling setup. However, the accuracy of the produced features depends on the end shape as well as number of outlets of the tool. After in-depth analysis of the obtained images, graphs as well as all the data, the following conclusions could be drawn:
Electrolyte flow patterns at the outlet for three different featured tools have been successfully studied by CFD technique utilizing ANSYS FLUENT. From the simulation results, the exact reasons behind the impacts of three different featured tools on the machining zone have been understood and addressed during EC milling of Nimonic-263.
Feed rate of 8 mm/min and MLD of 0.3 mm with tool rotation give highest value of MRR, that is, 0.23207 g/min. However, lowest value of WOC, that is, 0.62128 mm, has been achieved at same machining condition but without tool rotation. During EC milling of Nimonic-263 alloy, excellent surface finish in the order of 0.07–0.08 µm has been attained by employing mixed electrolyte, that is, NaCl(1M) and NaNO3(1M).
Profiles produced by EC milling without tool rotation generate some undesired impressions on the machined surface and can be eliminated by employing tool rotation. Therefore, considering all the images of machined samples, it can be concluded that EC milling of Nimonic-263 with tool rotation is more preferable as far as MRR, accuracy and the quality of the machined profiles are concerned.
From ANSYS-CFD simulation technique, it has been identified that during machining with Tool 3, higher turbulence eddy dissipation rate, lower divergence of the fluid as well as the higher magnitude of velocity has been achieved as compared to Tool 1 and Tool 2 due to five outlets at the flat-end surface.
Tool 3 is capable to eliminate the undesired impressions by effective removal of sludge which results in the generation of a machined profile with the sharp edge. Therefore, Tool 3 can be considered as the best featured tool which can be utilized for achieving better surface quality of the machined profiles with greater precision by EC milling operation.
The outcomes of this research work considering three different featured tools and rotation with internal flushing could be helpful for effective utilization of EC milling of Nimonic-263 alloy at macro-domain. The data of this research work could also be utilized in the area of EC milling in micro-domain. The above-mentioned findings can be utilized for machining of complex shapes on different HSTR materials that can be implemented for different modern manufacturing fields such as automobile, biomedical, defence, aeronautical.
Footnotes
Appendix 1
Declaration of conflicting interests
The author(s) declared no potential conflicts of interest with respect to the research, authorship, and/or publication of this article.
Funding
The author(s) disclosed receipt of the following financial support for the research, authorship, and/or publication of this article: This study was financially supported by the AR & DB, DRDO, New Delhi.