
Abstract
Dry machining represents an eco-friendly method that reduces the environmental impacts, saves energy costs, and protects operator health. This article presents a multi-response optimization which aims to enhance the power factor and decrease the energy consumption as well as the surface roughness for the dry machining of a stainless steel 304. The cutting speed (V), depth of cut (a), feed rate (f), and nose radius (r) were the processing conditions. The outputs of the optimization are the power factor, energy consumption, and surface roughness. The relationships between inputs and outputs were established using the radial basis function models. The experimental data were normalized, with the use of the Grey relational analysis. The principal component analysis is applied to calculate the weight values of technical responses. The desirability approach is used to observe the optimal values. The results showed that the technical outputs are primarily influenced by the feed rate and cutting speed. The reductions of energy consumption and surface roughness are approximately 34.85% and 57.65%, respectively, and the power factor improves around 28.83%, compared to the initial process parameter settings. The outcomes and findings of the investigated work can be used for further research in sustainable design and manufacturing as well as directly used in the knowledge-based and expert systems for dry milling applications in industrial practices.
Keywords
Introduction
In wet machining, liquid coolant is normally used to reduce the temperature of both workpiece and cutting tool, as well as to evacuate chips from the cutting area, with hundreds of thousands of gallons of coolant fluid used per year, causing a lot of money spent and poor environmental impacts. 1 The total cost of the lubrication accounts for 7%–17% of the cutting tool cost, and it is even greater than overhead and labor costs. 2 Fortunately, dry machining (DM) is becoming more prevalent, especially in milling, and it is considered as one of the eco-friendly machining processes, with good environmental impacts and cost-effectiveness. With the emerging trends of sustainable design and manufacturing, DM is considered as one of the green solutions to enforce environmental protection laws for occupational safety and health regulations; it is an effective solution for sustainable manufacturing, especially to help to minimize the use of lubricants that cause air and water pollutions.
The improvements in the technical parameters of DM processes have been considered by many researchers.3–5 Fundamentally, the technical outputs of a machining process, including the surface integrity, cutting temperature, and tool life, were improved by means of optimization of process parameters (or machining factors).6,7 Babu et al. 8 analyzed the surface roughness and vibration for the orthogonal milling. The temperature variations in the workpiece and cutting tool were explored for the DM of Inconel 718. 9 The surface integrity was improved for milling processes of the Al-Zn-Mg-Cu alloy, 10 aluminum, 11 Ti-6Al-4V alloy, 12 and the hard turning of AISI 52100. 13 The Grey relational analysis (GRA) was applied to achieve optimum inputs that maximize the surface properties, energy criteria, and production rate. 14 Krolczyk et al. 15 found that a longer tool life can be obtained under dry cutting compared to the lubricant condition. In addition, Baowan et al. 16 revealed that the surface roughness and tool life were significantly influenced by the cutting angle and tools. Pham et al. 17 stated that the tool-chip contact length, the workpiece vibration, and the surface roughness were increased with increasing cutting depth and feed rate for the dry milling of A6061 aluminum alloy. Jahan et al. 18 concluded that the mid-level of the feed and depth of cut could be used to decrease the tool wear and surface roughness in the milling of polycarbonates. Mia and Dhar 19 emphasized that specific cutting energy was influenced favorably by the increase in cutting speed.
Recently, the trade-off between energy consumption (EC), surface integrity, and productivity has been explored in the works of literature. As part of trade-off among responses, Kant and Sangwan 20 conducted multi-response optimization for the face milling of steel to attain improved surface quality, material removal quantity, and cutting energy. From conventional statistics-based approaches to advanced neural and evolutionary algorithms are continually used for computation of the best trade-off. For instance, Mia et al. 21 performed intelligent optimization of the machining process from the perspective of smart manufacturing. On the other side, the response surface methodology (RSM) was applied to analyze the impacts of input process parameters on EC, 22 power consumption, cutting force, and surface roughness. 23 Similarly, the multi-objective optimizations were performed in order to minimize the EC in the dry turning of stainless steel. 24 Zhang et al. 25 proposed the relations between the process parameters on the total processing time, specific EC, and carbon emissions. Song et al. 26 developed a new model to predict the machining forces in multi-axis milling. The impacts of the process parameters on the machining energy for the micro-milling composites were analyzed by Kuram. 27 The stress field distribution on a cutter in the milling of titanium alloy was analyzed based on the empirical models of the milling force and the contact area between the cutter and the chip. 28 As a result, various approximation methods and optimizing techniques were used to render the relationship between the processing conditions and output criteria and to find the optimum process parameter. The different performances measured were optimized and improved by means of the optimum factors. However, the drawbacks of the published works can be listed as below.
The output response parameters of the machining process such as the EC, cutting forces, quality of the machined part, and tool life were widely considered in the published works. Practically, the power factor (PF; the ratio of the active power consumption and the apparent power) is necessary to be considered as an important technical parameter for maximizing energy efficiency.
The stainless steels are widely used for manufacturing components used in the automotive and aerospace industry as well as in medical sector.29,30 Unfortunately, it is difficult to machine this material due to work hardening, high surface roughness, high tool wear, and low production rate. Furthermore, machining stainless steel requires higher EC because of low thermal conductivity and high heat capacity. Therefore, it is necessary and important to develop optimization models to support the decision-making process and predicting the values of the PF, EC, and surface roughness (Ra) for DM applications.
As a result, a few studies have focused on the process parameters optimization for improving the technological performances of the DM processes. However, optimizations of the machining process parameters and cutting tool’s geometry for simultaneous improvements of the PF, EC, and surface roughness (Ra) have not been considered in the aforementioned works; these were investigated and presented in detail in this study. Furthermore, the optimal results directly selected from experimental data may fall into the trap of local optimization.
In order to overcome the above-mentioned drawbacks of the published works, in this study, a multiple-response optimization of machining parameters of the dry milling process, for the case of stainless steel 304, was considered and applied; it aims to simultaneously enhance the PF, EC, and surface roughness (Ra). In addition, it was well recognized that the effects of machining process parameters as the inputs for the optimization may contribute to the variations of the measured performances of the machining operation. Therefore, an effective approach for modeling dry milling behavior and optimizing the processing factors in terms of improving working performances is still a significant contribution.
The rest of the article is organized as follows. Section “Methods” presents the methods used for the proposed optimization problems. Section “Experimental setting and measurements” presents the experimental setting and measurements. Section “Results and discussion” presents results and discussions. Finally, summaries and conclusions are presented in section “Conclusion.”
Methods
Optimizing issue
The PF is defined as the ratio of the active power consumption (APC) to the apparent power (APP), as shown in equation (1)
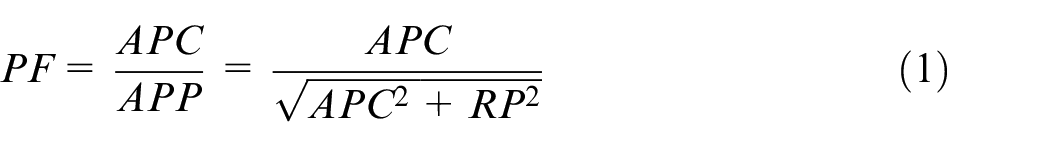
The power transmitted from the electrical source to the device contains two sub-components, including the active power and reactive power (RP). The active power characterizes the useful capacity of the device. Reactive power does not produce any productive work, but it is necessary for energy transformation. Reactive power significantly creates a magnetic field for transferring electrical energy into other forms of energy. The apparent power is the vector sum of the active power and reactive power. The higher the PF, the higher the active power and the device will produce more useful power. In fact, the PF depends on a load of electrical equipment. 31 For a milling machine, most of the sub-systems have a variable speed and variable operating load, which leads to the changes in the PF. The variations of machining conditions, such as the cutting speed, feed, depth of cut, nose radius, lubrication conditions, and workpiece materials, may cause the variable loads; hence, the PF changes. Therefore, when considering the power consumption of a machining process, the selection of relevant machining conditions to enhance the PF is always necessary and important.
The average value of the PF is calculated at the 15 positions over the cutting time. Here, PF is computed using equation (2)
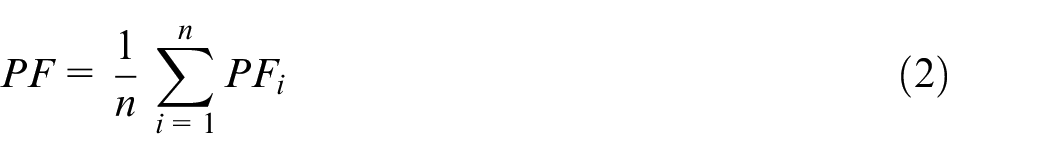
where PFi and n are the power factor at the i position and the total measured point, respectively.
Figure 1 presents a typical total energy consumed in a machine tool that can be divided into four components, including the setting energy, air cutting energy, cutting energy, and tool changing energy. Practically, the energy consumed for setting, air cutting, and tool changing times can be considered as constant values due to their less dependence on processing conditions (machining process parameters: cutting speed, depth of cut, feed rate, and nose radius). Therefore, the energetic objective in this work focuses on EC in the cutting stage which is effectively used to remove the material from the workpiece. In this study, the EC in cutting time is calculated using equation (3)

where Pc and tc denote the power consumed and the cutting time, respectively.
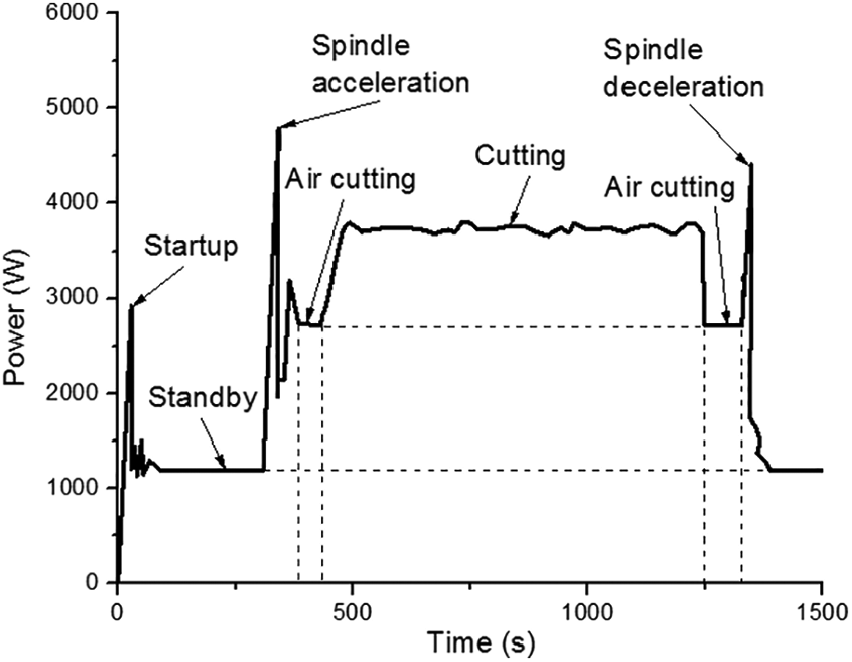
The profile of power consumption with respect to time indicating different cutting stages.
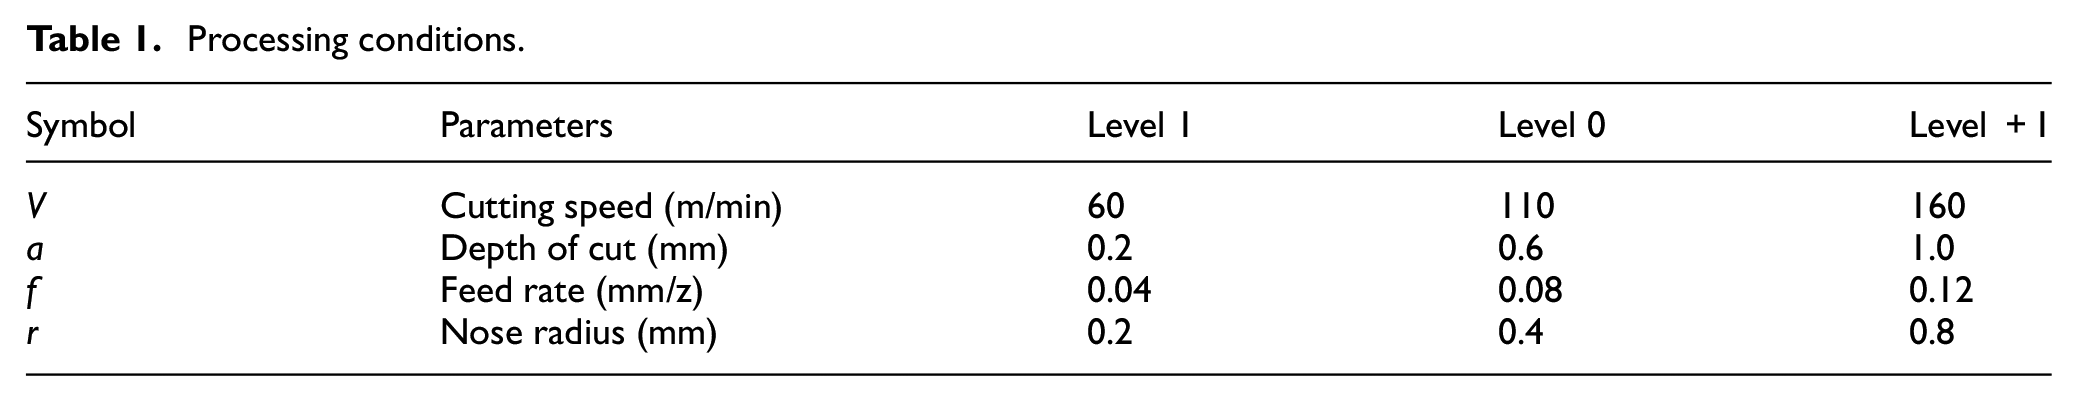
Table 1 presents the processing inputs, including the cutting speed (V), depth of cut (a), feed rate (f), and nose radius (r) for a multi-response optimization, which aims to enhance simultaneously the PF and decrease the EC and surface roughness in the DM. The levels of the processing inputs are determined based on the common values used in the milling processes of the automotive components and verified by cutting tool’s handbooks.
Processing conditions.
Optimizing framework
The systematic optimization procedure is shown in Figure 2, including five sequential steps presented as follows:
Step 1. The machining runs are conducted according to the experimental matrix generated by the Box-Behnken method (BBM). 32 BBM is chosen due to an acceptable balance between predictive accuracy and economy. The BBM is an effective method, which combines a two-level factorial design. Three required levels of each factor are “1,”“0,” and “+1,” which present the low, middle, and high levels. The number of design points is placed on the midpoints of the edges and the center of the block. BBM is more efficient than the other techniques, such as central composite and full factorial designs due to a lower number of experiments, which significantly contribute to experimental costs and time. The full factorial designs are costly in terms of real-machining experiments when the factor number is higher than 2. Moreover, BBM does not present the parameter combinations at their highest or lowest levels. The experiments are avoided to perform at extreme conditions, which may lead to unsatisfactory results.
Step 2. The PF, EC, and Ra models are then developed with respect to process parameters using the RBF approximate approach.
Step 3. Normalization of the experimental data using the GRA. 33
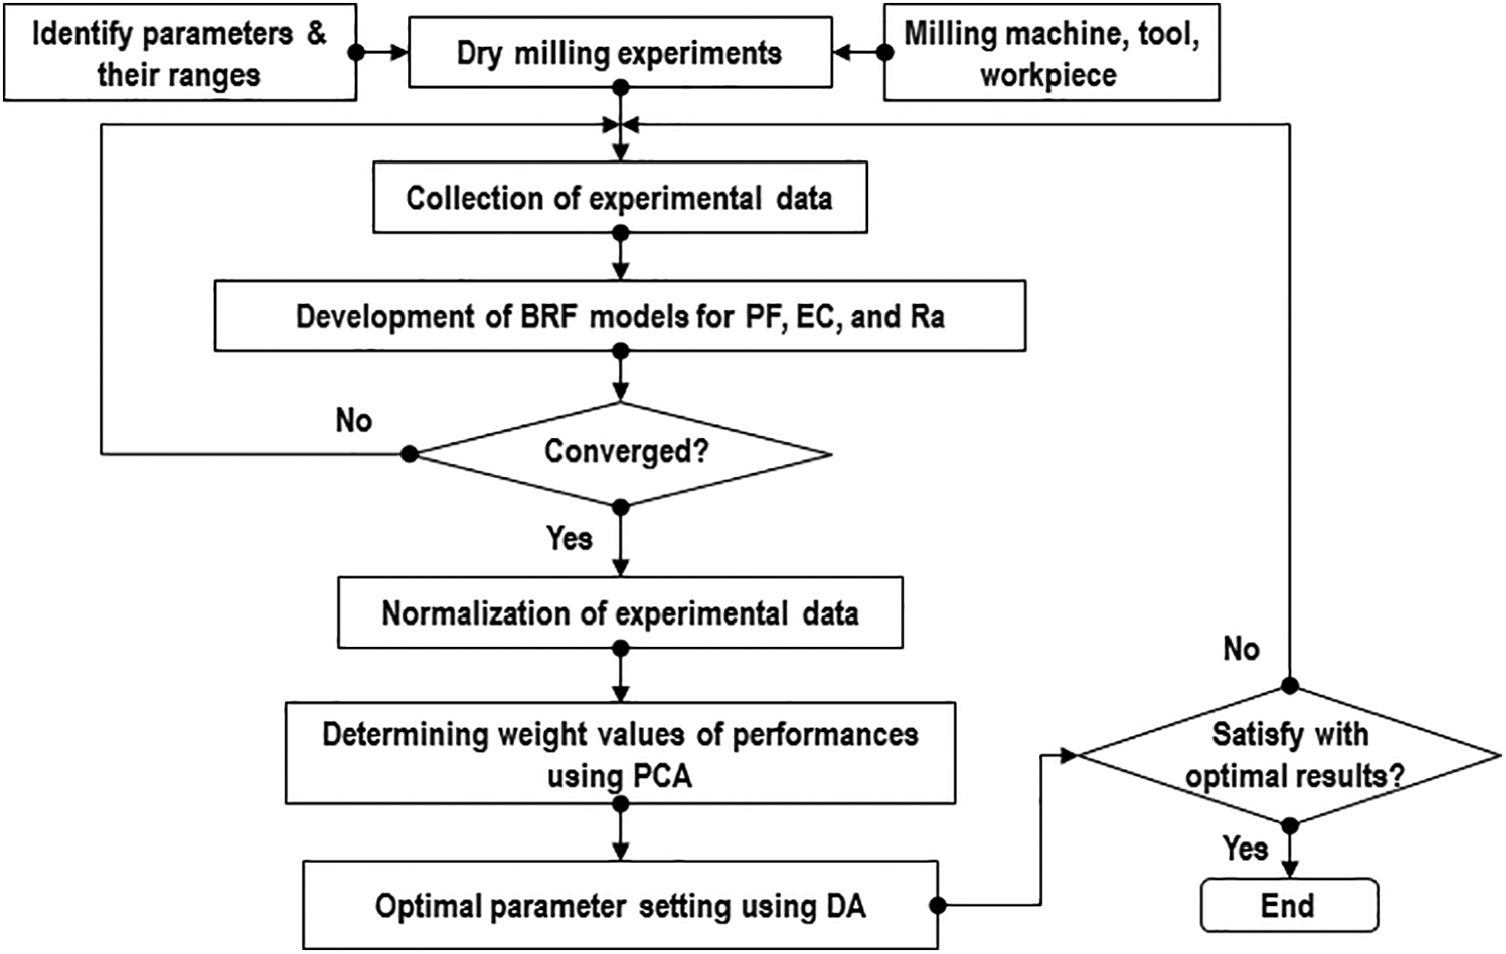
Systematic diagram showing the optimizing procedure.
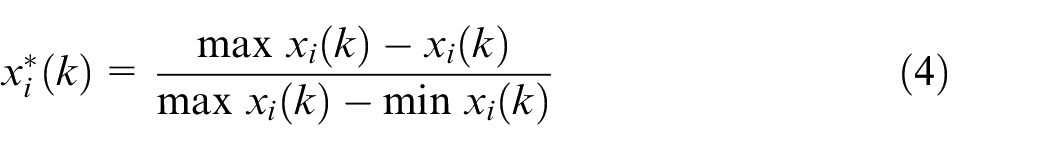
The normalized value for the response with the “smaller-the-better” characteristic is calculated using equation (4)
The normalized value for the response with the “higher-the-better” characteristic is computed with the help of equation (5)
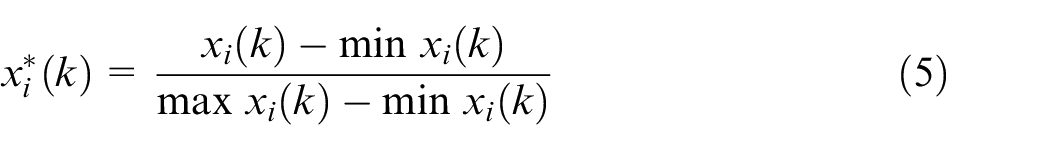
where xi(k) denotes the actual value. In addition, max xi(k) and min xi(k) are the maximum and minimum values of the response, respectively.
The deviation sequence Δ i (k) is calculated by applying equation (6)

The value of the Grey relation coefficients (GRC) ξi(k) for each response is calculated according to equation (7)
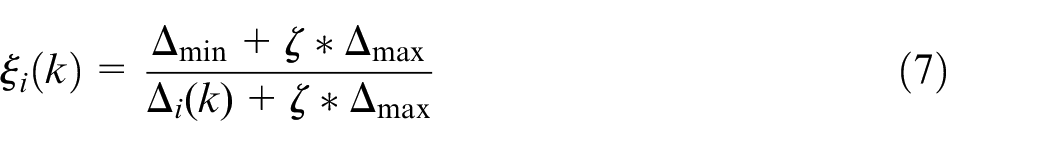
where Δmax and Δmin are the maximum and minimum values of Δi(k), respectively. ξ denotes the distinguishing factor.
Step 4. Determining the weight values of performances using the principal component analysis (PCA).
The correlation coefficient from the GRC is calculated using equation (8)
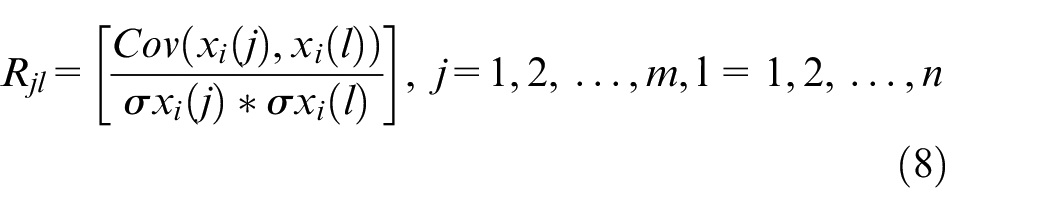
where xi(j) and cov(xi(j), xi(l)) are the Grey relational coefficient and the covariance of the response, respectively. In addition, σxi(j) and σxi(l) are the standard deviations of the response, respectively. The eigenvalues and consequent eigenvectors are determined by applying equation (9)

where λk, Vik, and Im represent the eigenvalue, the eigenvector, and the identity matrix, respectively. Therefore, the principal component is obtained using equation (10)
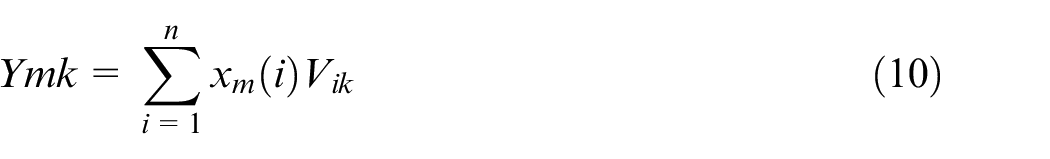
where xm(i) and Ymk are the normalized response variable and the principal component, respectively.
Step 5. Determining the optimal parameters using the desirability approach (DA).
The DA is applied to transform the response yi(x) into an individual desirability function di (0 ≤ di ≤ 1) for achieving the desired value. The value of di lies between 0 and 1, when di = “1.” It indicates that the ideal response is achieved. The optimal results of the response are adjusted with different weight values. The targets are combined into the desirability function (D) for multi-objective and processing factors. The optimal factors are determined based on the maximum value of the desirability function.
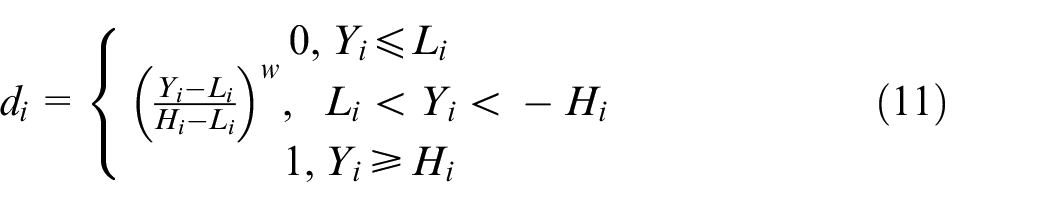
The di is calculated with respect to the maximizing goal, as shown in equation (11)
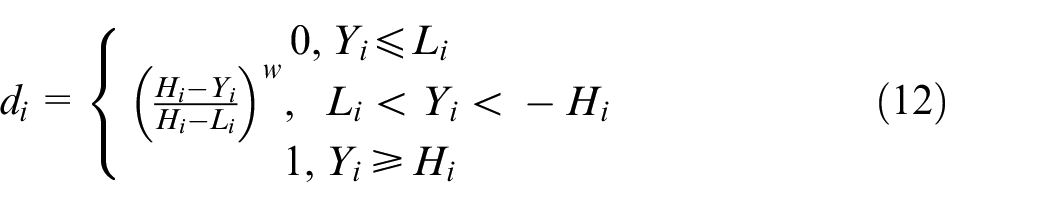
The di is calculated with respect to the minimizing goal, as shown in equation (12)
The di is calculated with respect to the target, as shown in equation (13)
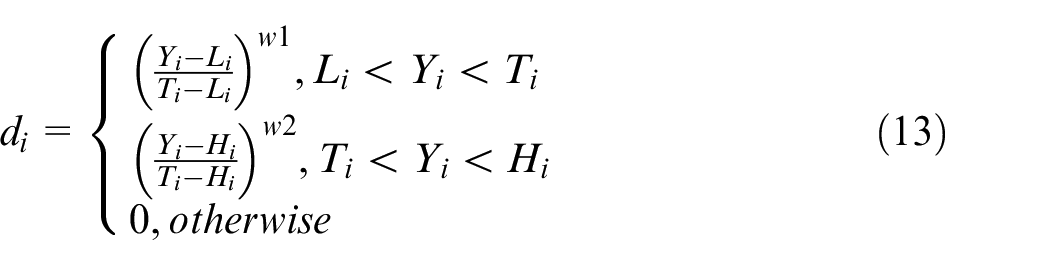
The di is calculated with respect to the range, as shown in equation (14)
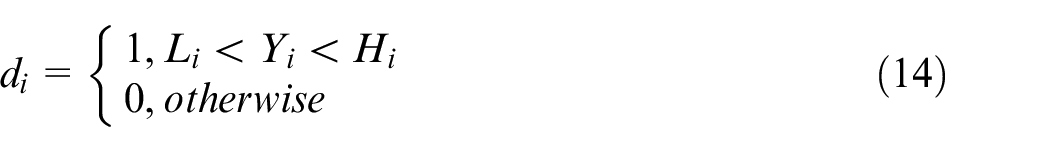
where Li, Hi, Ti, and wi are the low, high, target, and weight values of the ith response, respectively.
The value of the desirability function of the response is calculated by means of equation (15)
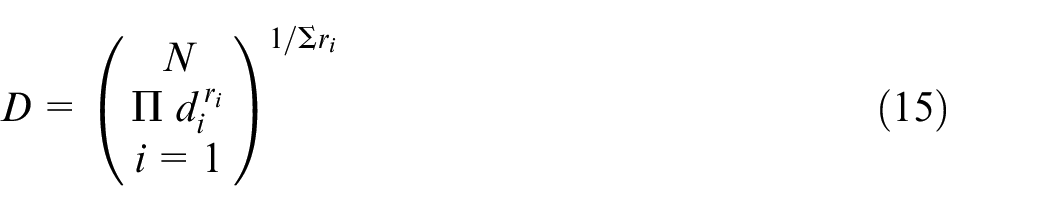
where N is the number of the measured responses.
Radial basis function model
RBF (radial basis function) is one kind of neural networks using a hidden layer of radial units and an output layer of linear units, which is applied to interpolate the data points. RBF approximations are characterized by the reasonably fast training and compact networks. They are useful in approximating a wide range of nonlinear spaces. The RBF is expressed as a formula in equation (16) 34
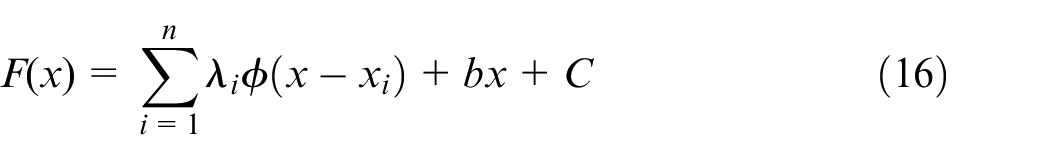
where γ is a positive constant. λi, b, and c are the parameters to be determined, respectively, which are obtained by equations (17) and (18) in the matrix form
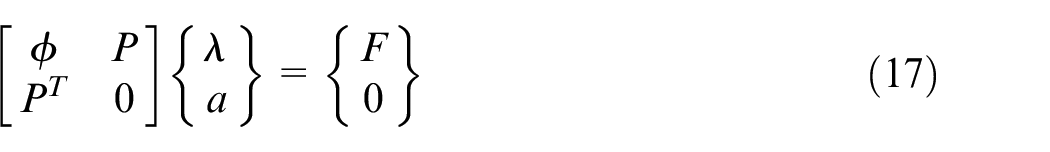
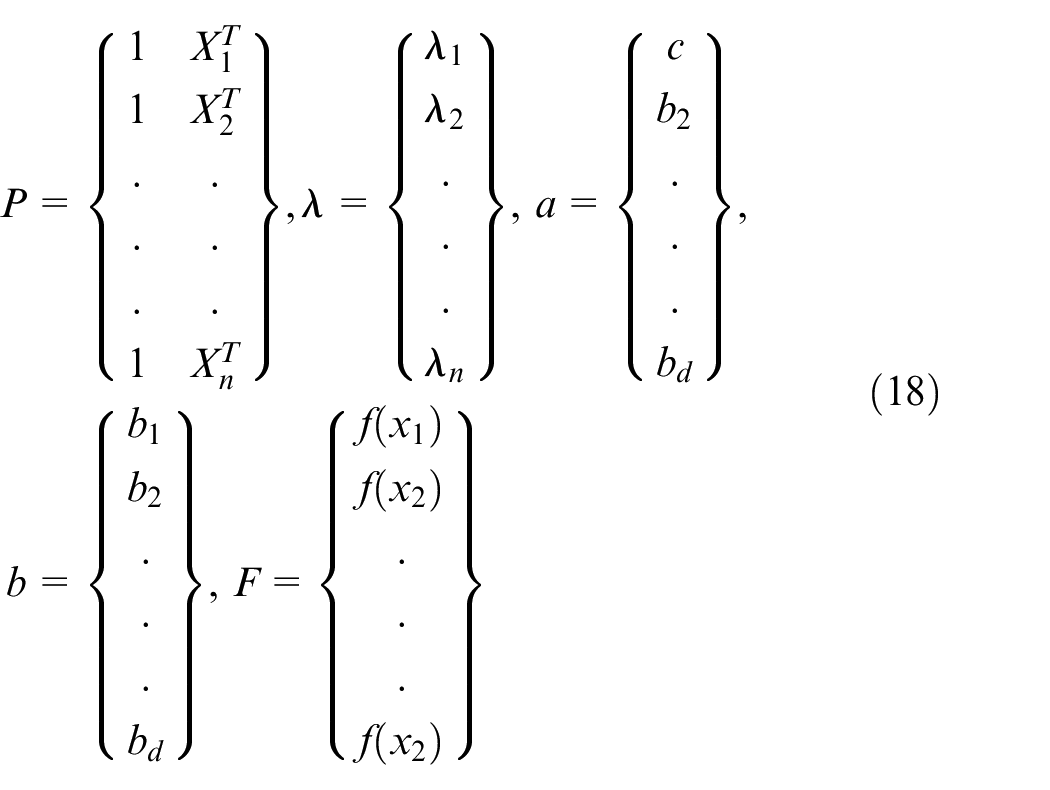
where ϕ and d are the n×n matrix and the dimension of vector
In this study, the multi-quadratic models of the radius basic function are used to render the nonlinear approximations, which are presented using equation (19)

Four evaluating criteria, including the R2 value, the root mean square error (RMSE), the maximum absolute error (MAE), and the average absolute error (AAE) are used to investigate the predictive accuracy of the RBF models.
R2 presents the coefficient of determination, between 0 and 1 where R2 = 1 means no error between the observed and approximated values. The R2 coefficient is defined as the ratio of explained variation to total variation. R2 is a statistical measure of the degree of fit. The value of R2 is computed as follows
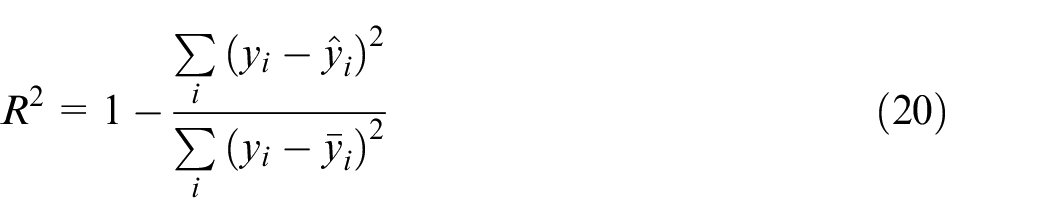
where n,
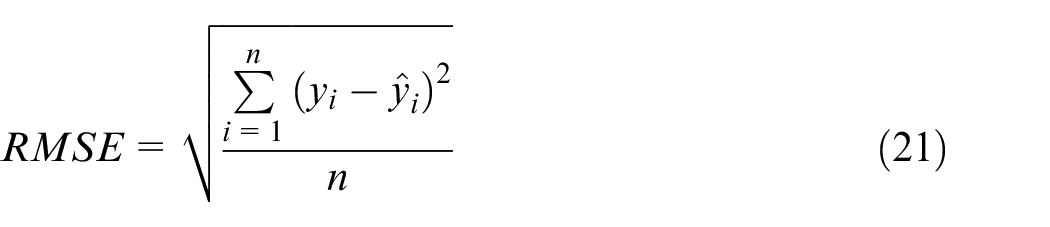
The RMSE is a quadratic scoring rule, which is used to measure the average magnitude of the error. In other words, it is the square root of the average of squared differences between prediction and actual observation. The value of RMSE is calculated as follows
The maximum absolute error (MAE) denotes the maximum difference between observed and approximated values. The value of MAE is computed as follows

The AAE presents the average difference between observed and approximated values. The value of AAE is calculated as follows
Experimental setting and measurements
Milling tests were performed in a Spinner U620 machining center (Figure 3(a)). The dimensions of machining specimens were 350 mm × 150 mm × 25 mm. The tool holder equipped with two inserts is 12 mm in diameter. The different wiper inserts having 0.2 mm, 0.4 mm, and 0.8 mm of the nose radius are used in the milling trials.
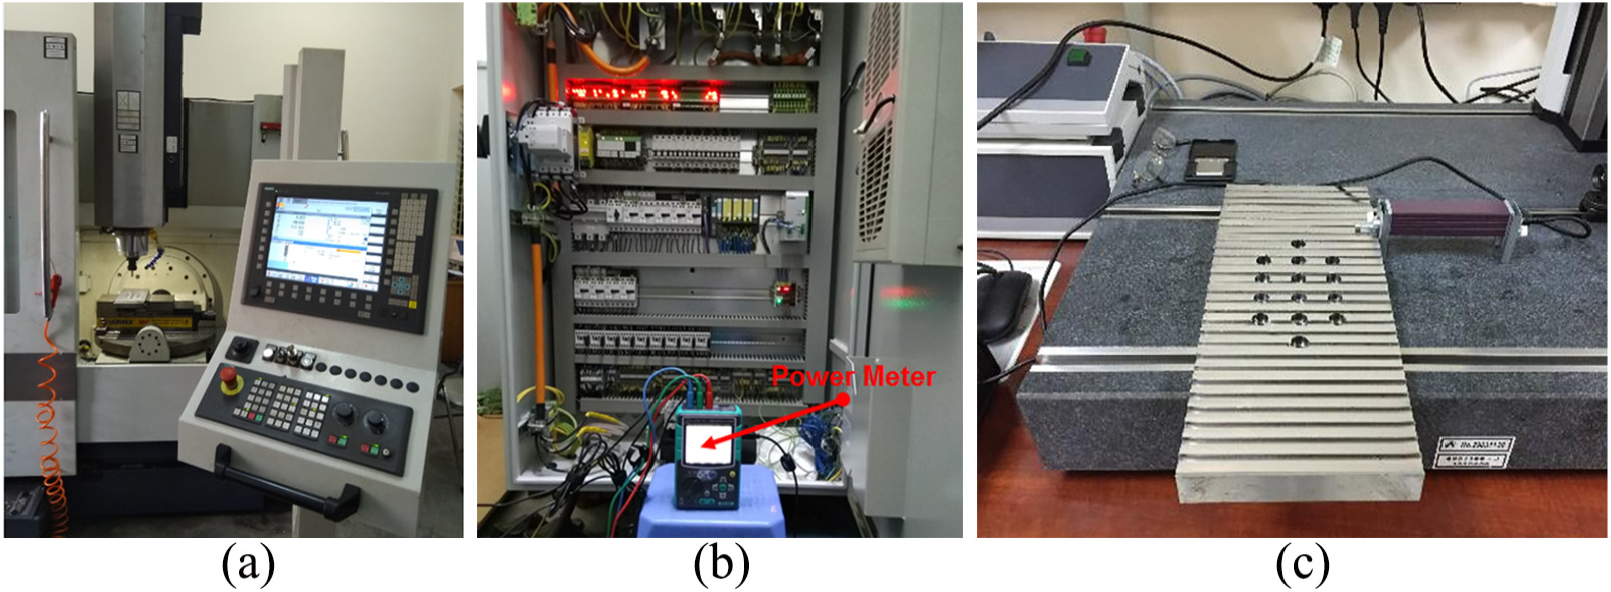
Experiments and measurements: (a) dry milling experiments, (b) power measurements, and (c) measuring surface roughness.
Power Meter KEW6305 was used to measure the power consumption during the milling process. Three clamp sensors were connected to the three-phase power lines of computer numerical control (CNC) machine with correct direction. The observed data was stored on a flashcard and analyzed with the aid of the KEW6305 software on the computer, as shown in Figure 3(b).
The surface roughness was measured using a tester Mitutoyo SJ-301 in the vertical and horizontal directions. The average values of the roughness properties were observed from five different points (Figure 3(c)).
The representative values of the active power consumed at different inputs are depicted in Figure 4. The profiles of the surface roughness are shown in Figure 5. The variations of the PF in the processing time are illustrated in Figure 6.
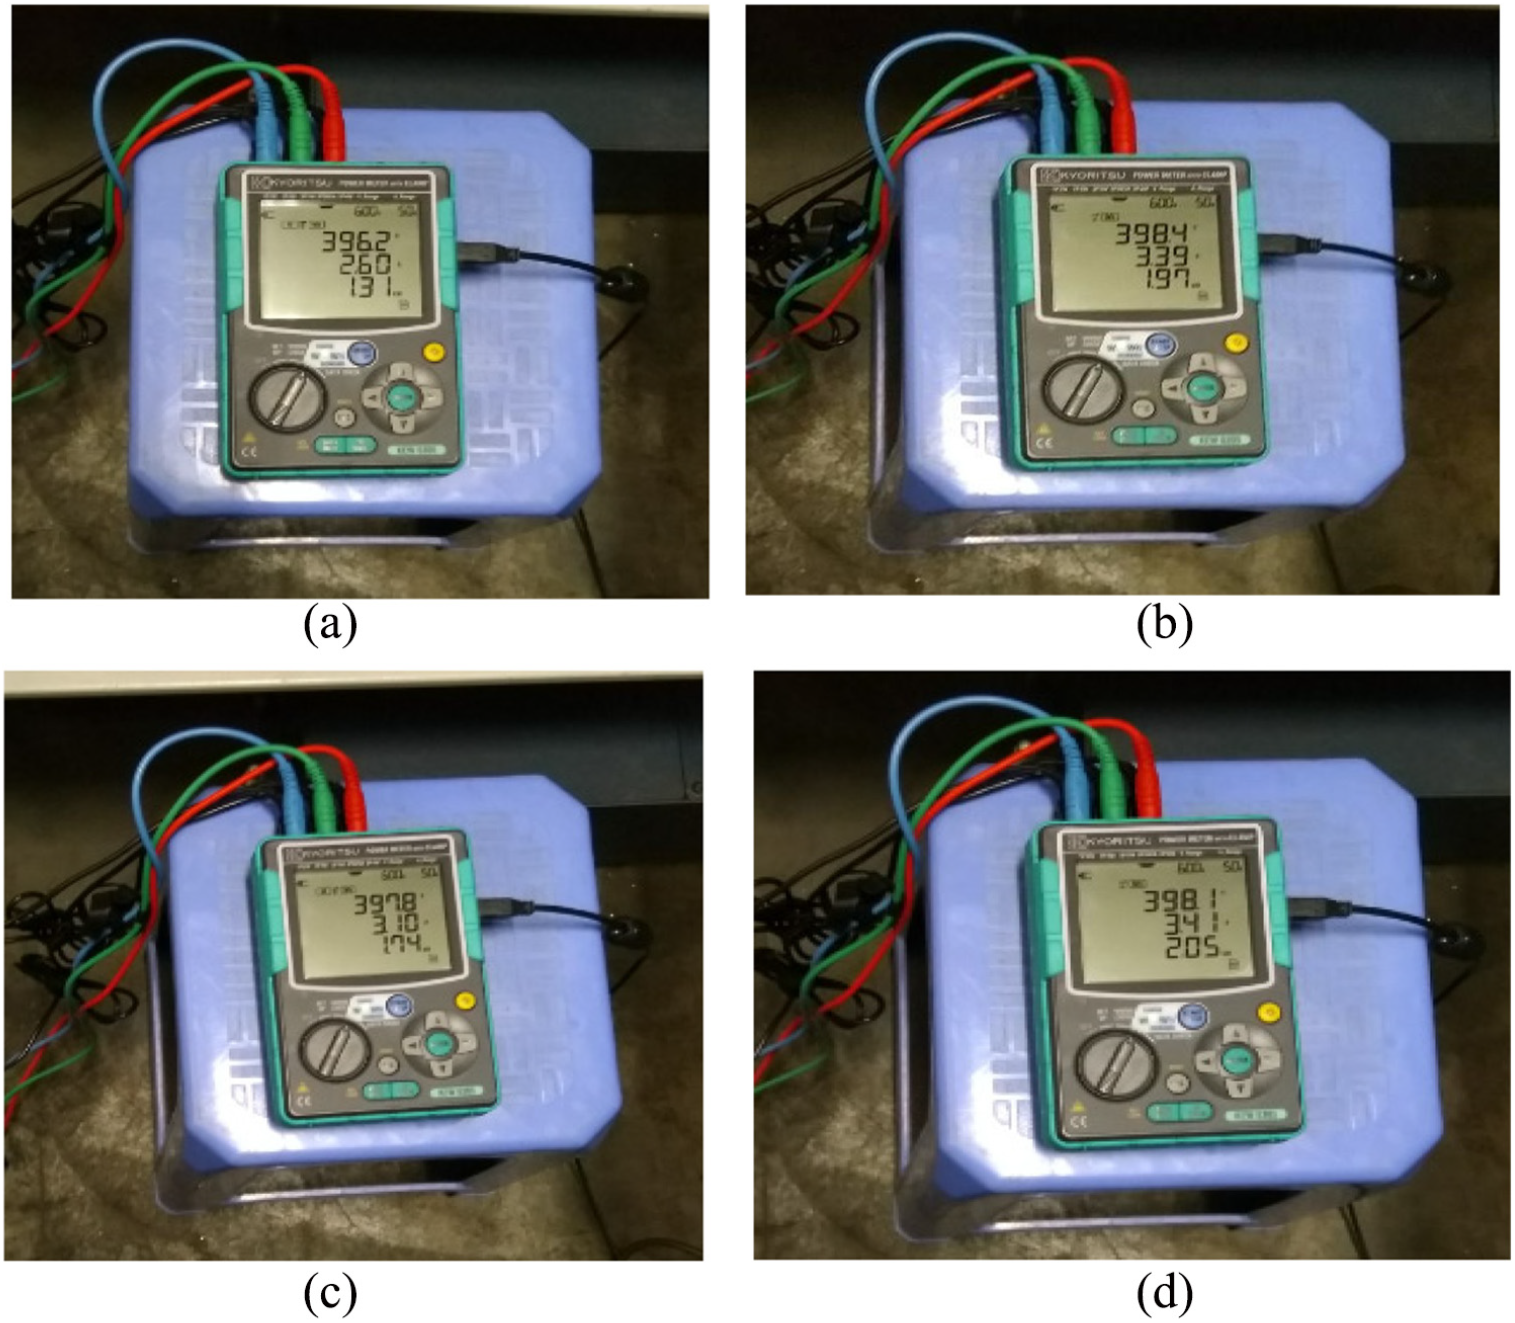
The power consumption at various machining conditions: (a) Experiment no. 1 (Replication-2), (b) Experiment no. 2 (Replication-2), (c) Experiment no. 9 (Replication-3), and (d) Experiment no. 13 (Replication-3).
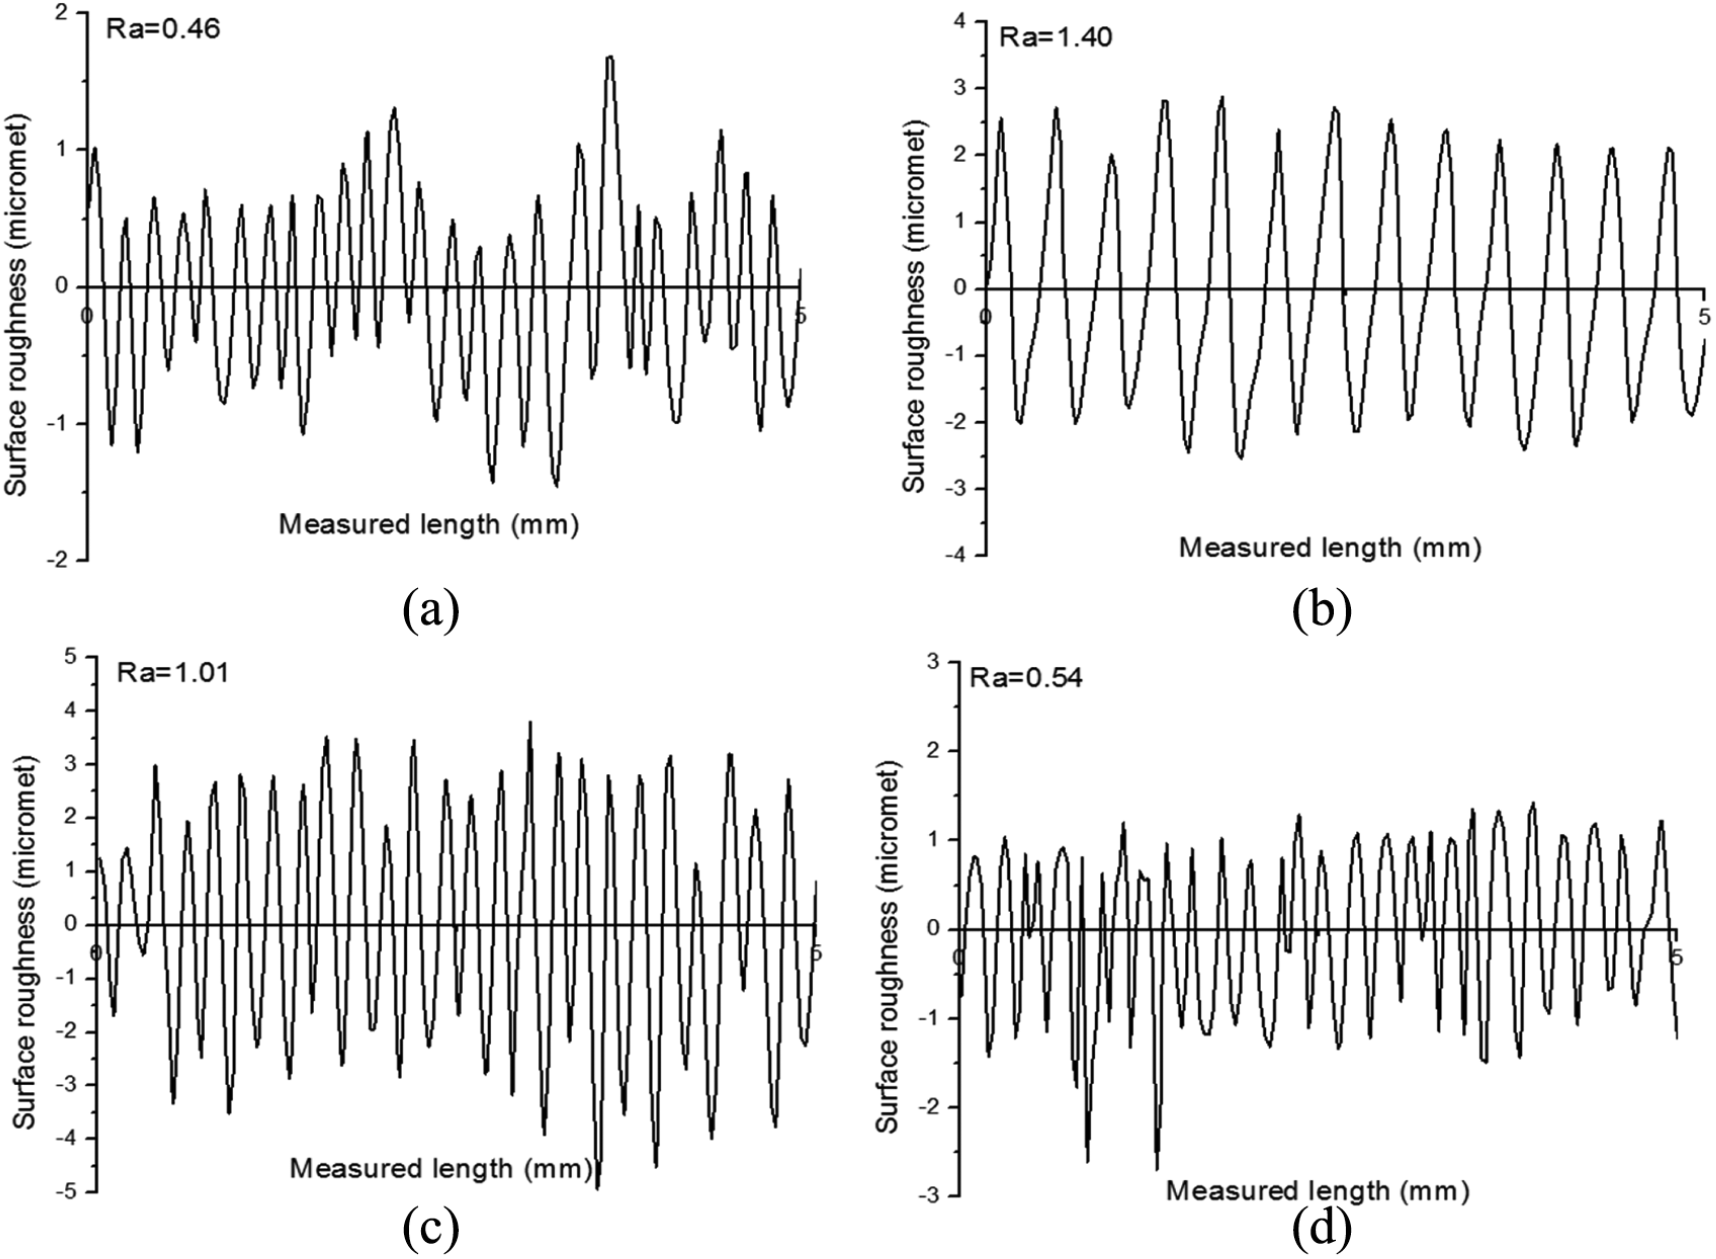
Surface roughness at various machining conditions: (a) Experiment no. 1 (Replication-2), (b) Experiment no. 11 (Replication-3), (c) Experiment no. 16 (Replication-4), and (d) Experiment no. 21 (Replication-3).
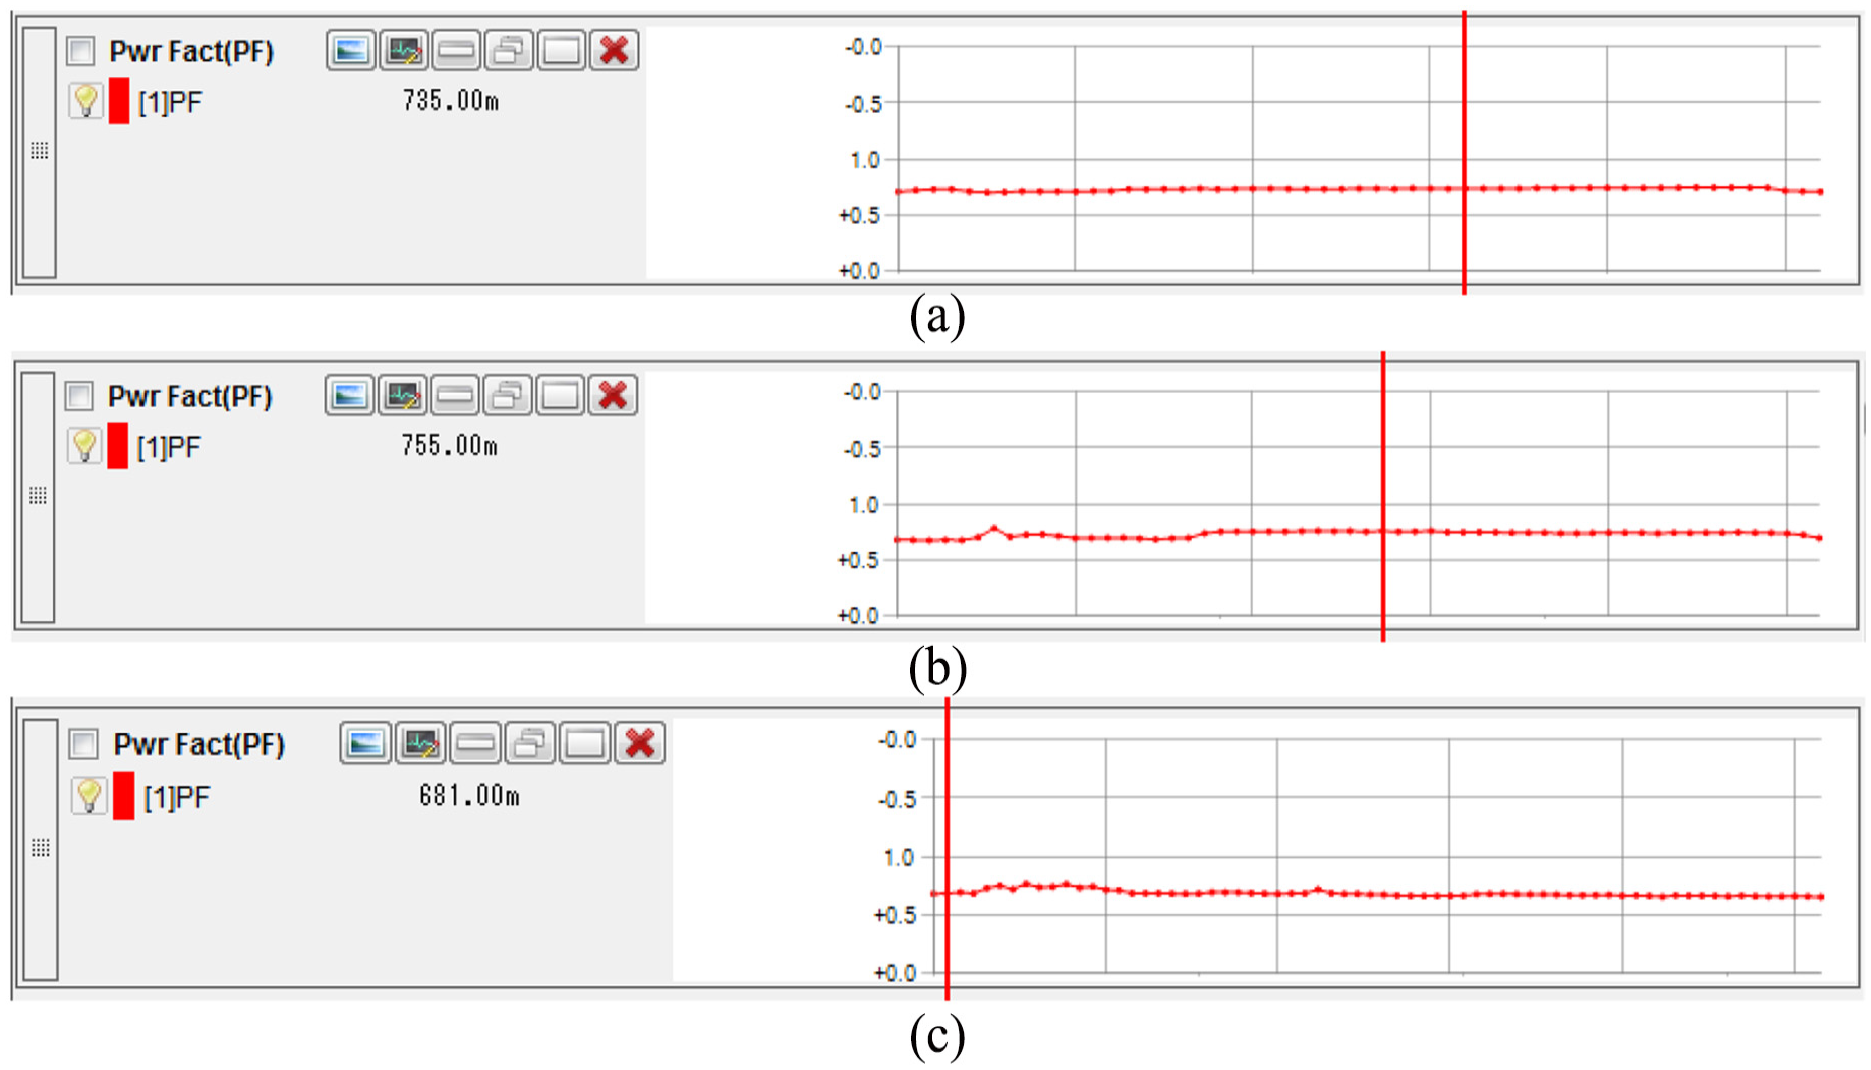
The variations of the power factor at various machining conditions: (a) Experiment no. 11 (Replication-3), (b) Experiment no. 20 (Replication-3), and (c) Experiment no. 24 (Replication-2).
Results and discussion
Investigation of model accuracy
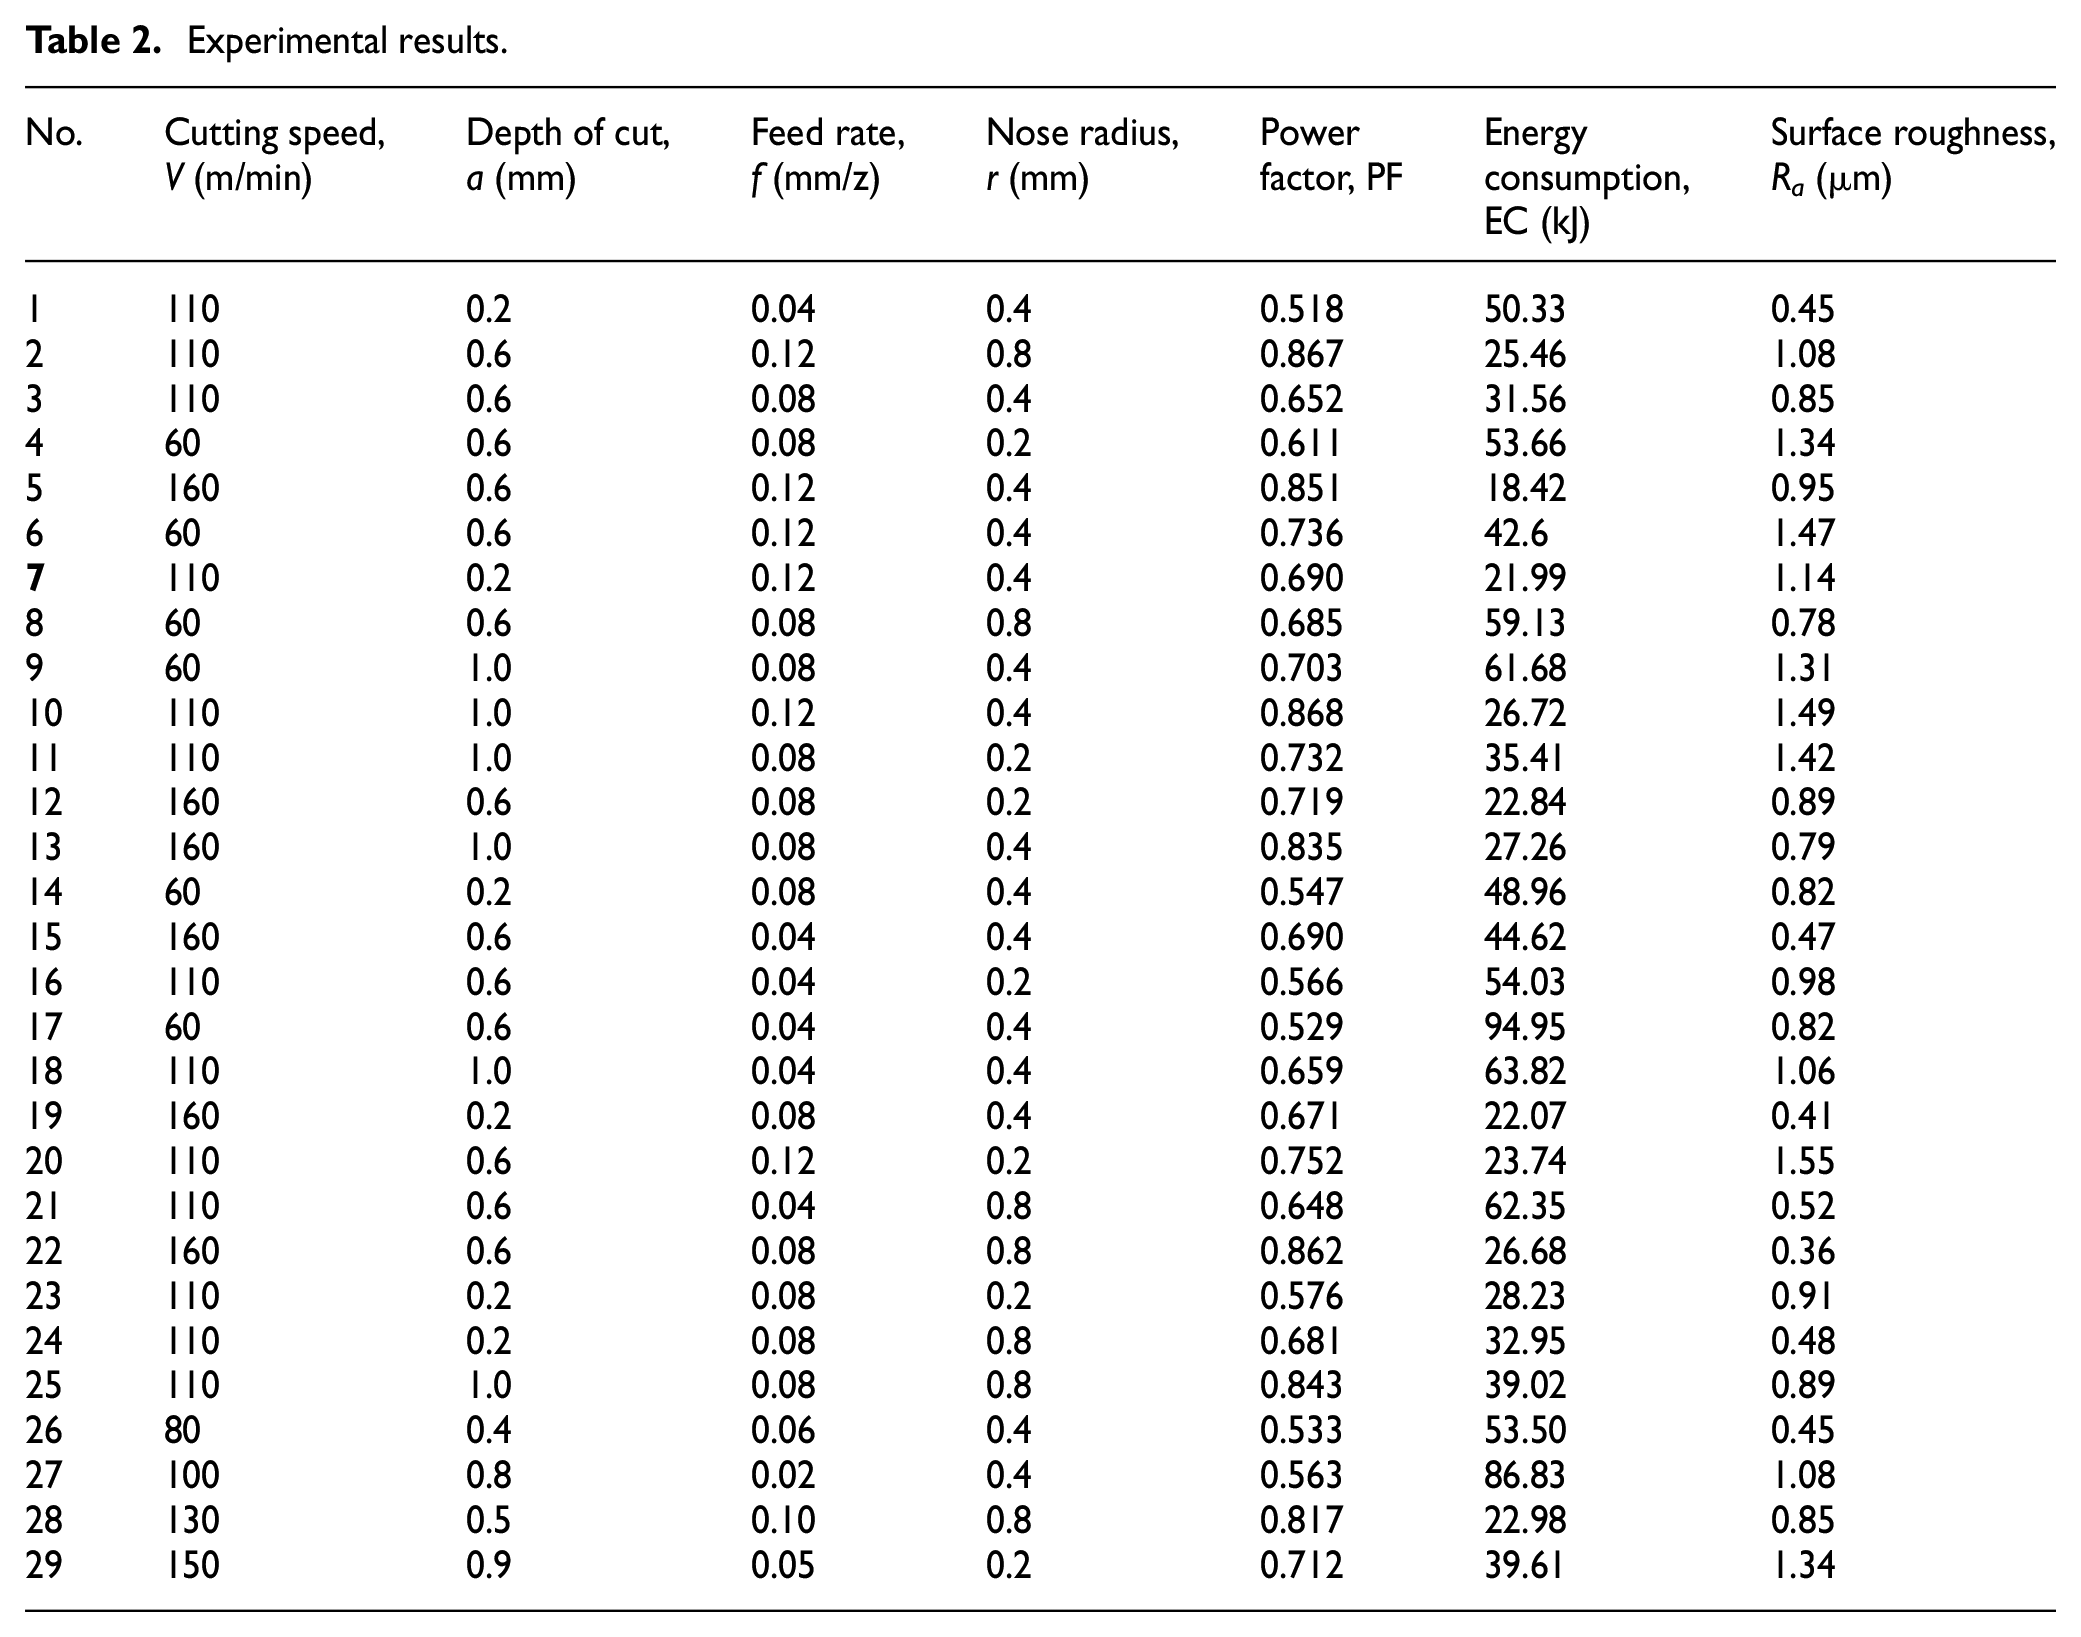
The experimental results of the dry milling process are given in Table 2.
Experimental results.
The values of the R2, RMSE, MAE, and AAE for three technical responses are listed in Table 3. The R2-values of the PF, EC, and Ra are 0.9954, 0.9921, and 0.9938, respectively, showing the perfect correlation between predicted values and observed values (Figure 7). This R2 value is comparable with other established models, reported by previous works,35–37 warranting the acceptance of the present model. The small values of the evaluating errors (RMSE, MAE, and AAE) indicate the adequacy of the proposed models.
The values of evaluating criteria.
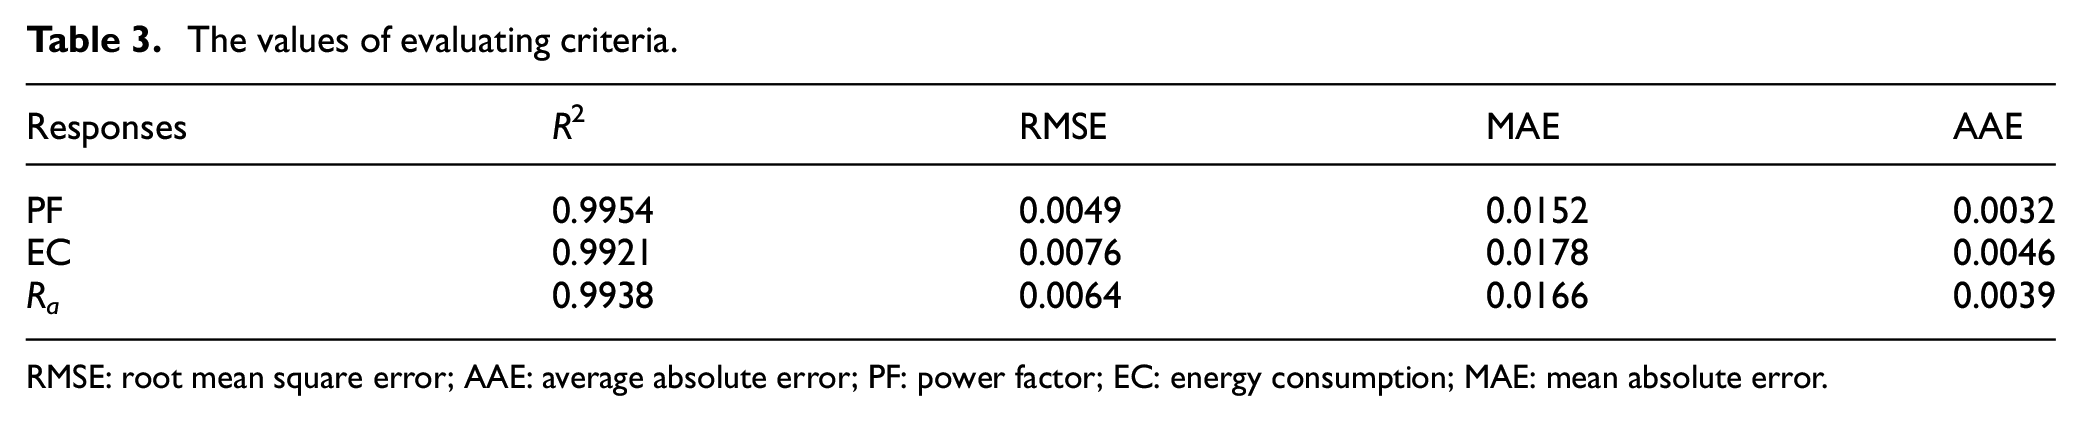
RMSE: root mean square error; AAE: average absolute error; PF: power factor; EC: energy consumption; MAE: mean absolute error.
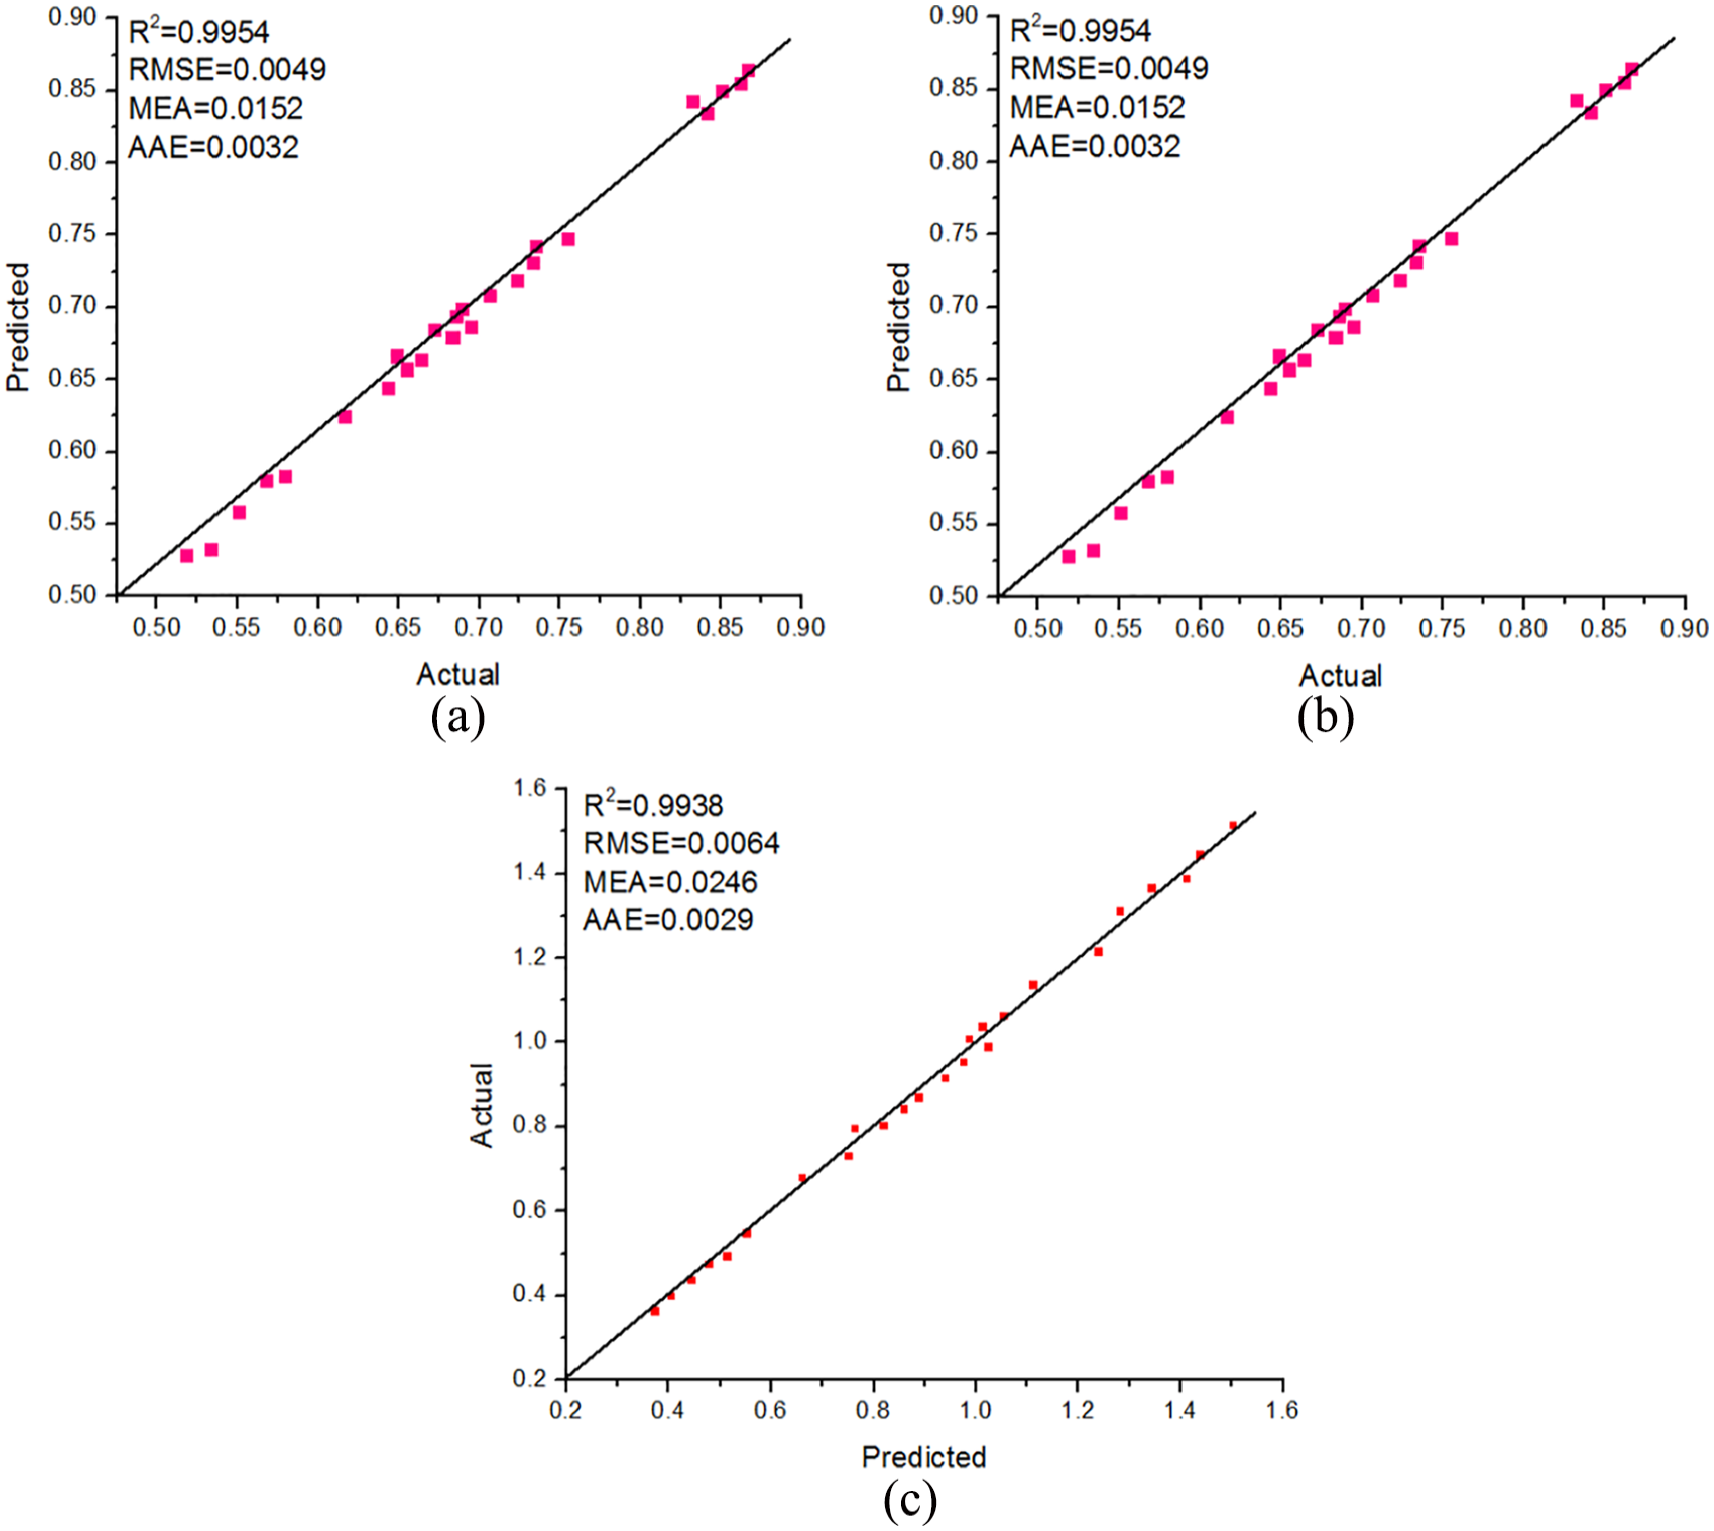
Investigation of adequacy of RBF models: (a) power factor, (b) energy consumption, and (c) surface roughness.
In this study, the experimental data from 1 to 25 are used to develop the RBF models. The experimental data from 26 to 29 are adopted to test the accuracy of the obtained models. The comparisons between experimental and predictive values at the random points are shown in Figure 8. The small errors indicate that the RBF models are adequate and can be used for the optimizing process.
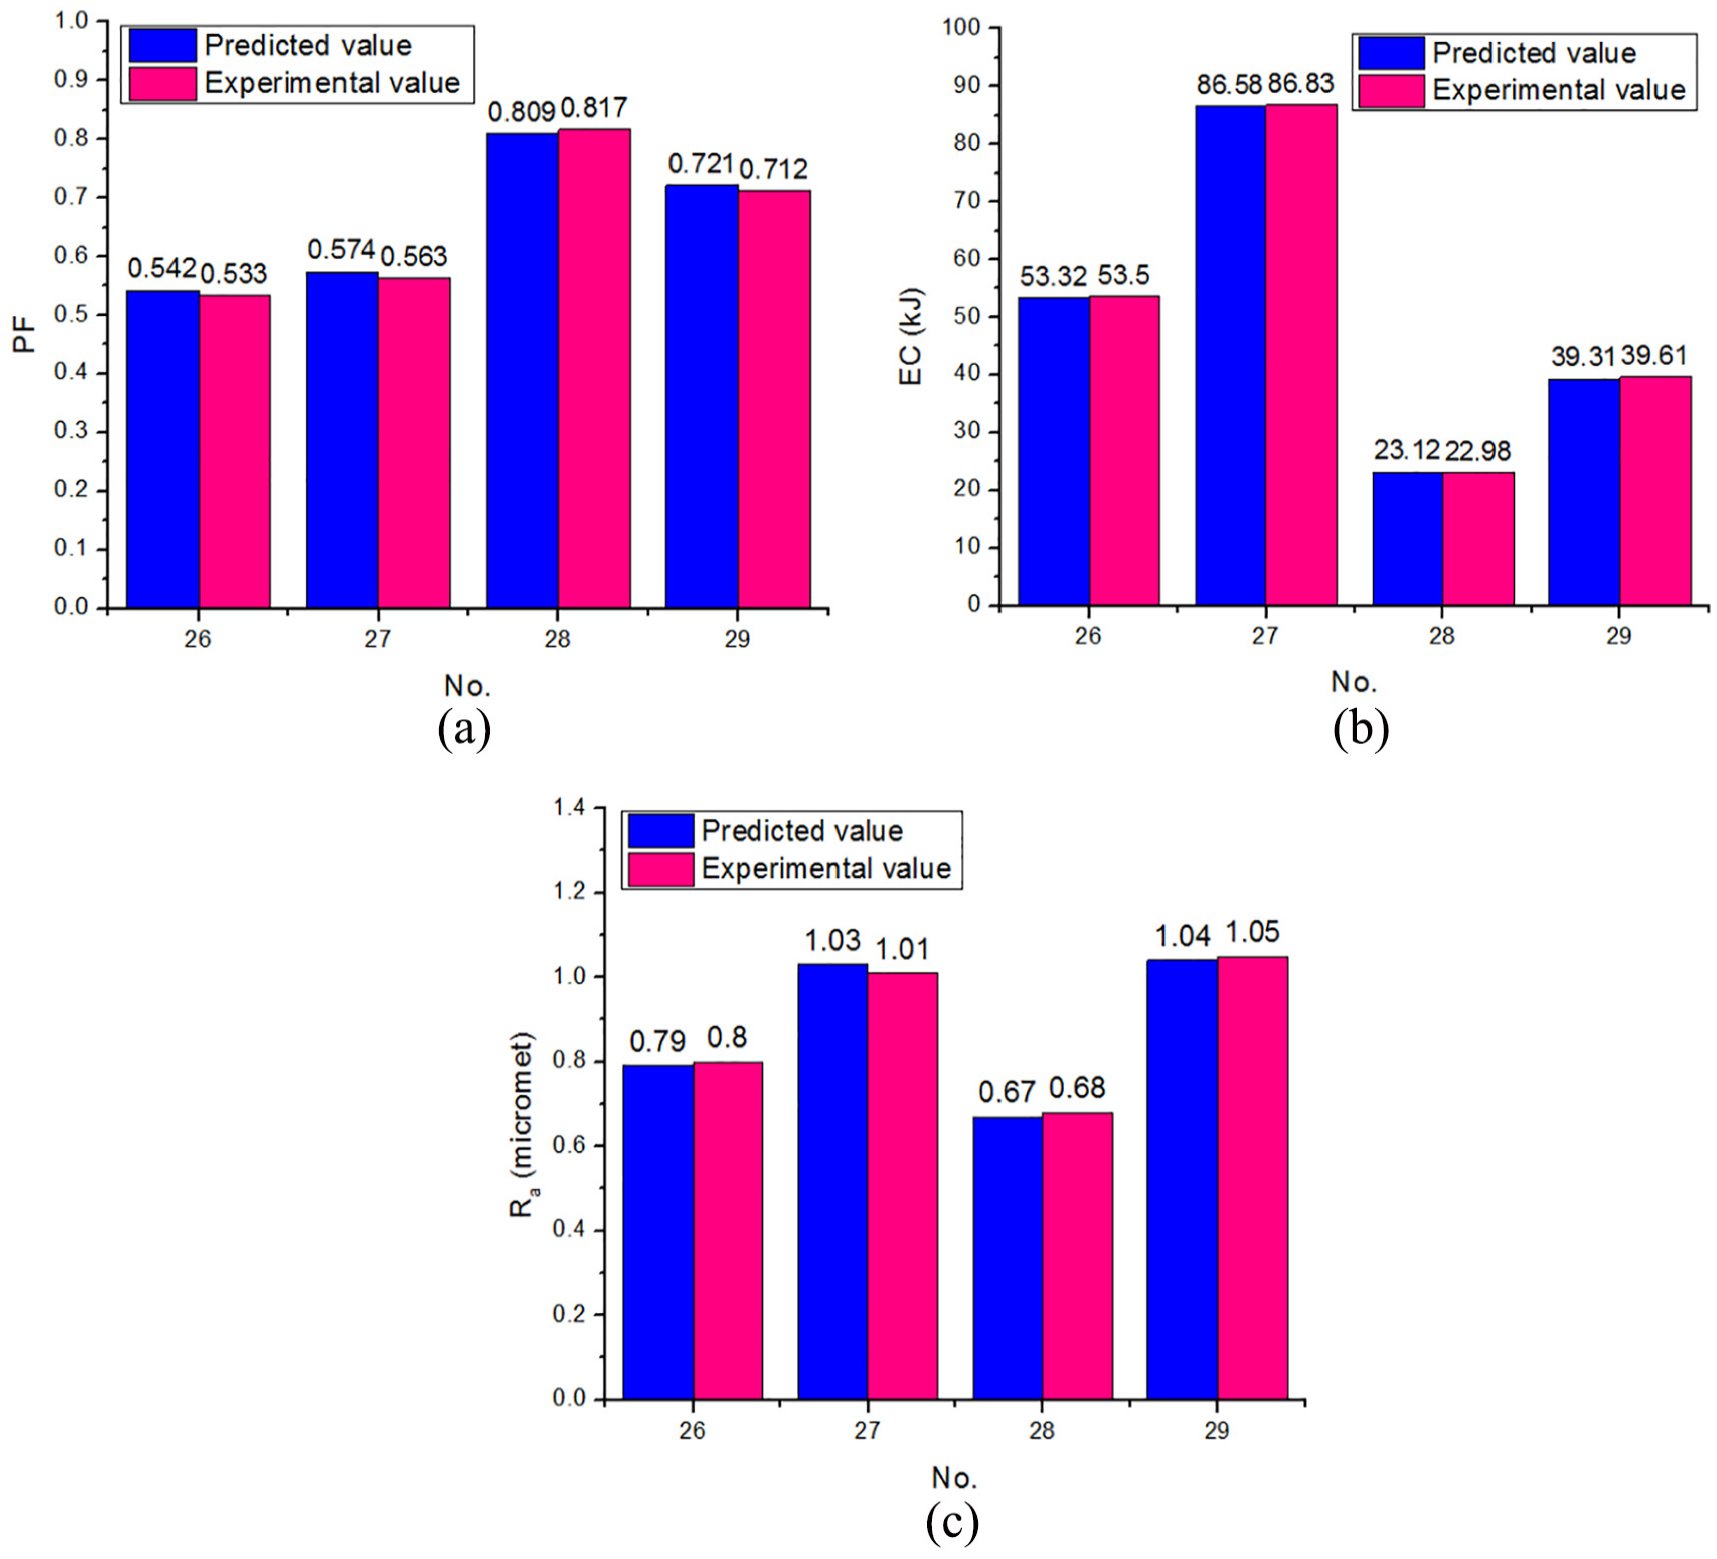
Validation of the accuracy for RBF models: (a) PF model, (b) EC model, and (c) SR model.
Parametric effects
The effects of the inputs on the PF shown in Figure 9 pointed out that the higher levels of the processing inputs, including the cutting speed, depth of cut, feed rate, and nose radius, lead to a higher PF. Figure 9(a) exhibits the impacts of the cutting speed and nose radius on the PF. At a higher value of the cutting speed, the consumed power of the motor increases in order to reach the desired value of the spindle speed. Therefore, the active power increases, leading to a higher PF. As nose radius increases, the cutting edge becomes curved, which results in more material deformation at the cutting area and thus higher EC. Moreover, a larger radius increases the length of the cutting edge; hence, more power is consumed to overcome the frictional resistance. Therefore, a higher nose radius leads to an increased load on the motor; hence, the PF improves.
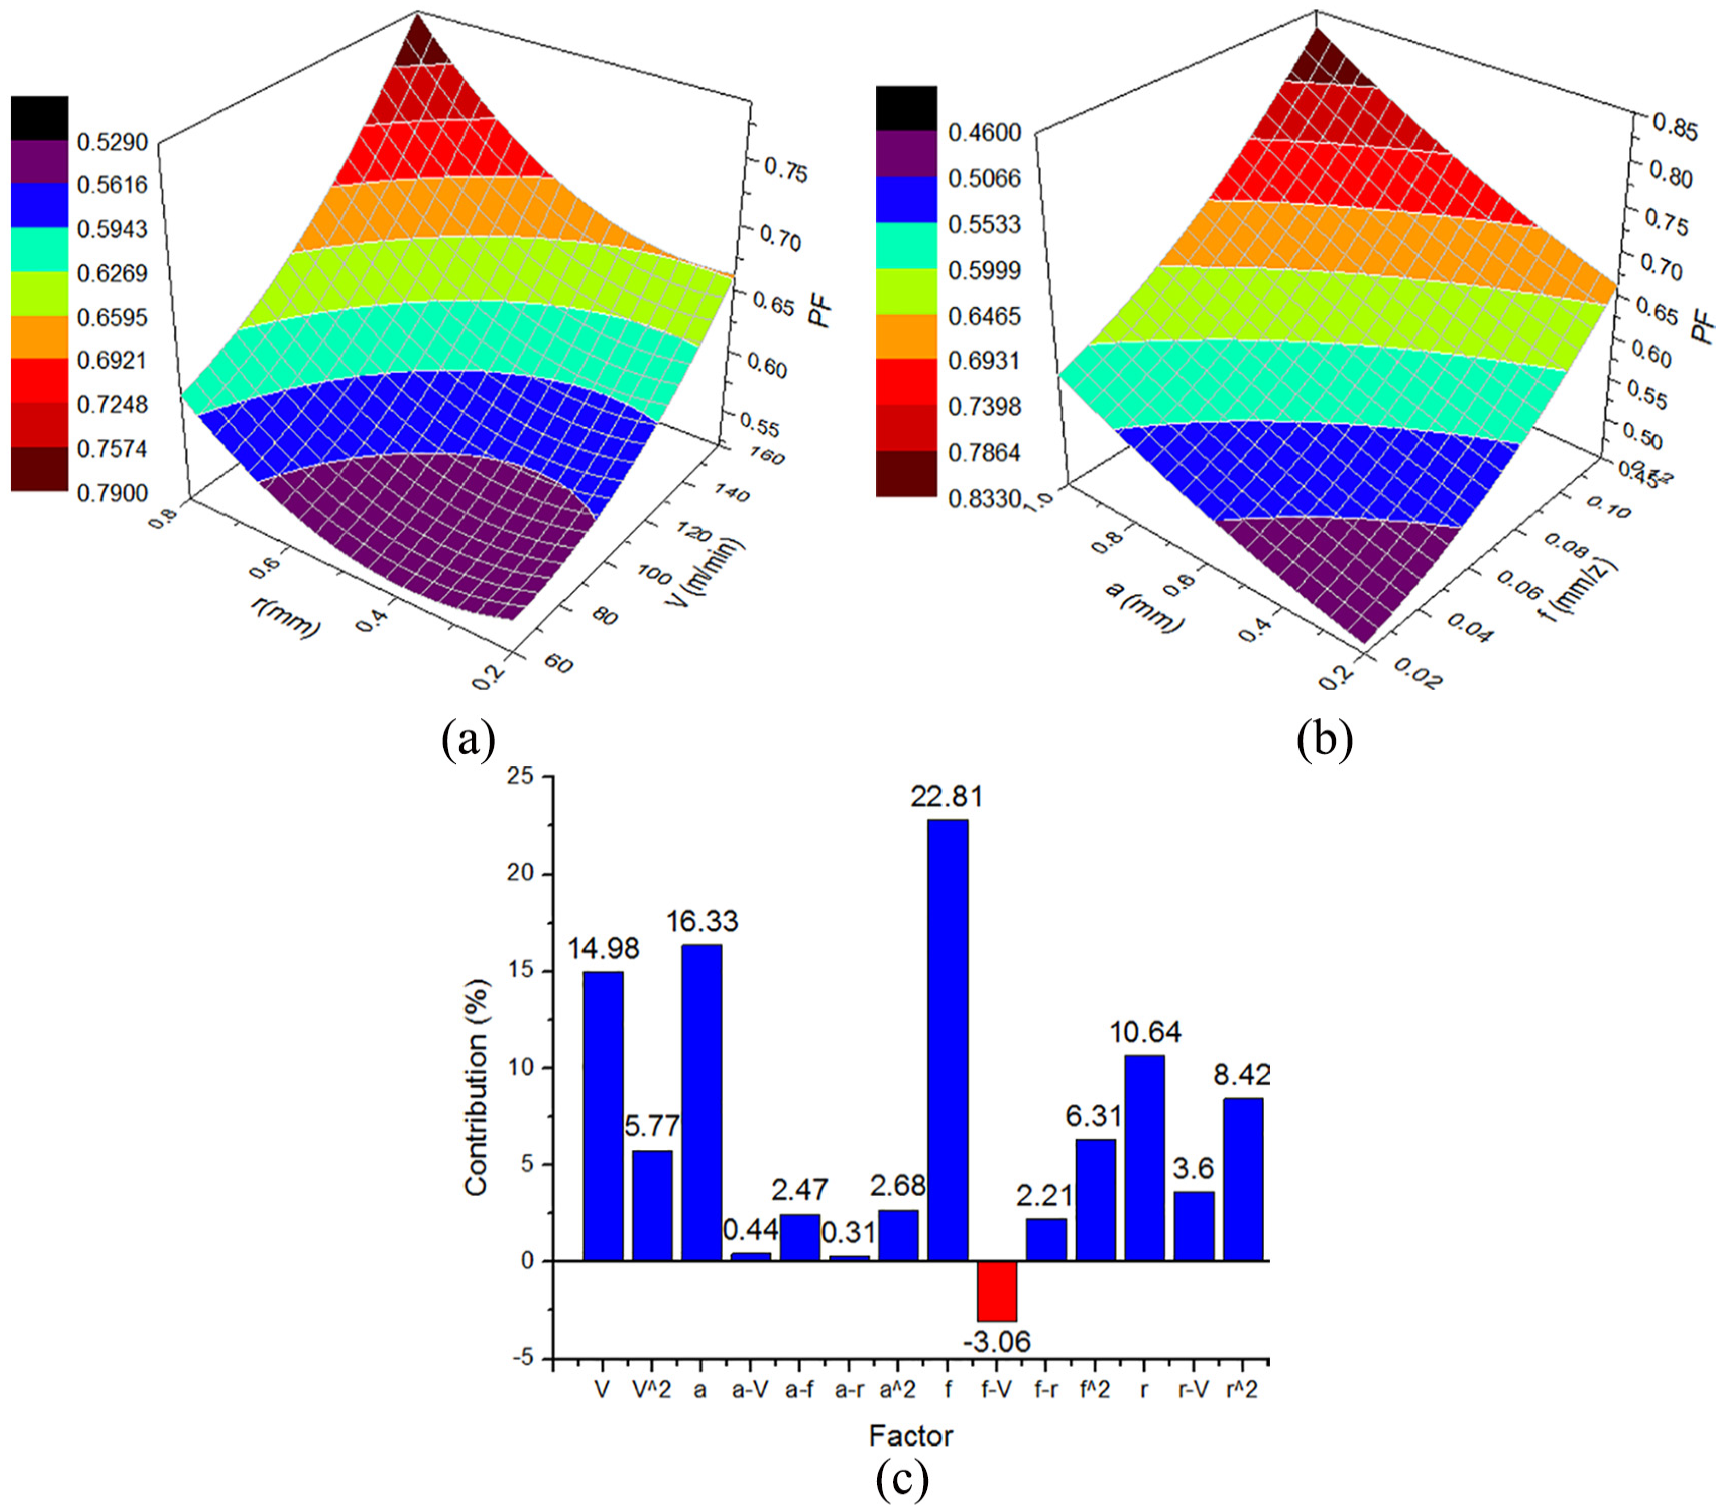
The effects of machining parameters on the PF model: (a) PF versus V and r, (b) PF versus a and f, and (c) parameter contributions for the PF model.
The influences of the feed rate and depth of cut on the PF are displayed in Figure 9(b). When the feed and depth of cut increases, the undeformed chip section increases. This results in higher machining forces;38,39 hence, the machine tool consumes more power. In fact, an increment in the depth of cut or feed rate causes an increased load on the motor to remove a higher material volume. As a result, higher active power is observed, resulting in an increment in the PF.
Figure 9(c) shows that f is the most effective parameter on the PF due to the highest contribution regarding single term (22.81%), followed by a (16.33%), V (14.98%), and r (10.64%), respectively. When the feed rate increases, the cutting forces and the cutting momentum also increase. Hence, the active power of the servo spindle motor and the feed drive motors increases. As a result, the PF rises up. The feed rate has more effect on the PF than that of cutting speed due to the contribution of the active power of the feed drive motors. When the feed rate increases, the reaction forces on the X- and Y-axis of the feed drive system as well as the cutting momentum on the spindle motor increase. Therefore, the total active power of movement system increases. The significant quadratic terms have significant impacts, in which r2 has the largest contribution (8.42%), followed by f2 (6.31%), V2 (5.77%), and a2 (2.68%), respectively.
The interaction impacts of the processing conditions on EC are shown in Figure 10. Figure 10(a) depicts the impacts of the cutting speed and depth of cut on EC. An increment in the depth of cut increases the undeformed chip section and the degree of plastic deformation. 40 The greater resistance in the chip formation increases and higher energy is consumed. As the cutting speed increases, EC significantly decreases. An increased cutting speed causes an increment in the temperature of the cutting region; hence, the hardness and strength of the workpiece are decreased. The softened part of material causes lower machining forces, as compared to its harder state. In addition, an increased cutting speed leads to a decrease in the frictional coefficient and the lower cutting force is obtained. Therefore, higher cutting speed generates low cutting forces which result in less EC. In contrast, it is obvious that the material removal rate would be higher when the cutting speed increased. The process parameters, including the cutting speed, feed, and depth of cut, determine the material removal rate. An increment in the material removal rate requires higher power consumption. Higher rate of material removal required a higher power to turn the spindle motor.
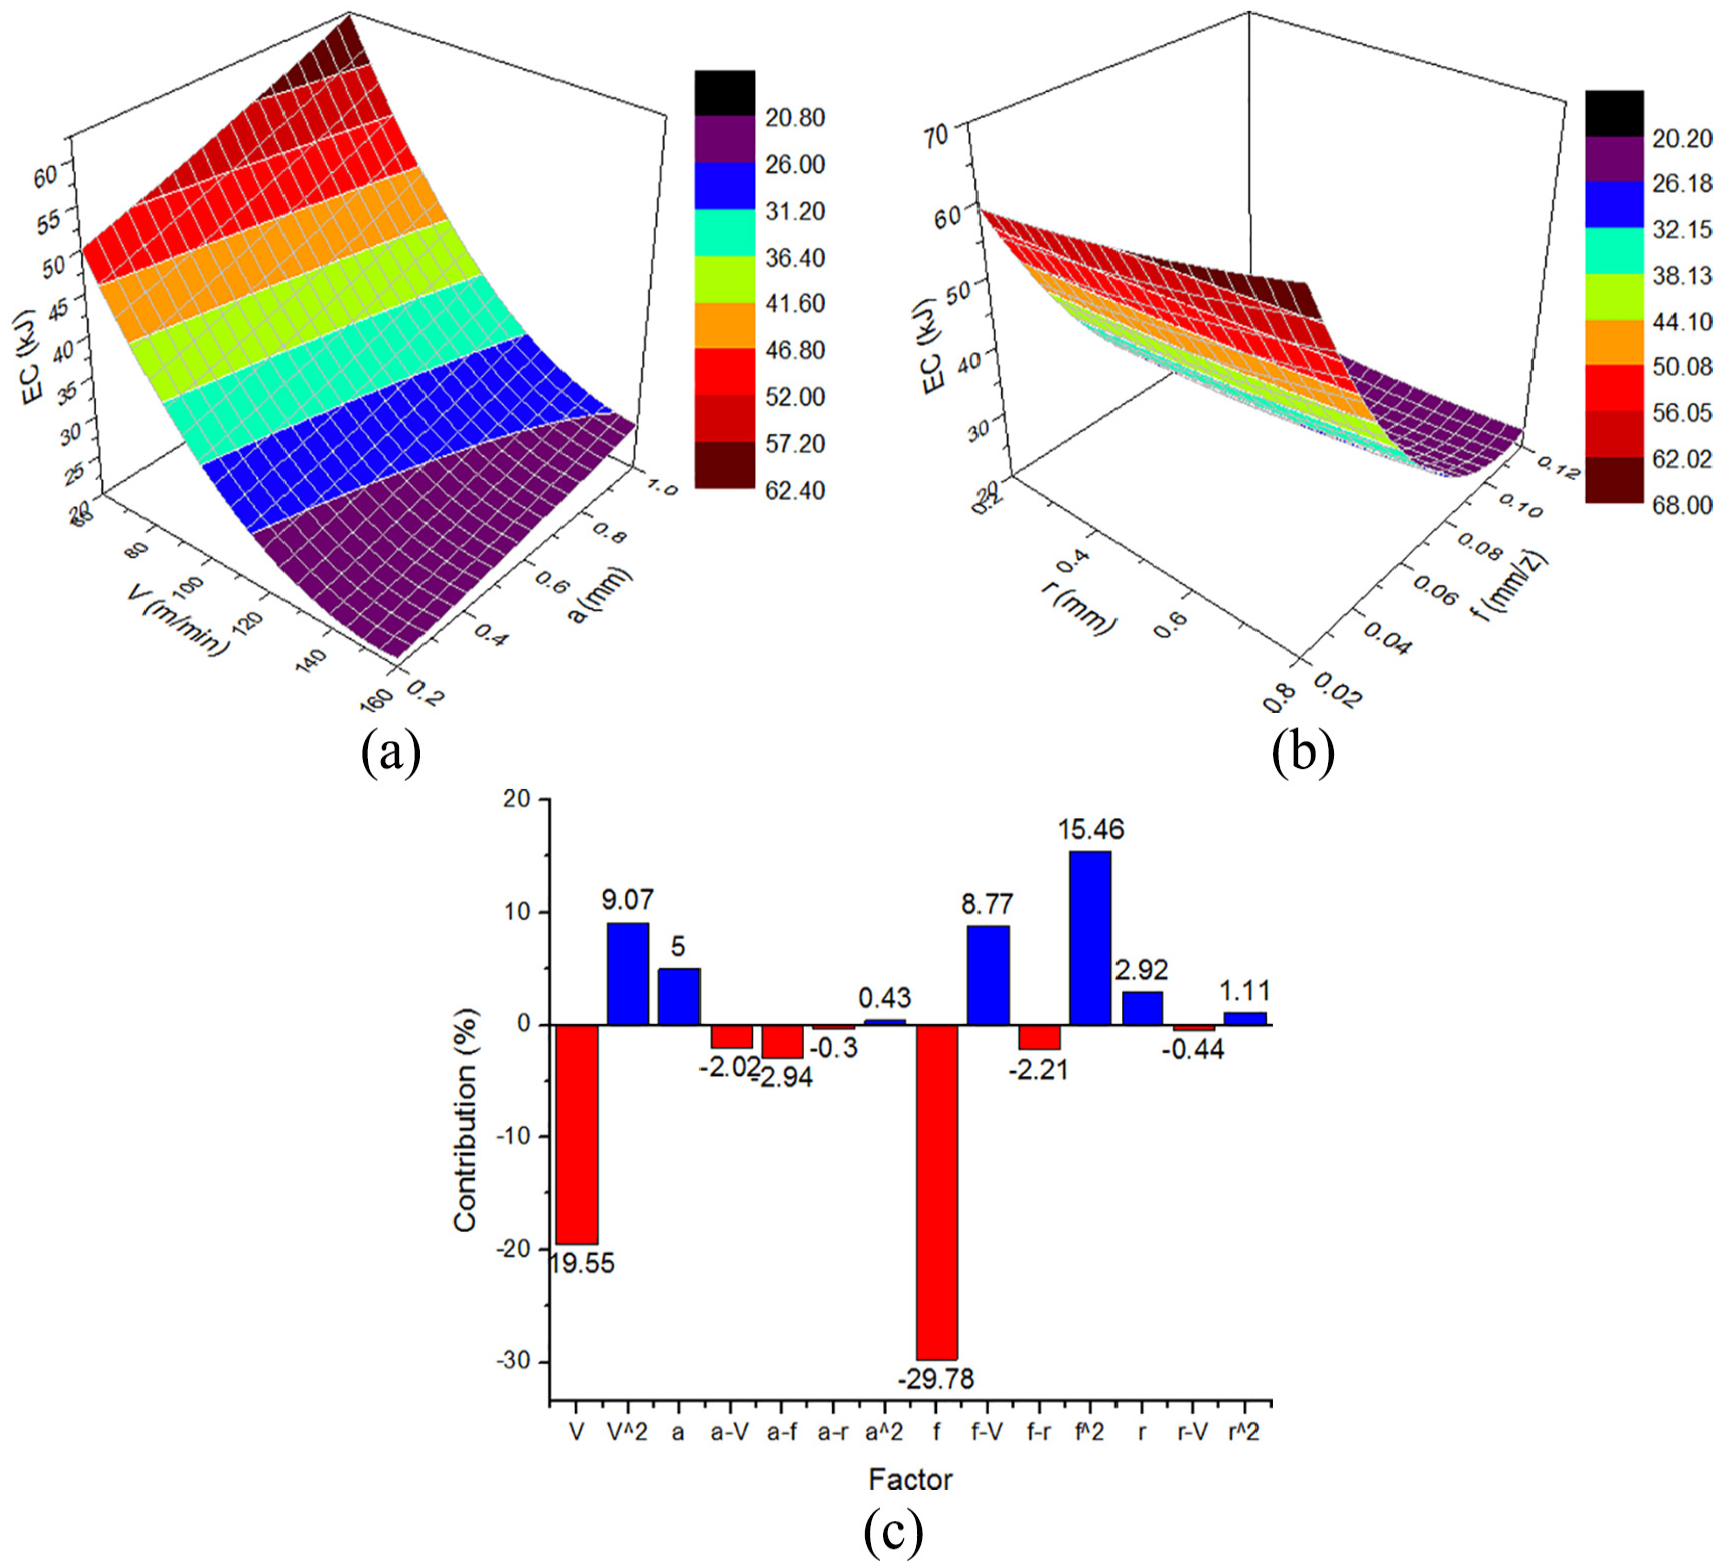
The effects of machining parameters on the EC model: (a) EC versus V and a, (b) EC versus r and f, and (c) parameter contributions for the EC model.
The impacts of the feed rate and nose radius on EC are shown in Figure 10(b). Higher feed rate causes a rise in heat generated on the workpiece surface and tool and may lead to the formation of build-up-edge (BUE). The BUE can increase the cutting forces due to an increment in the contact area between the cutting tool and workpiece, resulting in higher power consumed. In addition, the BUE causes an increase in the cutting tool temperature, which leads to an increase in the mechanical strength of the chip due to the work-hardening behavior. Obviously, higher power consumed is required to detach material. Fortunately, a higher value of the feed rate or cutting speed leads to a decrease in the cutting time, resulting in a reduction in the energy consumed. Reduction in EC with an increase in feed rate and/or cutting speed is logical because it results in faster machining and less processing time. 41 It is inferred from Figure 10(b) that an increased radius leads to an increment in cutting edge; hence, the cutting tool becomes blunt. The degree of the material deformation increases and more energy is required to overcome the resistance friction. 42
In Figure 10(c), it is found that f is the most effective parameter on EC due to the highest contribution regarding single term (29.78%), followed by V (19.55%), a (5.00%), and r (2.92%), respectively. It is observed that EC for the milling process is highly sensitive to feed rate as compared to the cutting speed due to the greater impact of the feed drive motors. As the feed rate increases, the load of the motor on the feed drive systems increases to reach the desired value and higher reaction forces are required. Therefore, the power of movement system increases. The term f2 has the largest contribution with respect to the quadratic terms (15.46%), followed by V2 (9.07%), r2 (1.11%), and a2 (0.43%), respectively.
Figure 11 depicted the influences of machining parameters on the surface roughness. The influences of the cutting speed and nose radius on the surface roughness are shown in Figure 11(a). An increment in the cutting speed leads to a decrease in the strength and hardness of the workpiece due to an increase in the temperature of the cutting region. The chip produced is easily detached from the workpiece, resulting in a reduction in surface roughness. In addition, higher cutting speed reduces cutting forces together with the effect of natural frequency and vibration, giving a better surface finish. Moreover, the possibility of the formation of the BUE at high cutting speed is comparatively lower and thus generates smoother surfaces. An increased radius results in an increment in contact length between the milled surface and tool radius, leading to smaller peaks on the trail. The roughness profile is decreased with a high tip radius, resulting in a smoother surface. In addition, the chatter could be suppressed due to an increment in stand damping with an increased radius. 43
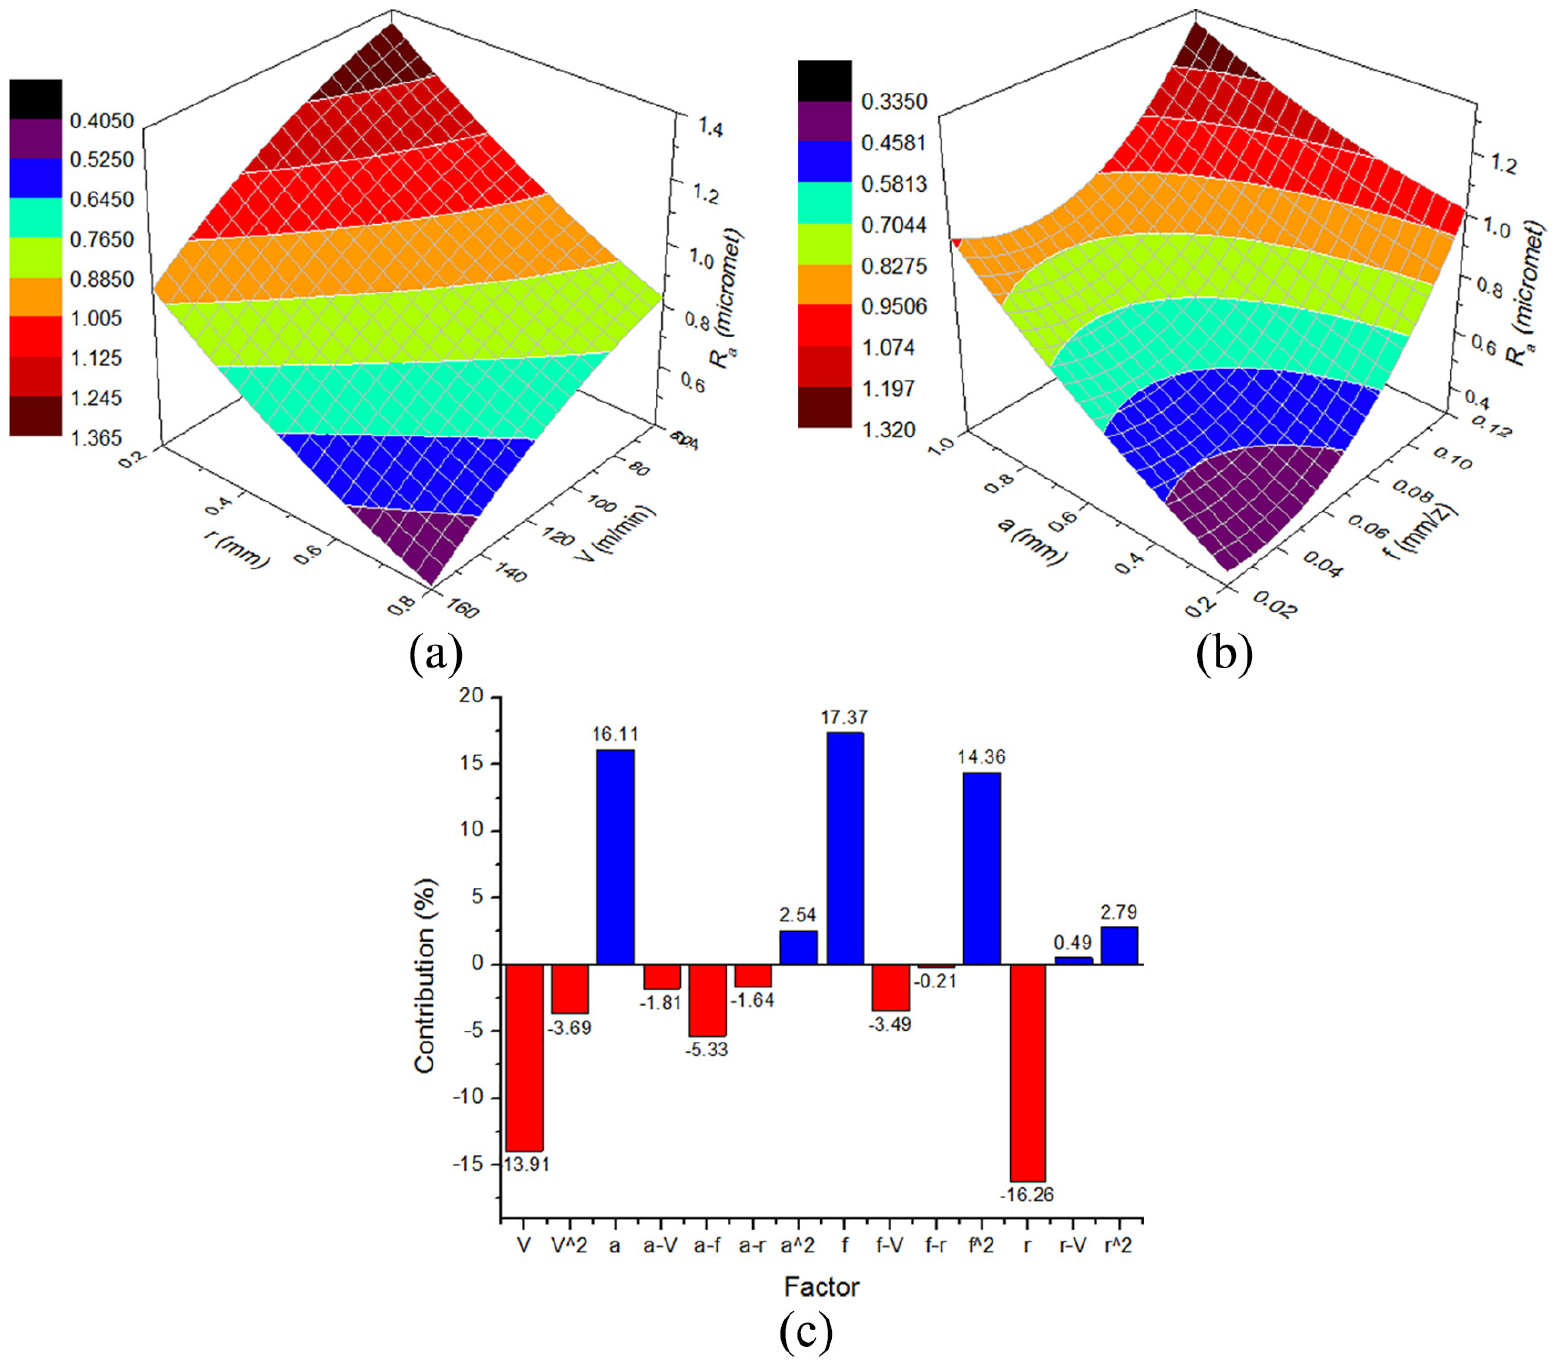
Interaction effects of machining parameters on the Ra model: (a) Ra versus r and V, (b) Ra versus f and a, and (c) parameter contributions on the Ra model.
Figure 11(b) shows that an increased roughness is associated with the increased feed rate and/or depth of cut. At a low value of the feed rate, the distance between the peak and crest of the machined surface is short; hence, a smoother surface is produced. An increase in the feed rate causes higher distance between the peaks generated by the tool grooves left on the milled surface. Therefore, roughness values increase with feed rate due to more feed marks on the machined surface. At a higher value of the feed rate, the BUE can result in grooves formation and increases the degree of the plastic deformation. The machining parts of the workpiece are heavily detached from the surface, leading to a worsening surface. 44 As the depth of cut increases, the contact area between the workpiece and the cutting tool increases, resulting in an increment in the material removal volume and cutting forces. It is also possible that the increment in the cutting forces, due to the increase of depth of cut above the stability lobe, caused chatter in machine tool which eventually resulted in poor surface finish, that is, an increase in surface roughness. 45 Low depth of cut should be used to decrease the tendency of chatter.
Figure 11(c) shows the effects of machining parameters on the surface roughness. As a result, the percentage contributions of the f, r, a, and V are 17.37%, 16.26%, 16.11%, and 13.91%, respectively. All quadratic factors have significant effects, in which f2 is the most influenced factor (14.36%), followed by V2 (3.69%), r2 (2.79%), and a2 (2.54%), respectively.
The effects of different processing factors on the machined surface morphology are exhibited in Figure 12. The machined defects such as pits, voids, and grooves are appeared at low cutting speed, as depicted in Figure 12(a). The smooth cut and small waviness, as well as grooves, are observed at a higher value of the cutting speed (Figure 12(b)). The surface faults, including cracks, grooves, and valleys, are displayed at the highest feed rate (Figure 12(d)), as compared to the lowest one (Figure 12(c)).
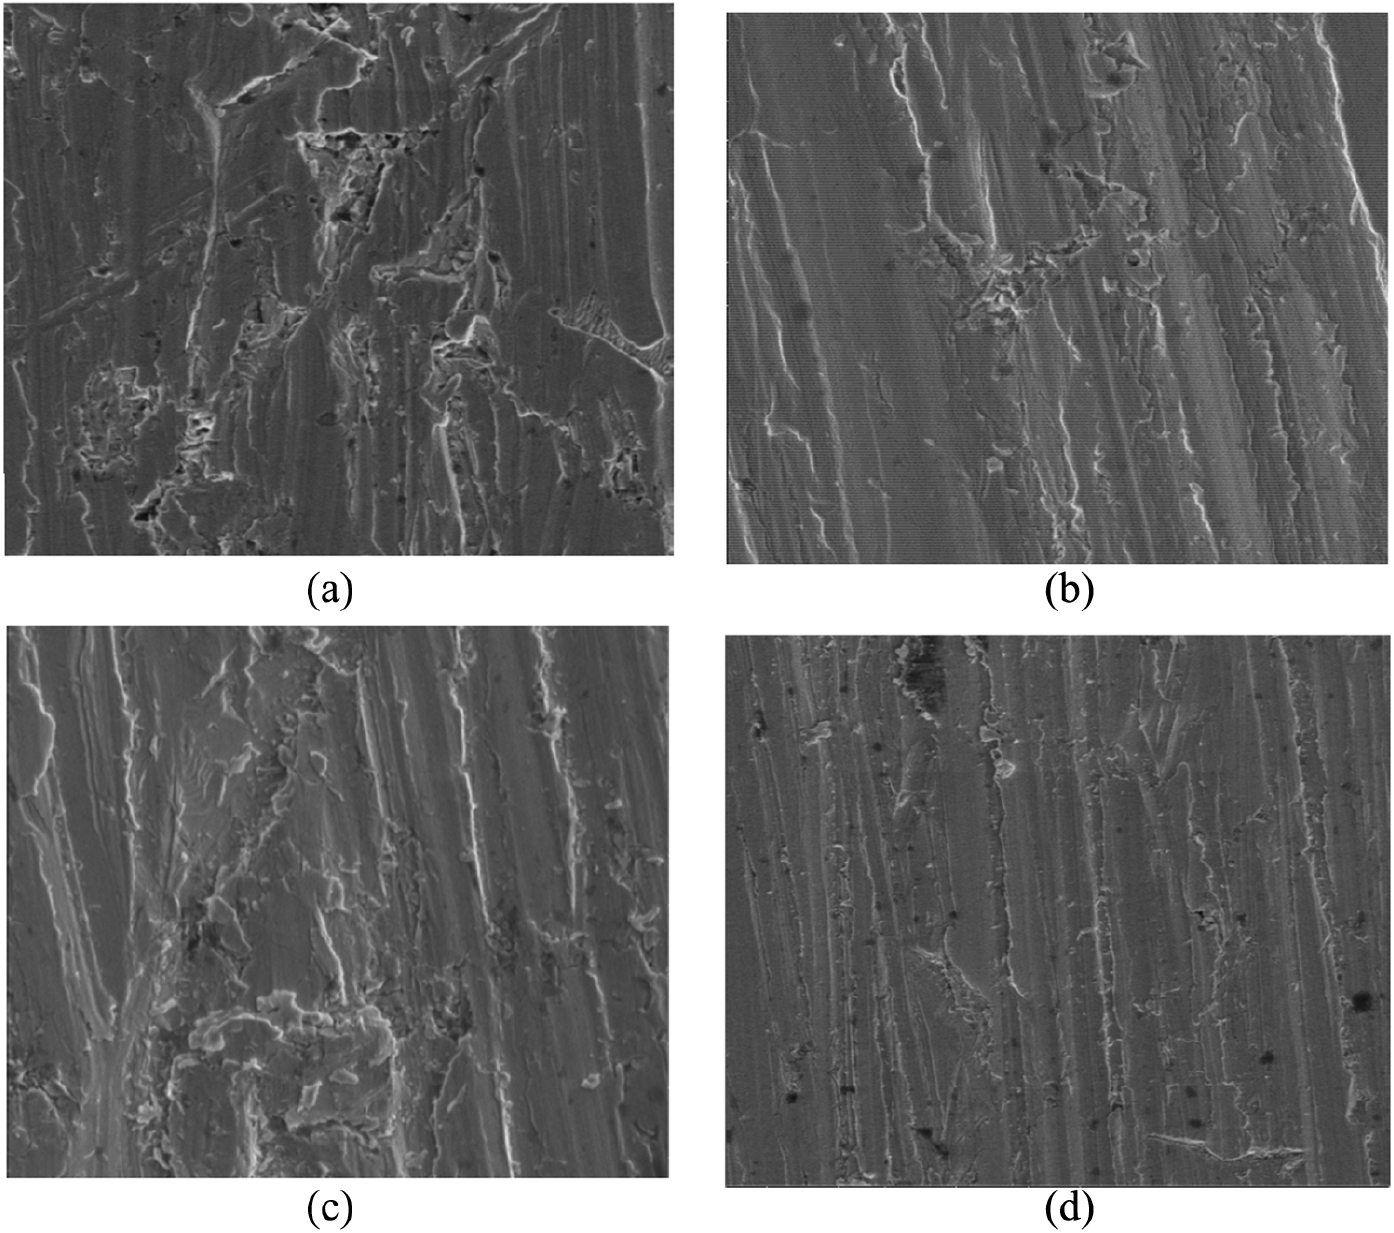
SEM of surface morphology at various conditions: (a) Experiment no. 4, (b) Experiment no. 12, (c) Experiment no. 1, and (d) Experiment no. 7.
The wear behaviors of the inserts at various machining conditions are shown in Figure 13. As depicted in Figure 13(a), the wear pattern is not much prominent, no groove or skin depletion. However, when the feed rate was increased, the wear pattern shows crater wear on the rake face, associated with edge chipped off—the fracture of cutting edge. To support this, it can be seen from Table 2, the PF is increased from 0.566 to 0.752 (32% increase), and the resulted surface roughness increased from 0.98 to 1.55 (58% increase). An increased input leads to a higher temperature at the nose region, which causes excessive pressure and stress. The deformation of the cutting edge is increased with an increment in the factor, leading to the reduction of the hardness of the tool.
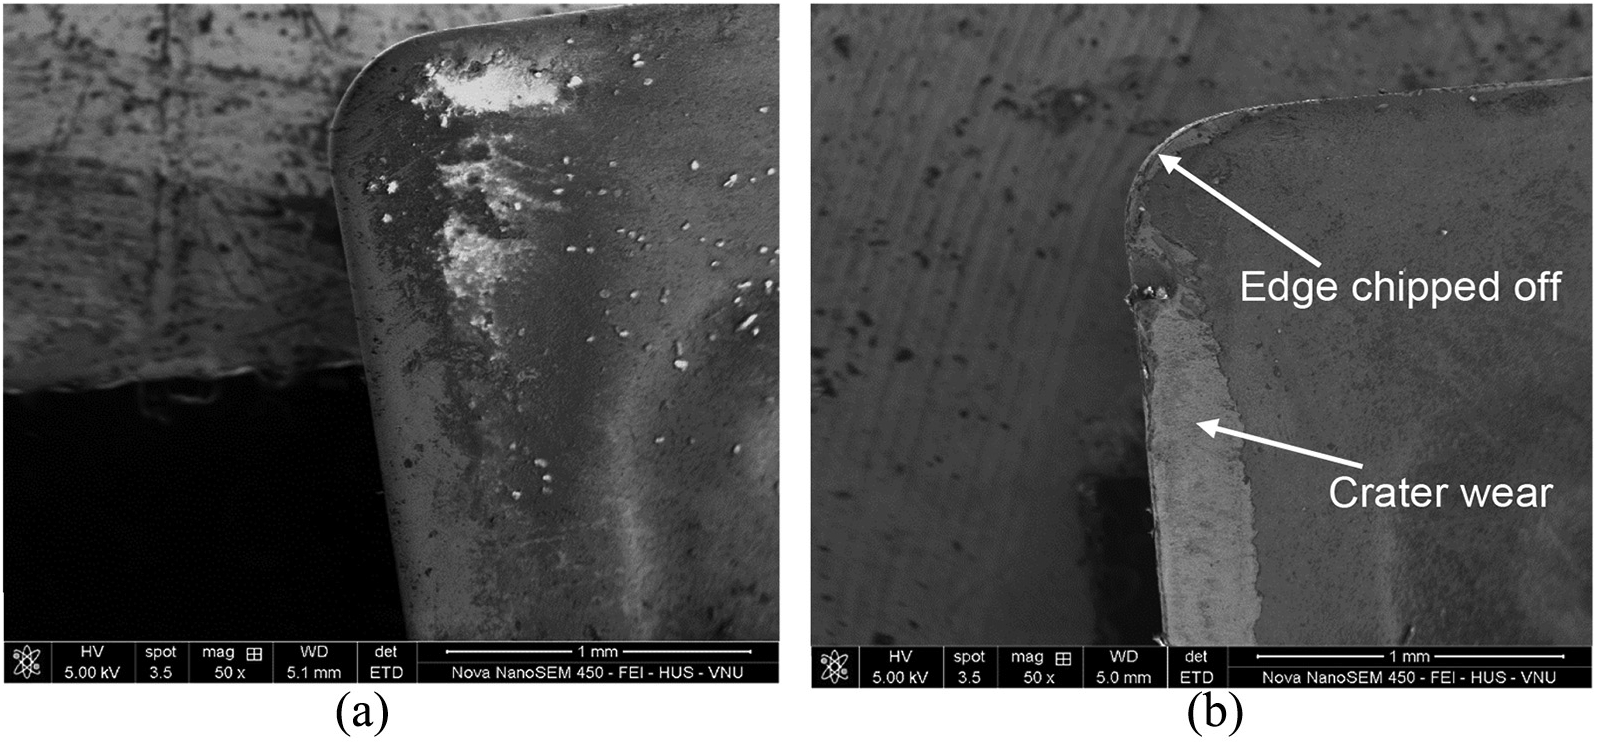
SEM images of the worn tool’s rake surface at various machining conditions: (a) Experiment no. 16 and (b) Experiment no. 20.
Optimal results
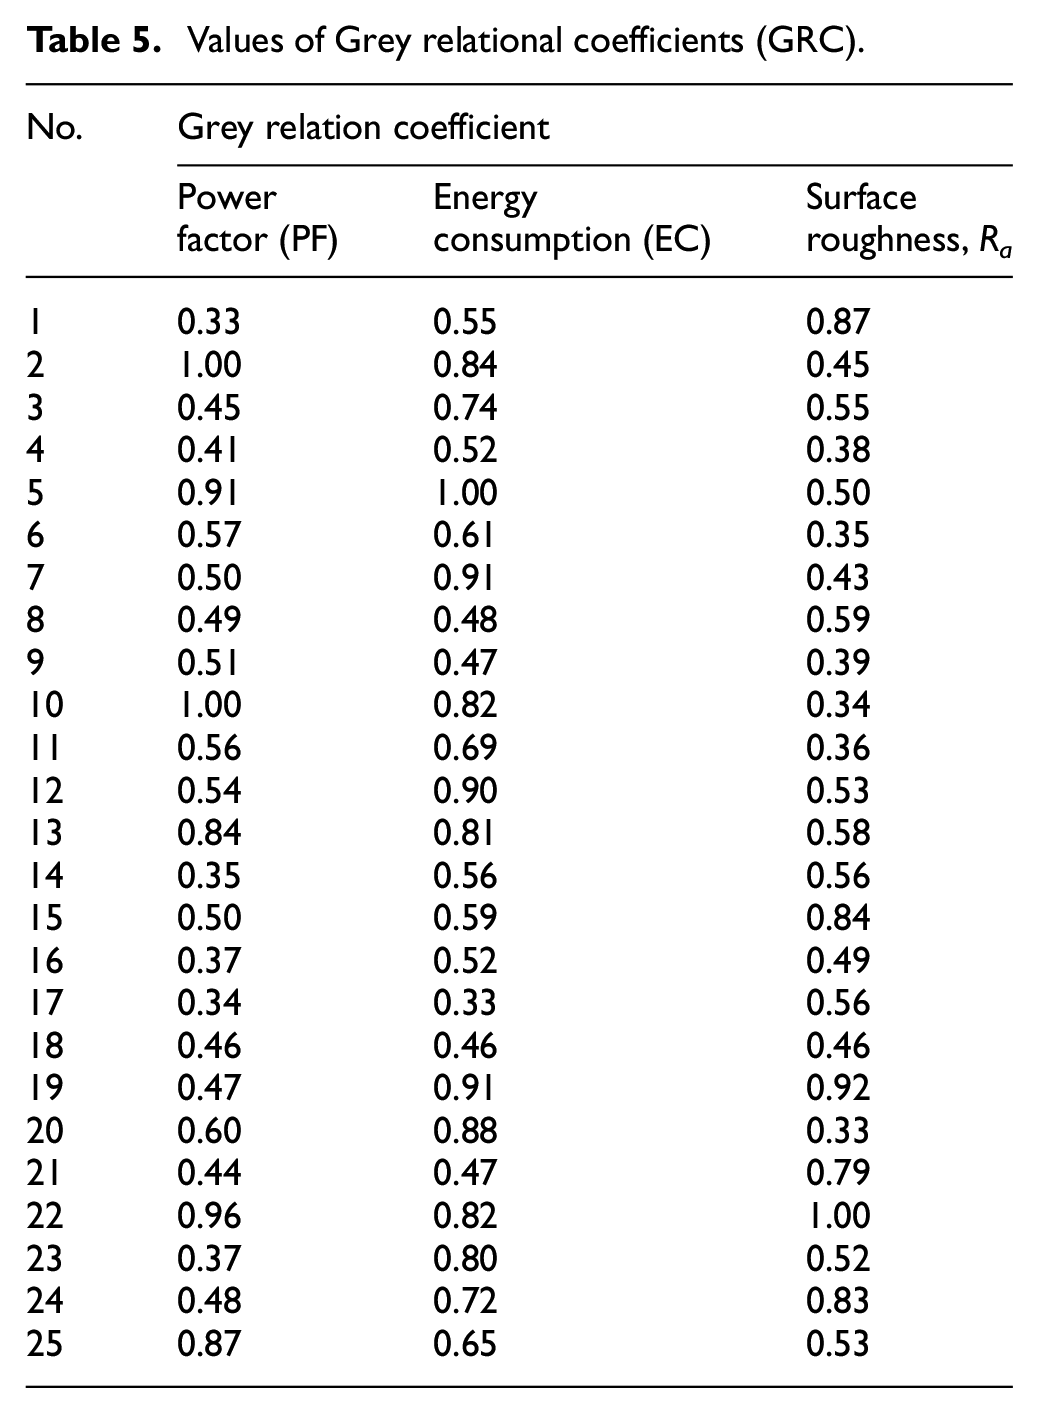
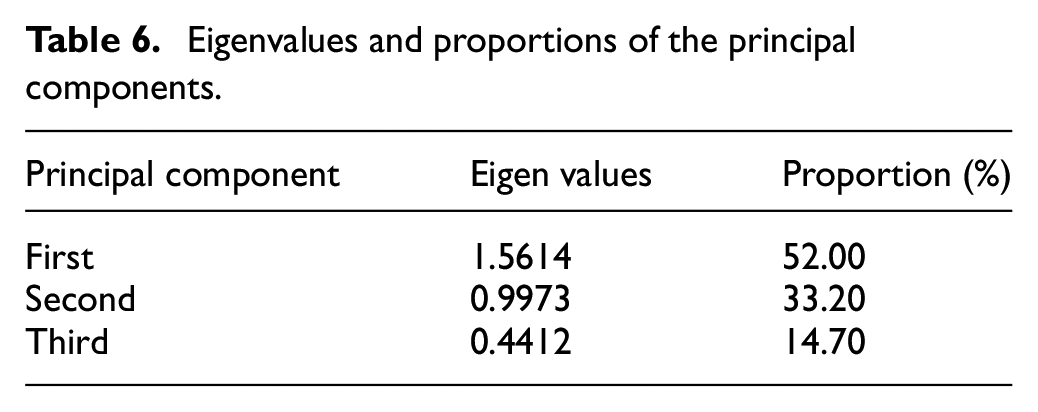
The pre-processing and corresponding values for two objectives after a linear normalization are listed in Table 4. The values of the GRC are shown in Table 5. As depicted in Table 6, the percentage contribution of the first principal component is 52.00%, followed by the second component (33.20%) and the third one (14.70%), respectively. The weight values are calculated based on the squares of subsequent eigenvectors of the three principal components. Table 7 revealed that the weight values of the PF, EC, and surface roughness (Ra) using the PCA method are 0.32, 0.35, and 0.33, respectively.
Pre-processed and deviation results.
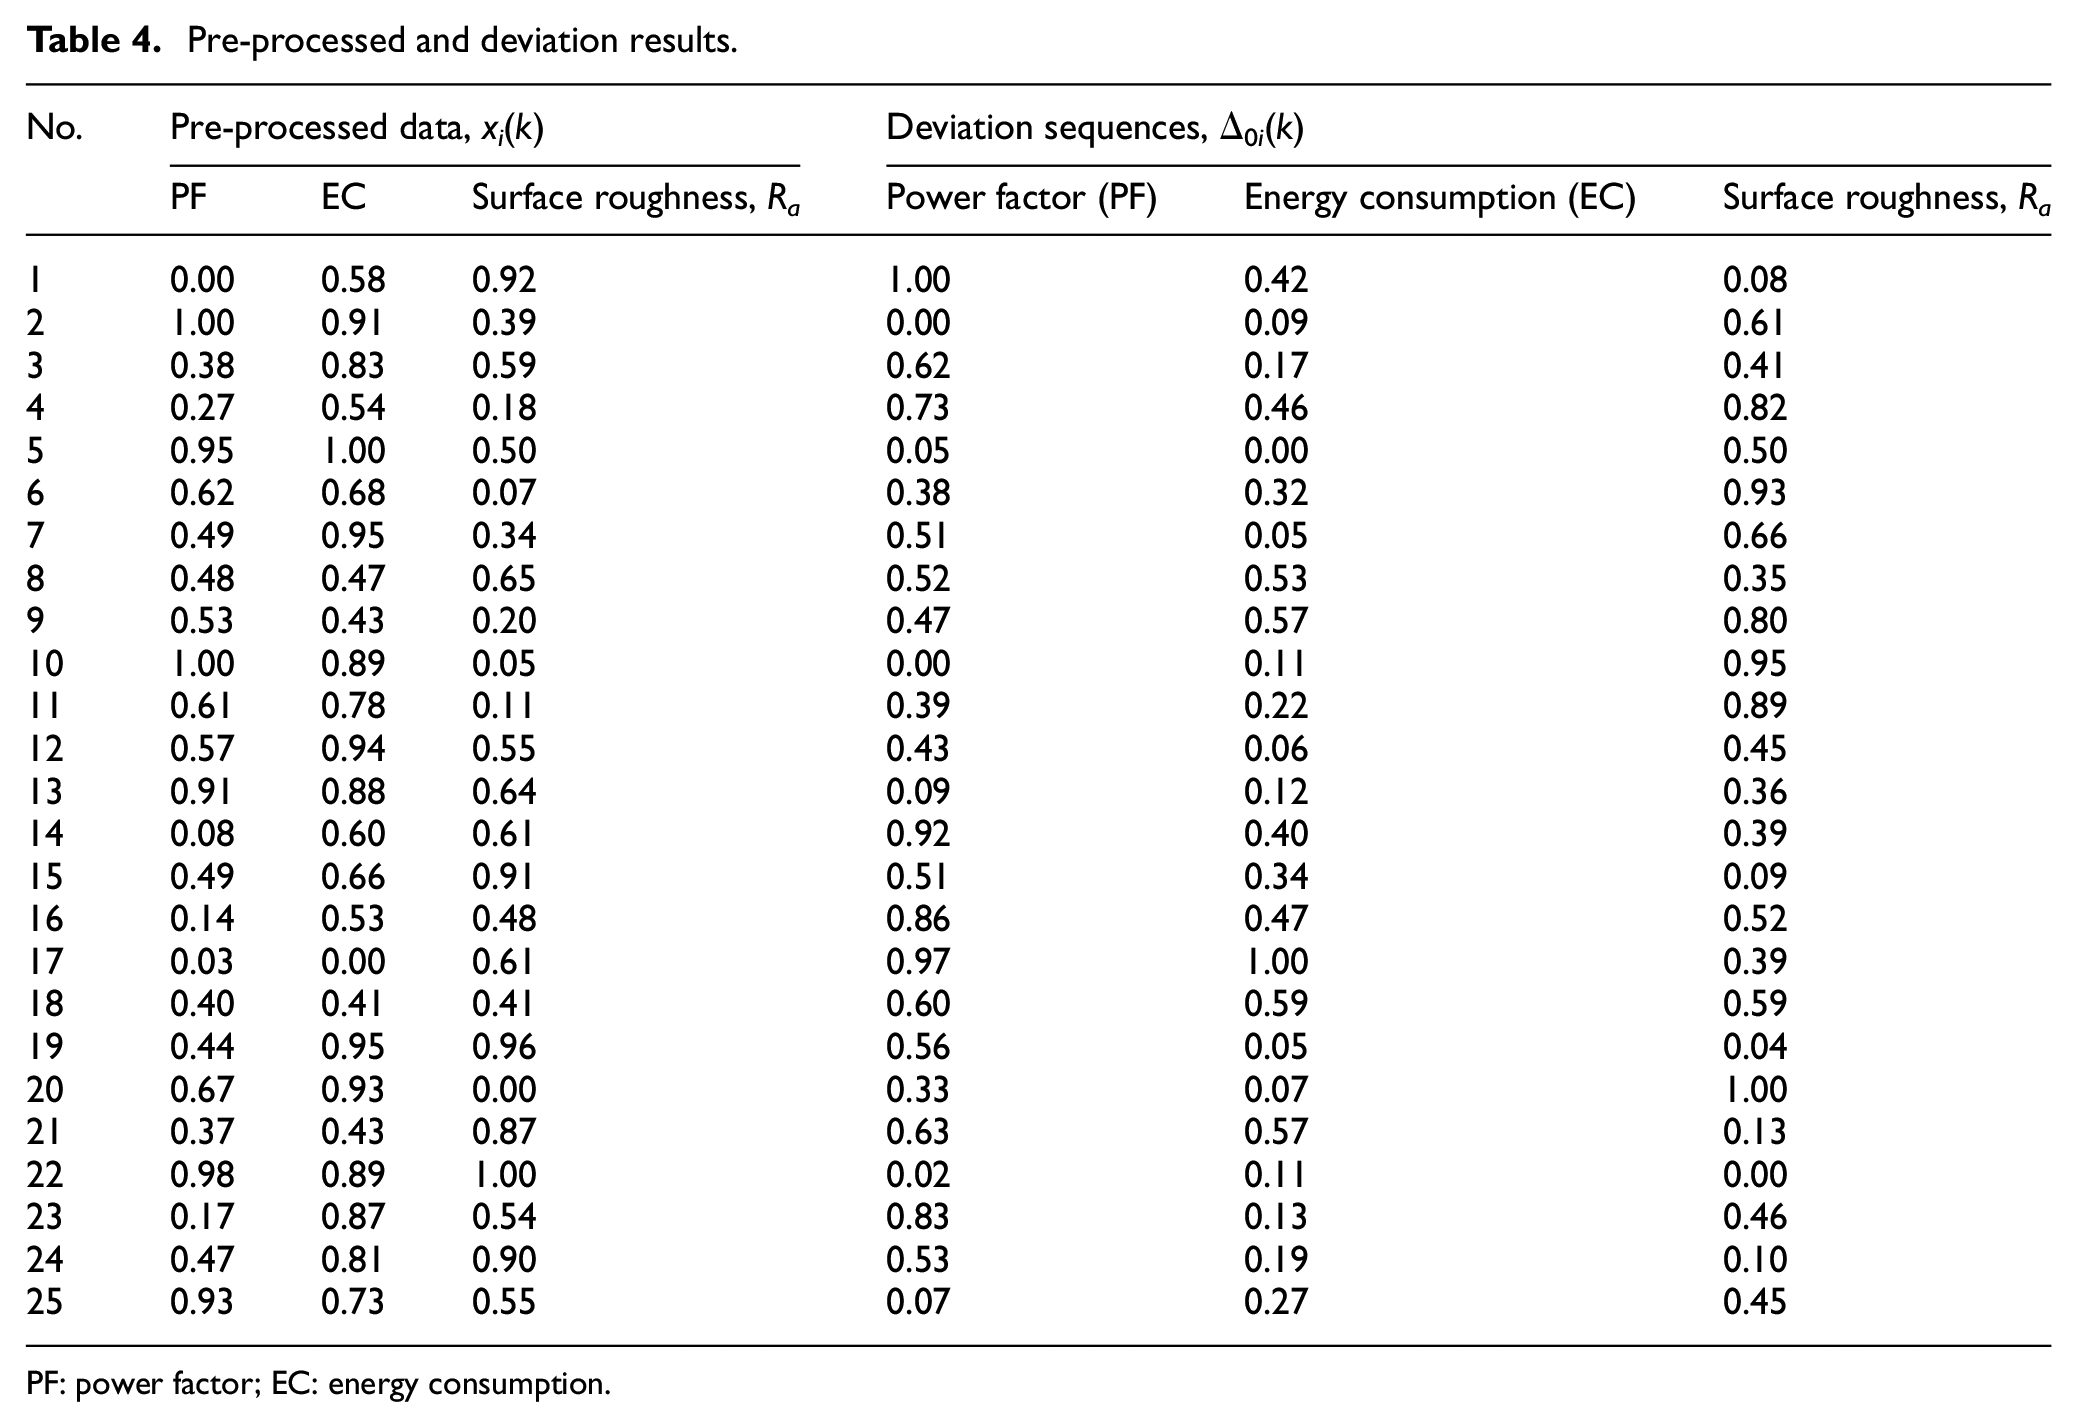
PF: power factor; EC: energy consumption.
Values of Grey relational coefficients (GRC).
Eigenvalues and proportions of the principal components.
Eigenvectors and contributions for the principal components.
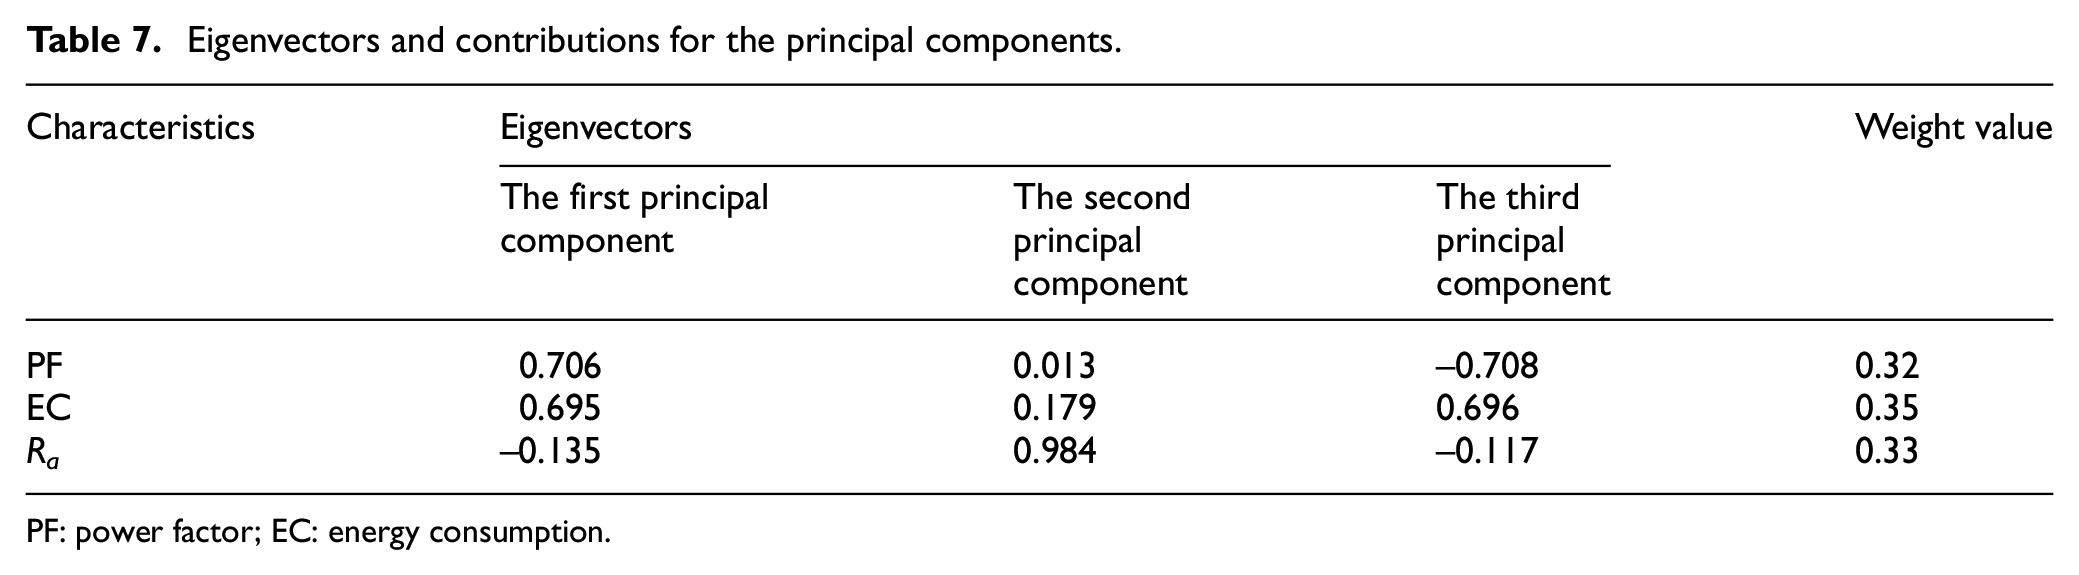
PF: power factor; EC: energy consumption.
The mathematical formulas showing the relationship between inputs and outputs are used to find optimal parameters with the support of the DA. A total of 29 optimal results are observed and the point with the D values close to 1 is the best solution. The optimal values of the inputs are shown in Figure 14(a). The values of the desirability are depicted in Figure 14(b). The desirability of 0.97515 revealed that the optimal results observed are reliable and feasible. As revealed in Table 8, the reduction of the EC and Ra are about 34.85% and 57.65%, respectively, while the PF increases around 28.83%, as compared to the initial values.
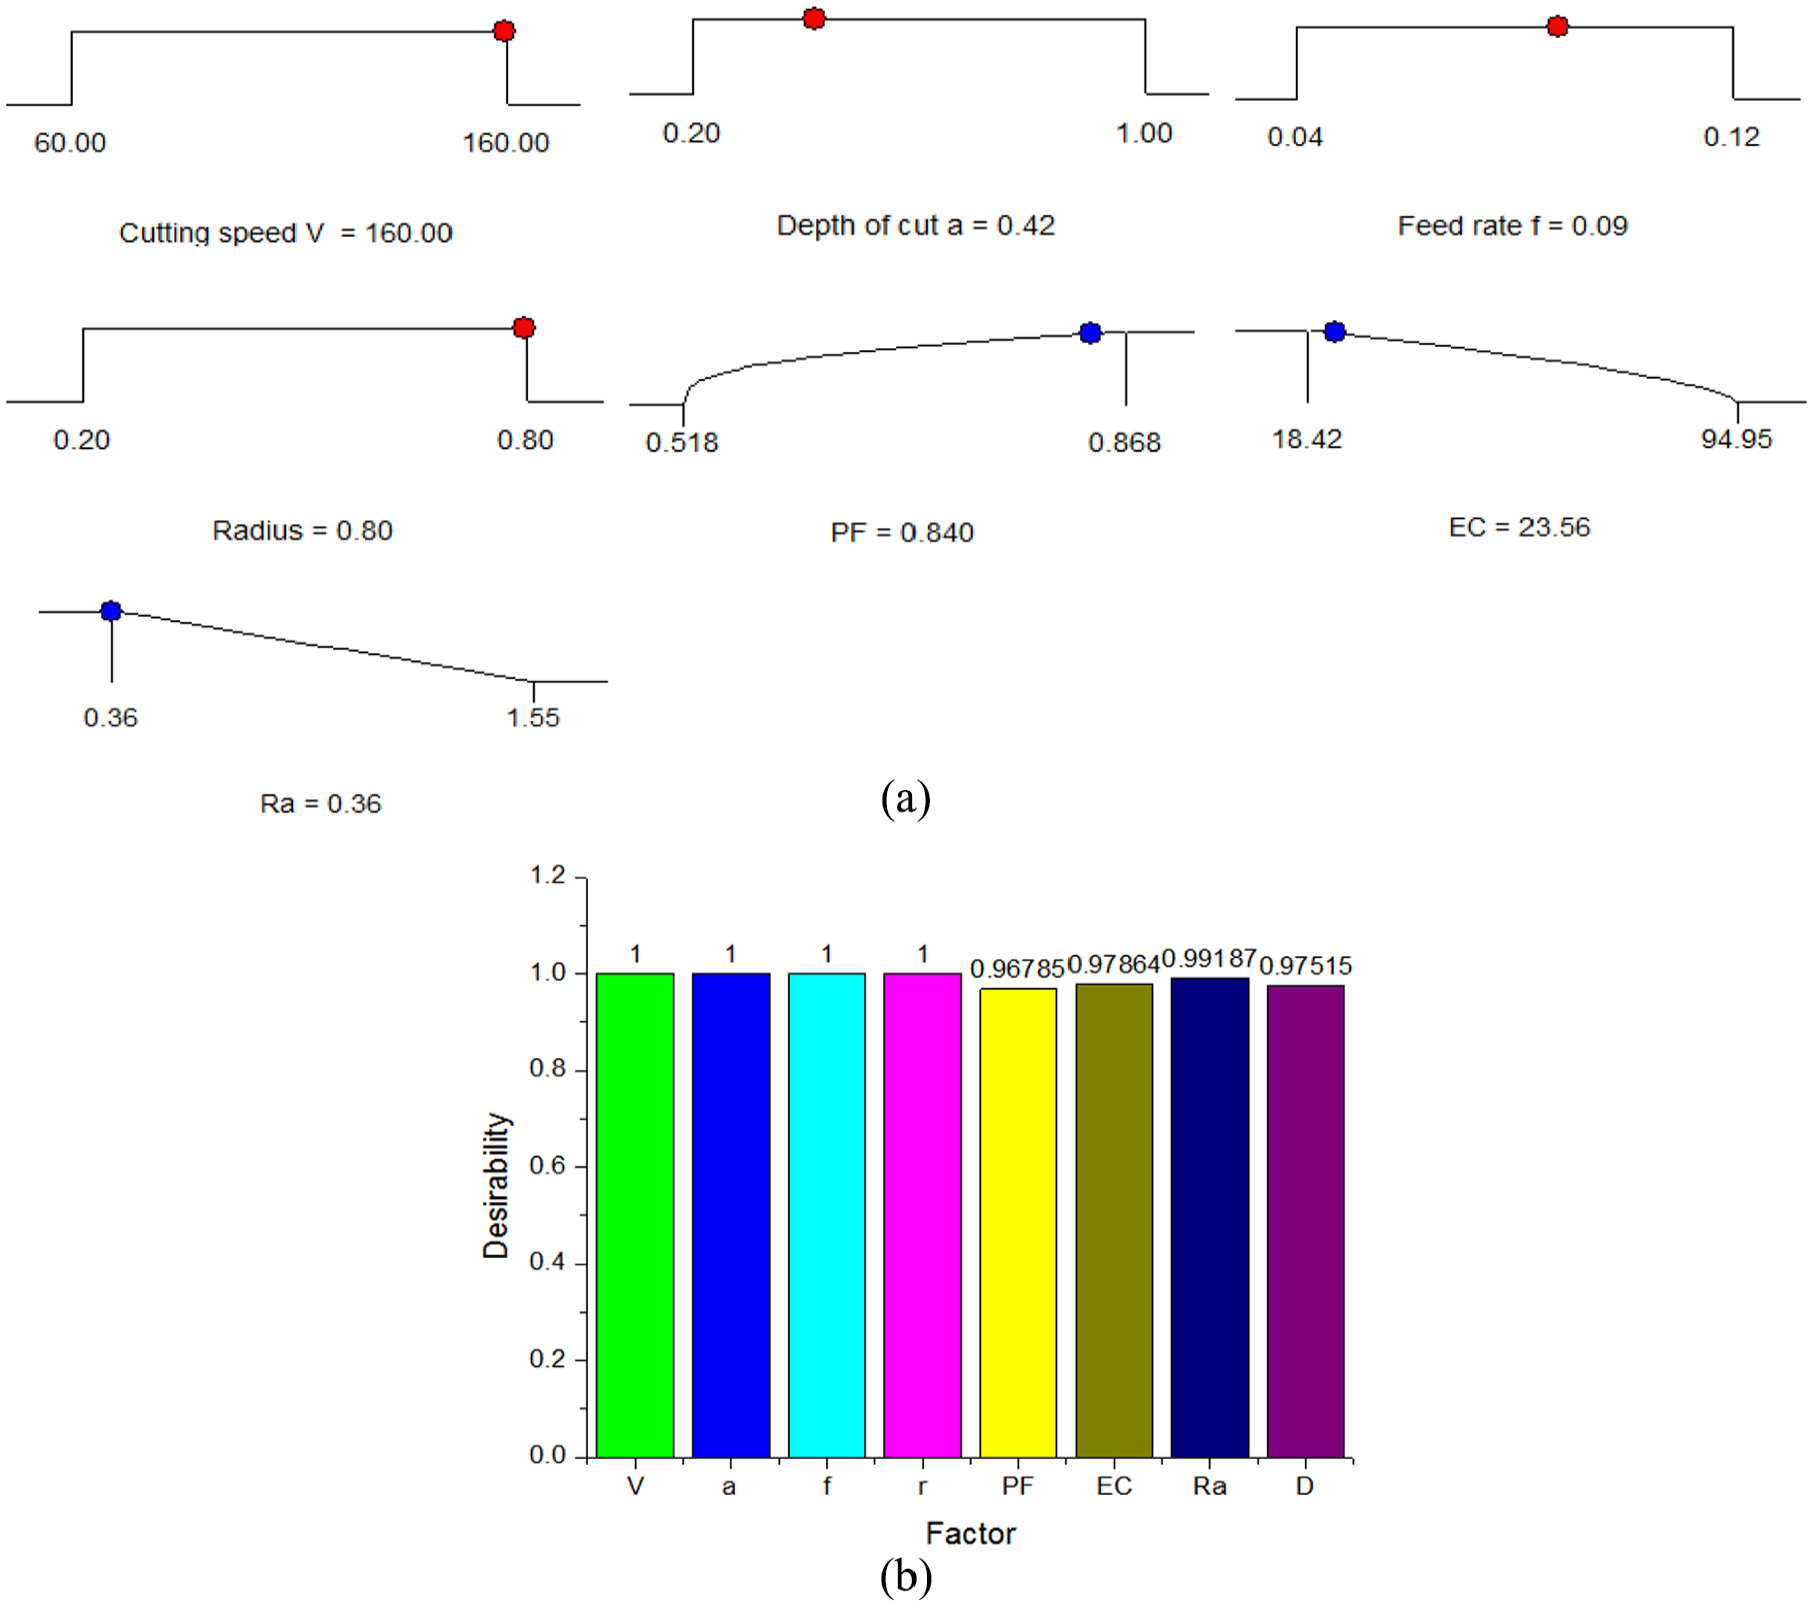
Optimization results generated by DA: (a) optimal values and (b) bar graph of the desirability.
Optimization results.
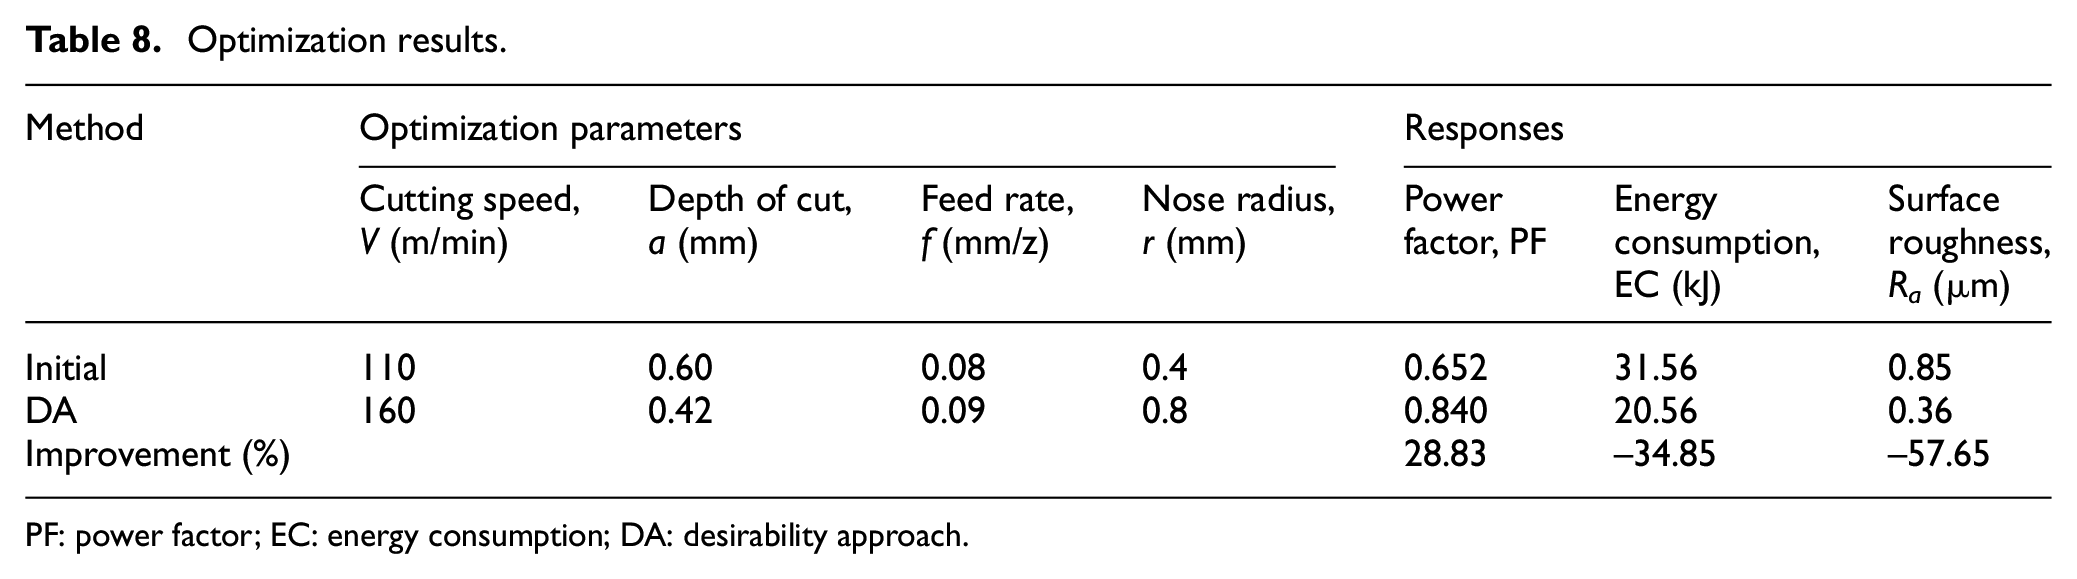
PF: power factor; EC: energy consumption; DA: desirability approach.
To evaluate the effectiveness of the proposed approach, a confirmatory experiment is conducted at the optimal solution. The experimental results are exhibited in Figure 15. The comparative results are shown in Table 9. The small errors (below 5%) indicate that optimal results are strongly correlated with the experimental data. The similar ranges for the predictive errors can be found in the previous works.46,47 Therefore, the developed approach can be effectively applied to the optimization of different milling processes.
Results of confirmatory experiment.
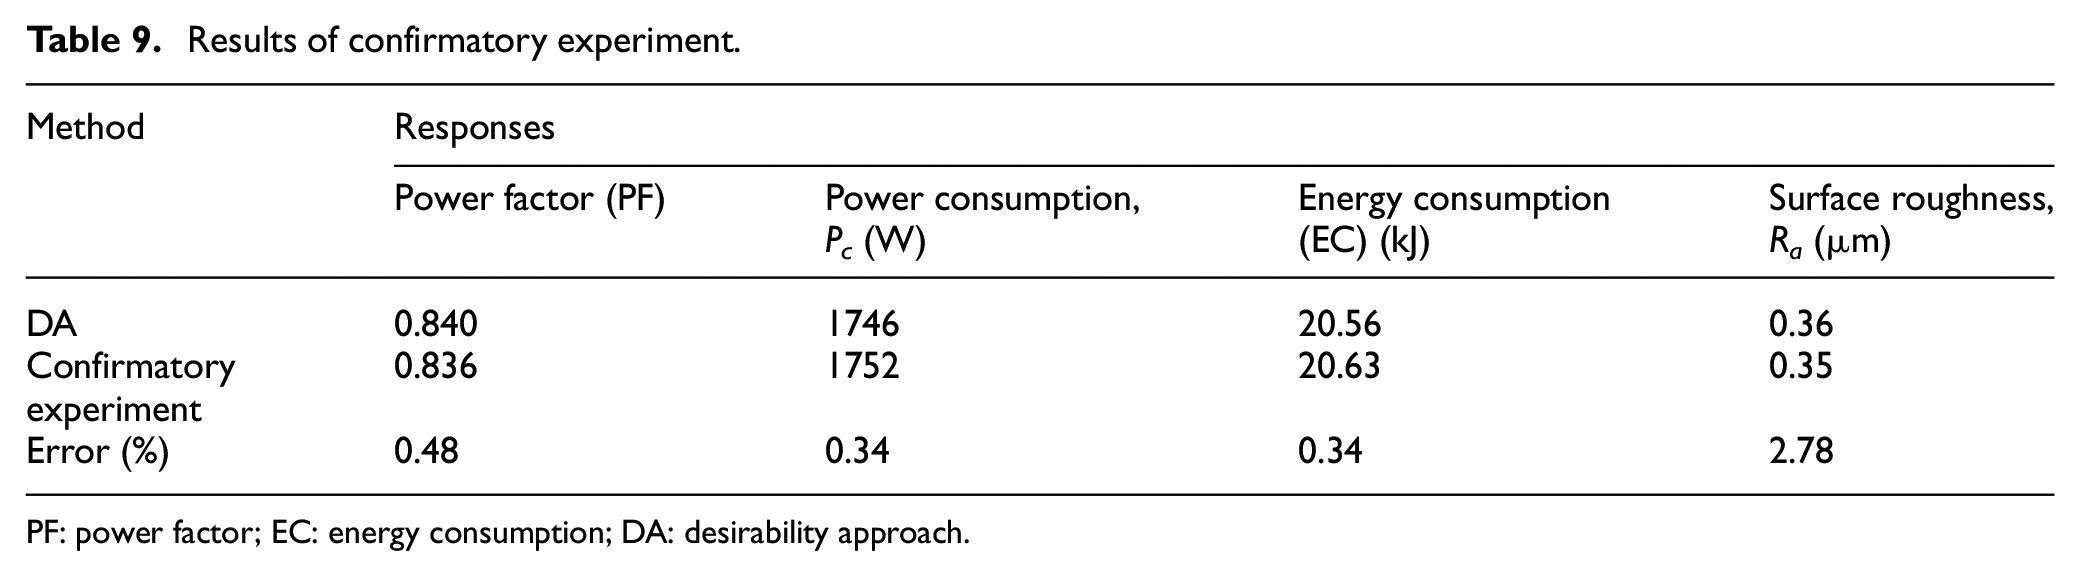
PF: power factor; EC: energy consumption; DA: desirability approach.
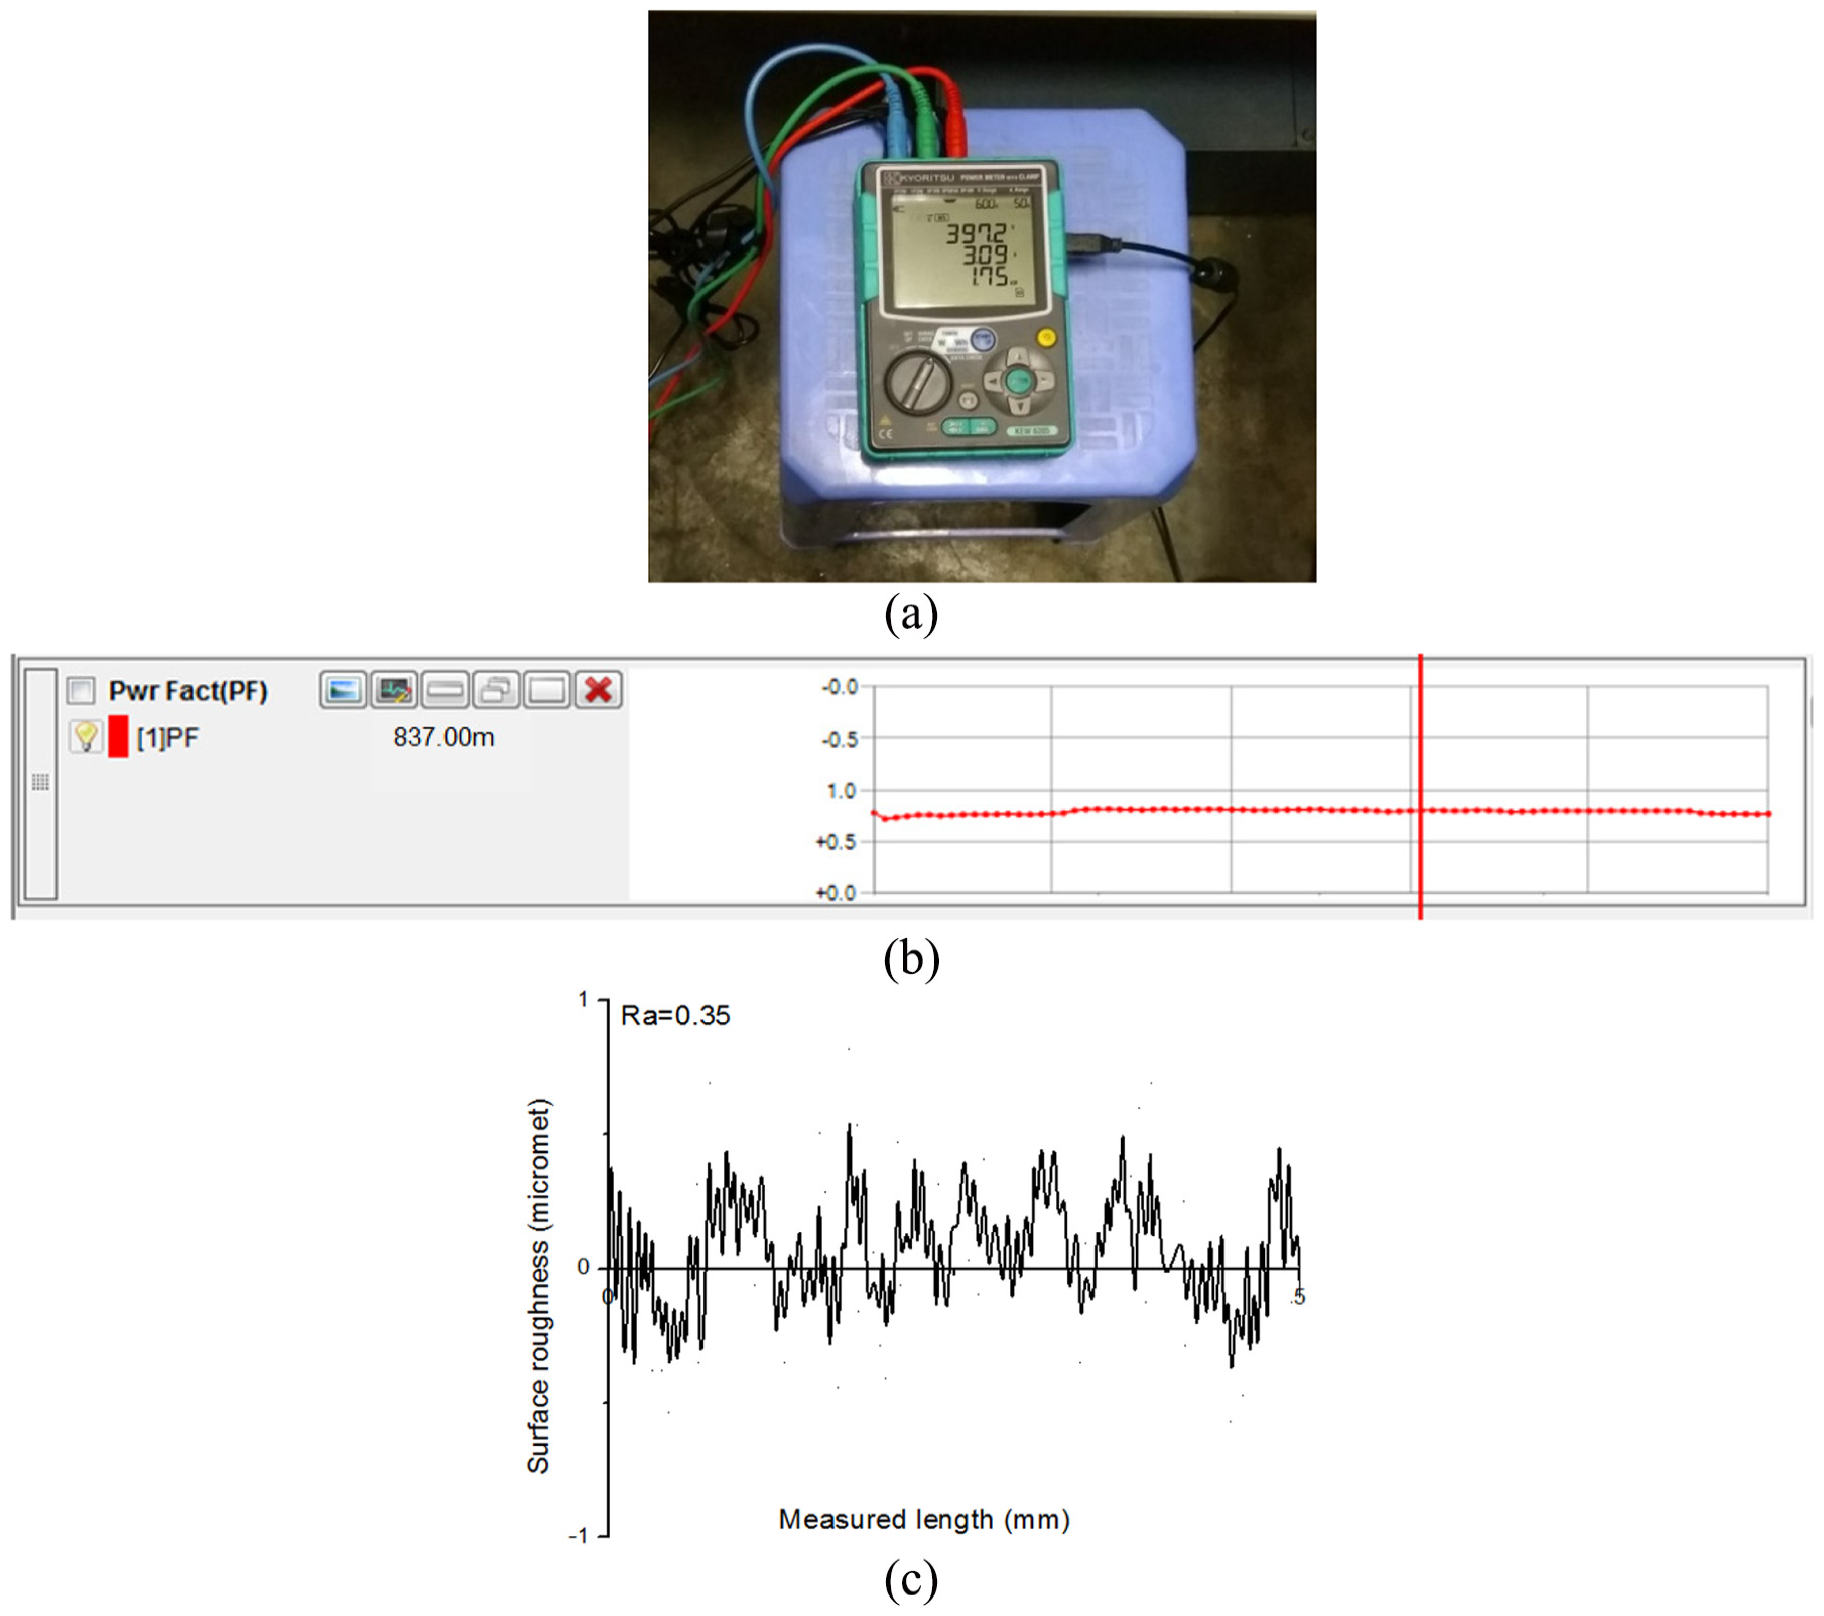
Experimental results at the optimal solution: (a) power consumed, (b) power factor, and (c) surface roughness.
As mentioned in the previous section, wet machining with liquid coolants is normally used in metal-machining operations and processes to reduce the temperature of both workpiece and tool and to evacuate chips from the cutting area. However, the heavy use of coolant fluids is not cost-effective and causes poor environmental impacts, especially there are more and more concerns regarding safety and environmental legislations applied in manufacturing industries, with emerging trends toward sustainable manufacturing. Today, DM is considered as one of the eco-friendly machining processes, with good environmental impacts and cost-effectiveness. DM is becoming more prevalent, and it also helps to increase tool life when machining the steels, cast iron, and some stainless materials. There have been emerging needs and growing efforts to investigate optimal machining process parameters for the DM operations. This study focuses on the optimization of the machining process parameters, aimed to enhance simultaneously the PF, EC, and surface roughness. A study did take into account not only the technical issues related to the machining process quality (surface roughness) but also environmental impacts and sustainable manufacturing ones: maximizing the PF and decreasing the EC. A specific case study of DM of stainless steel 304 was successfully implemented to investigate optimizations of the machining process parameters and cutting tool’s geometry for simultaneous improvements of the PF, EC, and surface roughness (Ra). The outcomes and findings of the investigated work in this study can be used for further research in sustainable design and manufacturing as well as directly used in the knowledge-based and expert systems for dry milling applications in industrial practices.
Conclusion
This article presents a multi-response optimization which aims to simultaneously enhance the PF, decrease the EC, and improve the machining quality via reduction of the surface roughness (Ra), for the specific case of DM of stainless steel 304. The RBF models of three technical responses were developed in terms of the machining process parameters, including the cutting velocity (V), feed rate (f), depth of cut (a), and tool nose radius (r). An integrative approach, including the Grey relation analysis (GRA), the PCA, and DA, was used to calculate the weight objectives and predict the optimal values of machining process parameters (cutting velocity, feed rate, depth of cut, and tool nose radius). The key conclusions of this study can be presented as follows:
The RBF models for the PF, EC, and surface roughness (Ra) have R2-values of 0.9954, 0.9921, and 0.9938, respectively. This indicates a good agreement between the predicted and experimental values. The proposed optimization models adequately exhibit the nonlinear relationships among process parameters and machining responses or technical outputs (PF, EC, and surface roughness). The developed correlations can be used to predict the optimal machining process parameters with a sufficient accuracy when dry-machining of stainless steel 304.
It can be concluded that the processing conditions, including the cutting speed (V), depth of cut (a), feed rate (f), and tool nose radius (r), have significant impacts on the technical outputs, including PF, EC, and surface roughness (Ra). In order to increase the PF, the maximal levels of the process parameters are recommended for utilization. The highest values of the cutting speed and feed rate can be used to save the EC, while the lowest levels of the depth of cut and nose radius cause a decrease in consumed energy. The low values of the depth of cut and feed rate are recommended to decrease the surface roughness. The highest levels of the tool nose radius and cutting speed can be used to get a smoother surface.
The selection of the weight of objectives could give a better solution to determine the optimal machining process parameters. The optimal values of cutting speed (V), depth of cut (a), feed rate (f), and tool nose radius (r) are 160 m/min, 0.42 mm, 0.09 mm/z, and 0.8 mm, respectively. The PF improves about 28.83%, and the EC and surface roughness decrease approximately 34.85% and 57.65% at the optimal solution using the weight values generated by PCA.
The hybrid approach including the RBF models, GRA, PCA, and DA can facilitate the optimization of the milling process; this approach gives a reliable optimal solution, as compared to using practical experience or operation guide.
Practically, the variation of the inputs (process parameters: cutting speed, depth of cut, feed rate, and tool nose radius) may lead to a conflict or contradictory impacts on the outputs (PF, EC, and surface roughness) in dry milling. In this way, a comprehensive optimization should be considered with more objectives, such as surface properties, tool life, and machining productivity.
Footnotes
Appendix 1
Declaration of conflicting interests
The author(s) declared no potential conflicts of interest with respect to the research, authorship, and/or publication of this article.
Funding
The author(s) disclosed receipt of the following financial support for the research, authorship, and/or publication of this article: This research is funded by Vietnam National Foundation for Science and Technology Development (NAFOSTED) under grant number 107.04-2017.06. This work was also supported by a Researcher Links workshop grant, 2017-RLWK9-11081, under the Newton Fund Vietnam Programme partnership. The grant is funded by the UK Department of Business, Energy and Industrial Strategy (BEIS) and delivered by the British Council. For further information, please visit ![]() .
.