
Abstract
Installation of aircraft wing systems is a bottleneck in the assembly process. This phase is typically composed of many work packages, taking hundreds of man-hours per wing. In addition to this volume of work, tasks are specialized and completed in a difficult environment in terms of access and visibility. In current industrial practice, the wing is mounted horizontally on a transport trolley, which exposes the workforce to prolonged periods of overhead working. Future wing designs may consider a pre-equipping build philosophy, where systems are installed to major structure assemblies before the wing box is assembled. This allows for a change in the orientation and position of the major structure and provides new freedoms in assembly station design and layout. This research presents results of experiments to investigate manual assembly performance of aircraft wing systems, under varying wing structure orientation. A mock-up of a section of an A320 aircraft wing front spar, mounted on a rotation device, functions as the testbed. Manual installation activities are then conducted to emulate real aircraft system equipping for electric harnesses, raceways and hot air ducts. The results show a best-case assembly performance change of 36% for electric system installation activities of cable harnesses and raceway housing components. Tilted and horizontal orientations of the structure show the highest time reductions, with the vertical orientation either non-conclusive or increasing the assembly time. The outcomes of this study are intended to aid in effective trade-off decision making for future wing systems and assembly station layouts from the perspective of structural orientation and assembly task interaction.
Introduction
Installation of aircraft wing systems is a highly specialist manual assembly activity, completed in an environment with restricted access and visibility. In a traditional build philosophy, the major structural components of the wing are assembled and the wing-box is complete before the systems are installed.1,2 Typical components installed in the wing include electric harnesses and hydraulic pipes, fastened along the front and rear spar, as well as fuel pipes, valves and pumps in the wing tanks. For relatively small wings, such as single aisle or business jet aircraft, work inside the wing tank and the leading edge D-nose is difficult. A wing-box is traditionally located horizontally on a trolley during systems assembly tasks, which means that assembly operators must raise their arms and neck and work overhead for extended periods. Studies have shown overhead work to be inefficient from a performance and fatigue viewpoint.3,4 In addition, operators are exposed to an increased risk in musculoskeletal disorders due to their poor body posture.5,6
The increased pressure on current aircraft manufacturers to achieve high-rate production has led to investigations into improvements in assembly methods, changes to build philosophy and re-design of systems and structure to improve assembly performance.7–10 Automating structural assembly tasks has received significant research attention, with accurate metrology and component positioning solution being a key enable for any automated processes.11,12 In comparison, automation of systems assembly tasks is more difficult due to their complexity, varying access conditions and part handling. A proposal to increase production rate in the near term and enable automation in the far term pre-equips the major structural components with systems components before the wing-box is completed, 13 mimicking common practice in the automotive and other industries.14,15 Such a change provides additional freedom to organize the pre-equipping station and position the structural components. Any proposed changes to sub-assembly processes must be evaluated in aircraft assembly simulation frameworks to establish their impact on production rates. 16 The assembly times and learning rates are key unknowns, which are often estimated with empirical or motion time measurement models.17,18 Such methods may fail to include factors which increase manual assembly performance, such as the working position and orientation, access and ergonomic operator posture.19–21 The impacts of these factors are preferably assessed through experimental trials. Published research on experimental trials for manual assembly performance in the field of aerospace is limited. Therefore, experimental studies from other disciplines are reviewed and linked to the objectives of this research.
In the field of component handling and picking operations, experimental research has focused on ergonomic aspects and picking performance due to container size, position and orientation.22–24 Such containers hold parts required by the assembly line and their characteristics can impact manual assembly performance significantly. Important contributors to picking performance are the container size and its angle of exposure. Picking from tilted and smaller containers is beneficial in comparison to picking from horizontal and larger ones. The tilt angle of a container during picking is somewhat comparable to a change in component orientation during manual assembly. However, the system installation activities have a longer time of exposure to the orientation and tasks are more complex from a cognitive and physical perspective.
Apart from picking time performance, other experimental research has focused on gathering data on manual assembly errors during an electrical plug assembly task. 25 A variety of effects were investigated in a full factorial experiment, including time pressure, working position and component bin orientation. It was shown that the working position and bin orientation have a significant impact on human errors, with tilted bins and a sitting position being the highest performing options. Further studies look at workstation layout, jig design and their impact on assembly productivity.26,27 Changes in workbench and operator positions were evaluated and showed a minimal productivity increase; however, an ergonomic benefit of standing as opposed to sitting was highlighted with a Rapid Upper Limb Assessment method.
Other experimental studies investigate the impact of confined space work on task performance and ergonomics. Performance is shown to be closely correlated to the degree of a whole-body restrictive condition, 28 whereas ergonomic risk scores are highly depended on task and confined environment conditions. An experimental study investigated changes in orientation of an alternatively closed- or open-wing-box structure to establish their effects on operator risk exposure due to poor ergonomic postures.29,30 In the case of a confined work environment, changing the orientation does not result in a lower average risk score compared to an overhead condition. However, if the wing box is in an open and tilted or vertical condition, lower scores are achieved. This presents a comparable approach to investigating orientation changes; however, here we focus on assembly performance as the dependent variable, rather than ergonomic risk.
In summary, existing studies on manual picking have investigated a range of factors impacting performance, where orientation and position of component containers are the most relevant to our proposed research objectives. Manual picking tasks are much shorter in time and simpler in execution; still, the observed effects on performance are likely to be similar in manual assembly tasks. Experimental investigations into assembly errors due to workstation layouts, sitting or standing positions and component orientations can also be related to manual assembly task performance, because such errors may lead to corrective actions and hence deterioration in performance. Research on body restrictions and component orientations shows clear impact on ergonomic position, which is likely to go hand in hand with deteriorating manual assembly performance.
Compared to previous research, we focus on recreating complex aircraft system equipping activities that are based on the real working environment. We study electrical and pneumatic system installation activities with factory shop floor representative components, tasks and structural access conditions. This article thus presents results of a controlled experiment, investigating aircraft system manual assembly performance, impacted by a change in component orientation. Our results may be useful inputs to aircraft assembly simulations to evaluate rate increase scenarios for system installation change proposals.
Experimental method
Hypothesis and objectives
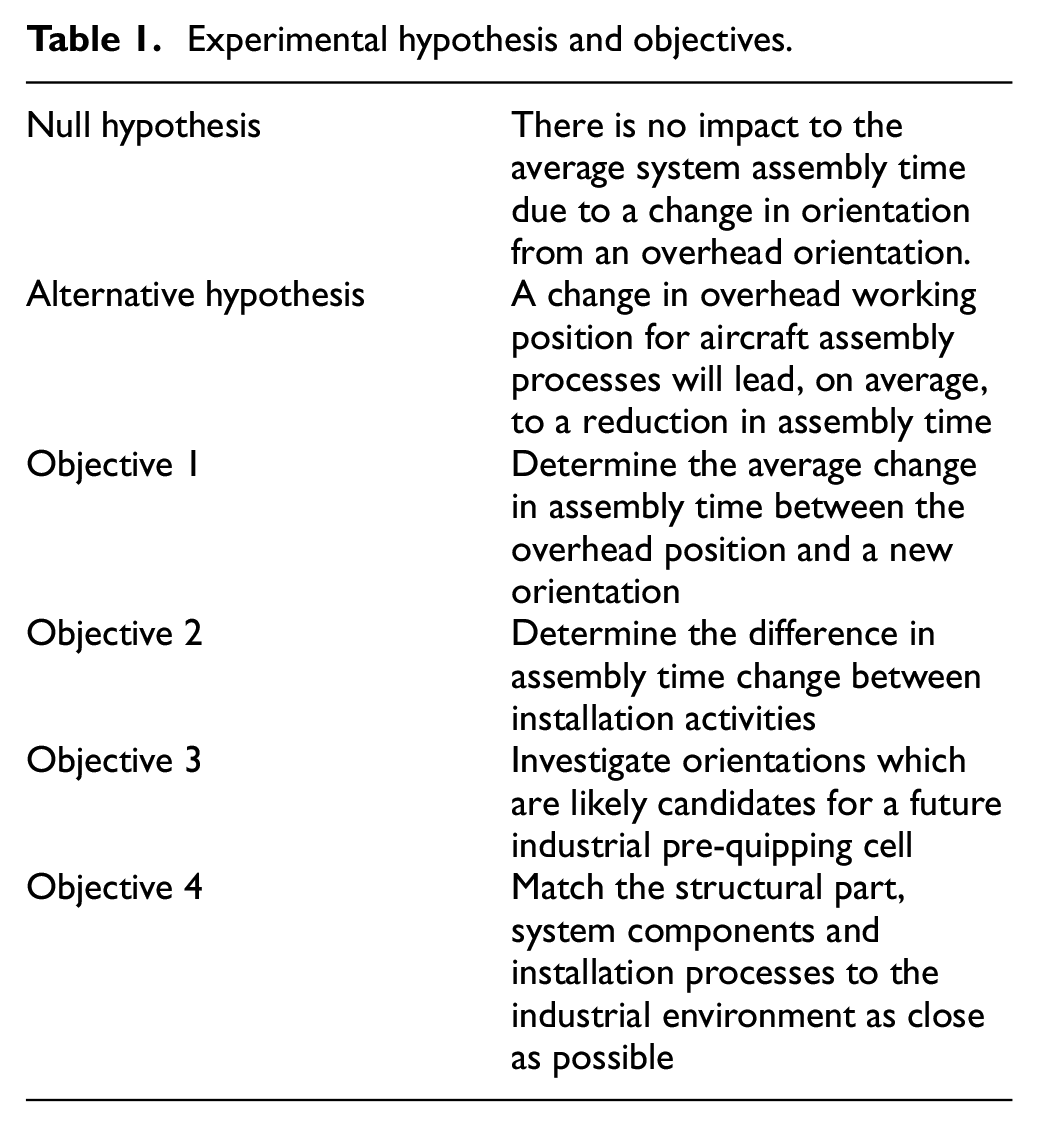
Previous work 13 has identified that there is potential to manufacture future wing systems using a pre-equipping assembly philosophy. In this case, systems are installed on the front spar structure of the wing before the wing spar is assembled into the wing box. These systems consist of a variety of components, whose installation ranges in length of time, complexity and location on the structure. Based on these varied components, a representative subset of activities is selected for the experiment, and the experimental hypotheses and objectives shown in Table 1 are derived.
Experimental hypothesis and objectives.
Experimental setup
In order to fulfill the experimental objectives, a test rig and process was devised. Resource constraints meant that a lab-based experiment was to be conducted using a partial wing leading edge structure. The setup consists of a NM45 Robot 31 with a representative front spar section mounted on it. The section is approximately matched in dimensions and rib position to an A320 wing front spar. The robot is able to set the structure into the required orientation, subsequently allowing participants to complete the installation activity. The robot is only used to achieve the orientations investigated and it is not necessarily part of a factory pre-equipping cell implementation. The structure consists of a 2 m × 0.3 m machined aluminum spar fitted with six ribs. Each rib has the required system component openings cut in place and was bolted to the spar. The ribs are covered by a medium-density fiberboard (MDF) sheet skin and bottom skin plate. This creates a bottom panel opening of the required dimensions through which all installation activities are conducted. Internal skin back plates are included to recreate the available internal space for participant movement and access.
The four orientations investigated are shown in Figure 1. The overhead orientation represents the work position of the traditional equipping environment using a wing transport trolley. The vertical, horizontal and tilted positions are proposed alternatives for a pre-equipping assembly cell, if a part handling jig tool is employed.
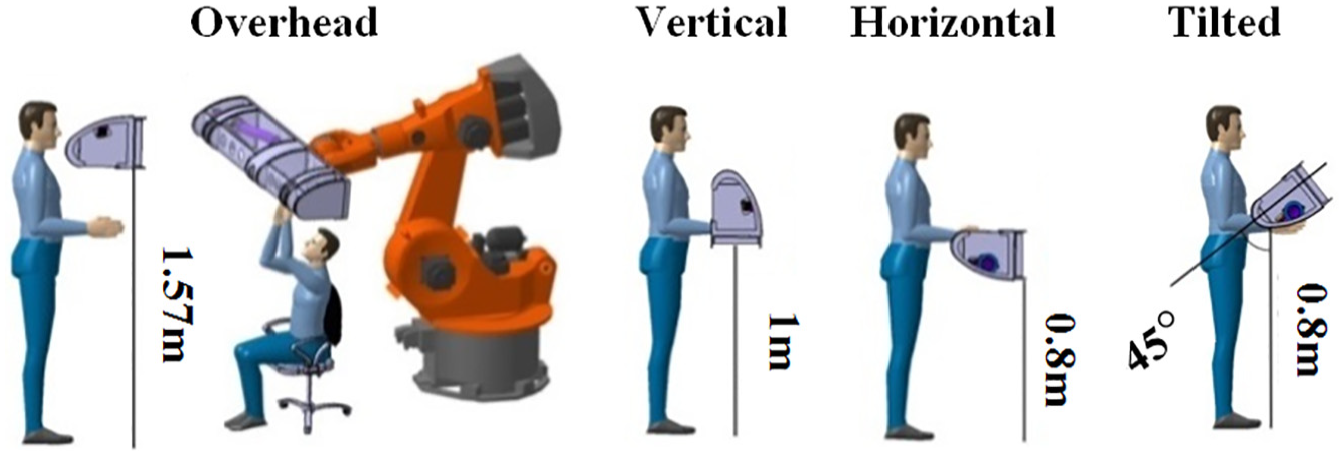
Orientations under investigation.
The installation activities investigated relate to the aircraft’s electrical and pneumatic systems. In the experiment, the system components are designed to match the systems found in the particular section on an A320 aircraft; however, some rib structural interfaces are modified. The wing electrical system contains a cable harness of up to 60 strands of approximately 1 mm diameter cables, which are clipped into raceways with four channels, along the entire front spar. Both the installation of raceways to the structure and their equipping with cables are investigated with the experiment.
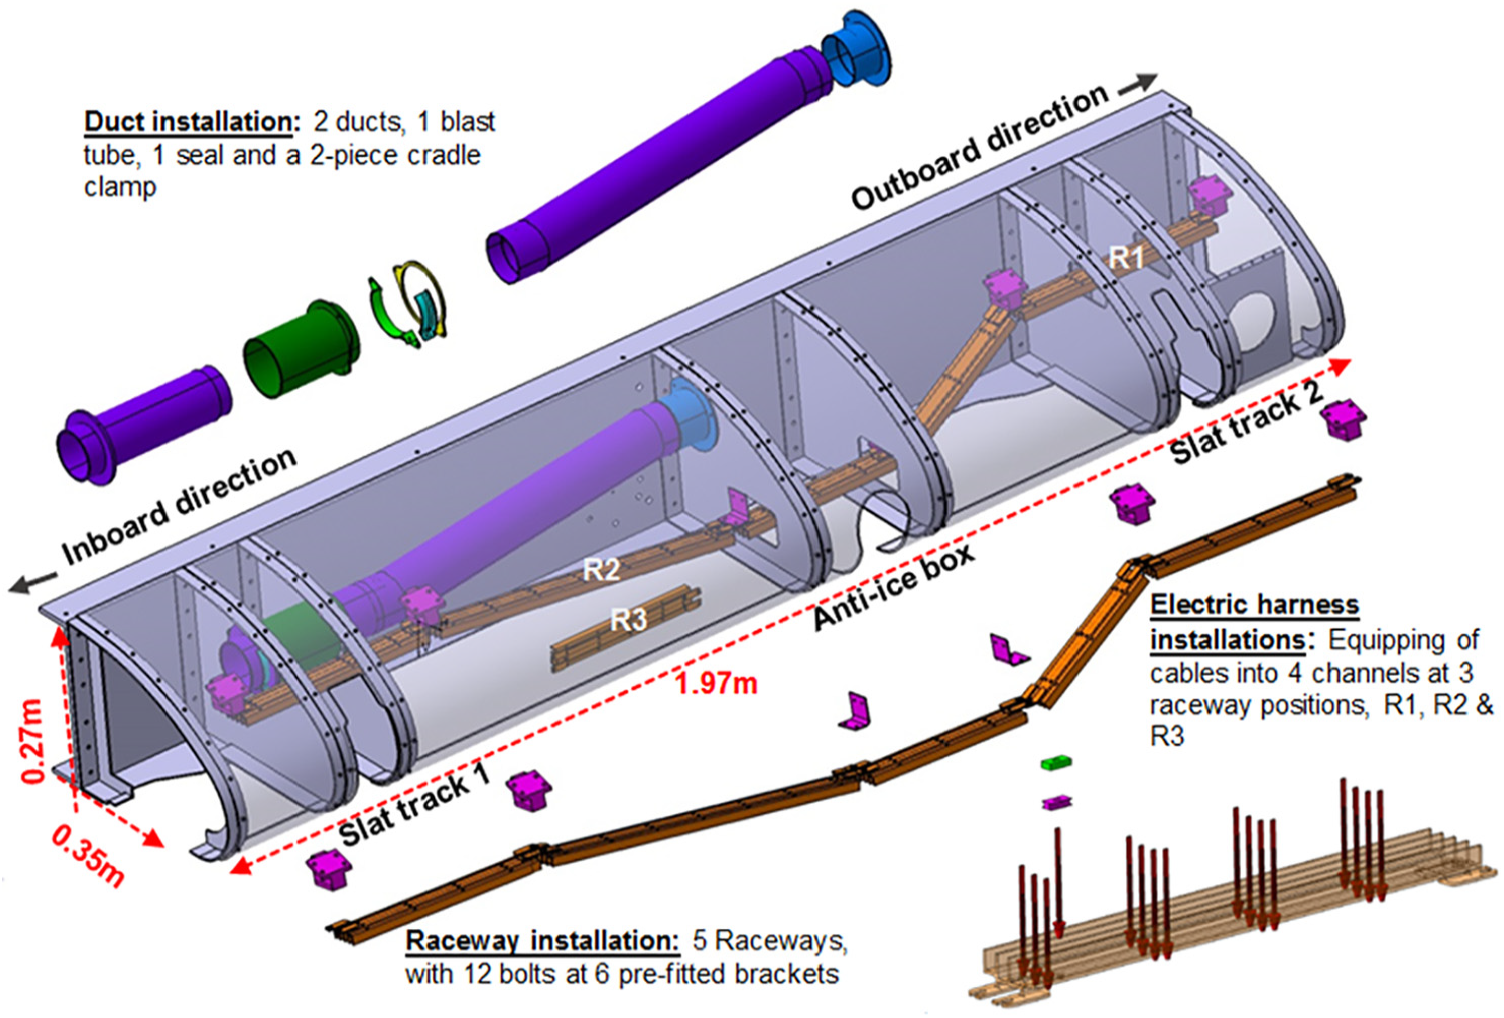
Five raceways are fitted to six skin-mounted brackets with two bolts per bracket. They run along the underside of the top skin, changing direction at the anti-ice box area. In addition to placing and bolt tightening the raceways in position, other activities, such as sealing and bolt painting operations, are also included. Since the raceway locations vary in both position and accessibility along the spar, three representative cases are investigated for electric harness installation. The first is a partially obstructed raceway position at R1, the second a cleared position at R2 and the third a rotated but clear position at R3, as visualized in Figure 2. The installation activity involves fitting a number of loose cables into a raceway channel and tightening a harpoon cable tie to hold them in place.
Leading edge demonstrator.
The wing pneumatic system includes a number of ducts, duct clamps and valve components. In this experiment, only duct installation tasks are investigated, as they are the most frequent activities with the overall pneumatic system installation process. The two ducts run from a fixed-end fitting at the anti-ice box area through to slat track 1. Within the slat track, the ducts are covered by a further blast tube. A two-piece clamp and seal, outboard of slat track 1, fixes the ducts to the structure.
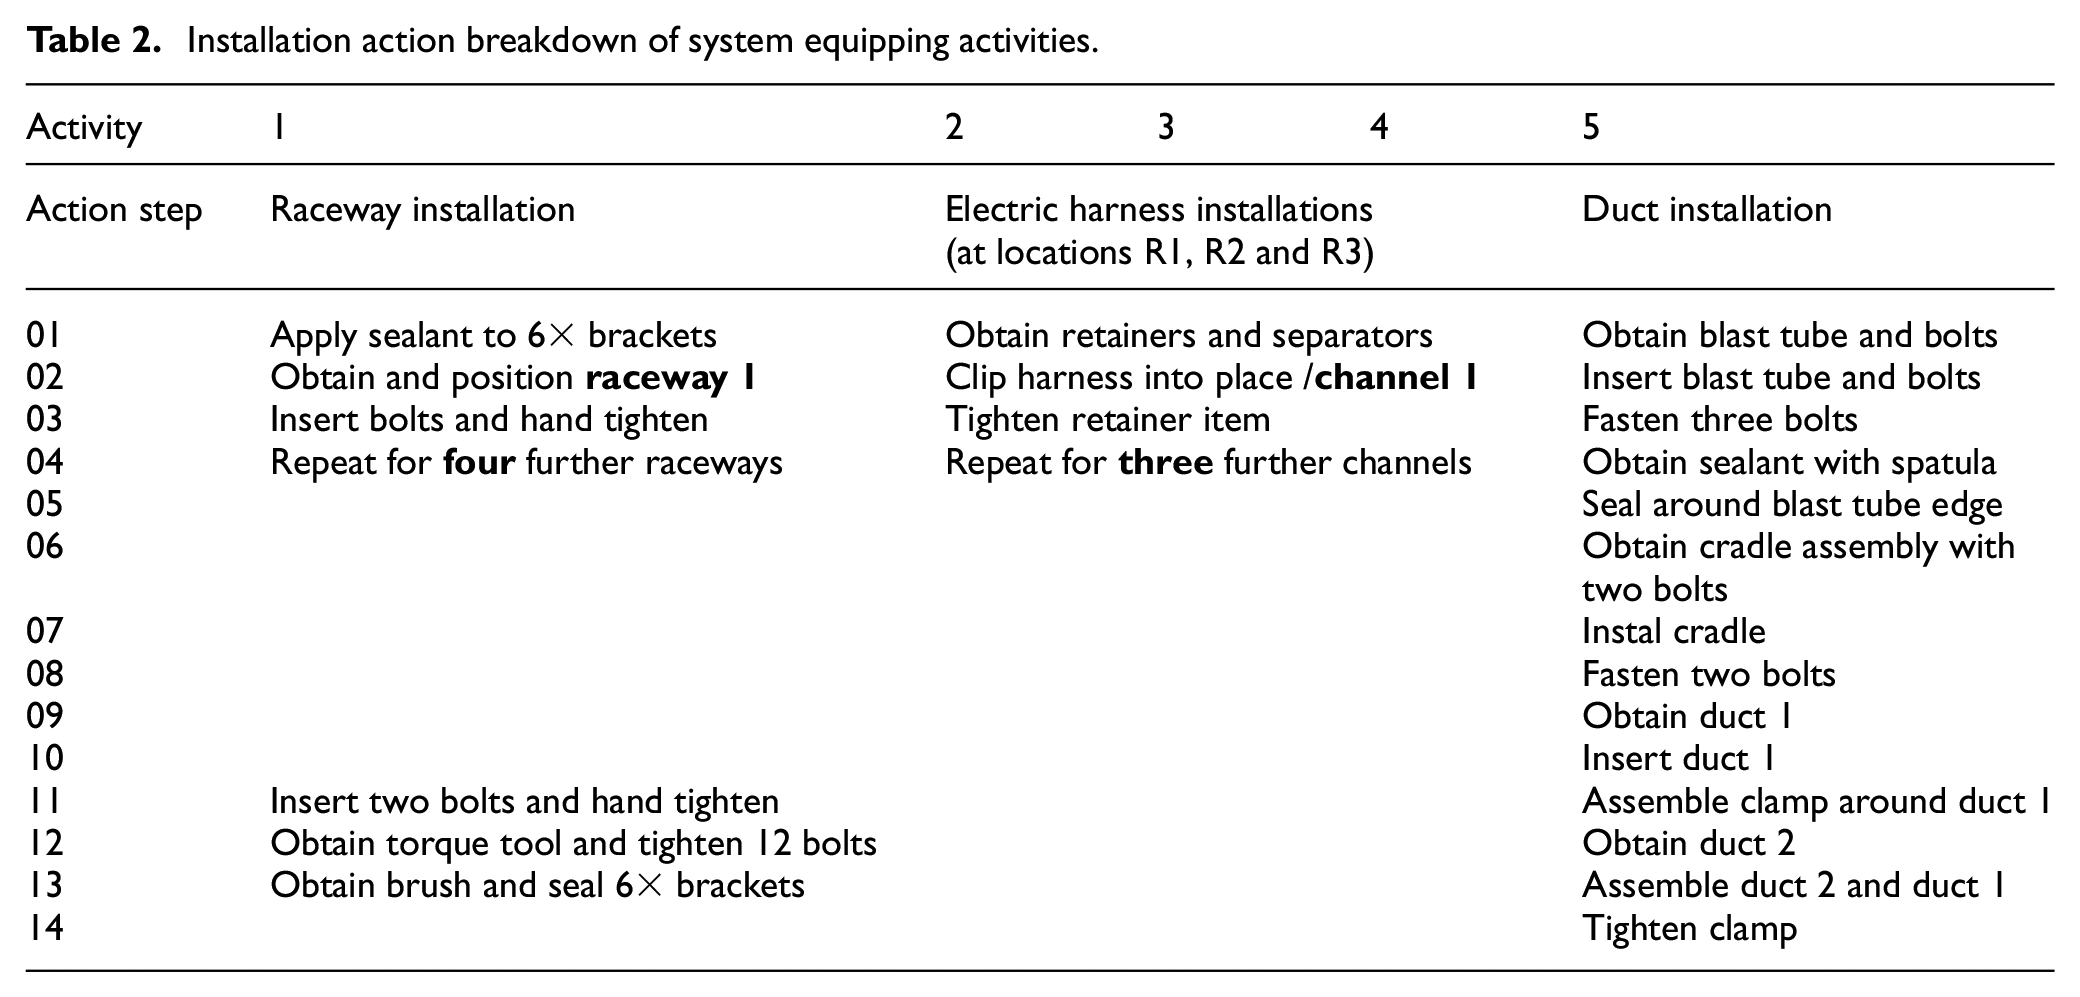
Table 2 provides a detailed activity break down into action steps, and an overview of the completed systems and structure is shown in Figure 2 with some action step and component examples given in Figure 3. The activities are complex and it could take up to 1.5 h for one participant to complete all orientations.
Installation action breakdown of system equipping activities.
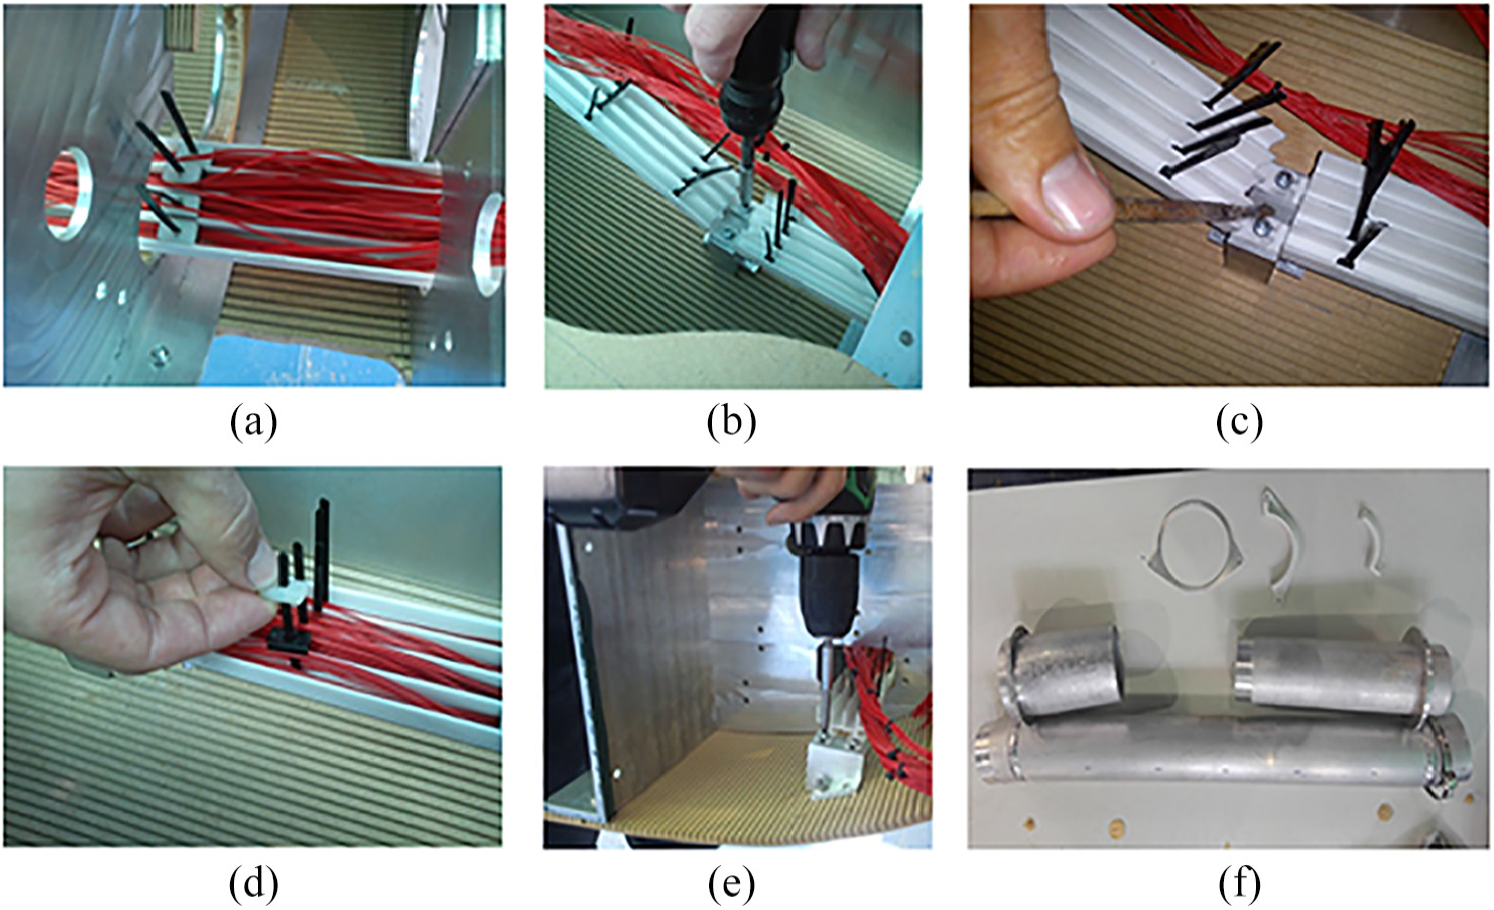
Examples of action steps and components: (a) raceway and harness assembly; (b) raceway hand fastening action; (c) over-sealing action for raceway bolts; (d) harness installation with cable-tie, spacer and clip; (e) raceway tightening action and (f) duct assembly activity components.
The experiment was designed as a between-subject process with n = 15 participants. They were MSc Students; aged between 23 and 30 years, with an average height of 177 cm and a standard deviation of 10 cm. Each participant completed one of the five activities only, repeating it for each orientation. This provides three measurement points per activity from Table 2 and the four orientations from Figure 1. The data gathered per participant included the action step time, video recordings and observer comments. They were also asked to rank the orientations in terms of personal preference after completing the timed installations.
Assembly time variability induced by other factors was considered, with an overview shown in Figure 4. The environmental effects were not directly controlled by the experimental setup. Since all data were gathered in a closed lab, these were fairly constant and are unlikely to have caused measurement variability. The participants’ physical characteristics and manual work experience are fixed and hence impact the equipping results every time. It would be possible to correct for operator height by adjusting the D-nose height according to a desired distance between participant torso and D-nose spar. However, this was decided against, since in a factory pre-equipping station such adaptability is unlikely to be present.
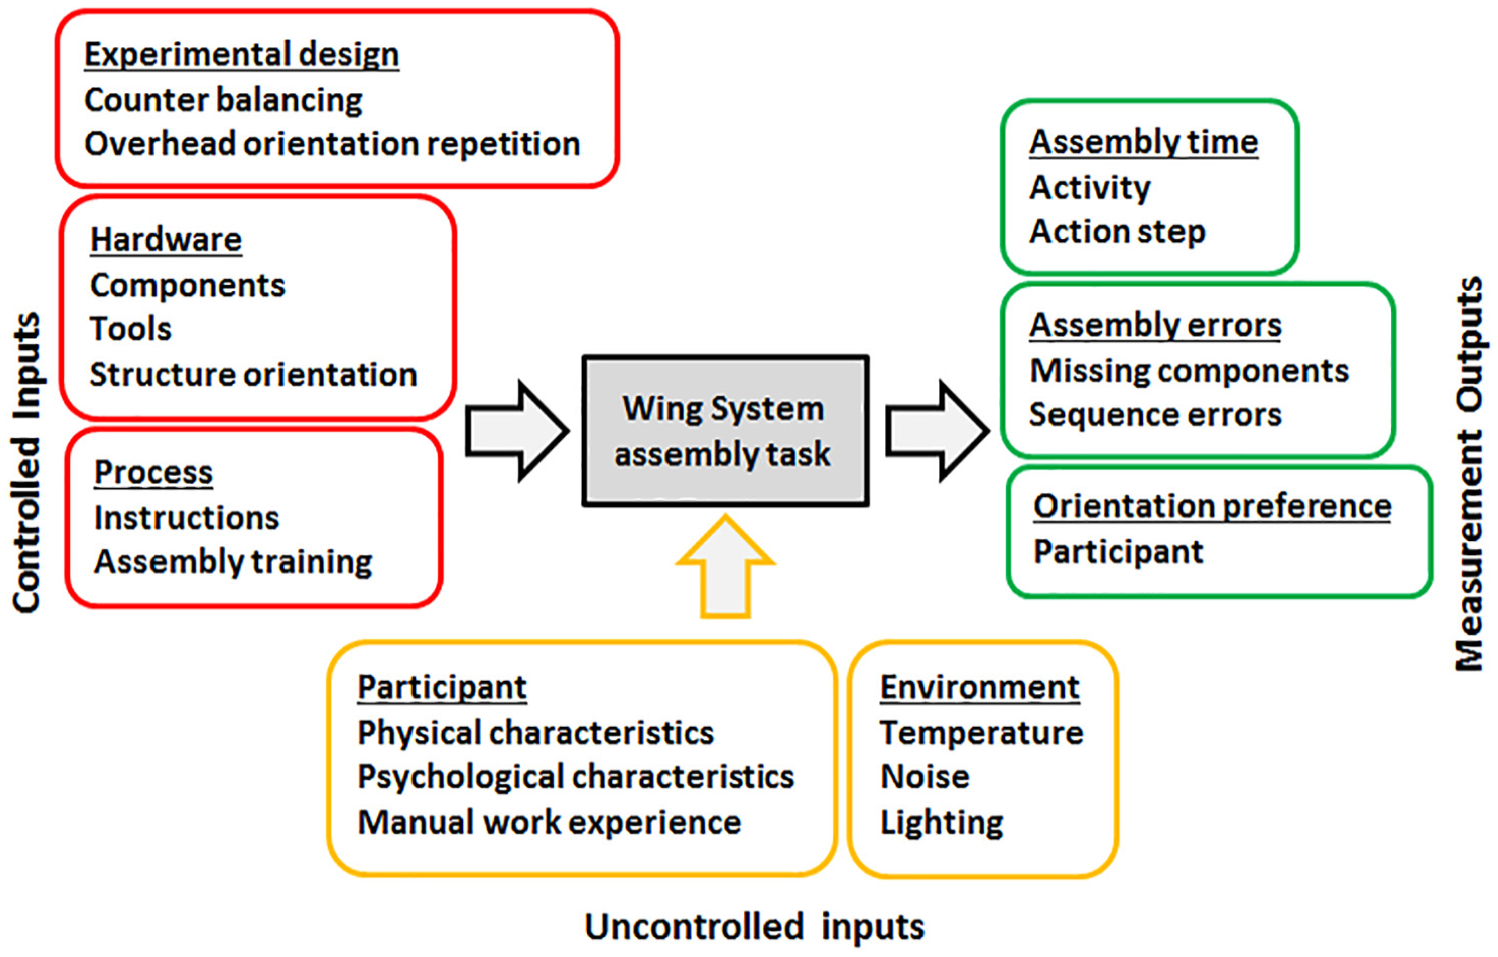
Experimental input–output diagram.
Other factors include psychological aspects, such as mood, learning rate, confidence and task comprehension.32,33 Overall, a structured introductory approach for participants was followed to create equal installation comprehension starting conditions. Component types, installation order and tool usage were explained, followed by a complete run of the assembly task by the participants with assistance. This part was not timed or recorded and participants could indicate whether they felt ready to start the timed assembly task. Learning rates may impact assembly times significantly. 34 The experiment overcomes this by counterbalancing the order of orientations tested. Only the overhead position is fixed as the first trial and is repeated at the end of the orientation changes. The difference in mean assembly time between the two overhead positions is then used as an additional measure to investigate learning rates.
It can be concluded that the main sources of variability in the timing results will be the participants’ physical, manual handling experience and psychological characteristics.
Results
With reference to the experiment’s objectives, stated in Table 1, results in support of each are presented. The full raw measurement data collected may be consulted online.35,36 To investigate the experimental timing results, two analysis approaches are adopted; we call them the absolute and relative approach. For the absolute approach, the assembly time of all participants is combined into a sample distribution per orientation. The distribution averages are then compared and assessed for a shift in assembly time change.
The relative approach does not mix absolute timing data between different participants, but rather forms a time ratio for each tested orientation of the participant. This set of time ratios is then combined into the sample to establish the average time ratio of the distribution.
Full experiment dataset
The total assembly times and ratios for all activities are combined for the four orientations, as shown in Figure 5. The boxplots represent information of 25th percentile, median, 75th percentile and whiskers for lower and upper adjacent values. Outliers are defined by their value being ±2.7σ from the sample median, representing 99.3% coverage of the distribution. In order to assess experimental objective one, a confidence interval (CI) test on the sample means is carried out. First, the sample is tested for normality using the one-sample Kolmogorov–Smirnov test. 37 The test for all four positions does not reject the null hypothesis that the sample data follow a normal distribution at a 5% significance level. Figure 6 shows this test visually, by plotting the normal distribution and the sample data probabilities. Note the sample size for the overhead position is n = 30 compared to the other positions of n = 15, since it is repeated twice.
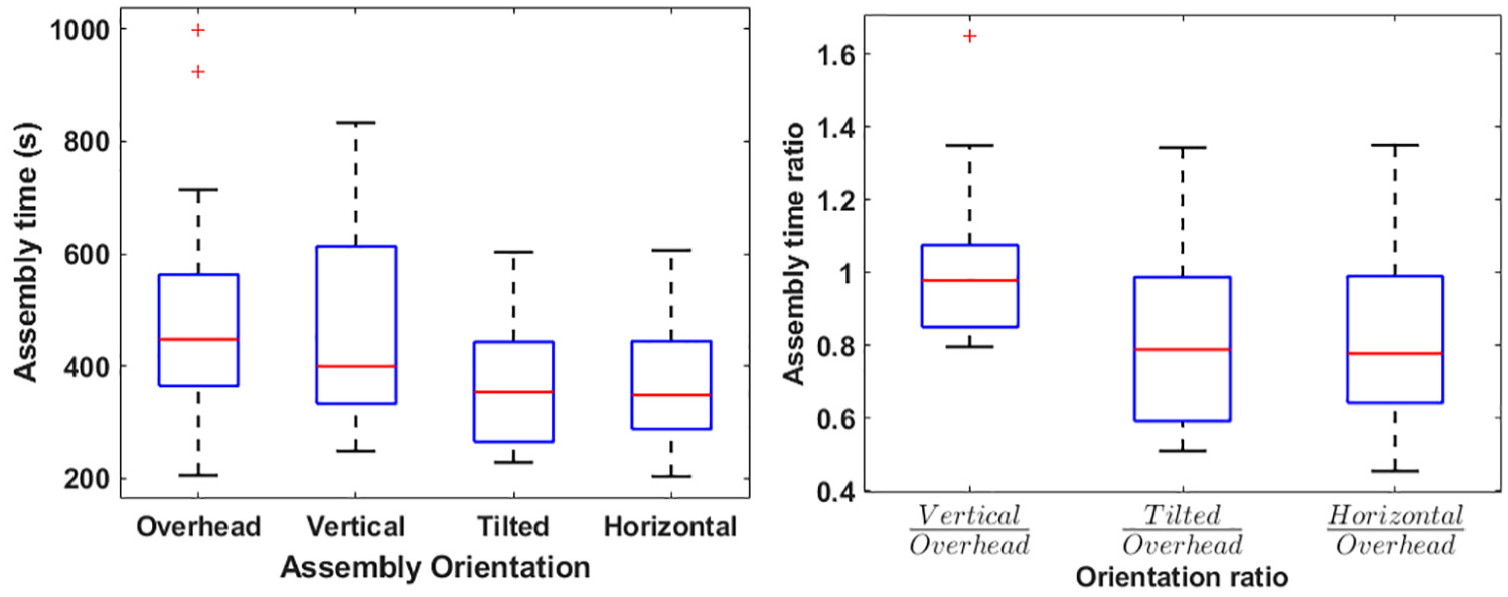
Combined activities assembly time and ratio results for investigated orientations.
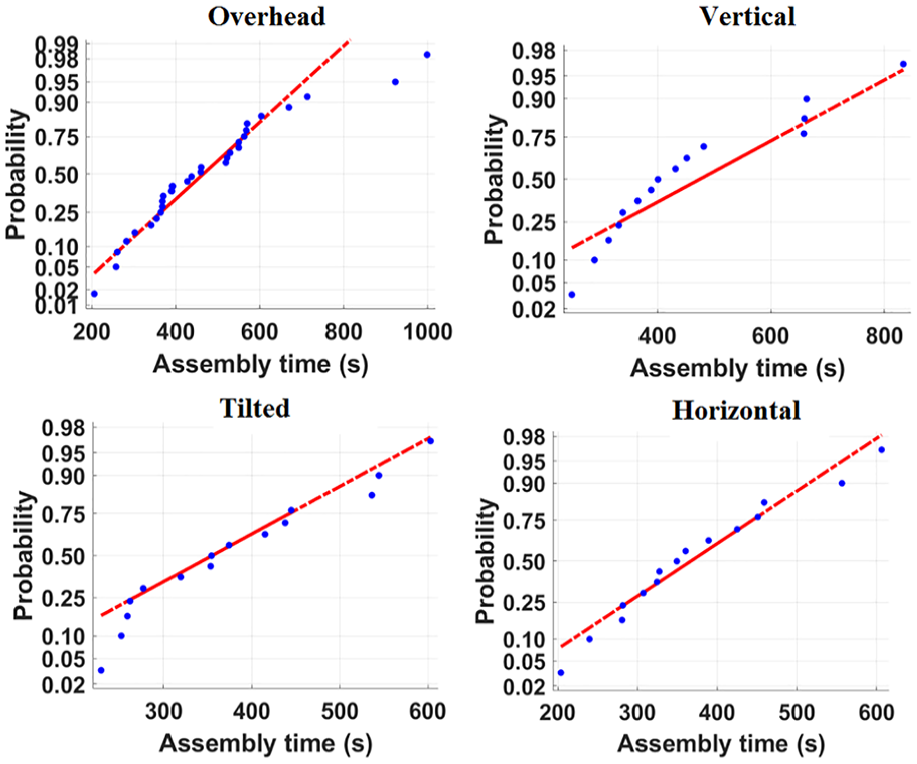
Visual comparison of normal distribution probabilities and sample data.
Given that the result population is likely to be normally distributed, we follow a standard procedure,38,39 mapping sample averages to the standard error of the population mean within the 95% CI using a student t-distribution. The resulting shifted distributions and their upper and lower bound values on the population mean are represented in Figure 7. The CI on the population means for the five activities overlap across the tested orientations. Hence, this combination of all assembly activity times into a single dataset does not infer a statistically significant difference between overhead and new orientations if the absolute analysis route is followed. Figure 7 also shows the assembly time ratios for the combined activity sample. A reduction for the tilted and horizontal orientations is observed, with the upper bound of the CI for these positions below one. The vertical orientation does not allow inference for a reduction against the overhead orientation.
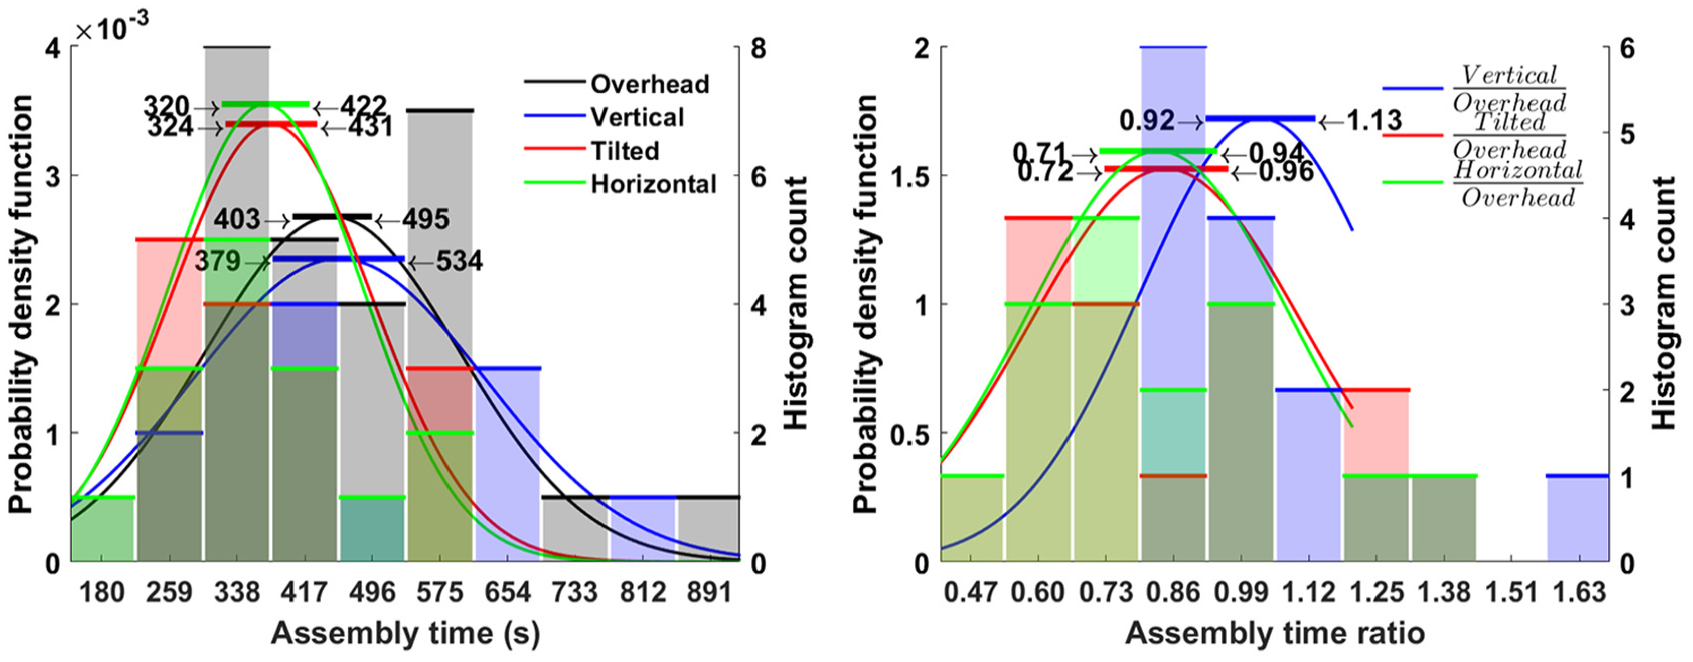
Overall assembly time ratio histograms, fitted normal distributions and CIs.
Action step dataset
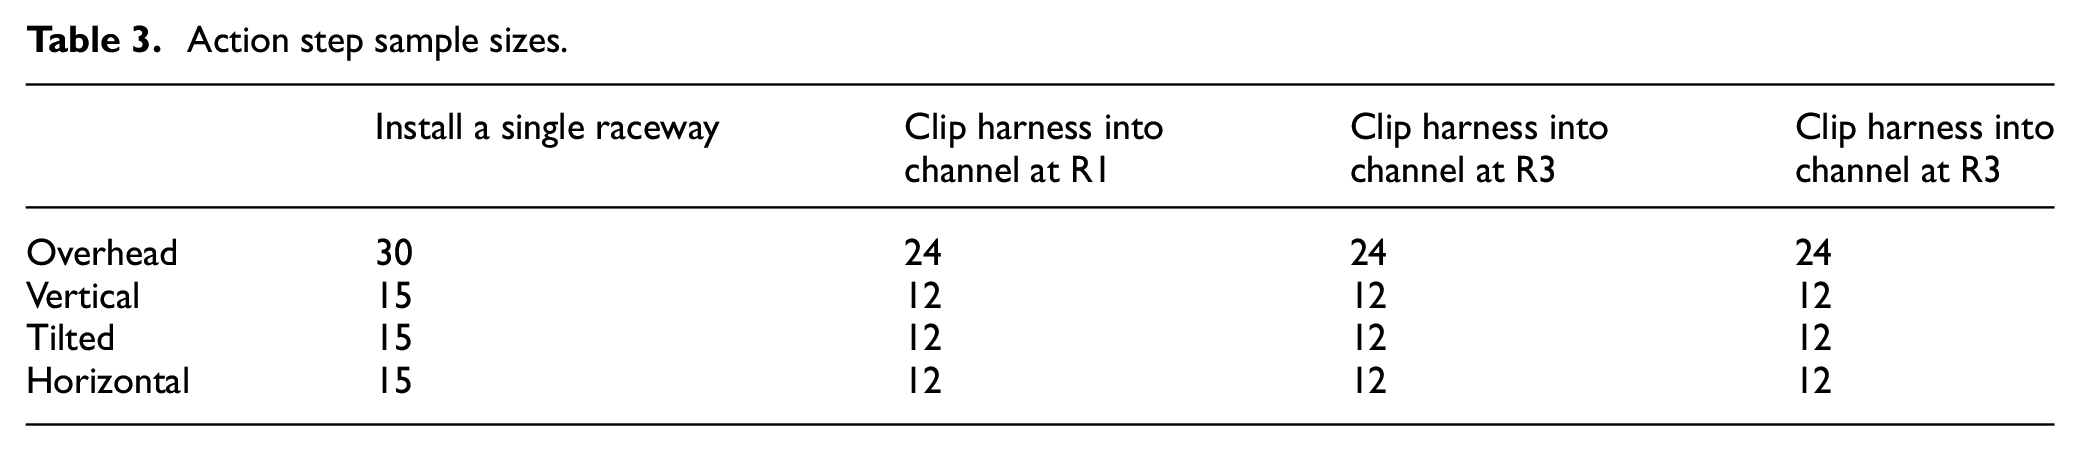
Figures 8 and 9 show action step time results for selected individual participants per assembly activity. The duct installation task has high time variability across action steps. For example, fitting the blast tube takes around 2 min and tightening the clamp around 15 s. In comparison, the harness installation tasks are more balanced, as they contain a repeated cable fitting and cable tie tightening step at four channel positions in a raceway. These repeated actions within the raceway installation and harness assembly activities increase the effective sample size of the experiment. The total sample is determined by the number of participants completing the activity (3), the number of orientation repetitions (1 for vertical, horizontal and tilted or 2 for overhead) and the number of internal action step repetitions (5 for raceways and 4 for harness equipping). A summary of the sample sizes for the repeated action steps is shown in Table 3.
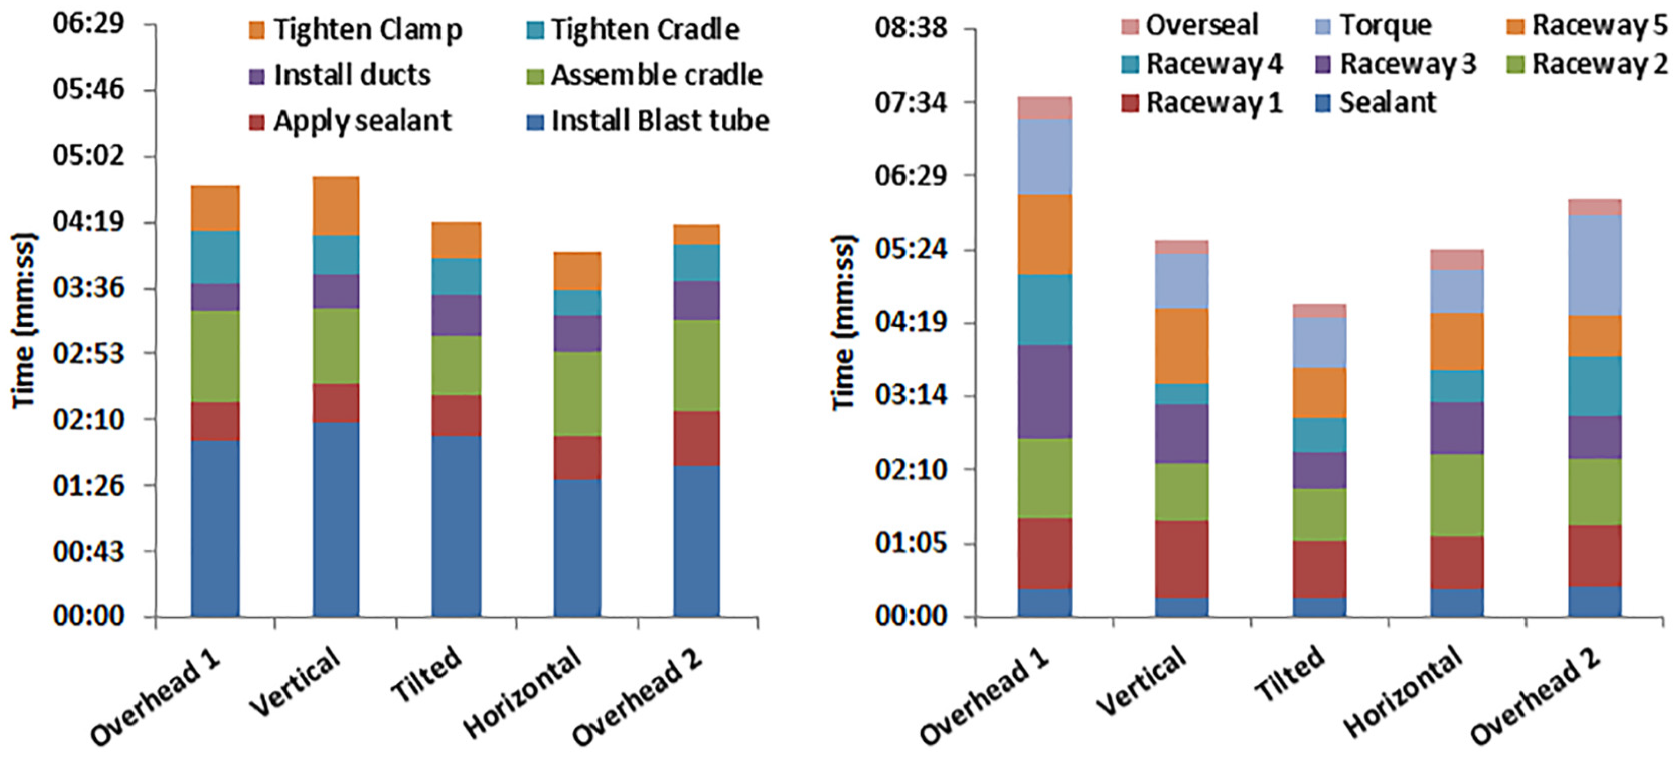
Duct and raceway assembly time examples.
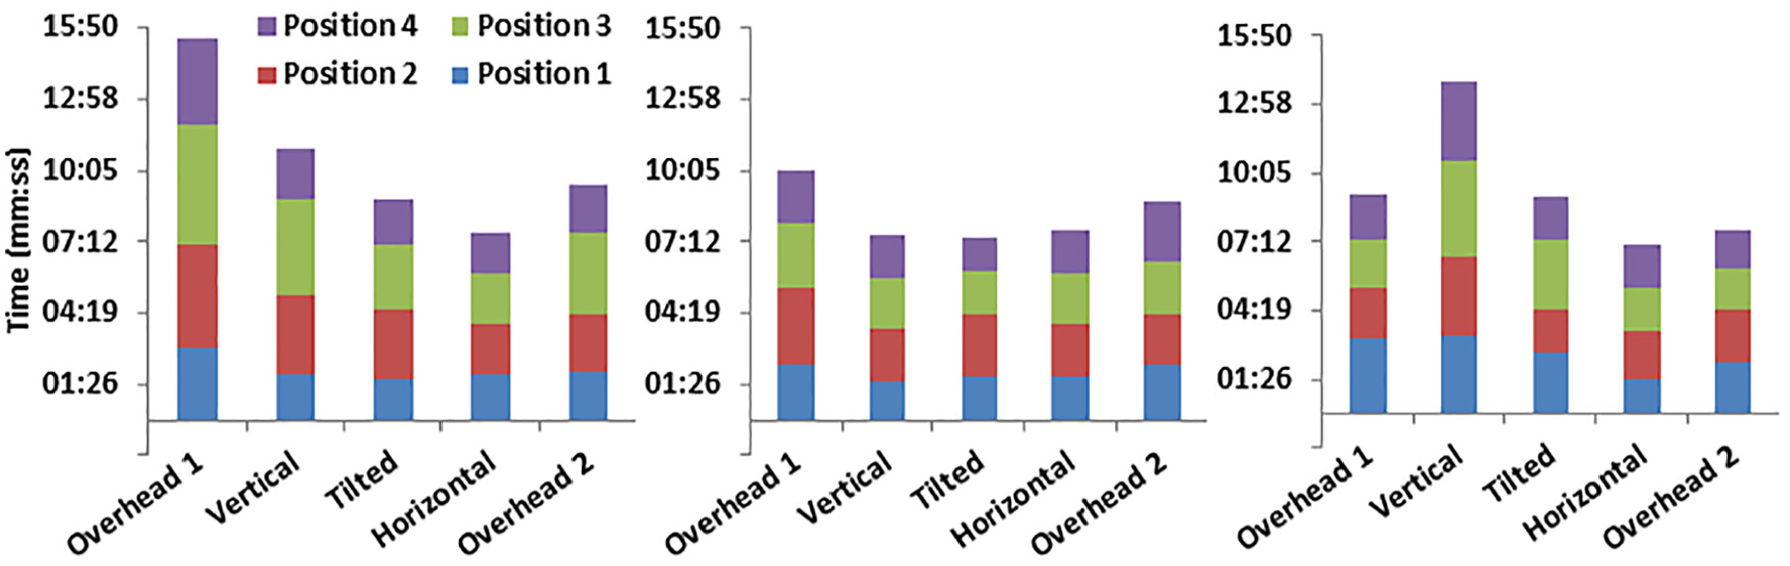
Harness equipping at R1, R2 and R3 assembly time examples.
Action step sample sizes.
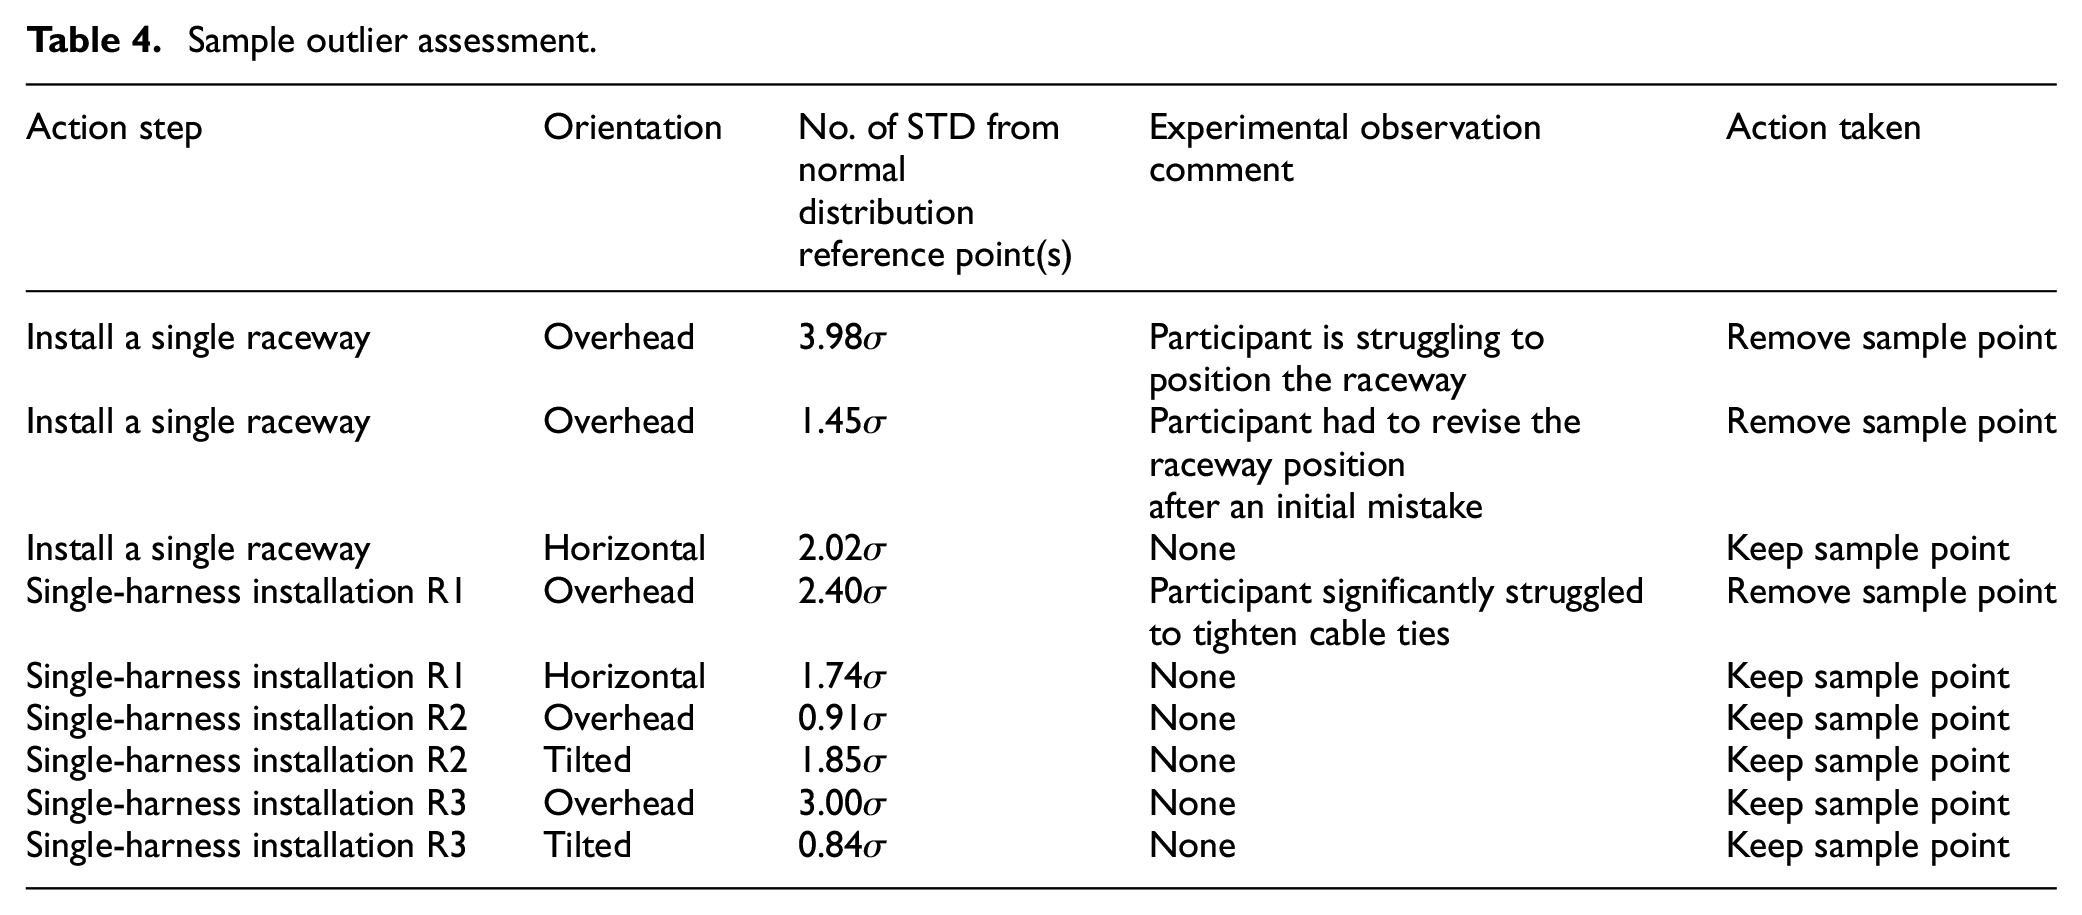
Each of these action step samples was analyzed for statistical significance, as described previously, to test the hypothesis that a change in overhead position will result in a change in average assembly time for this specific action step. But, first a review of the samples identified a number of outliers. Figure 10 gives example overlay plots of normal distribution probability values and the data sample distribution probabilities. The distance measure between an outlier point and the expected standard distribution value is shown, normalized by the normal distributions standard deviation. The outliers, their standard deviation from a normal distribution reference data point and the recorded comment during the experiment are shown in Table 4. An outlier point is removed if the recorded comment and a review of the video footage show that the assembly process was significantly impacted. This results in two points being removed from the raceway installation sample and one point from the harness installation R1 sample. Even though some other outliers are much further from the normal distribution reference points, they do not warrant removal as no installation errors are apparent.
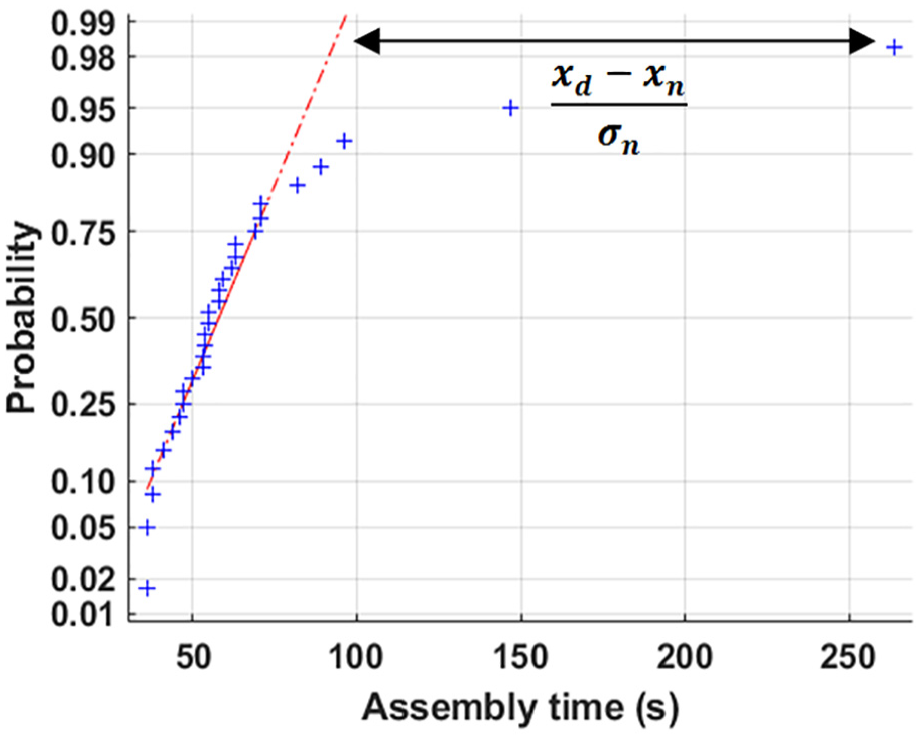
Examples of an outlier distance to a reference normal distribution value.
Sample outlier assessment.
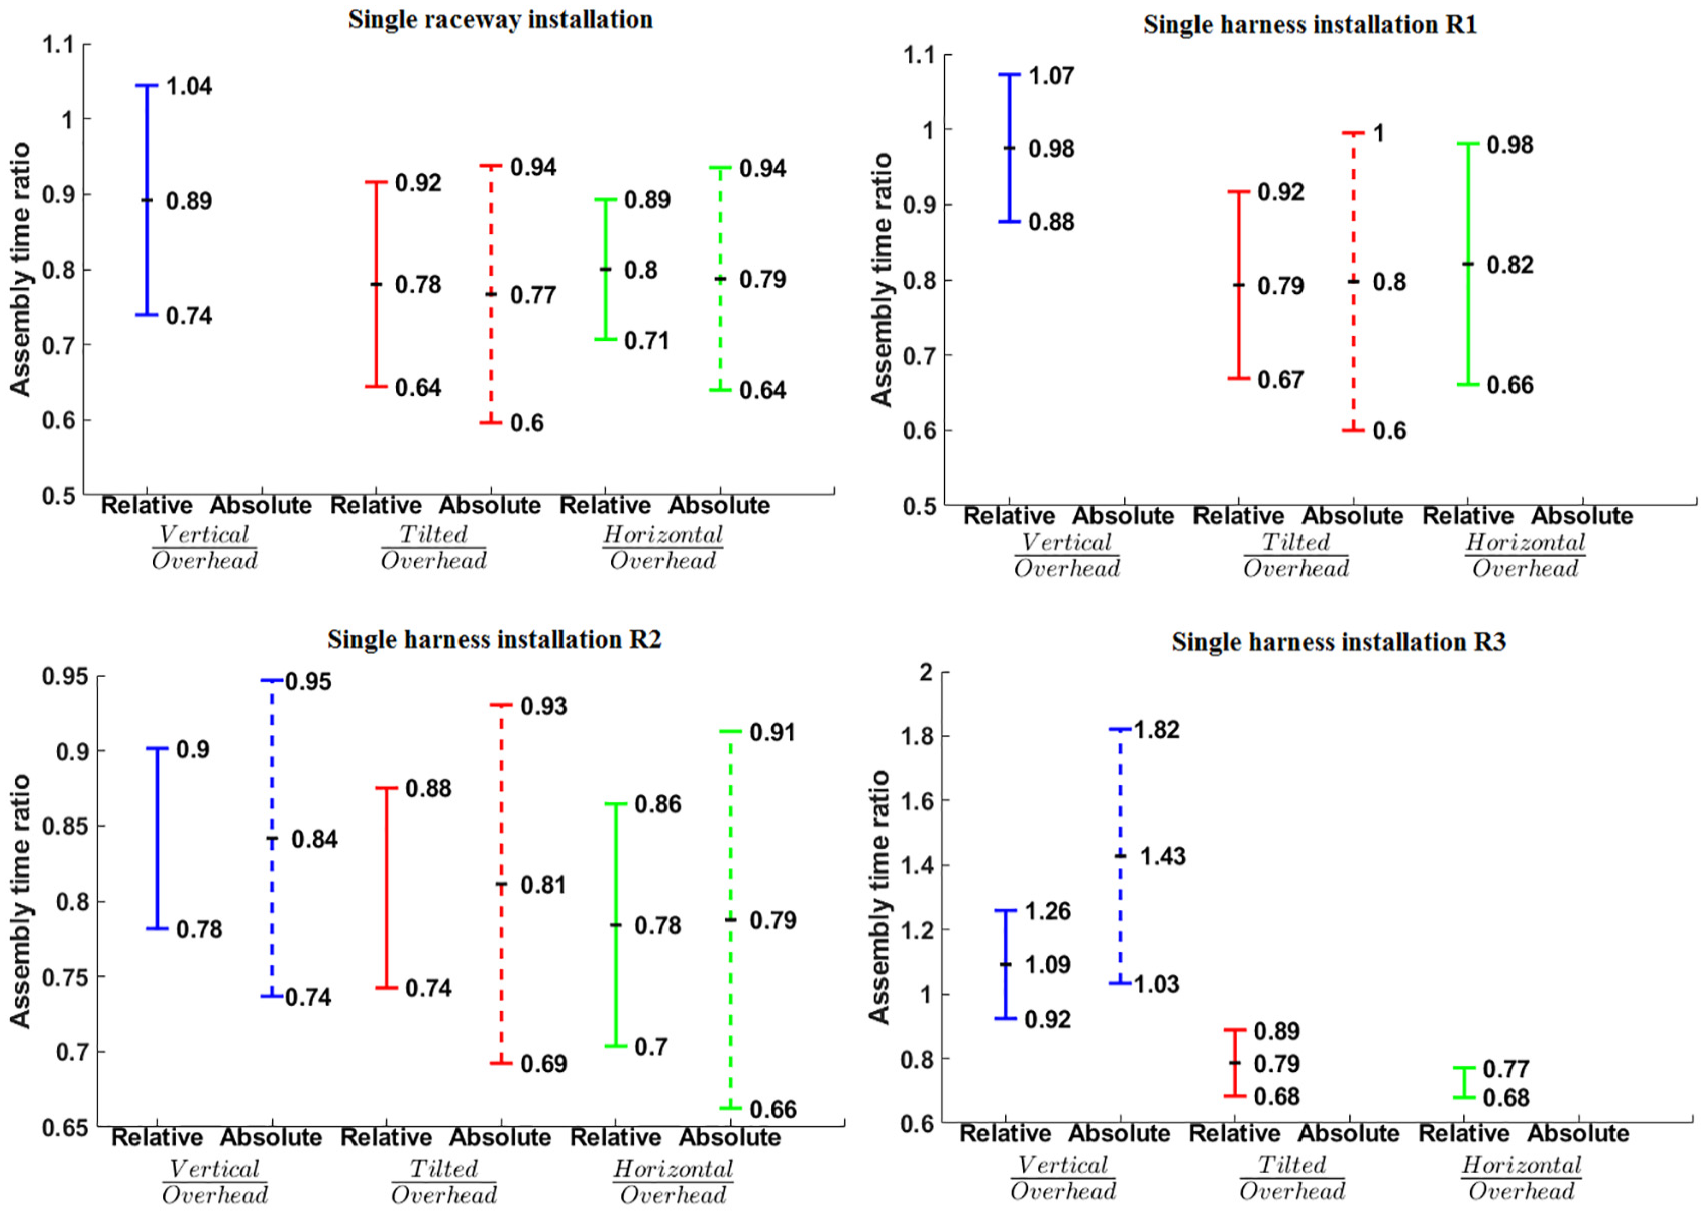
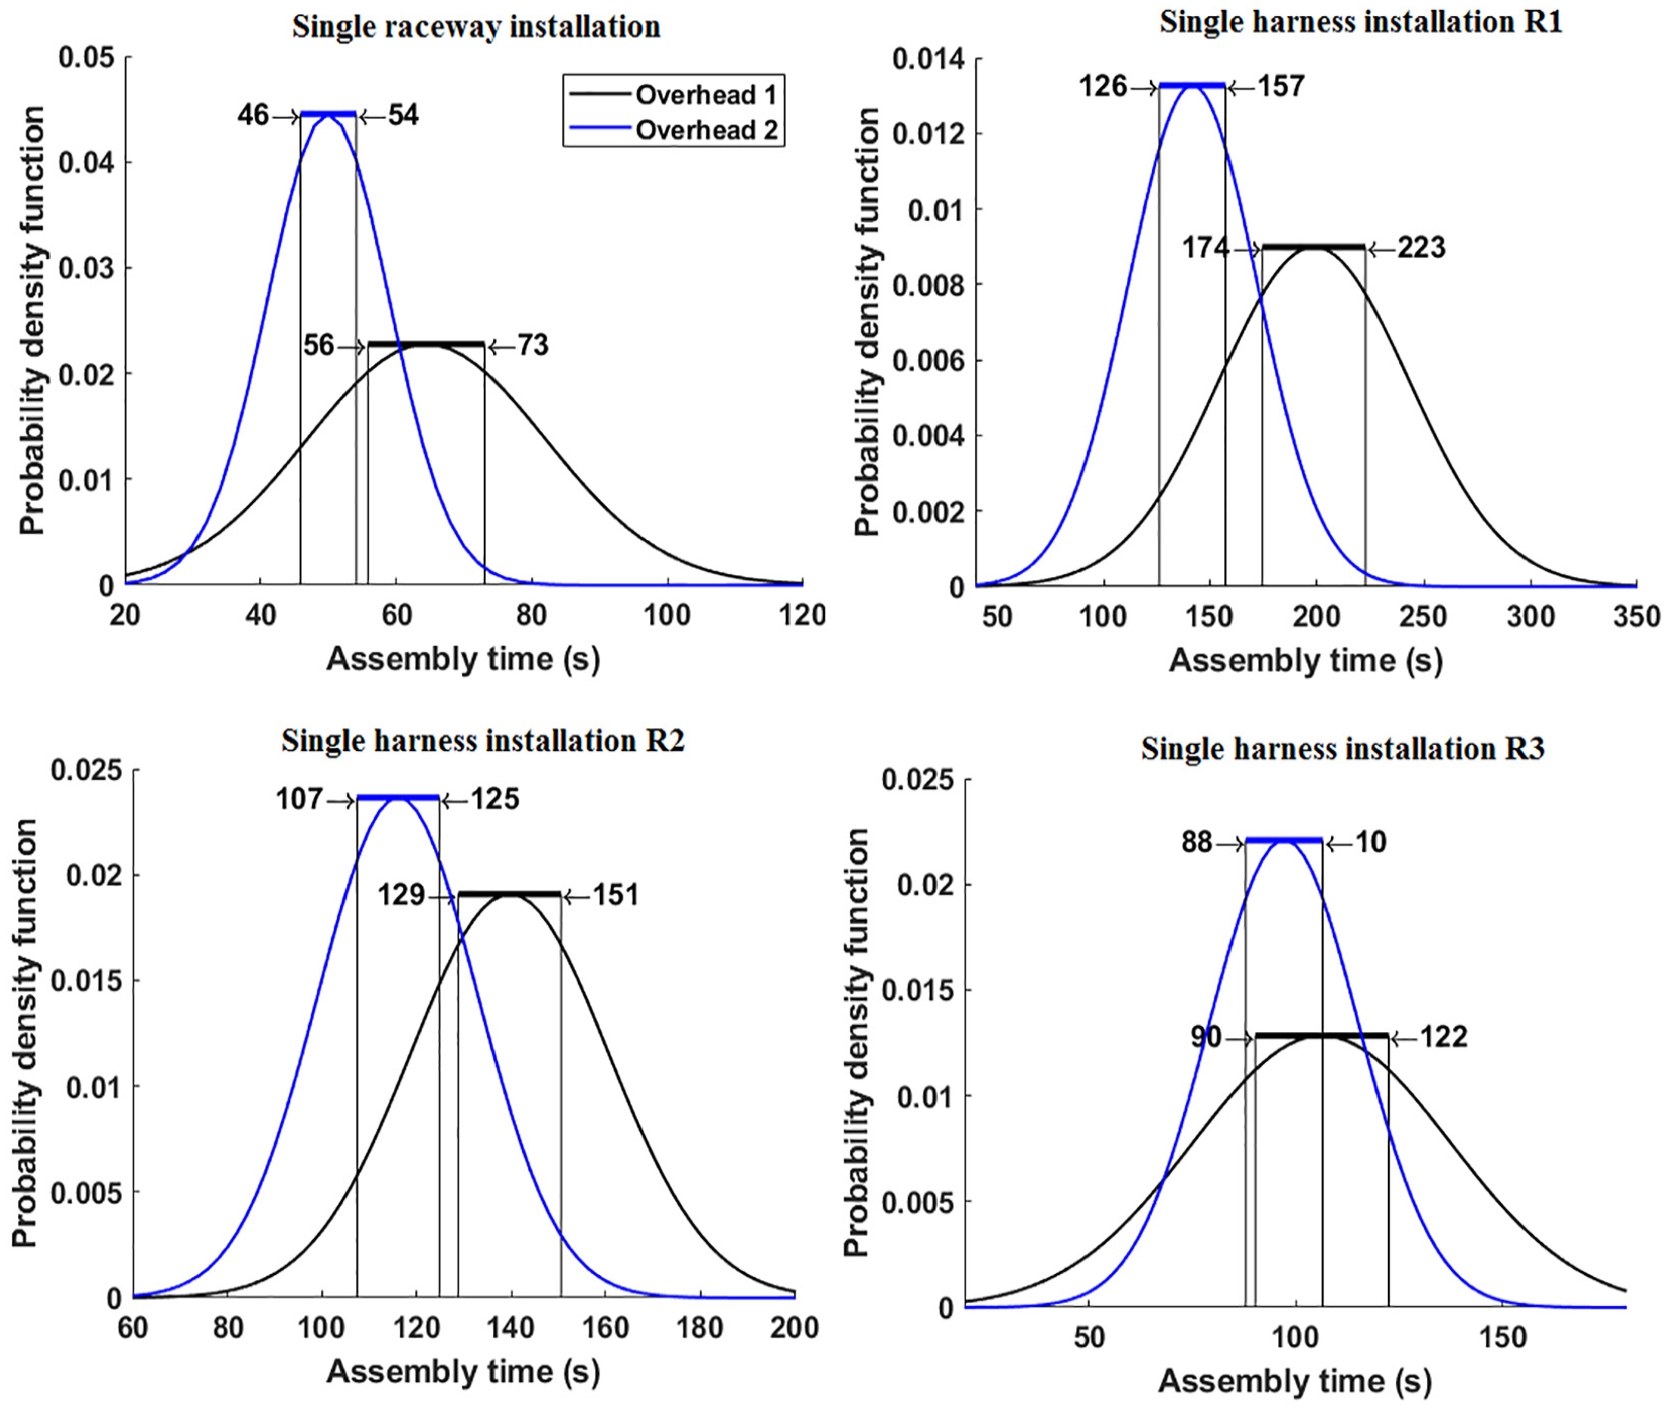
Similarly to the combined dataset, the analysis of the action step data samples indicates that CI analysis based on normal distributions is likely to be valid. Figure 11 shows the resulting fitted normal distributions to the action step data sets, including CIs. If the CI of the distributions from a new orientation does not overlap with the CI of the overhead distributions, statistical significance can be inferred. The single raceway installation shows a reduction for the tilted and horizontal orientations, whereas the vertical orientation sample is not statistically significant. In the case of the single harness installation at R2, all three orientations show a reduction in mean assembly time. The single harness installation at R3 shows an increase in sample mean for the vertical orientation.
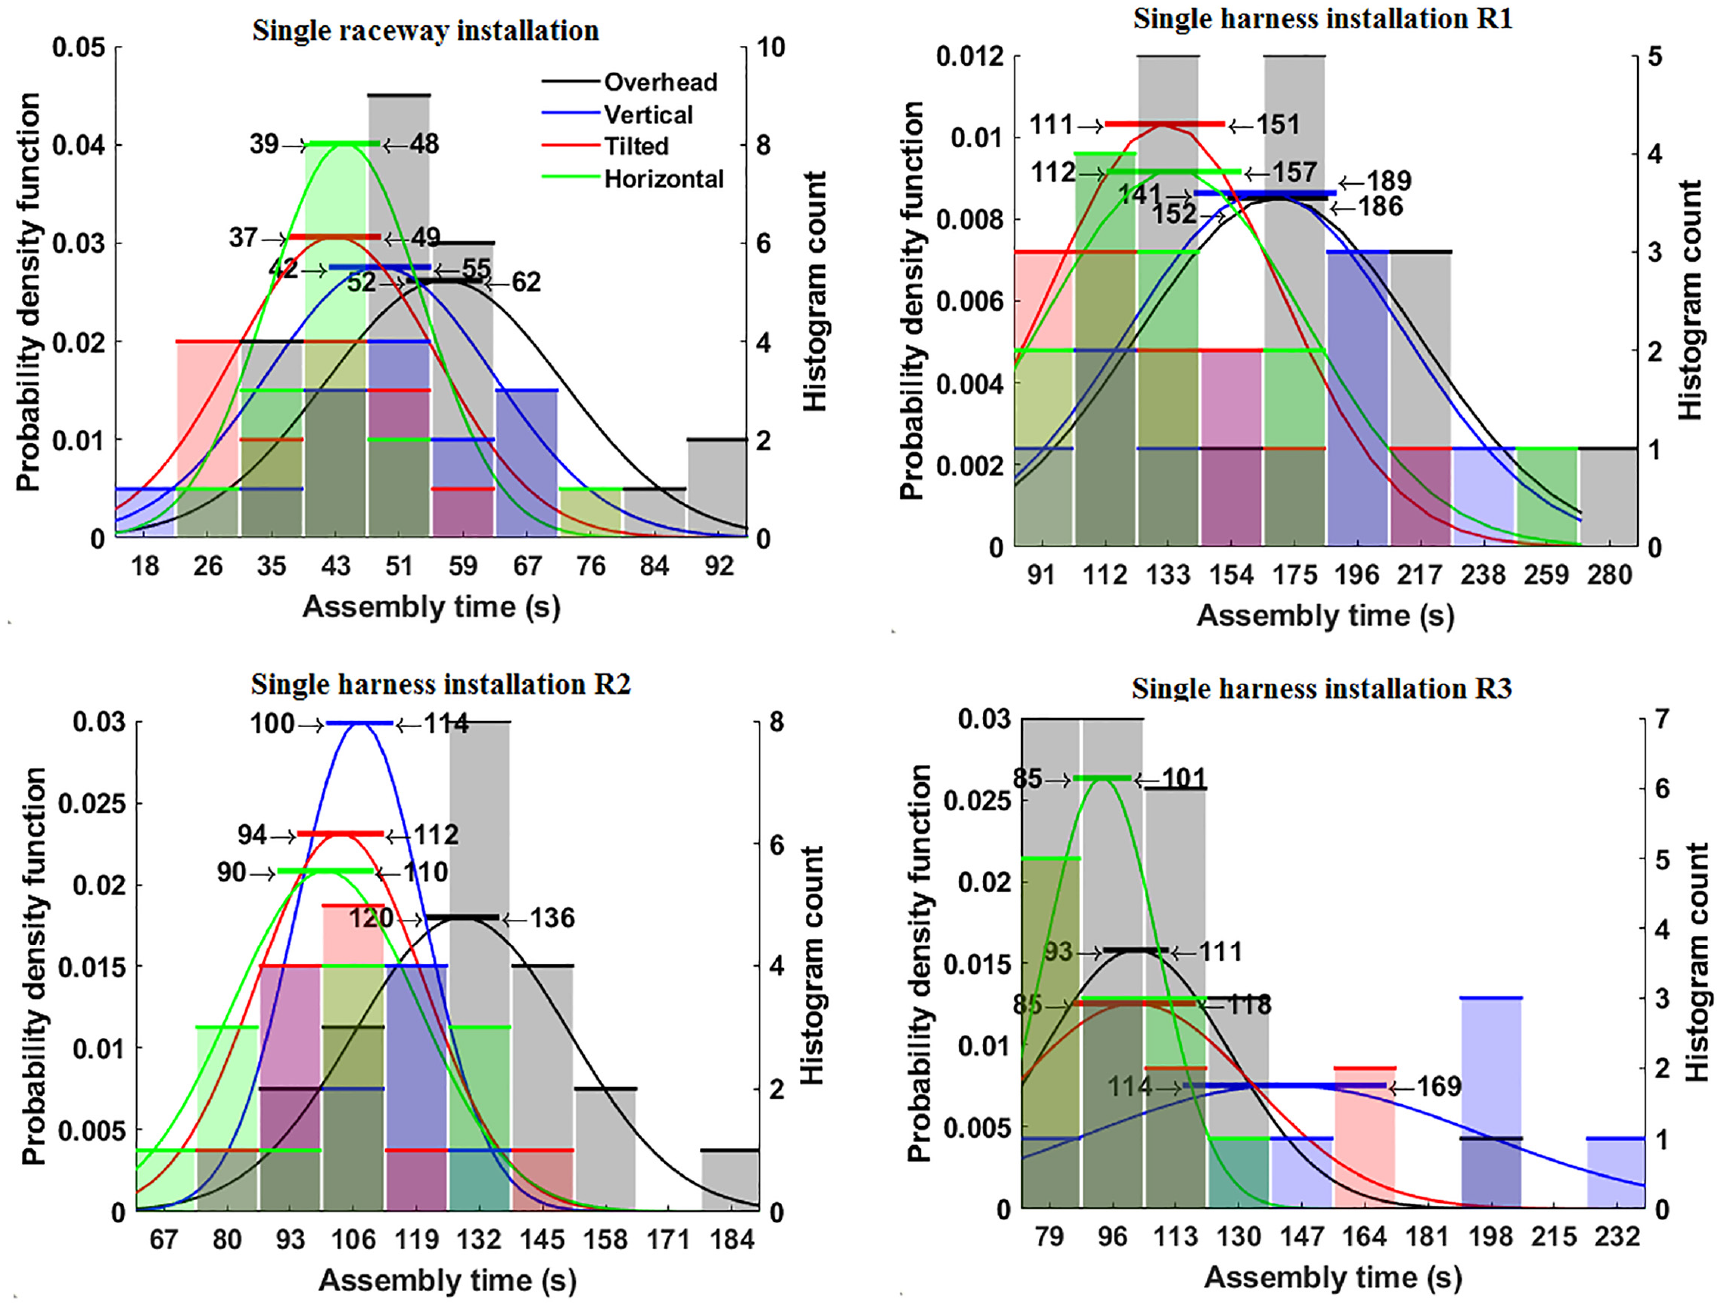
Action step assembly time histogram, fitted normal distribution and CIs.
The assembly time ratio fitted normal distributions and CIs are shown in Figure 12. All new orientations are shown to provide an assembly time reduction compared to the overhead orientation, except for the vertical orientation. It only provides a reduction during the harness installation at R2 action step, whereas the other action steps are not statistically significant.
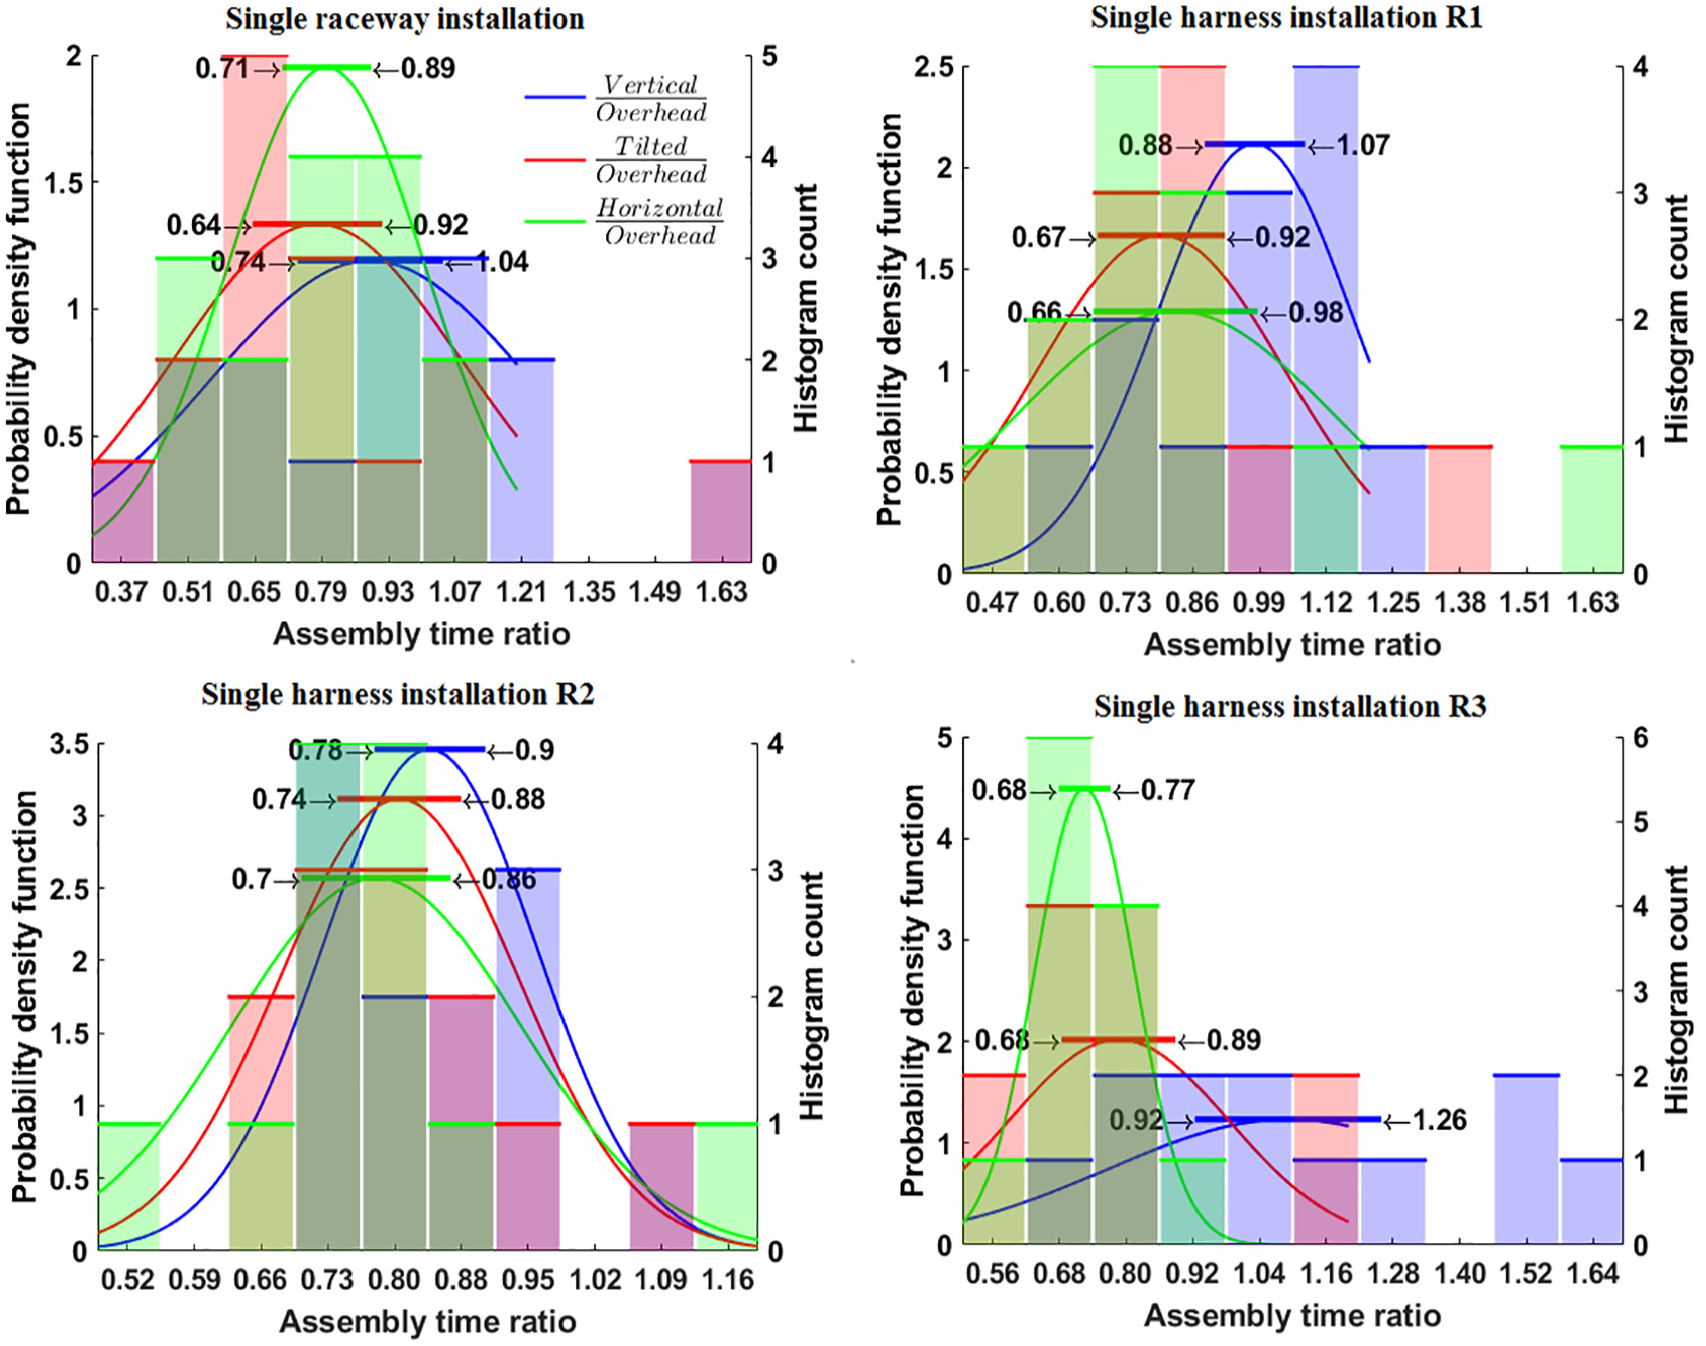
Action step assembly time ratio histogram, fitted normal distribution and CIs.
Comparison of absolute and relative analysis approaches
Since both approaches provide results of change in assembly time ratio CI due to a change in orientation, a comparison can be made. The absolute approach does not always have a statistically significant result to establish an assembly time ratio, hence only a partial comparison between the analyses approaches is possible. Figure 13 shows this comparison of assembly time ratio CIs of the three tested orientations and the action step samples.
Assembly time ratio confidence interval comparison between absolute and relative data analysis approaches.
There is general good agreement in the CI for both approaches, with the average CI difference between the approaches less than 5%. Only the harness installation at R3 shows a large difference of 30% for the vertical to overhead assembly time ratio CI averages. Here, the absolute analysis approach gives a significantly higher estimation of the time increase for the vertical orientation, compared to the relative approach.
Another general observation is that the relative approach has a narrower CI, compared to the absolute approach, as expected.
Learning rate and participant preference results
The learning rate results are established by a comparison of the two overhead orientation samples. The fitted normal distributions to the action step samples are shown in Figure 14, with CI magnitudes highlighted. They show a range between 43% and 3% reduction, indicating that counter balancing for learning rates for such assembly tasks is essential.
Action step comparisons for the repeated overhead positions and indicator of participant learning rate.
After completing the installation activities for all orientations, participants were asked to rank the orientations from least to most comfortable. Overhead is consistently ranked as the least comfortable orientation. Tilted and horizontal are rank highest, whereas the vertical orientation is rather towards the lower end of preference. The results are summarized in Figure 15, with each plot indicating the total number of rank scores received per assembly activity and orientation. The harness installation at R3 rates the vertical position worse than the overhead, contrary to the other activities.
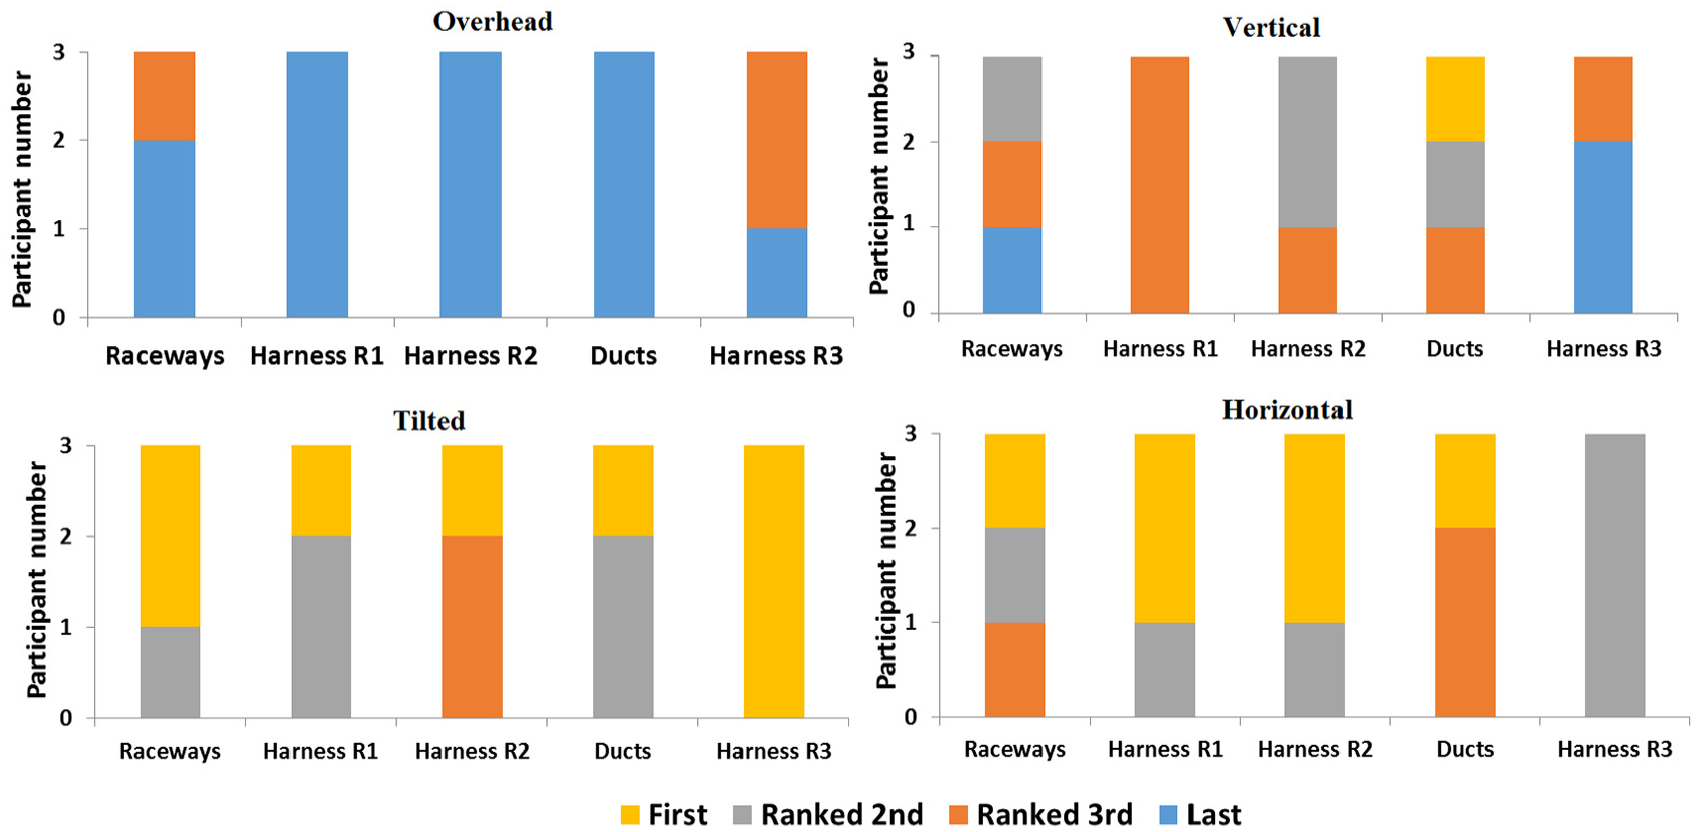
Participant orientation ranking results.
Discussion and conclusion
Two analysis approaches were utilized to establish a CI of assembly time ratio between the new investigated orientations on the reference overhead orientation. The main difference between them is the fact that the relative approach compensates for the participant’s manual work experience. The measured assembly times across the tested orientations are only related to each other for each participant. These non-dimensional assembly time ratios are then used to build the sample set of all participants. Strictly speaking, the relative approach does not remove all participant-related variability due to assembly skill. For example, the adjustment to working in different orientations in itself may be a skill which varies between participants.
Full experiment dataset
When combining all assembly experiment time results into a single dataset, a sufficiently large sample is available to conduct statistical analysis. This, however, disregards the task inherent differences between the five assembly activities. The number of action steps and components, tool usage and accessibility of the structure all vary across the activities. This leads to high variability in the combined data set. As Figure 7 shows, for the absolute analysis approach, this variability is combined with the total participant population induced variability, leading to results which do not allow for a statistically significant shift in CI of the average assembly time. However, the relative approach is just significant, with a wide CI from 30% reduction to 5% reduction for the tilted and horizontal orientations. The vertical orientation, however, is much more activity dependent and had both general trends of time increases and decreases across the combined set.
Action step datasets
Within each assembly activity, a number of action steps are repeated. This allows for an increased sample size for individual action steps. Strictly speaking, these repeated steps are not equal in terms of access conditions, as they have varying positions within the structure. This is visualized for the three raceway positions in Figure 16. Raceways R2 and R3 have relatively equal access for each channel position. The R1 positions vary; as two are located within the structural walls of slat track 1 and two are either side of the wall. As expected, such difference in access results in a shift of the mean assembly time for a single channel between the three positions as shown in Table 5. R1 takes the longest to complete, followed by R2 and R3. The relative standard deviation for position R1 is higher than R2, confirming the likelihood that the access differences for the raceway channels at this position are significant.
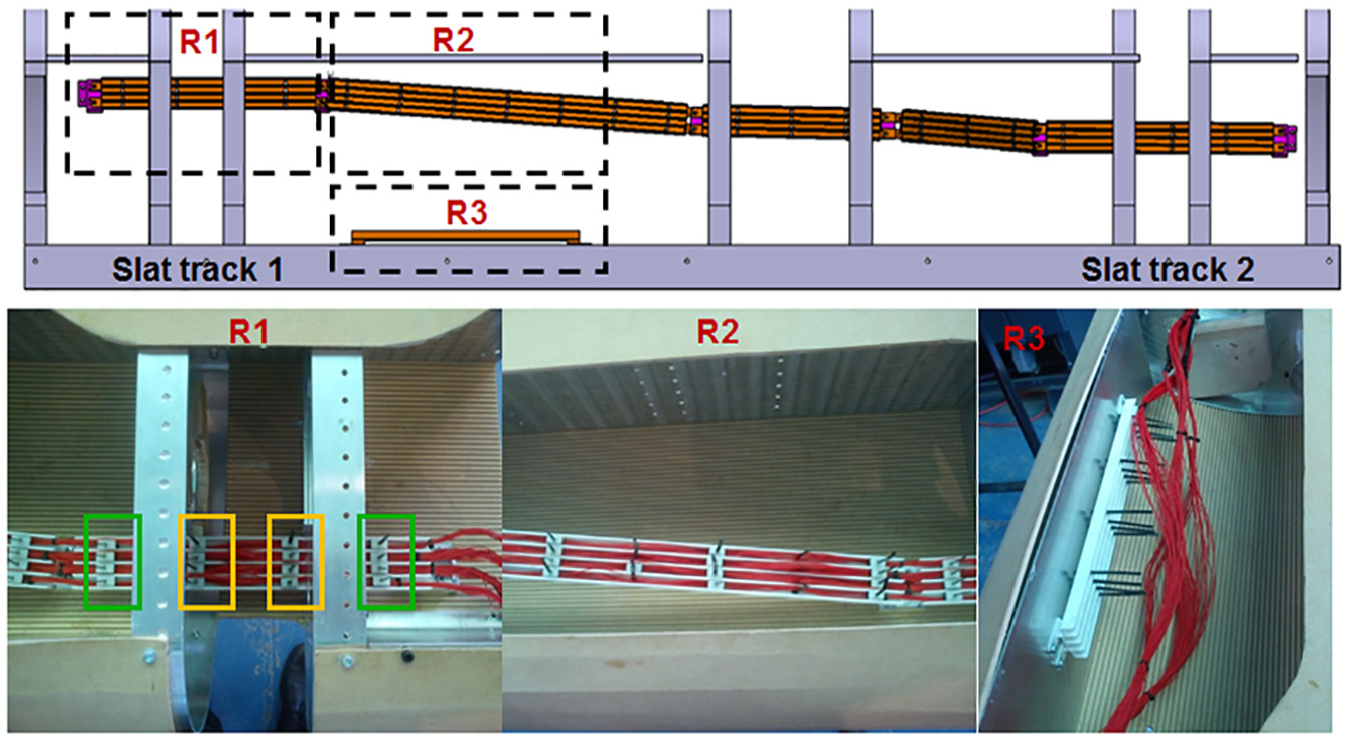
Harness installation activity positions.
Harness installation distribution results of the absolute analysis approach.
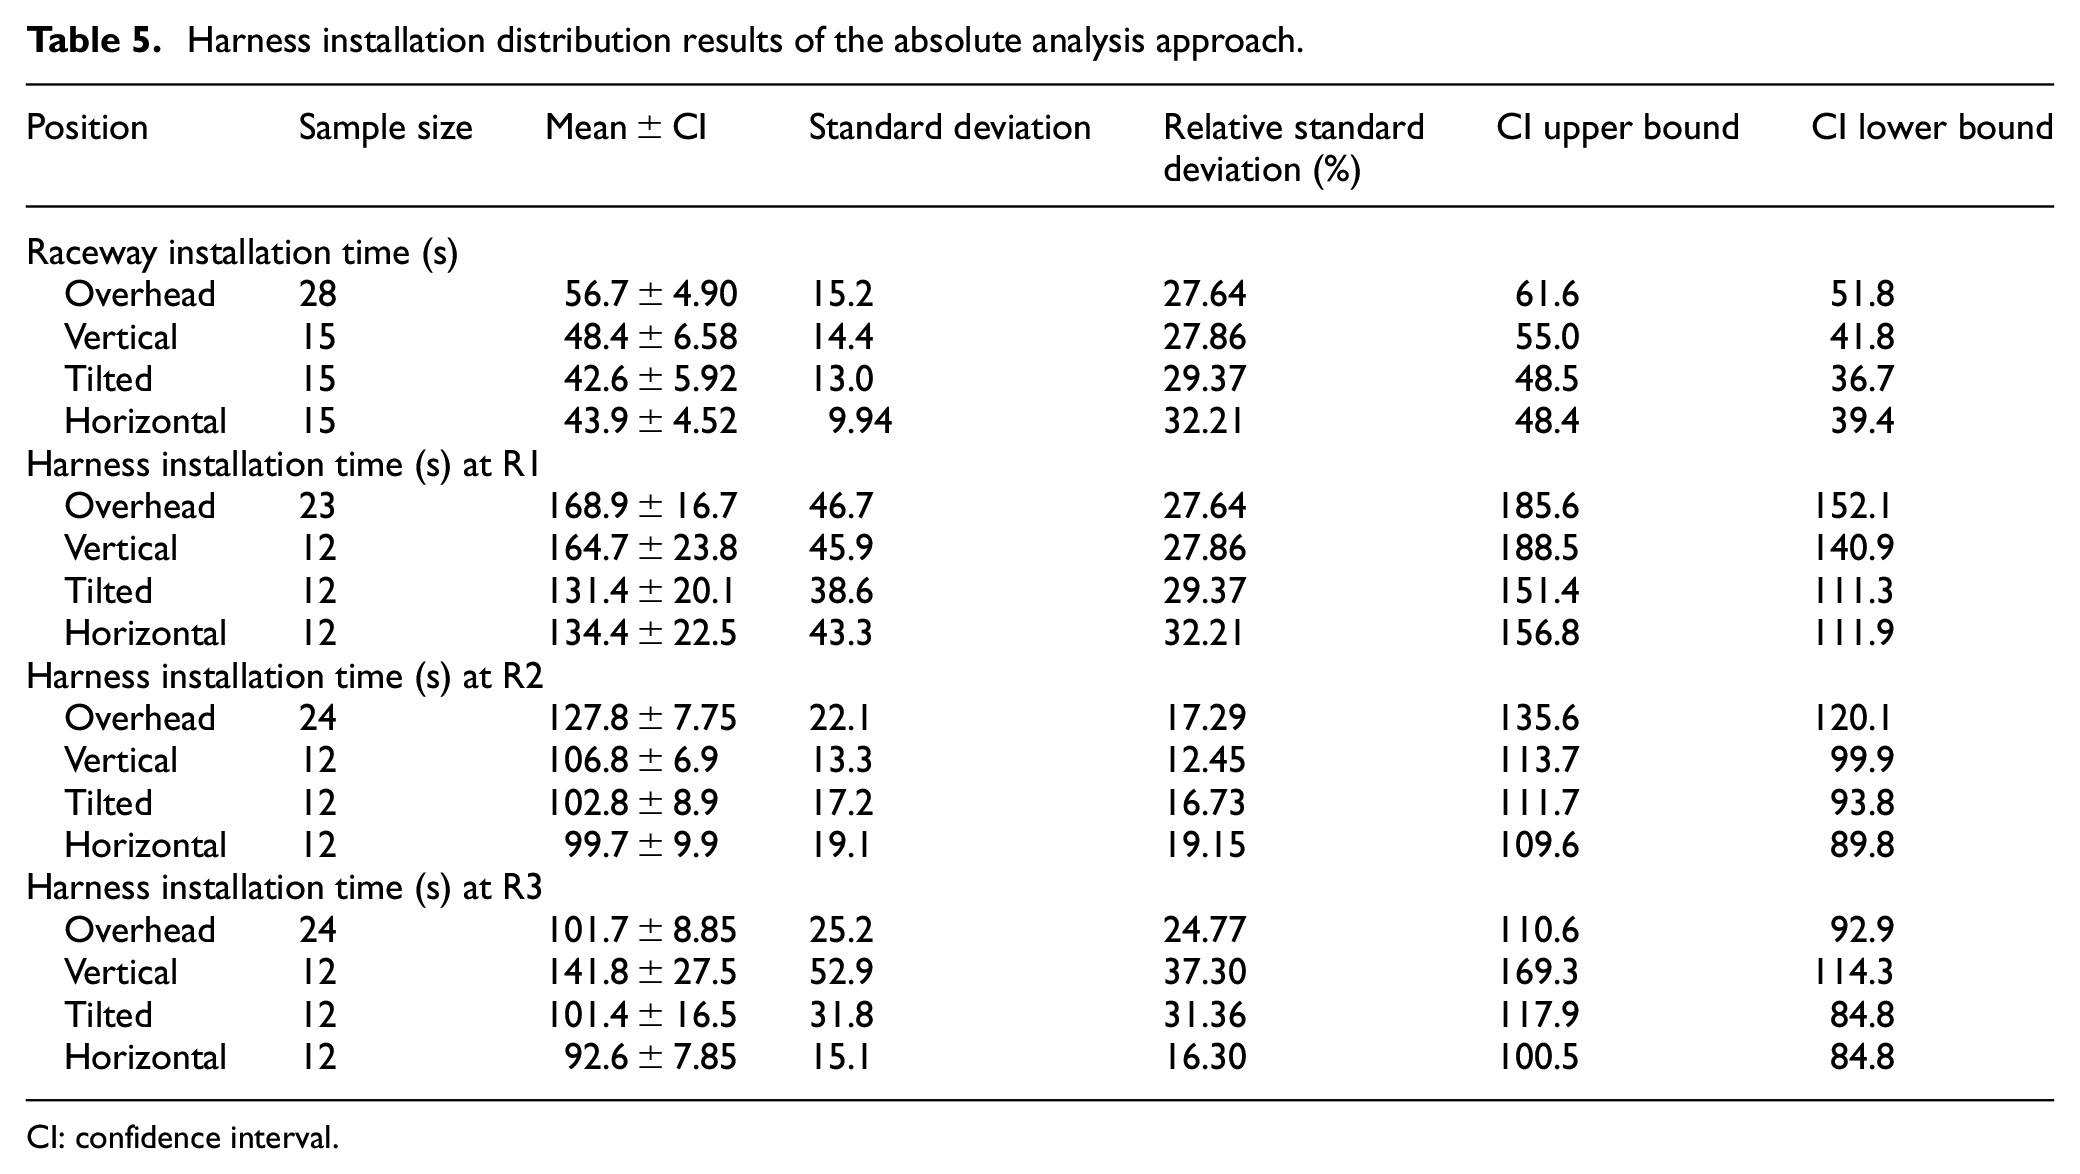
CI: confidence interval.
In spite of these additional accessibility-induced variations, the data analysis shows statistically significant results, with both the absolute and relative analysis approaches. The comparison in Figure 13 indicates that both methods provide similar result trends of assembly time ratios. However, the relative approach provides more cases of statistically significant time ratio CIs, with (9/12) and (7/12) for the absolute analysis approach. As expected, the CI for the relative approach is much narrower compared to the absolute approach, indicating that the manual work experience variability is a significant part of the total variance.
Generally speaking, the tilted and horizontal orientation shows a trend of reducing the assembly time, when moving away from an overhead orientation. Maximum reductions of around 30% are achievable; however, large variations exist between the different action step test cases. The vertical orientation was the least well-defined orientation with only the harness installation at R2 and R3 showing results. The harness installation at R3 is an outlier case, with assembly time likely to increase for the vertical orientation. This is probably due to the fact that the raceway channels face towards the floor in the vertical position, making this essentially an overhead working position. The increase in time is also mirrored by the participant preference data, where the vertical position is ranked last for the overall harness equipping activity at R3.
Even though the action step dataset analysis results are statistically significant, both approaches do not identify within the tested orientations where the highest reduction can be achieved. If all result CIs would have been non-overlapping, the best orientation per action step could be determined. This may be possible with a larger sample and/or a reduction in variability. The main sources of variability are likely to be the participant’s physical specific characteristics and the differences in raceway and channel locations. Addressing these should therefore be the starting points for a future re-designed experiment.
The established reduction ratios have a relatively wide CI, which may need to be narrowed if it is to be used as a basis for decision making in pre-equipping station design. The results also showed that there may be an assembly time increase for some tasks when a change in orientation is made. Ideally, each assembly action step requires a specific structural part orientation to minimize the assembly time. Within an industrial environment, this is unlikely to be feasible in an economic sense; hence, a best compromise needs to be chosen. This work’s data indicate that the tilted and horizontal orientation provide the best-case scenarios of time reduction and are also ranked as most comfortable by the participants. Further experimental work is required to determine whether there are dominant best-case orientations over the set of activities.
Learning rate and orientation ranking
An impact of the learning rate on mean assembly time during the five repetitions over the orientations is shown in Figure 14. This learning rate bias has been eliminated from the orientation-induced assembly time changes, by counterbalancing the order of the orientations. Even though the first overhead orientation is likely to be the slowest and the last the fastest, their combined sample essentially balancing out the learning bias for these fixed orientations. Participant preference results closely mirror the outcomes of the average reduction due to orientation change. Even the harness R3 action step showing a time increase for the vertical position is mirrored by it being ranked low by the participants. A downside to the fixed initial and last overhead orientation is that it may be a source of bias during their orientation ranking. Hence, the chosen partially counterbalanced experimental design has the ability to provide learning rate–independent results, while giving a magnitude estimate of the learning during the repeated activities. However, this has to be balanced against other qualitative data collection methods used.
Conclusion
An experimental investigation into the effects of structure orientation and manual aircraft system installation performance has been conducted. Little previous work has been published in the field of manual aerospace assembly performance, with a focus on part orientation, and this work provides evidence of the time reductions that can be achieved by changing the orientation of the assembly operations. A laboratory demonstrator unit of an A320 equivalent front spar section was designed and built together with representative electrical and hot air system components. Five installation activities were carried out by 15 participants for four orientations. The orientations and system installation activities were selected in reference to a potential future wing leading edge system pre-equipping scenario, where the structural component orientation is more flexible compared to traditional processes. The activities were complex and could take up to 1.5 h to complete for all orientations; hence, the sample size was limited. The raw data were analyzed with two sampling approaches.
First, samples for action steps repeated within the assembly activities, and second, the total combined sample of all 15 participants for each tested orientation. For each sample, standard statistical analysis methods were applied. Outlier data points were identified, the sample tested for a normal distribution match and the 95% CI of the mean assembly times computed.
The main conclusions of this research are summarized as follows:
The best-case scenarios reduce assembly time between 11% and 36% for raceway installations and 2% and 34% for harness installation at raceway positions R1, R2 and R3.
Such reductions are achievable with a change to the tilted or horizontal orientations, whereas the vertical orientation only shows a reduction of between 10% and 22% for the harness installation at R2 task.
The CI results of the relative and absolute data analysis methods have a lower than 5% difference in average CI reduction rates, except for the harness installation at R3 task.
The assembly time results are mirrored by the participant ranking data, where overhead and vertical are poorly ranked, compared to tilted and horizontal orientations.
These results are of value to designers of future wing systems and assembly station layouts from the perspective of structural orientation and assembly task interaction. They are transferrable to a range of civil to military vehicles, which employ extensive harness and raceways-type electrical systems.
Wing systems assembly is a bottleneck in aircraft wing manufacture and based on the experiment’s reduction values of up to 36%, and one can conclude that there is an opportunity to make substantial savings on assembly time for wing systems, by choosing a non-overhead position for the structural component. Future work should narrow the CI, to improve estimates of the reduction rates. We also assumed that an improvement in assembly performance will coincide with an ergonomic benefit. However, this needs to be confirmed by a detailed ergonomic impact study. Finally, the range of assembly activities tested could be extended, making results applicable to a wider range of system installation activities currently completed overhead.
With such information available, a trade-off decision can be made by assembly station designers when selecting a fixed orientation of the wing structure component, to which systems are to be installed. Alternatively, an adaptive jig may be employed to vary the orientation in reference to the current installation activity, as is common practice in the automotive industry. The choice of assembly orientation will also affect the floor space requirement for wing assembly operations. Hence, the decision will be driven by the amount of additional time savings achievable against the additional capital expenditure required for the procurement of the jig, floor space requirements and return on investment targets.
Footnotes
Appendix 1
Acknowledgements
The authors would like to acknowledge and thank participants, staff and Mr Miguel Alvarez Frias for their contributions to the experimental trials organization, manufacturing and execution. Furthermore, the support by Airbus UK is recognized and appreciated.
Declaration of conflicting interests
The author(s) declared no potential conflicts of interest with respect to the research, authorship and/or publication of this article.
Funding
The author(s) disclosed receipt of the following financial support for the research, authorship and/or publication of this article: The authors acknowledge the funding and support from the UK’s Aerospace technology institute (ATI) through the Future of Aircraft Factory project (No. 113045).