
Abstract
The concept of “sustainability” has recently risen to take the old concept of going “green” further. This article presents general methodologies for sustainability assessments. These were then adapted to measure and assess the sustainability of welding processes through building a complete framework, to determine the best welding process for a particular application. To apply this methodology, data about the welding processes would be collected and segregated into four categories: environmental impact, economic impact, social impact, and physical performance. The performance of each category would then be aggregated into a single sustainability score. To demonstrate the capability of this methodology, case studies of three different welding processes were performed. Friction stir welding obtained the highest overall sustainability score compared to gas tungsten arc welding and gas metal arc welding.
Introduction
The most widely accepted general definition of sustainable development is provided by the United Nations’ Brundtland Commission: “development that meets the needs of the present without compromising the ability of future generations to meet their own needs.” 1 This development has seen particular impact in the manufacturing field over recent years, and to further clarify sustainable manufacturing, it has been defined by the US Department of Commerce as “the creation of manufactured products that use processes that minimize negative environmental impacts, conserve energy and natural resources, are safe for employees, communities, and consumers and are economically sound.” 1 Recently, there has been increased pressure on manufacturing companies to think beyond the economic benefits of upgrading processes and products by additionally considering the environmental and social effects. In order to promote the virtues of sustainability, governments, educational institutions, and manufacturers initiated various programs to educate and explain sustainable processes and products to end users. Such initiatives stressed the core principles: minimizing environmental impact and maintaining social and economic benefits. 2 Julian Allwood 3 suggested five techniques intended for more sustainable manufacturing: increasing manufacturing efficiency, substituting any nonsustainable raw material for sustainable alternatives, minimizing manufacturing waste with the aim of elimination, increasing recycling and reuse of waste, and developing better supply chain management structures.
With the constant rise of the need for sustainable manufacturing processes and products, a standardized methodology or framework for the quantification and assessment of sustainability performance became essential. In spite of having an abundance of research to produce a wide variety of assessment criteria, the results have been inconsistent and subjectively biased with the prime examples being the numerous indicator sets and indices. 4 The lack of focus in indicator sets added to manufacturers’ confusion when attempting to select indicators for quantifying sustainability. After a vigilant study, Gaurav et al. 5 clarified that major sustainability metrics were inconsistently defined and largely business specific. Therefore, indices were created as an alternative means of providing a more direct result of sustainability performance. Indices rely on weight-based mathematical equations to aggregate several indicators into a single score. Analyzing the single score allows a sustainability level to be set and used as a metric for performance. The National Institute of Standards and Technology (NIST) has come up with categorization of sustainability indicators that classifies a large number of indicators into appropriate categories and subcategories, which provided a holistic structure to segregate all the possible indicators from which end users may choose to assess sustainability. 4 Five main categories were created: environmental stewardship, economic growth, social well-being, performance measurement, and technological advancement indicators.
In an aim to produce more standardized sustainability indices, studies have been applied to various manufacturing and industrial applications. A good example would be the work done by Saad et al. 6 who proposed a general methodology to be applied to the manufacturing processes. As mentioned, they aim to assist the community in making better decisions when choosing different designs, products, processes, and so on. In another example, Gupta and Laubscher 7 compared a variety of studies which studied the sustainability of titanium alloy machining. Similarly, Hegab et al. 8 have created a sustainability assessment methodology for machining. Improving energy efficiency of machining tools was the focus of Zhang’s 9 study. Welding has not been receiving much attention from the sustainability perspective. Rather, research on welding has been more focused on developing welding processes, studying applications on different metals, and improving weld performance and quality; meanwhile, society, economy, and the environment were rarely considered. An example would be Shrivastava et al. 10 running a study on friction stir welding (FSW) and gas metal arc welding (GMAW), where Shrivastava et al. 10 have considered the tensile strength, emissions, and energy consumption in their comparison. The economic factor was not taken at all. Similarly, Suri et al. 11 conducted a similar study on FSW at different weld speeds against a gas tungsten arc welding (GTAW) sample. In contrast to the preceding paper, not only was the yield strength measured for performance, but plastic behavior, surface appearance, microstructure, strength, hardness, and elongation were also taken into consideration; the study was solely directed toward performance comparison. Olabode et al. 12 developed a theoretical methodology for the selection of welding processes based on their application. This methodology adapted the results of a survey given to welding experts. This survey asked the experts to rate the importance of various indicators to each of the welding processes. These factors included performance and economic indicators, but no environmental and social factors were considered. Salerno et al. 13 conducted a study to measure the efficiency of GTAW of Inconel 718. Bevilacqua et al. 14 proved that FSW has a lower environmental impact than GMAW during aluminum welding. Zhan et al. 15 have compared continuous and pulsed metal inert gas (MIG) to show that the pulsed method is more suitable for welding Invar 36 alloy.
As discussed in the literature review, sustainability as a notion has been well established, and it is being applied to applications sequentially to provide a more holistic approach for decision making. Most of the studies were at the product level and were focused on a limited number of indicators which did not cover all sustainability dimensions. None of the studies performed on welding processes can be considered a comprehensive sustainability study. Therefore, the objective of this study has been to establish a welding sustainability assessment methodology, which would provide a tool for engineers and researchers to decide the most sustainable welding process for particular applications. The proposed methodology considers four main categories: physical performance, environmental impact, economic impact, and social impact. Each category was assigned with a set of indicators to quantify the score of the welding process of the respective category. The selection of these indicators and the development of the mathematical equations, which would form the category scores, were discussed in the following sections. The scores for all indictors were determined and then aggregated into a single score for each welding process.
Welding sustainability assessment: model development
Upon determining the welding processes to be assessed for a desired welding application, the applicable sustainability performance categories for welding need to be chosen. Categorization allows the user to evaluate sustainability performance in different areas independently. Moreover, having defined the categories but not the indicators allows for more flexibility in varying the relevant indicators for future studies. Nevertheless, relevant, measurable indicators must be carefully selected to make sure that all aspects of the assessment are being captured. Ultimately, the results of these categories would be aggregated to give an overall sustainability score. For the welding assessment, the categories chosen are physical performance, economic impact, environmental impact, and social impact. The technological advancement category suggested by NIST 4 will not be taken into consideration, as it is more suited for an assessment of development, while this methodology is being developed for existing processes.
To quantify a score for each category, all indicators within each category have to be normalized and scaled before being added. Upon examining the scores of all categories, conclusions may be drawn to identify strengths and weaknesses. Carrying forward, development plans may be set in place to resolve the weaknesses. Once a category is designated, a study of its indicators might draw a better picture of what the particular process excels or lacks. In the case of a particular indicator that is hindering the performance of the process, resources may be directed at improving that particular indicator.
In a decision-making environment, studies are carried out to decide the best existing alternative and implement it immediately. Thus, it would be important to combine the results of all categories into a single score to aid high-level decision making. It would be intuitive to claim that taking the mean would be a simple and effective solution. However, with the existence of multiple categories, various individuals who may use this methodology would state that some categories might be more important for a particular application. Therefore, a weighted average may prove to be more appropriate. Ramos and Caeiro 16 suggested two ways in which the weights may be determined. The first is to have a panel of experts to meet and discuss the methodology and assign the weights based on their experience. The second method involves crafting a survey and distributing it to several individuals who have a background of the application and ask for a wider range of opinions in order to allow the end result to be as unbiased and as objective as possible. The study adopted the latter method, and the survey was distributed to individuals from the industry and the academic fields.
The final step is to have a graphical representation of the sustainability scores with the aim of giving the decision makers as much information as possible by simply examining one figure. In this study, an area graph is suggested for the representation of sustainability assessment. The proposed representation holds many advantages such as having the weightage, category score, and aggregate score all on a single graph. In addition to that, the area can be easily perceived and understood by users. The ultimate aim of such representation is to provide end users with a sort of “stamp” that could be branded on processes or products to show sustainability information that can be easily understood.
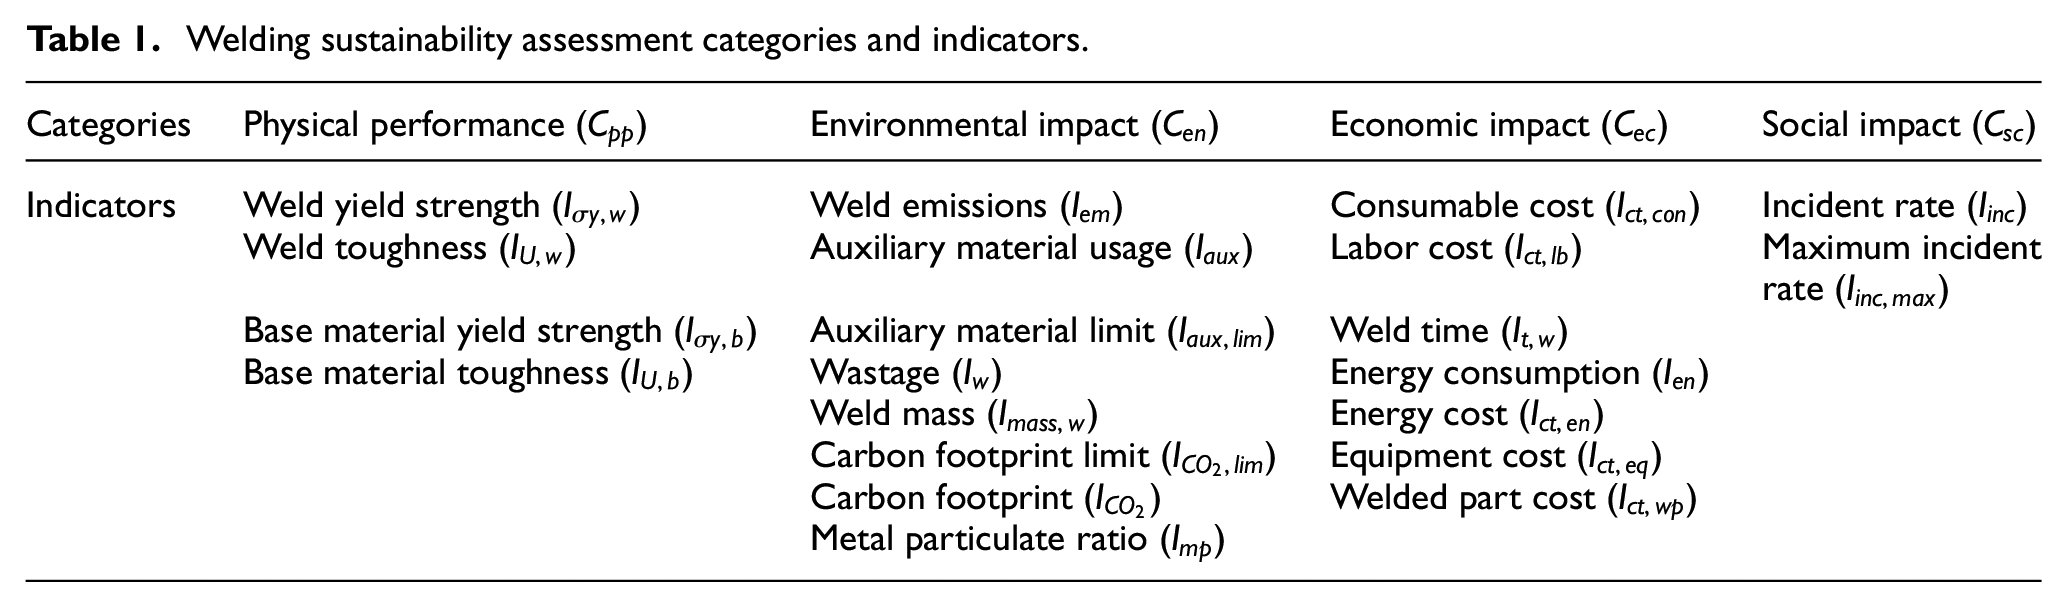
A summary of the general framework used in this study for sustainability assessment of welding processes is presented as a flowchart in Figure 1. The categories and their respective indicators used in this study are summarized in Table 1. These indicators were selected because of their relevance to welding processes, they cover all sustainability dimensions, and they can be measured with the available tools and accessible data. 17 The categories, indicators, scaling and normalization, and weighting and aggregation of this specific study are detailed in the following subsections.
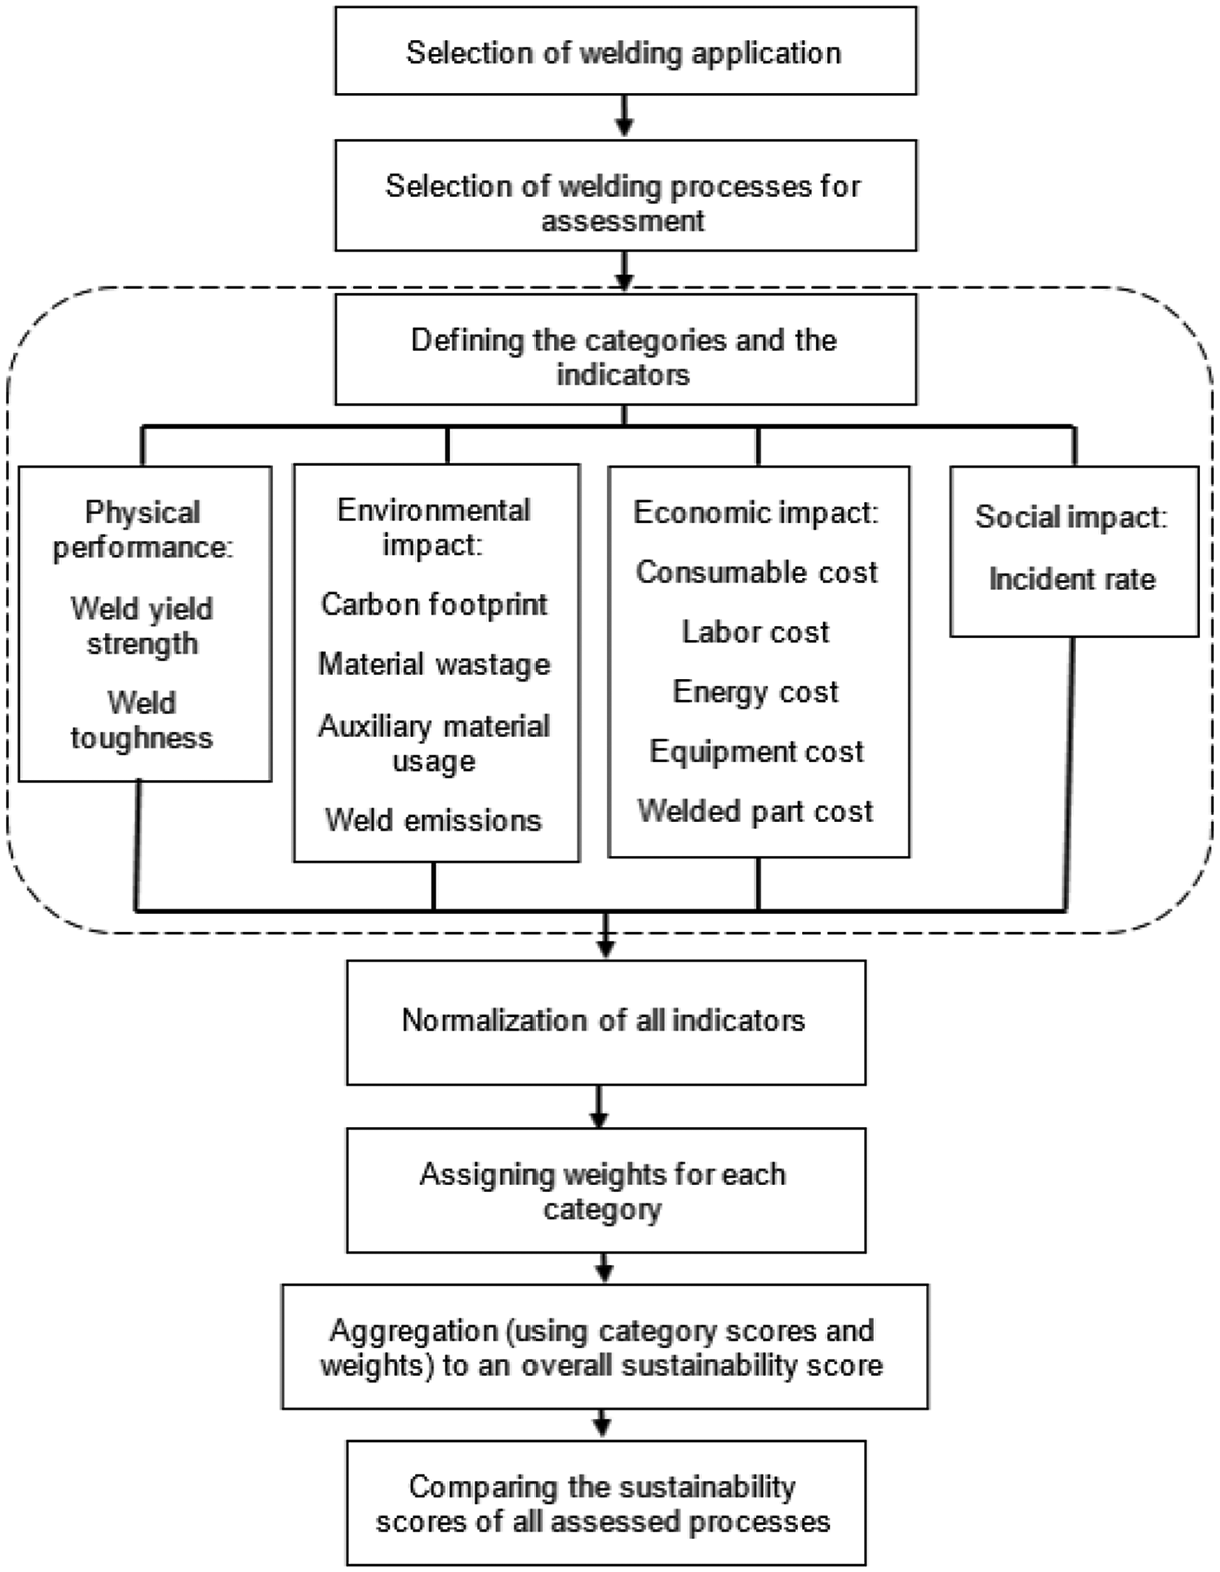
Welding sustainability assessment methodology.
Welding sustainability assessment categories and indicators.
Physical performance
This category aims to score the welding process concerning the physical properties of the weld. These indicators are used to measure and quantify material properties of the weld relative to the base material. Yield strength and impact toughness were selected as the main indicators in this study due to their importance and significance in welding applications.
It is acknowledged that there exist various alternatives to the aforementioned indicator, namely, quality-related indicators. These may include visual appearance, defects, and roughness. However, for the purposes of this study, it was assumed that any weld, which lacked in quality, should not be qualified for the assessment. Hence, if during welding defects are identified, the whole sample should be rejected and a new sample has to be made.
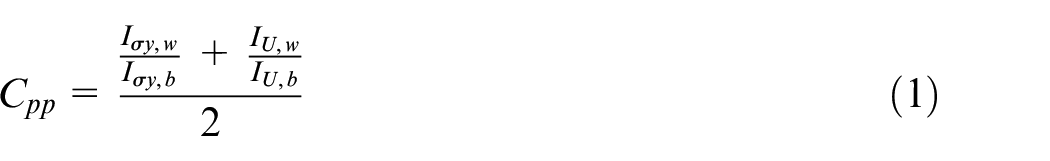
In order to develop the equation to calculate the physical performance score, both indicators have to be combined in an arithmetic mean. However, as they both are measured in different dimensions, they first have to be scaled to apply an arithmetic mean properly. In this case, both the weld yield strength and the weld impact toughness were divided by that of the base metal. This guarantees that indicator ratios vary from zero to one. The arithmetic mean can then be formed, as shown in equation (1)
Environmental impact
One of the greatest growing concerns regarding all manufacturing processes is the impact on the environment. For this study on welding processes, the indicators considered were the material wastage and weld emissions.
Material wastage
For countless reasons, manufacturing processes tend not to utilize the raw material completely and a certain amount of this material is wasted beyond further use. In welding processes, this amount is usually small, but it must be captured for the sake of the study. This would include any mass which would be disposed of (cut off) or which has disappeared (emitted) after welding. This value would be compared to the weld mass.
Weld emissions
During welding, several materials are emitted in the surroundings. These include the following:
1. Auxiliary material used as shielding gas
A few welding processes use auxiliary material for shielding the hot, reactive weld from the atmosphere. Shielding is mostly removed after the weld cools down either by hammering to break solidified slag or through diffusion of shielding gas into the atmosphere. This was calculated by dividing the actual usage by the recommended usage of the auxiliary material.
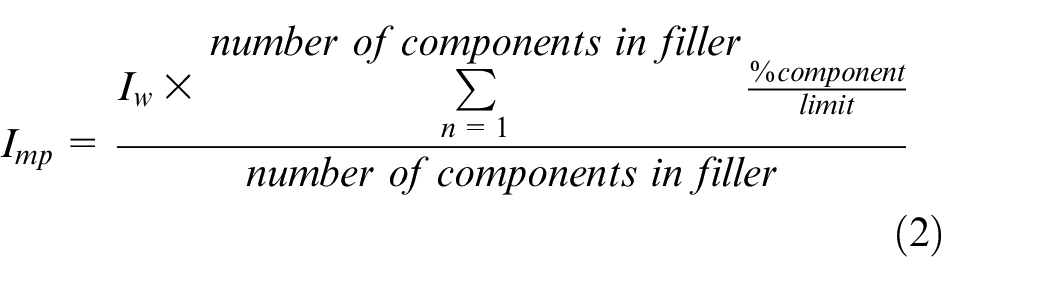
2. Metal particulates from the filler rods/wires
For the metal particulates, the wasted material emitted to the atmosphere is first calculated. The estimated composition of the emitted material would then be determined from the respective filler’s material safety data sheet (MSDS). The emitted compositions would then be divided by the allowable limits from an official safety organization. This ratio would be nondimensional, as shown in equation (2)
3. Carbon dioxide (CO2) from the electricity generation
To normalize the carbon footprint, the amount of CO2 produced must be compared to the CO2 limit. The carbon footprint and the limit may be calculated using the local electricity authority rate. This amount can then be scaled to match the welding time, as shown in equation (3)

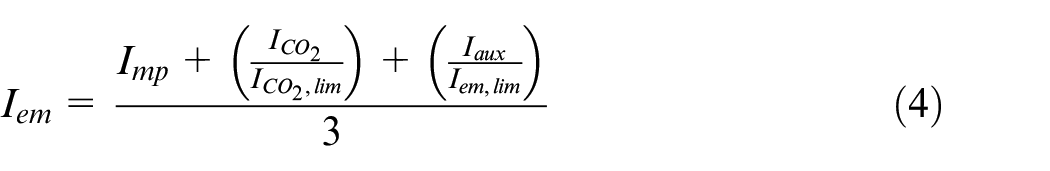
These emissions all are harmful to the environment. Therefore, they were quantified and aggregated into a single indicator, as shown in equation (4)
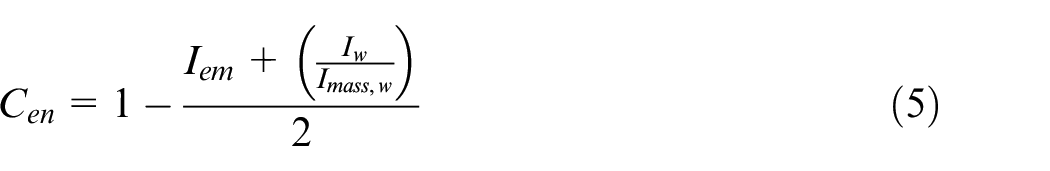
This concludes the normalization and scaling of the environmental indicators, and the complete environmental impact equation is shown in equation (5)
Economic impact
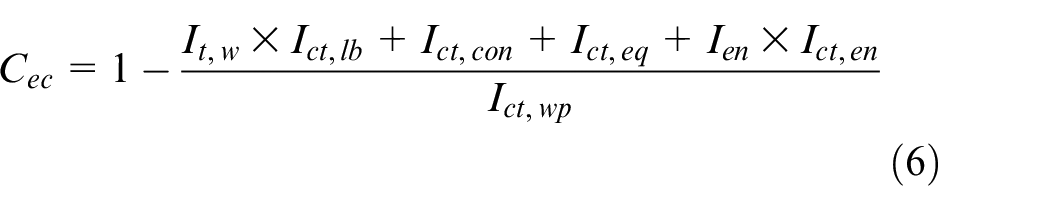
The economic impact category should be taken into consideration as it measures how much would a user need to invest to obtain the corresponding physical performance, environmental impact, and social impact. Blodgett 18 developed an equation that can be used to calculate the cost of the weld. However, the result of that equation is a currency. To render the outcome dimensionless, this total cost would be divided by the cost of the individual unwelded sections, as shown in equation (6)
Social impact
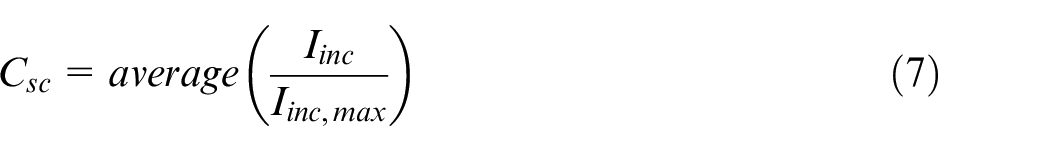
In their paper on the categorization of sustainability indicators, Feng et al. 19 have discussed the social impact indicators in three different parties: customer, community, and employee. The focus of the social impact indicator in this methodology would be the employee (welder). For the employee, there are three indicators that can be considered: health and safety, development, and satisfaction. For this study, health and safety was solely chosen. The risk of injury would be first taken from record, experience, and statistical data for each welding process. The rates would be divided by the respective annual highest occurring incident rate among manufacturing and construction processes for that particular process. The equation used is shown by equation (7)
Aggregated sustainability score
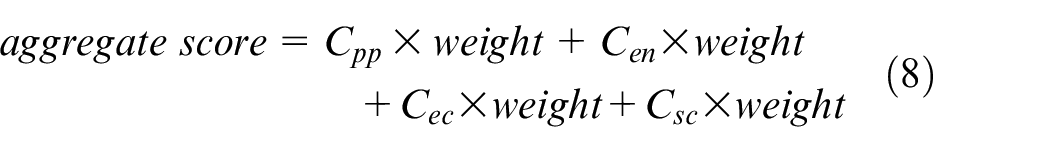
After the formation of the equations for each of the individual categories, it would now be possible to assess welding processes for each of the categories. However, to obtain an overall sustainability assessment value or score, the categories’ scores need to be aggregated. As suggested in the beginning of this section, a weighted average approach has been found most suitable. The weights would be determined through issuing and analyzing the survey results. Once these weights have been determined, equation (8) would be used to find the overall aggregate sustainability score
In order to visually represent the outcome of the assessment, it is suggested to illustrate the score. The aim was to have a graphical representation to give the hypothetical decision makers as much information as possible by simply examining one figure. From the literature, it was found that quite a few representation methods are used, such as radar plots and bar charts. Although these traditional methods are simple to interpret, their usability is hampered. The scores from each category have to be extracted, and then the aggregate score would need to be computed. Moreover, category weight information would need to be conveyed independently.
The case study
This section discusses the case study used to demonstrate the capability of the suggested sustainability assessment methodology. The application chosen for the processes was the welding of aluminum alloy 5083 plates, as will be highlighted in the sections below. Three welding processes have been selected as candidates to be assessed from a sustainability point of view, namely, GTAW, GMAW, and FSW. GTAW is an arc welding process that uses a nonconsumable tungsten electrode to create an arc through a potential difference between the electrode and the workpiece. Inert gas is also fed through the same electrode for shielding. GMAW is an arc welding process, which uses an inert gas (argon) for the shielding of the filler weld from oxidization. The filler is originally in the form of a wire wound on a spool. The wire filler and the gas are both simultaneously fed from the same nozzle onto the welding area. FSW is a solid-state joining process, which was initially developed for the joining of aluminum and other similar soft metals. 20 FSW does not require cover gas or flux. In FSW, the two main parameters that are controlling the process are the tool rotational and translational speeds. 21 The rotational speed affects the temperature of the tool and surface, while the translational speed is the one responsible for the movement of the tool in the desired direction. 22
Experimental details
The material used in this study is aluminum alloy 5083 in the form of 5-mm-thick plates. Two similar plates were welded using the process in question. The plates were fastened to a jig to ensure that they stayed in place during welding and as weld backing as required by the welding specification procedure.
For the proper and safe operation of the GTAW, GMAW, and FSW, the equipment was set up and run by an experienced welder in a well-equipped lab. To determine the most suitable parameters for each of the processes, recommended welding procedures and previous studies were taken as a reference. The parameters were in turn tested in the lab, and the best outcomes were chosen to represent the processes. Figure 2 shows the samples of successfully welded specimens using these process parameters, and a summary of the selected welding process parameters is shown in Table 2.
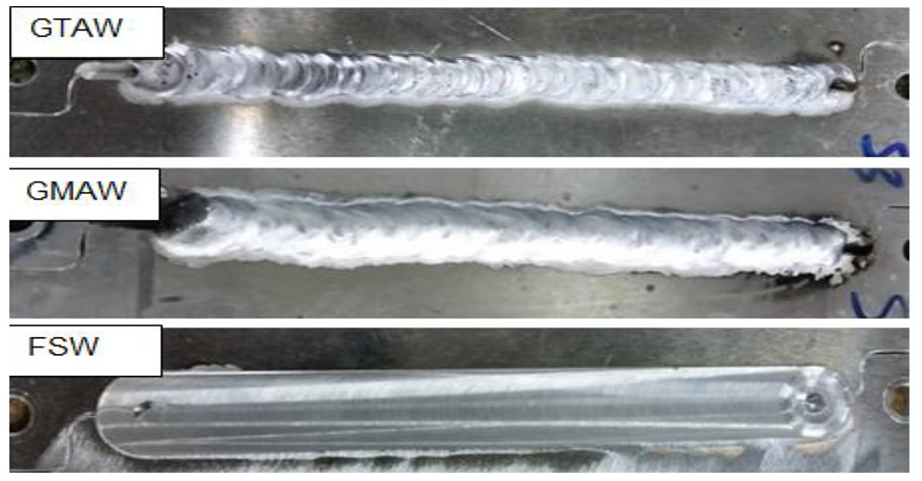
Welded samples using GTAW, GMAW, and FSW.
Welding process parameters.
GTAW: gas tungsten arc welding; GMAW: gas metal arc welding; FSW: friction stir welding.
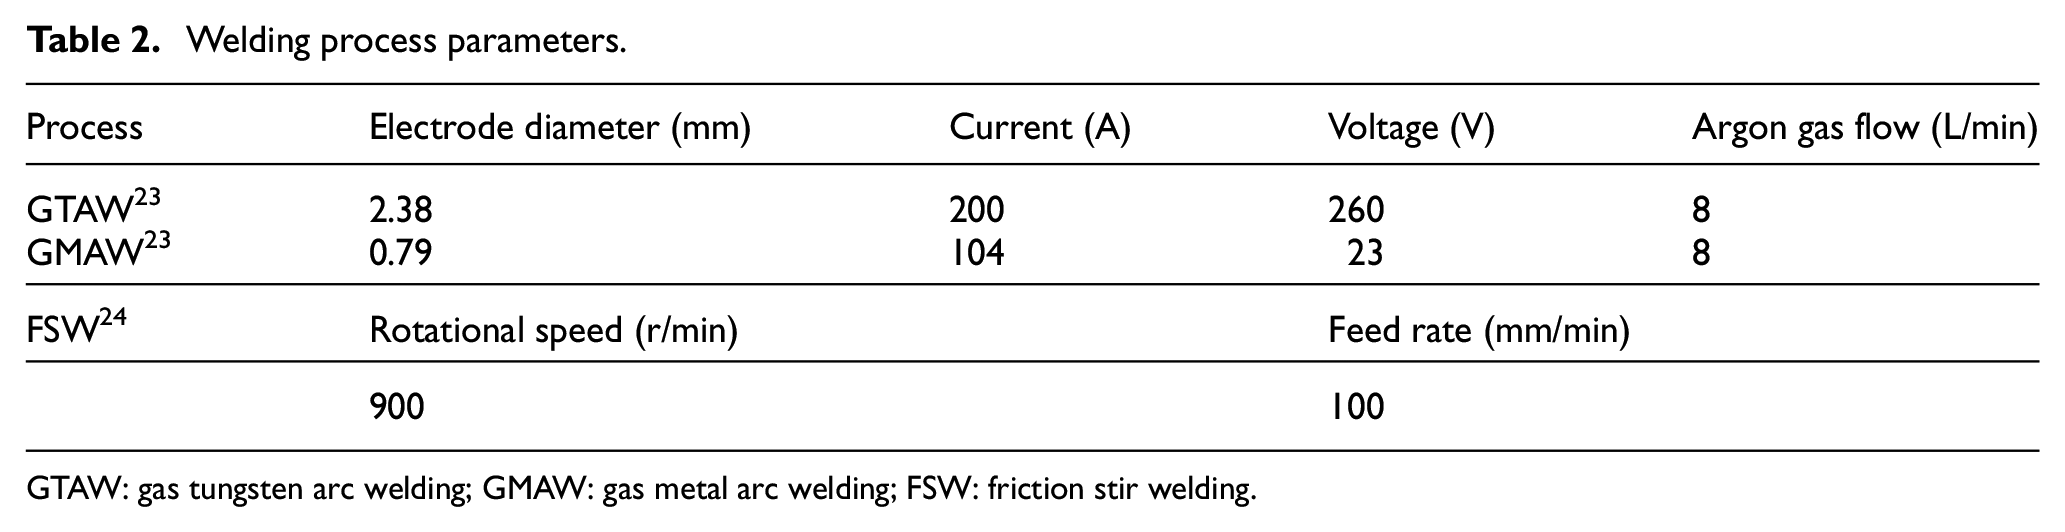
Upon successful completion of the welds, several readings were taken and the mean value was reported and used in this study. To measure the physical performance category indicators, tensile test and impact test specimens were prepared in the transverse direction with the standard dimensions as shown in Figures 3 and 4. These figures show the dimensions, approximate locations, and number of specimens taken from each welded sample.
Locations and dimensions of the tensile test specimen and the image and number of the tested specimen.
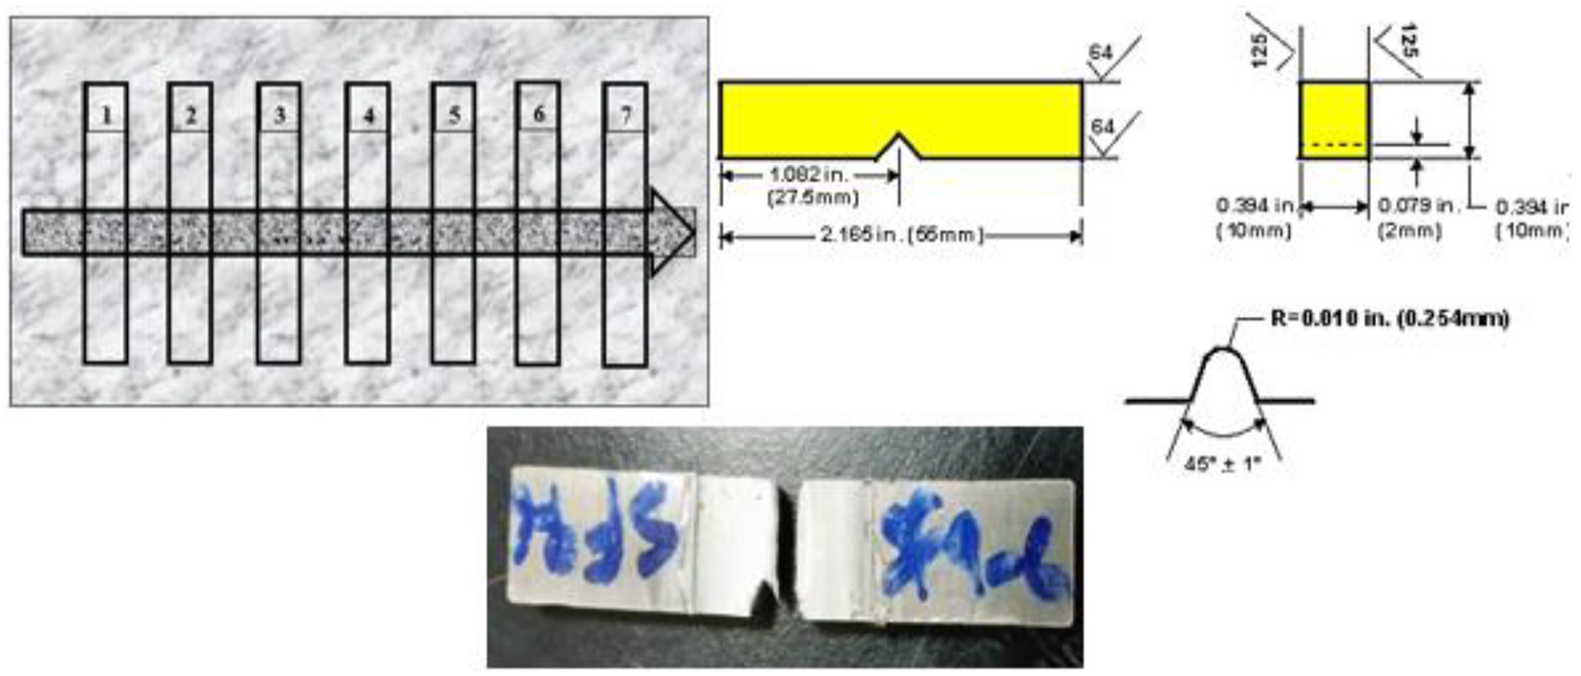
Locations and dimensions of the impact test specimen and the image of the tested specimen.
Methodology implementation
In order to run the case study and determine the most sustainable process for the application of welding two aluminum 5083 plates, the category equations formed in section “Welding sustainability assessment: model development” were applied. Parameters identified in the methodology were measured before, during, and/or after the welding as appropriate. They are yield strength, impact toughness, weld length, plate thickness, auxiliary material flow rate, filler diameter, final welded mass, plate weight, preparation time, preparation energy, welding time, welding energy consumption, grinding time, and grinding energy. Further required standard data were acquired from the literature, which include MSDS of filler material, 25 cost of filler material, cost of FSW tool, safety and health statistics, cost of electricity, and carbon footprint limit.
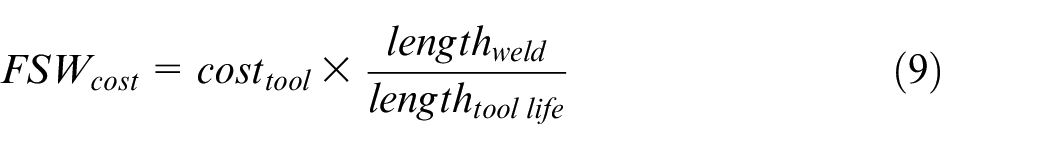
Cost of filler material and FSW tool
For arc welding processes, the capital cost was neglected and only the consumable cost was considered. On the contrary, FSW does not use a consumable per se. This led to using the FSW tool cost as the consumable cost. The FSW tool cost is calculated using the given tool life cycle and multiplying the tool cost by the ratio of the welding length to the tool life length. The tool life for the particular FSW tool used under the particular conditions was found to be 2000 m. 26 The calculation was performed as shown in equation (9)
Health and safety statistics
The incident rates were obtained and compared for each process. For both arc welding processes, the incident rate was taken for welding, but for FSW the incident rate was considered as that of machining. The Bureau of Labor Statistics (BLS)27,28 obtained the incident rates from annual reports for each of the occupations. To make the indicator nondimensional, the rates were divided by the maximum incident rate of manufacturing processes for each respective year.
Cost of electricity
The energy consumption was measured during the experiment using a PowerSight power consumption measurement device connected to a computer. This was then multiplied by the kWh rate, 0.23 AED/kWh. 29
Carbon footprint limit
CO2 emissions represent an environmental impact indicator. CO2 emissions are associated with the carbon footprint of each process. This is obtained by measuring the amount of energy consumed during the process and comparing it with the allowable CO2 emission limit for the particular duration of each process. In the UAE, each kWh of energy consumed produces 0.5 kg of CO2. The limit for CO2 emissions for industrial processes is 5000 kg/month. 29
After obtaining the outcomes from the category equations, a survey was carried out to determine the respective category weights for aggregation. This survey and the resulting weights are discussed in section “Results and discussion.” The methodology implementation is illustrated in Figure 5.
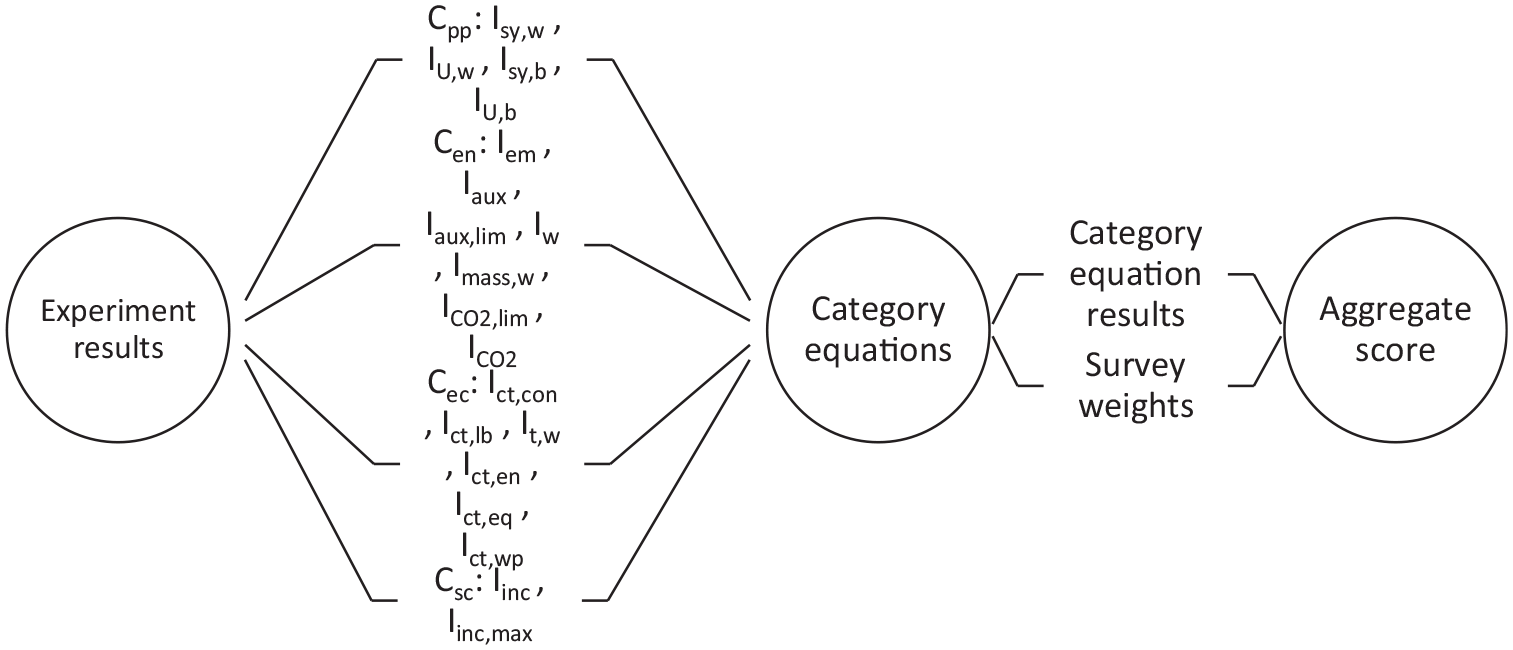
Sustainability assessment implementation on case study.
Survey implementation
As mentioned in section “Methodology implementation,” in order to aggregate the individual scores from all the categories into a single sustainability score, a weighted average method was used. These weights were obtained from a survey, which was distributed to people with a wide variety of professions, but all related to welding, namely, engineers, welders, professors, safety personnel, doctors, and environmental personnel. Those professions were chosen to eliminate bias toward any particular category. The total number of participants in the survey was 45, nearly an equal amount of engineers/professors/welders (23 participants) and doctors/environmental personnel/safety personnel (22 participants). For simplicity and directness, the survey only comprised two questions:
Question 1. The following list contains four factors related to the welding process. Please give the weights of the following factors to determine how important is each factor when deciding which welding process to use: physical performance—yield stress, toughness, and hardness; cost—filler cost, welding time, and auxiliary material cost; environment—material wastage and emissions; and safety—risk of incident—weights: <20%, 20%–40%, 40%–60%, 60%–80%, >80%.
Question 2. Please describe your professional focus: welding engineering, welding supervisor/superintendent, professor, or environmental sector professional.
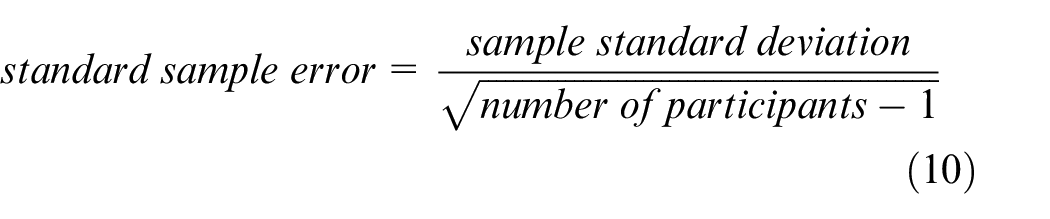
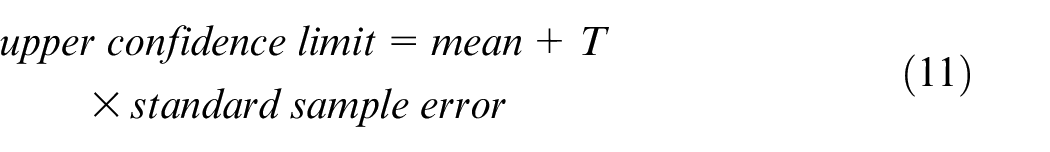
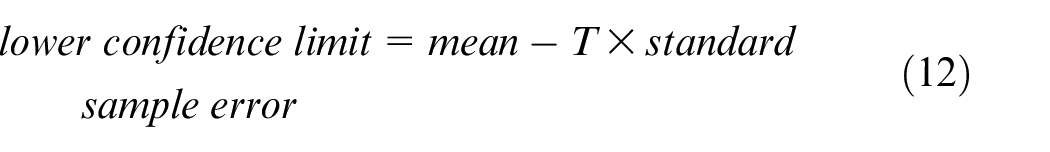
In statistically terms, this sample size may be considerably lower than the hypothesized size of the population. Therefore, to prove that the sample size taken is sufficient to draw a conclusion, a simple statistical analysis was performed. The sample mean weights, sample standard deviation, and sample standard error for each of the categories was calculated. This was then used along with the standard T distribution values to find the upper and lower confidence limits at a 95% level of confidence. As standard statistical studies typically use 90%, 95%, or 99% confidence level, 95% was chosen for this study as a compromise so as to neither take the lowest confidence level and overestimate the result, nor take the highest and underestimate the result. 30 The equations used to determine and the resulting values are stated in equations (10)–(12) 30
Typically, as the number of participants increases for the survey, the value of T decreases, which narrows the confidence level gap. Assuming the same standard deviations, the calculations were repeated for a sample size of 100, which gives the lowest value of T, and these values are shown in Table 3. As demonstrated, the values obtained for a sample size of 45 were similar to those of a sample size beyond 100. This is mainly due to the low standard deviations calculated from the surveyed sample, proving that the results from a rather smaller sample are reliable.
Confidence limit values for the sample sizes of 45 and 100.
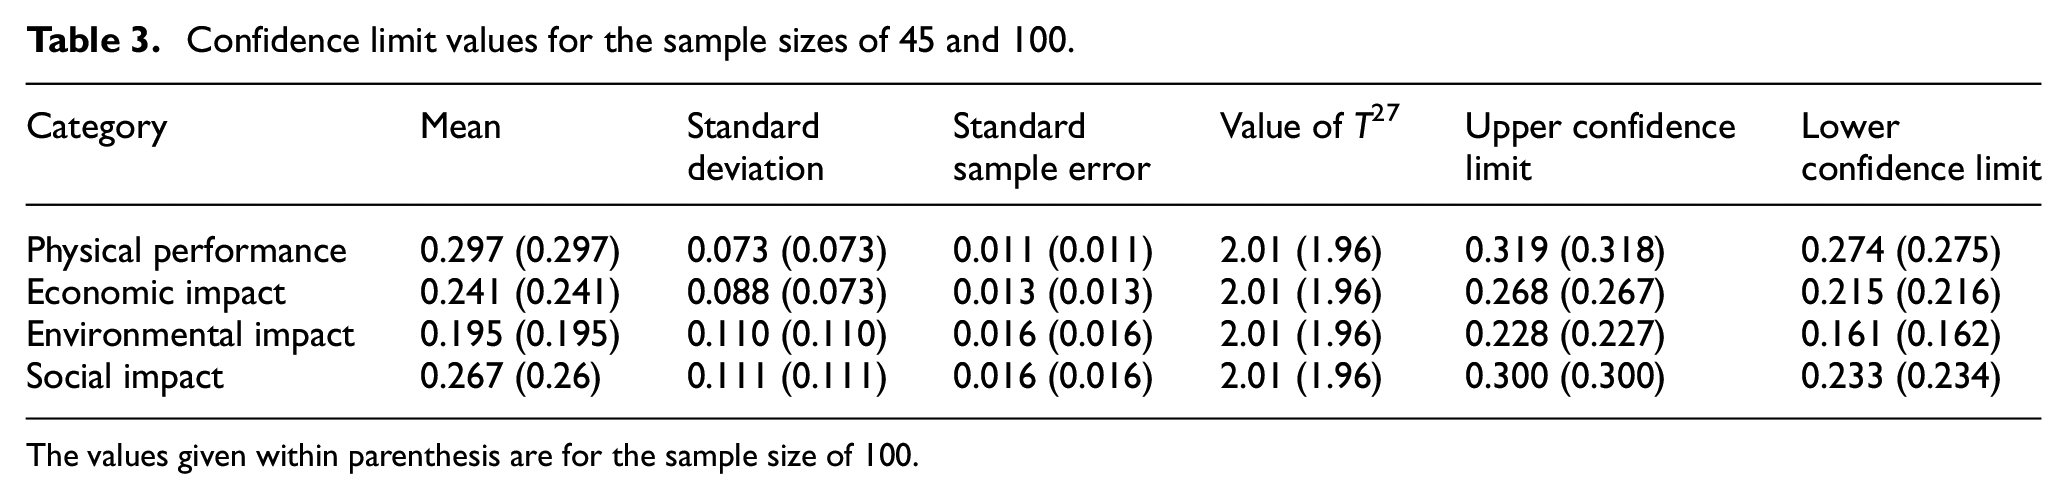
The values given within parenthesis are for the sample size of 100.
Results and discussion
All collected data and weights were used to calculate the values of each indicator and the aggregated score for each category based on the proposed methodology shown in section “Welding sustainability assessment: model development.” A summary of the findings for the three welding processes is shown in Table 4.
Case study results.
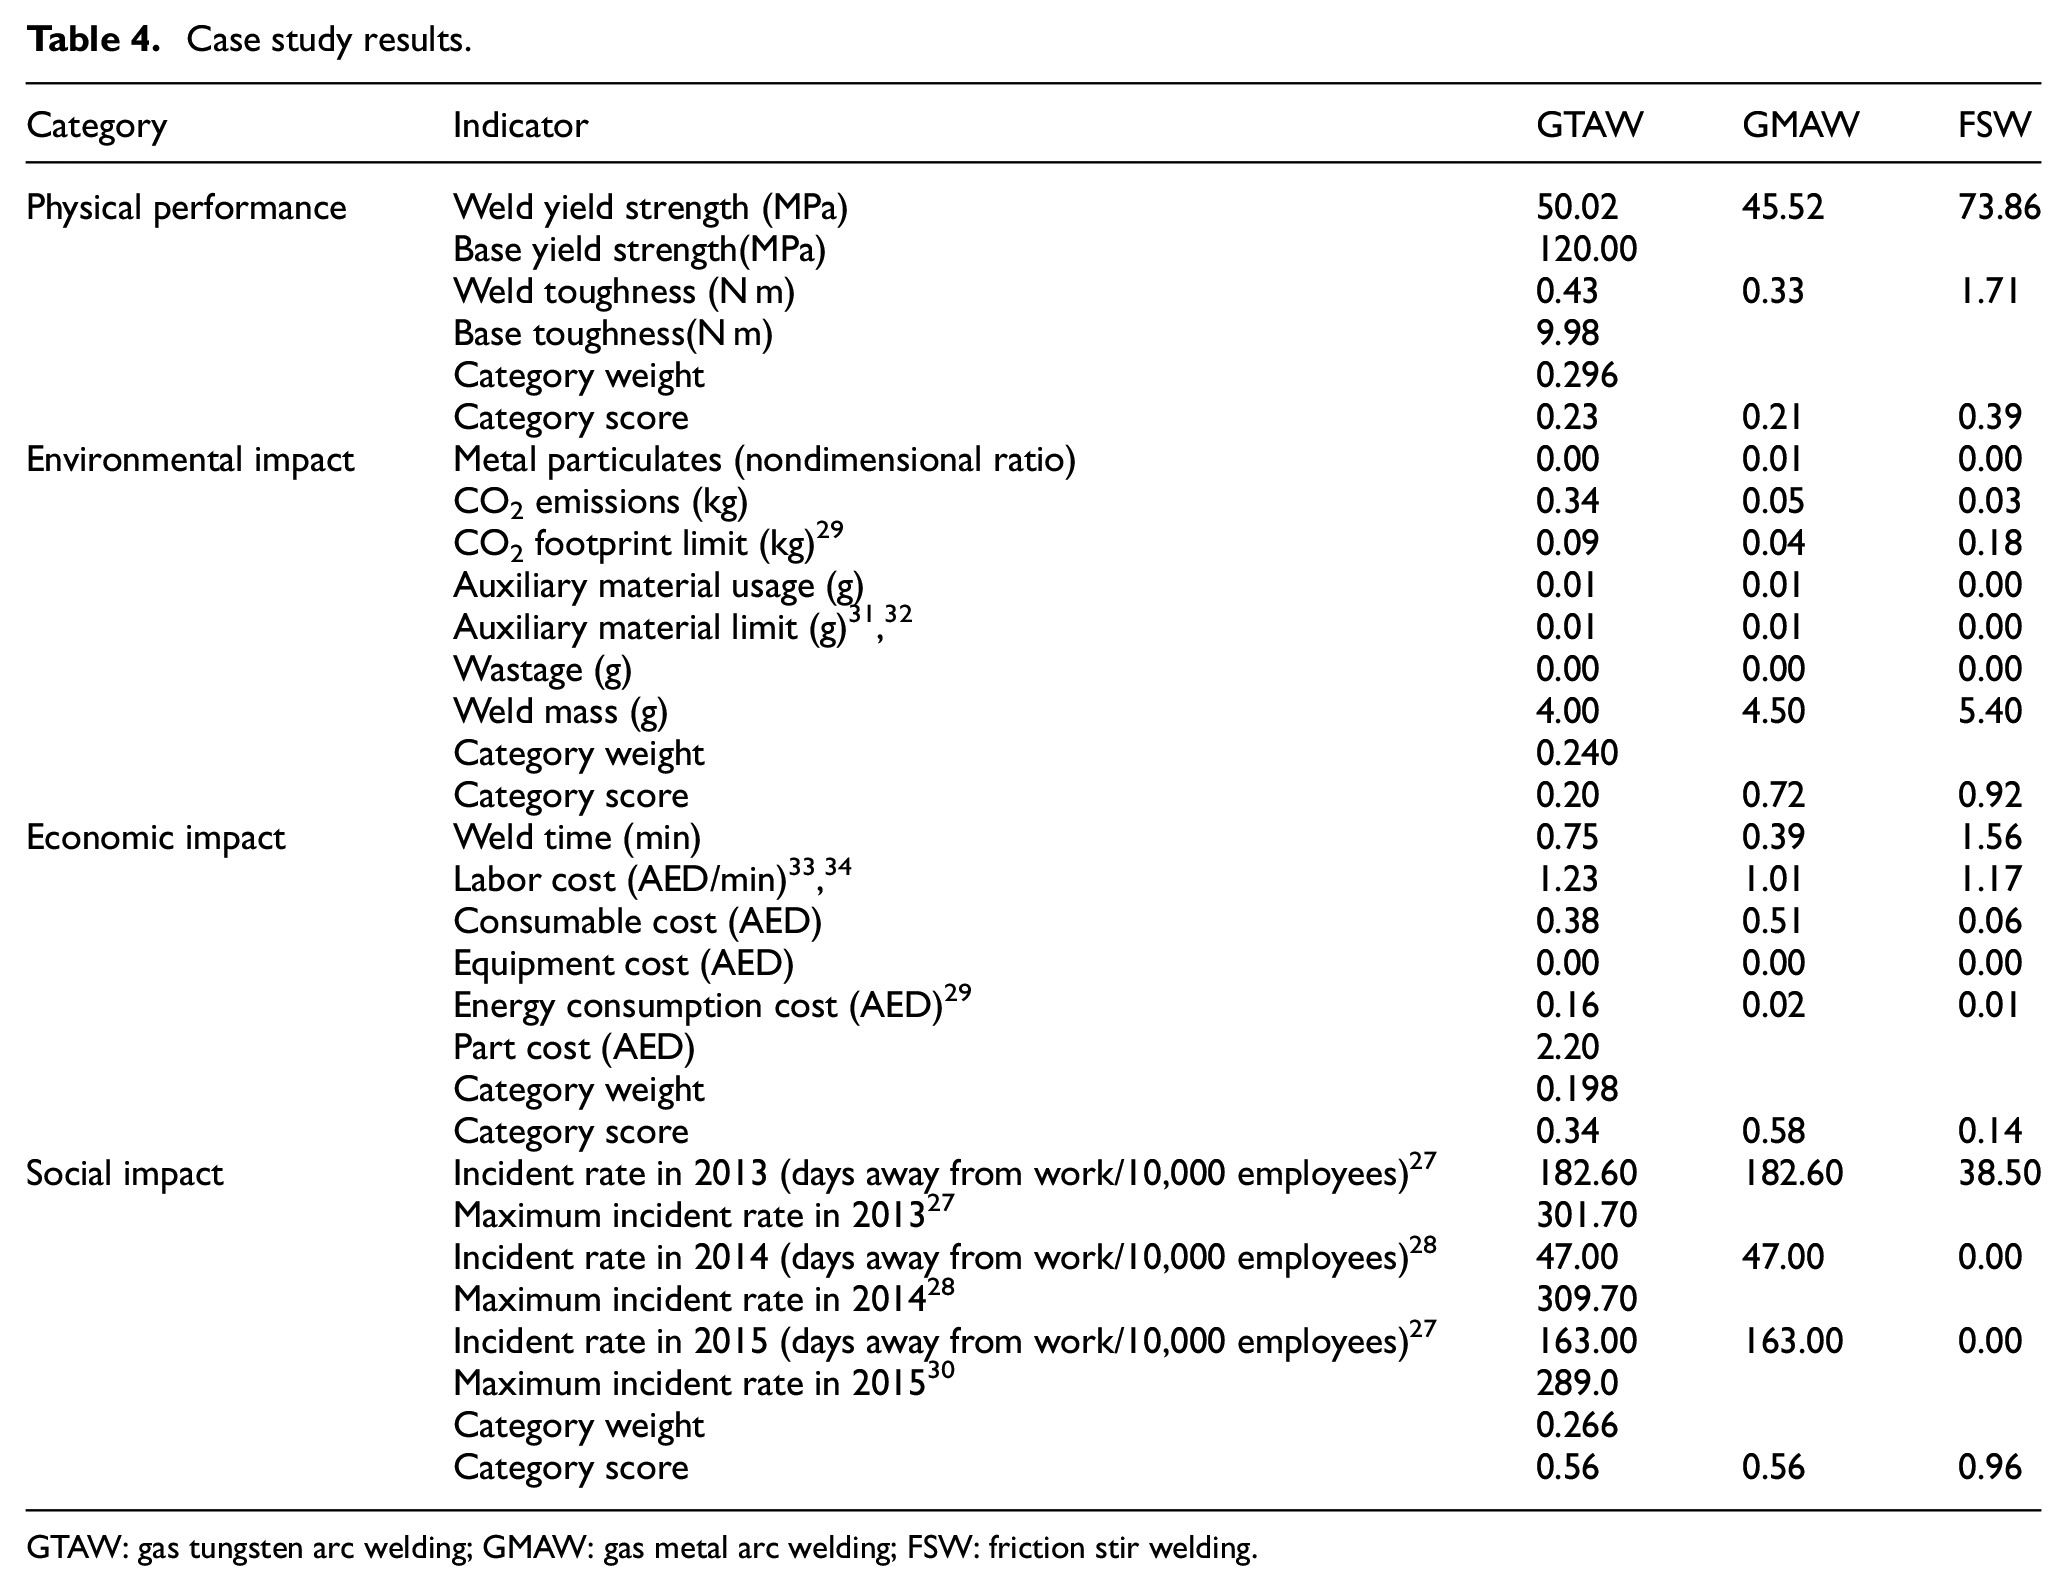
GTAW: gas tungsten arc welding; GMAW: gas metal arc welding; FSW: friction stir welding.
After the assignment of the category weights from the survey above, the elements of the assessment methodology were complete and the decision-making process can be commenced. In terms of physical performance, the indicators considered were the yield strength and the impact toughness. As discussed previously, the tensile testing machine recorded load and extension values; then these values were manipulated to calculate the stress and strain values and plotted on stress–strain curves. All processes resulted in a yield strength, which was lower than that of the base metal. Similarly, the impact toughness test measured the required energy for impact failure, after accounting for measurement errors such as friction. When comparing the performance of the welding processes with the base metal, it was observed that the welded specimens were significantly less tough. Since this study used aluminum as a base metal, which changes its physical properties significantly with a large heat input, it becomes clear why such results were obtained. The two arc welding processes produced more heat during the process, but FSW has been developed specifically to overcome this issue. Therefore, FSW scored the highest.
In the economic impact category, the indicators considered were welding time, consumable cost, equipment cost, and energy consumption cost. GMAW is the fastest process, followed by GTAW and finally FSW. It might be surprising to see an automated process be the slowest; however, that was due to the drilling required to insert the welding tool at the beginning. The high cost of the FSW tool posed a major hurdle when compared to the relatively cheap fillers used in the arc welding process. This difference in the cost comes from the opposing viewpoints when designing the filler material and the FSW tool. Where arc welding fillers are designed to be easy to transport, store, and use, FSW tools are designed with a long life and accuracy as an objective. In addition, FSW tools are not meant to be simple. The two design methodologies produce welding processes with very different operating costs. In spite of that, the equipment cost of FSW was lower when considering the long tool life of the FSW tool, followed by GTAW, and GMAW was the most expensive. Moreover, GTAW consumed the most energy, whereas GMAW had more reasonable energy consumption, and FSW had the least energy consumption. Considering all the indicators culminates into GMAW scoring the highest in this category.
The environmental impact category considered welding emissions and the material wastage. However, the measurements of the material wastage were negligible. Unlike GMAW, FSW and GTAW produced no significant metal particulates. This was expected given the lower quality of the filler used for GMAW, which could contain more impurities. In terms of carbon footprint, as this was directly associated with the energy consumption, FSW and GMAW had relatively low footprints when compared to GTAW. The energy consumption of GTAW exceeded the allowable limit and had offset the entire category score negatively. Finally, FSW did not use any auxiliary material unlike the other arc welding processes. After considering all the indicator scores, it can be deduced that FSW was the best performer in this category. This is due to using a computer numerical control (CNC) machine, which has been designed and developed to be energy efficient, use no auxiliary material, and produce no metal particulates.
Analyzing the social impact category was direct. Simply speaking, the incident rate of arc welding processes has been found to be very high compared to FSW. This caused the category score for the arc welding process to be reasonably lower than that for FSW. It appears that the industry can still use some research in improving safety for arc welding processes. Figure 6 shows the process scores in the proposed stamp form for easier visualization of the result. Ultimately, after analyzing the aggregate and category scores, it can be concluded that, for this particular welding application, FSW is the most sustainable process with the highest physical performance, social impact, and environmental impact scores.
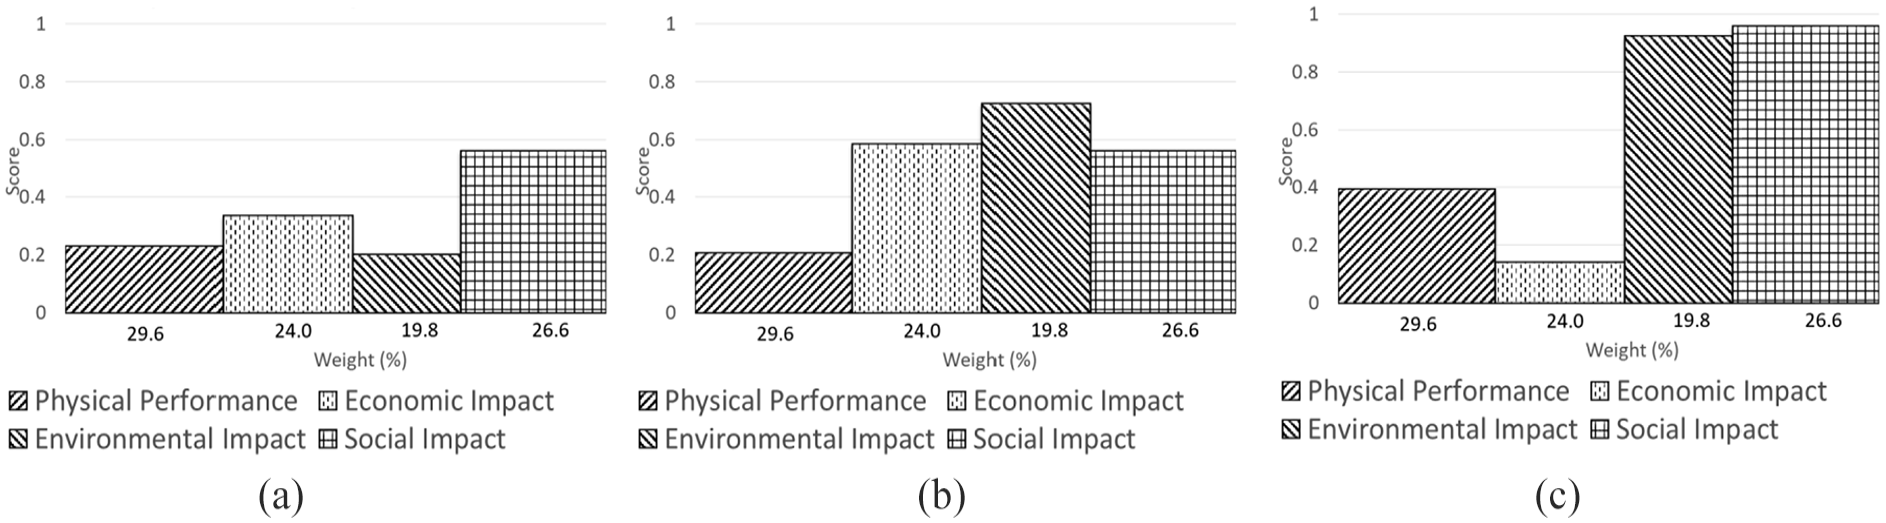
Overall sustainability scores for (a) GTAW, (b) GMAW, and (c) FSW.
In conclusion, Figure 6(a) shows the GTAW score of 0.34, which is the lowest among the candidates. As mentioned, the process was lacking in one particular category, namely, environmental impact. This score rendered this aggregate sustainability score to be the lowest performer among the other competitors. Building on that fact and given this case study, a conclusion can be drawn that GTAW is not the best candidate for aluminum welding among the other existing technologies. Another usage for GTAW is to weld exotic metals, such as Inconel, Monel, and titanium, as the high temperature needed for the fusion of these materials can probably be achieved easier with GTAW. A different study on these materials could result in GTAW’s favor.
The other arc welding process, GMAW, scored higher than GTAW with 0.49. In spite of that, the score could also be deemed as low. The incident rates have really affected the aggregate sustainability score of the arc welding process. It should be noted that economically GMAW is the highest performer between the three processes. Scoring the highest in the economic impact category, this is a distinct advantage and a great selling point between all the other processes. This ascertains why this process is being heavily deployed in various industries and applications.
Ultimately, FSW scored the highest with an aggregate score of 0.59. The advantage of this process comes mainly from the contributions of the social and the environmental impacts. The scores from these categories were much higher for FSW than the other processes. In the case of the environmental impact, FSW does not consume a lot of energy and therefore the carbon footprint is low. Moreover, the process does not utilize any auxiliary material or produce particulates. In the social impact category, the fact that operating a machine is safer than welding by hand drops the incident rate to a very low value. Even though the process does not seem very economical, with the lowest economic impact score, the advantages certainly outweigh the disadvantages.
Summary and conclusion
Sustainability is a concept, which aims to have products, processes, and companies operate within environmental limits, maximize profits, and maintain society’s satisfaction. Sustainability has been receiving a lot of attention and support lately as it provides a more holistic approach to development and assessment. This article has provided a general sustainability assessment methodology, which was then adapted to provide a tool to assess the sustainability performance of welding processes. This was done through selecting categories and indicators specific to the application of welding. Each of the categories was quantified using an equation developed from the indicators. To combine the category scores into a single sustainability score, a weighted average method was applied, where a survey was carried out to determine the weights of each category. This methodology was tested on a case study for three welding processes, namely, GTAW, GMAW, and FSW, for the application of welding aluminum alloy 5083. Ultimately, it can be concluded from the case study that FSW is the most sustainable process for this application because it provided the highest physical performance, social impact, and environmental impact scores.
Footnotes
Declaration of Conflicting Interests
The author(s) declared no potential conflicts of interest with respect to the research, authorship, and/or publication of this article.
Funding
The author(s) received no financial support for the research, authorship, and/or publication of this article.