
Abstract
The life-cycle assessment methodology was used to evaluate the environmental impact of friction stir welding of AA5754-H114 aluminium alloy sheets. Other works in literature considered the environmental impact of friction stir welding, but in this study the influence of different process parameters on midpoint category impacts were analysed. Friction stir welding was performed under different values of rotational and welding speeds. Moreover, pin tool wear and mechanical properties of joints were also evaluated. The pre- and post-processing stages were also considered. Raw materials, energy and all inputs associated with each stage of product life cycle were collected and evaluated to analyse the environmental impact index. The results showed that, irrespective of the rotational speed, the lowest welding speed investigated leads to the highest energy consumption and, consequently, to the highest values of the midpoint category impact. On the contrary, at the highest welding speed, the environmental impact assumes the lowest values. By concerning the rotational speed, its effect on the midpoint category impact is strongly reduced compared with the one given by the welding speed. A performance index, obtained by considering both the midpoint category impact and ultimate tensile strength of the joints, was also defined. Finally, the environmental sustainability of friction stir welding was compared with two different fusion welding technologies, namely gas tungsten arc welding and laser beam welding. The results showed that friction stir welding was characterized by midpoint category impacts much lower than those of the gas tungsten arc welding, while such discrepancies decreased with the laser beam welding.
Keywords
Introduction
In the modern manufacturing, welding plays the essential role in many applications, such as in construction, automobile, turbine production, and so on. 1 However, welding processes require large amounts of energy and resources and also discharge fumes causing adverse effects on human health2,3 and environment due to dust, process wastes and greenhouse gases emitted. 4
Welding technology developments and comparisons have been mainly focused on economic indicators; environmental and social aspects have been scarcely taken into account in the evaluation and choice of a process for a given welding task. 5
As far as the welding of metals is concerned, friction stir welding (FSW) is receiving more and more interest owing to the energy efficiency, environmental friendliness and versatility that make this process a promisingly ecologic and ‘green’ technology.6–10 It is thought that FSW consumes less energy as compared with fusion welding technologies due to the lower temperatures involved and the solid-state nature of the process.11–15 Heurtier et al. found that the heat inputs for gas metal arc welding (GMAW) and gas tungsten arc welding (GTAW) are 2 and 1.5 times higher than that for FSW, respectively. 16 Furthermore, FSW leads to a decrease in material waste and avoids radiation and dangerous fumes. Finally, it does not require shielding gases or flux and does not use filler material.
Despite the interest in environmental issues related to FSW, few data are available on its environmental impact. Shrivastava et al. 17 compared the energy consumption and environmental impact of FSW and GMAW processes performed on AA6061-T6 alloy; it was shown that the former consumes about 40% less energy and results in 31% less greenhouse emissions than the latter. More recently, Buffa et al. developed an analysis of FSW following the CO2PE! methodological approach. 7 They found that the reduction of the weld phase duration, obtained by increasing feed rate, led to a decrease in the energy impact of FSW. Azeez and Akinlabi 18 analysed the sustainability of FSW and evaluated weld joints’ reliability from health, safety, environment and economic point of view. The welding energy, materials deformation, emissions and life-cycle assessment (LCA) were analysed in line with the mechanical properties, and a bivariate Weibull approximation model was used to predict weld joints’ reliability.
The literature review shows that other authors considered the environmental impact of FSW, but in this study the authors aim at analysing the influence of different process parameters on the most important environmental impact categories. Moreover, in comparison with previous studies, not only the environmental performance but also the mechanical aspects of FSW were considered in order to find the best compromise between them. In the present research, the LCA methodology was used to evaluate the environmental impact of FSW of AA5754-H114 aluminium alloy sheets. FSW was carried out under different values of rotational and welding speeds to analyse the process parameters’ effect on midpoint category impacts. Pin tool wear and mechanical properties of welded blanks were also evaluated. The pre- and post-processing stages were also considered. Raw materials, energy and all inputs associated with each stage of product life cycle were collected and evaluated to analyse the environmental impact index.
LCA takes a holistic approach and provides a comprehensive view of the environmental impact over the entire life cycle of a process, thus presenting more accurate perspectives of the true environmental trade-offs. 19 In order to predict the environmental impact of discrete part manufacturing processes, many authors used the LCA method. 20 In addition, the LCA methods can be also used to define environmental improvement measures of the machine tool as well as process condition levels.
Different authors in literature have analysed the environmental impact of welding processes using the LCA method. Essentially, these previous studies focused on environmental evaluation of arc welding processes,3,21,22 laser beam welding (LBW) processes19,21,22 or some typologies of the previous one.5,23
In order to highlight mechanical and environmental characteristics of FSW, a comparison with other welding processes must be carried out. In this work, the environmental sustainability of FSW was compared with the one of two different fusion welding technologies, namely GTAW and LBW.
The organization of this article is as follows. Following this introduction, the ‘FSW process’ section provides the methodology used for experiments and environmental impact assessment. The ‘Life cycle assessment of FSW’ section reports the results of the analyses. In particular, this section is devoted to showing results related to the tool geometry evolution, mechanical properties, energy consumption and Mechanical/Environmental performance indexes. The ‘Comparison among environmental impact of friction stir, laser beam and gas tungsten arc welding processes’ section presents a comparison among FSW, GTAW and LBW processes. Some concluding remarks appear in the ‘Conclusions’ section.
FSW process
Pre-processing operations
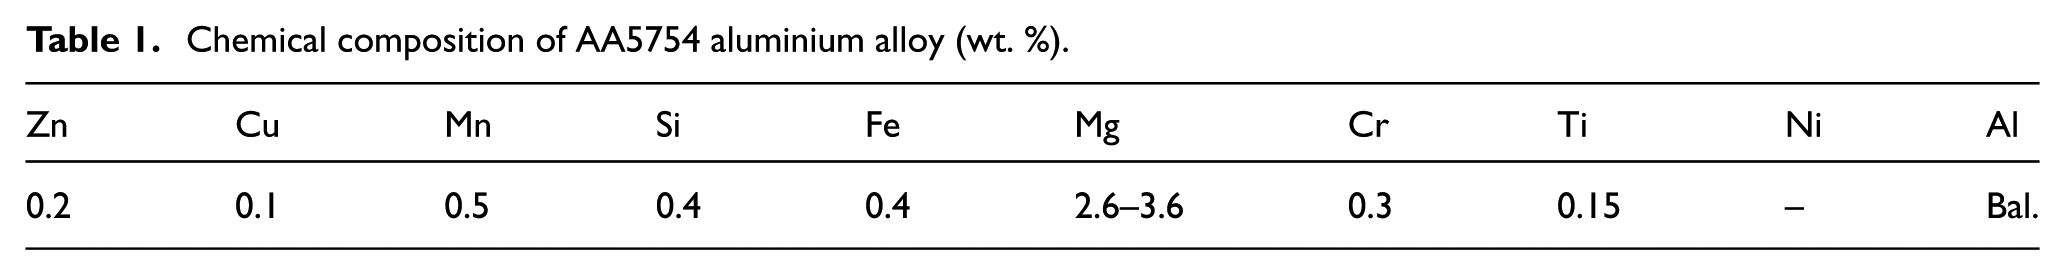
The material investigated is AA5754 aluminium alloy widely used in aeronautic and automotive industries for structural components. Typical applications concern pressure vessels, tanks, fitting, boat hulls and van bodies. The alloy was in the H114 temper state, consisting of a lightly cold-worked condition, which is one of the typical state in which AA5754 is used. The chemical composition of the alloy (wt. %) is shown in the Table 1.
Chemical composition of AA5754 aluminium alloy (wt. %).
Sheet blanks in AA5754-H114 aluminium alloy, with a length, width and thickness of 185, 80 and 2 mm, respectively, were obtained by a semi-automatic shearing machine. They did not require any edge preparation before FSW. Regarding the pin tool, it is well known that its geometry is one of the key aspects of FSW process development.10,15,24,25 Tool shape and size play a critical role in heat generation, material flow and forging pattern of the welded blanks. In particular, shoulder is the main responsible for material flow around the tool and forging pattern of the welded blanks, while pin governs deformation and represents the secondary source for heat generation in the nugget zone. 26 For these reasons, shape and size of both shoulder and pin have to be accurately chosen for the success of the FSW process. 27 Different types of pin profiles can be used, such as straight cylindrical, tapered cylindrical, trapezoidal, square, hexagonal, triangular and threaded.25,28–30 As reported in literature, FSWed joints obtained with tapered cylindrical pin exhibited the highest tensile strength and toughness as compared with the welds made using other pin profiles, mainly due to the grain refinement in the stirred zone. 30 According to such results, the tapered cylindrical pin shape was used in the present work (Figure 1). The process plan for fabricating the pin tool consists of (i) sawing of raw material, (ii) turning, (iii) milling, (iv) heat treatment, (v) turning and (vi) grinding. During such processes, power was measured using an industrial power analyzer.
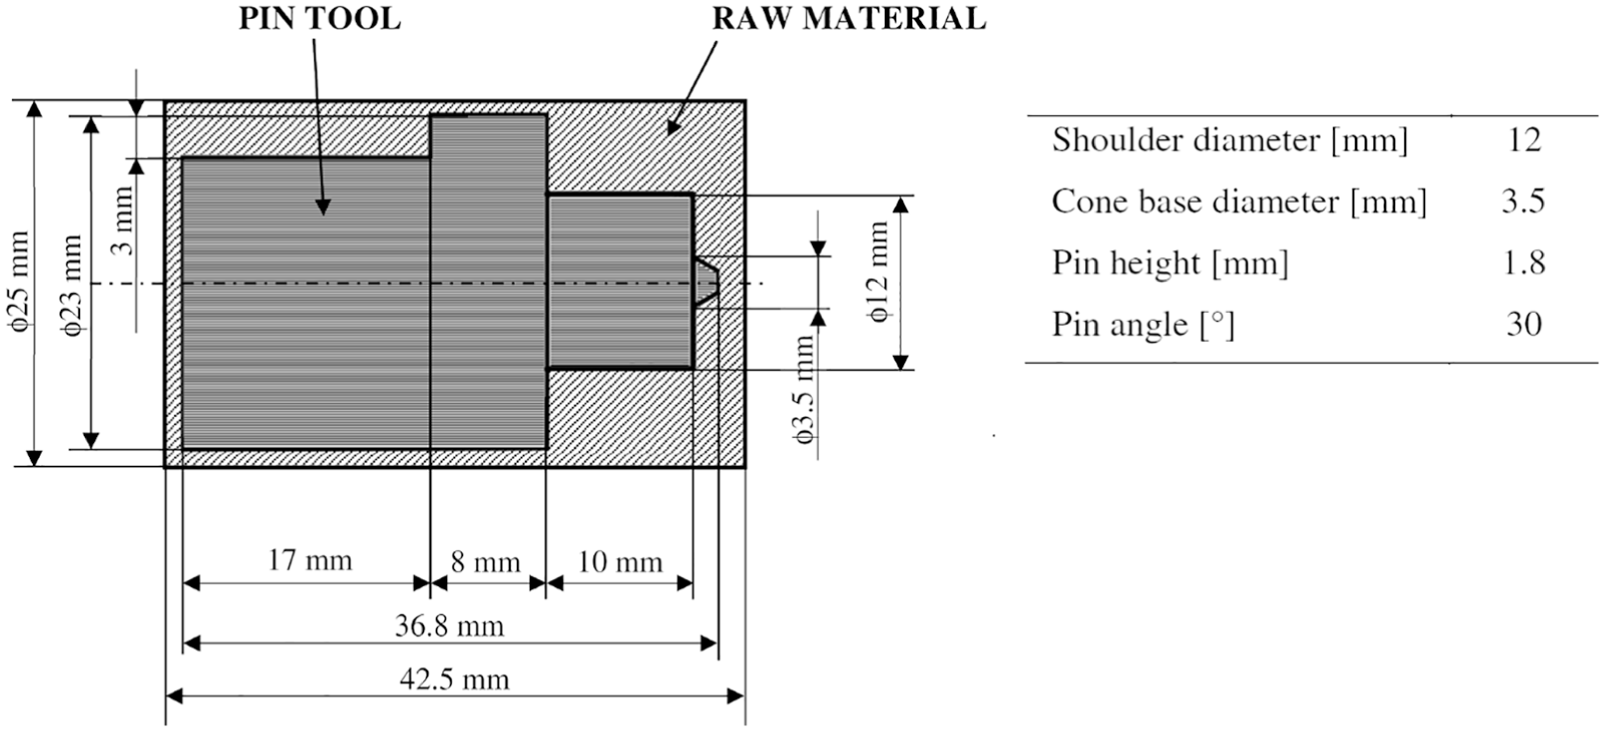
Geometric features of the H13 steel pin tool used in the FSW operations.
FSW experiments
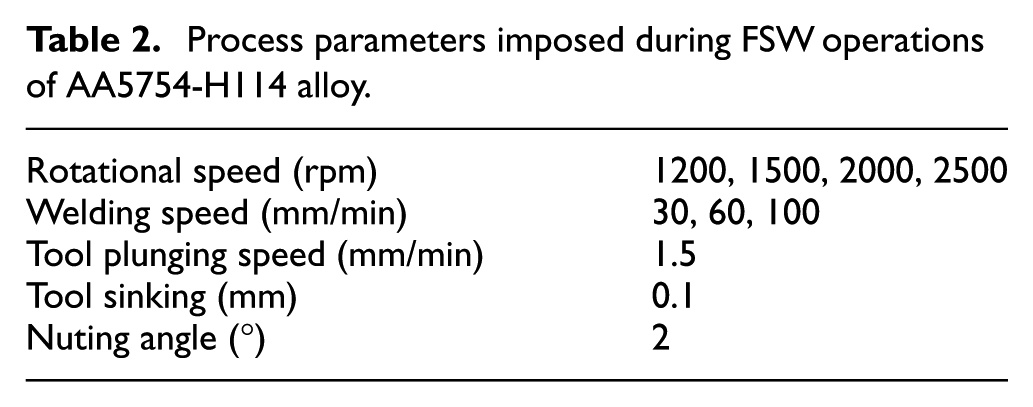
On the basis of the results obtained by previous studies of the authors on FSW process of AA5754-H114 blanks,13,29,31 butt joints were obtained by FSW experiments on the machining centre COMEC M50. Since FSW is a solid state process able to join sheet blanks by means of a severe plastic deformation, a wide processing window was investigated owing to the large plastic formability exhibited by such alloy in extended ranges of temperature and strain rate. The process parameters investigated are reported in Table 2, whose ranges were defined by means of preliminary tests. During each test, the rotational speed (ω) of the pin tool and the welding speed (v) of the workpiece material were kept constant.
Process parameters imposed during FSW operations of AA5754-H114 alloy.
For each process condition investigated, an initially wear free pin tool was used to obtain a total weld length (WL) of 33 m.
Tool geometry evolution during FSW
In researches dealing with FSW, the pin tool is nominally considered non-consumable even though it would exhibit wear, as reported by Gibson et al. 24 Owing to wear, particles of worn tool material can be left in the weld seam causing a detrimental effect on the FSWed joint properties, as shown by Sahlot et al. 32 Furthermore, wear results in tool geometric changes that can cause welding defects. In fact, FSW is performed with a slight clearance between the bottom side of pin tool and backing plate necessary to avoid their contact. As the pin height decreases owing to wear, the clearance increases and can lead to the formation of a small geometric discontinuity located at the root of the weld.33–35 Such a defect can act as a notch and cause a local increase in the stress field intensity. It can be reduced by increasing the tool sinking even though it can lead to a higher thickness gradient between top surface of the sheets and the weld seam with a worsening of the aesthetic appearance and a decrease in the load-carrying capacity of the joint. For such reasons, the pin height reduction (Δh), calculated through the pin profiles acquired at different weld length values by a profilometer, can be used as an indicator of tool wear. In particular, for a given weld length, the Δh value was obtained by comparing the original pin profile and the worn one using an image analysis system. Each measurement was repeated three times and the average value was calculated to ensure accuracy and repeatability.
Figure 2 shows, for a given welding condition, the evolution of the pin height reduction with weld length; it can be also observed that the adhesion of the workpiece material in the worn tool also takes place as the weld length increases during FSW. Furthermore, the Δh versus WL curves, obtained as a function of rotational and welding speeds, are shown in Figure 3. According to the results observed by Prado et al. 28 on FSW of AA6061 alloy and by and Prater et al. 35 on the FSW of metal matrix composites, tool wear increases with weld length; the growth rate rises with decreasing welding speed and increasing rotational speed.
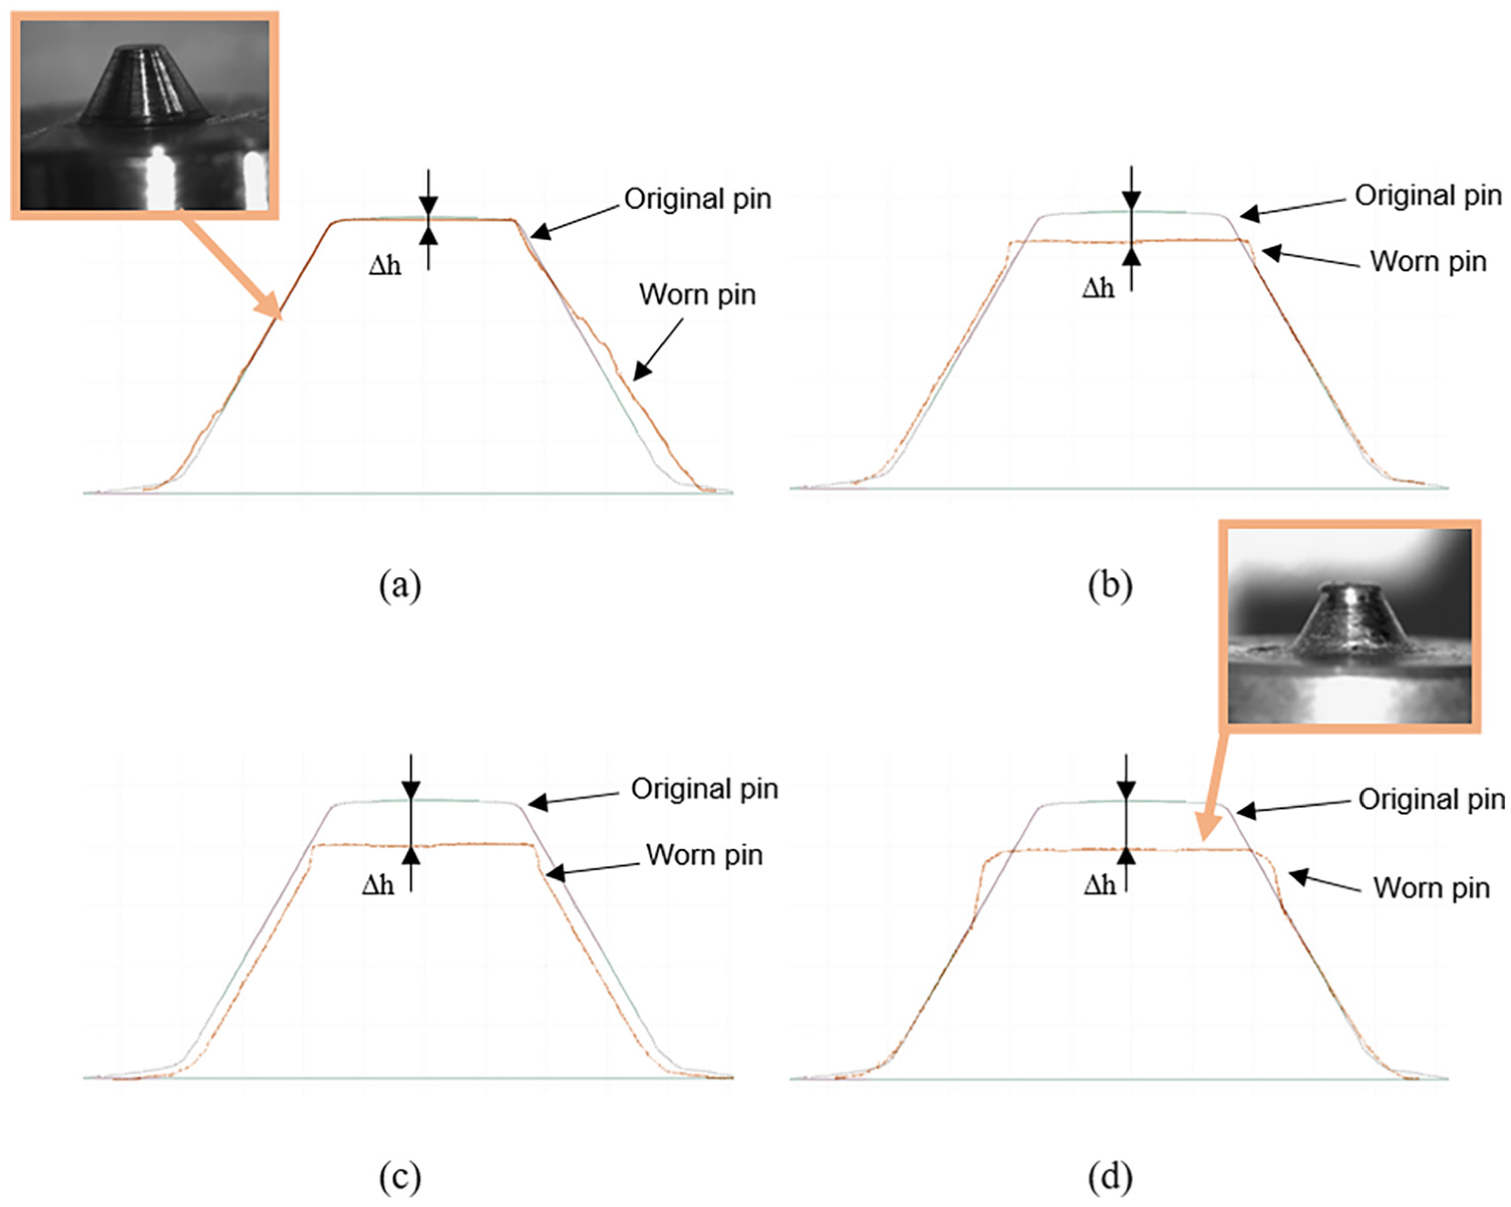
Superimposed images of original and worn pin profiles at different weld length values: (a) 1 m, (b) 13 m, (c) 20 m and(d) 33 m (ω = 2500 rpm; v = 30 mm/min).
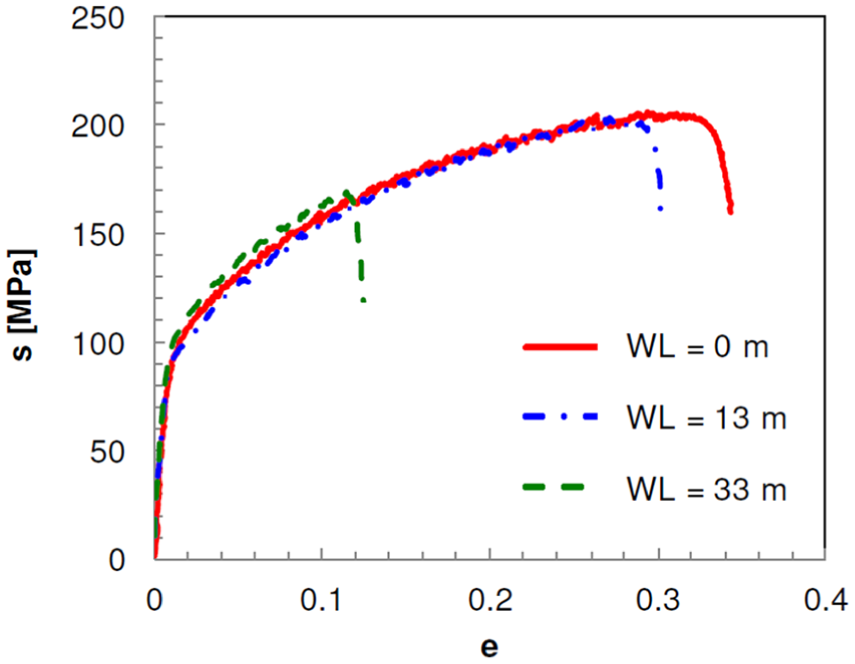
Typical nominal stress–nominal strain curves of FSWed samples in AA5754-H114 alloy obtained at different weld length values (ω = 1200 rpm; v = 100 mm/min).
Since the joint strength significantly decreases as Δh exceeds 0.1 mm, as shown in Figure 3 in which the effect of weld length values on typical nominal stress (s) versus nominal strain (e) curves of FSWed samples is shown, the wear criterion adopted, defining the tool life, was based on the maximum Δh value allowed (Δhmax) equal to 0.1 mm. Figure 4 shows that the tool life, in terms of pin height reduction, strongly depends on welding and rotational speeds; as expected, irrespective of process parameters, the pin height reduction increases, that is the tool life decreases, with the increase in weld length, due to the continuous tool wear that growths with rising the tool–workpiece interaction. As a matter of fact, at the low v values investigated, for a given weld length, the Δh rises with rotational speed, due to the significant temperature increase occurring during welding, resulting in higher frictional heating at the workpiece–tool interface that accelerate the wear mechanisms. 36 An opposite behaviour can be observed when the FSW process is performed at the highest welding speed investigated, due to the less duration of time available for the heat to dissipate into the workpiece and tool. Such results are in agreement with those evaluated by Fernandez and Murr 37 and by Sahlot et al. 32 by analysing the tool wear occurring during the FSW of cast aluminium 359+20% SiC metal matrix composite and of CuCrZr alloy, respectively.
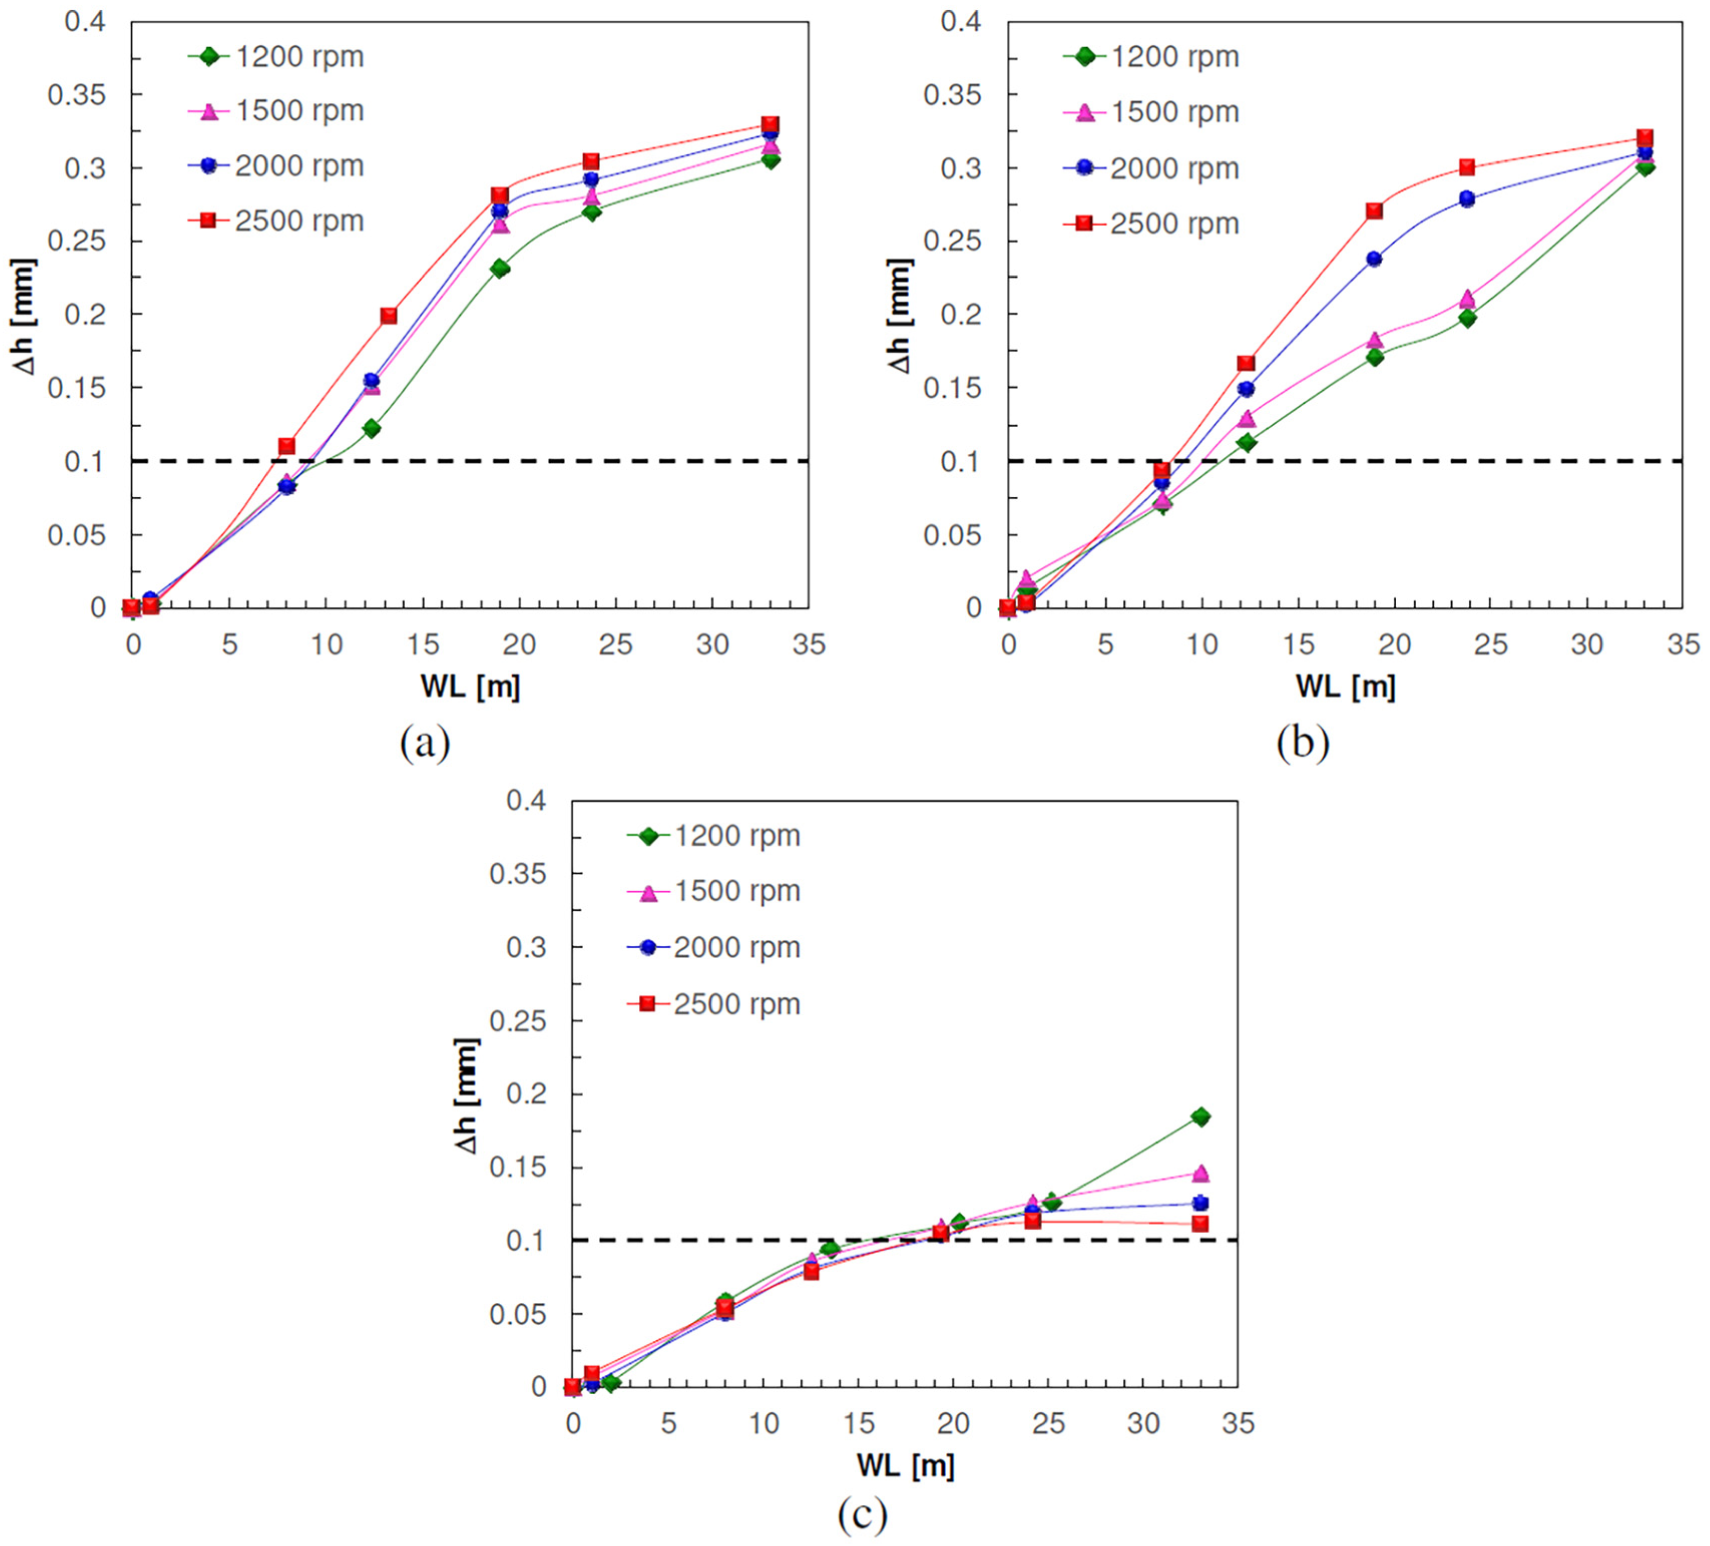
Influence of the process parameters on the reduction of pin height with weld length and on the tool life during the FSW: (a) v = 30 mm/min, (b) v = 60 mm/min, and (c) v = 100 mm/min.
Energy consumption during FSW
In order to quantify the energy consumption during FSW, the electric power absorbed was measured using an industrial power analyzer. A typical curve representing power versus time is shown in Figure 5(a). Irrespective of the welding parameters, a value of about 960 W is measured after the machine is switched on (A). In the positioning stage, during which the machine table and spindle translate, power increases from A to B due to the power absorbed by X-, Y- and Z-axes motors and remains almost constant until reaching the position at which the FSW process begins (C). Then, the plunging stage takes place: the pin rotates and simultaneously moves downwards along the Z-axis with the value of rotational and plunging speeds reported in Table 2. The power consumption increases with time from C to E with two different growth rates. The lower rate from C to D can be attributed to the pin penetration into sheet blanks; the higher growth rate from D to E is due to the increase in the contact area as the tool shoulder penetrates into the top surface of blanks until reaching the tool sinking. As the welding stage begins, the pin tool traverses along the welding line, with the v values defined in Table 2, and power sharply increases from E to F. Then, the power versus time curve reaches a steady state regime that is kept during the entire stage. Finally, the pin tool is pulled out from the welded sheets and power rapidly decreases from G to H after the pin is disengaged from the blanks.
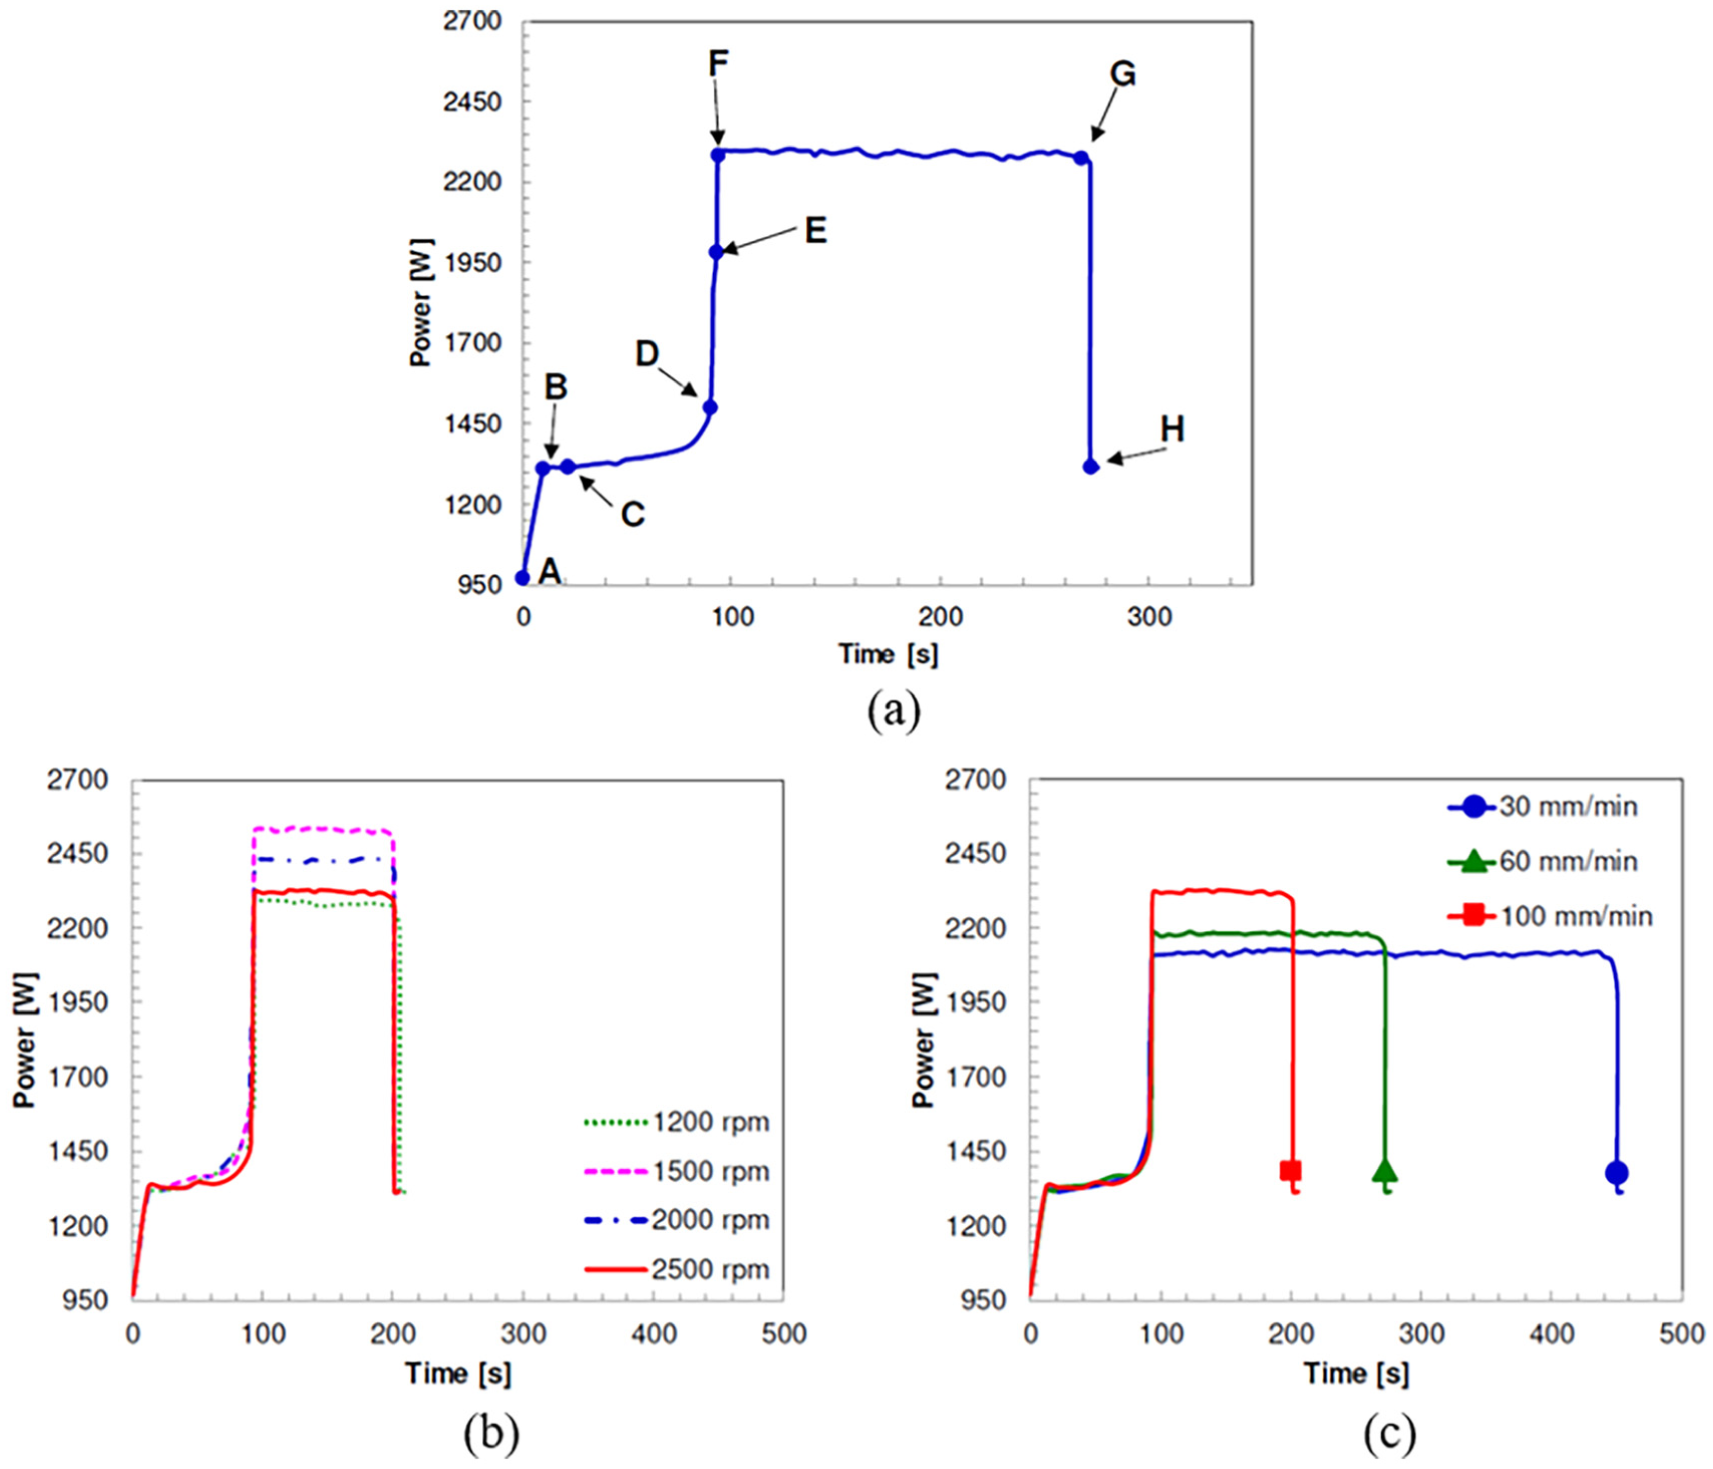
(a) Typical power absorption during FSW versus time curve (ω = 2000 rpm; v = 60 mm/min), and effect of (b) rotational speed (v = 100 mm/min) and (c) welding speed (ω = 2500 rpm) on power–time curves.
Figure 5(b) and (c) shows the influence of process parameters on the power versus time curves. Power absorption during plunging and welding stages increases with ω value due to a faster rotation of the spindle motor. Furthermore, power consumed in the welding stage increases with the v value owing to the faster traverse motion of the machine table while it increases with ω up to a maximum of 1500 rpm and then decreases as ω further increases.
Power versus time curves were used to calculate the energy consumption. To this purpose, Figure 6 shows the energy values as a function of ω and v values. The energy absorbed strongly decreases with increasing the v value notwithstanding the higher power required. Such behaviour is attributed to the effect on energy of the reduction in the welding time with increasing v value which overcomes the one of the increase in power with welding speed. By concerning the influence of the rotational speed, the growth in the ω value from 1200 to 1500 rpm involves a rise in the energy necessary for a faster spindle rotation; then, as ω further increases up to 2500 rpm, energy consumption tends to slightly decrease owing to the prevailing effect of material softening that leads to a reduction in strength as ω increases.38,39
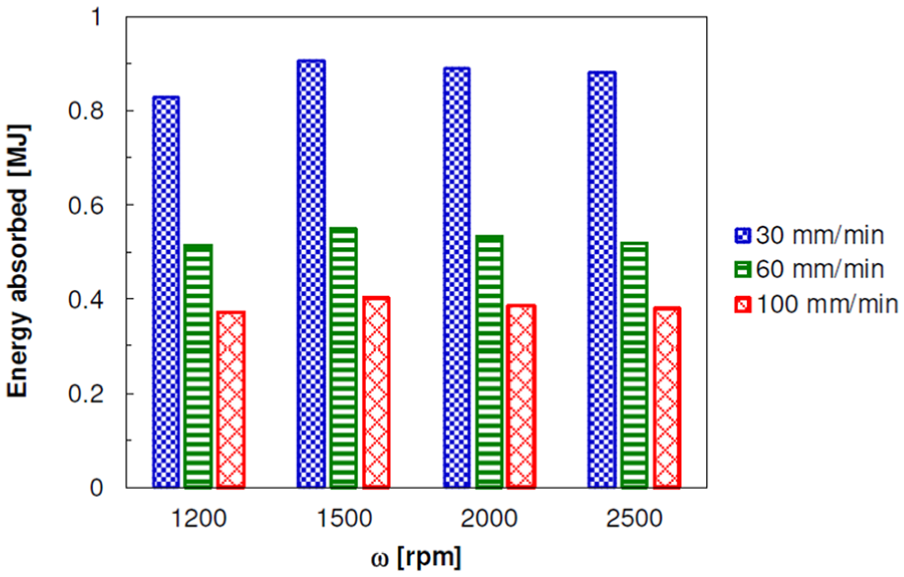
Electrical energy absorbed during FSW as a function of rotational and welding speeds.
Mechanical properties of FSWed joints
Li et al. 40 suggested artificial intelligence methods such as genetic programming and automated neural network search for evaluating the mechanical properties. In this work, the evaluation of the mechanical properties of joints at room temperature was carried out by means of tensile tests. Samples were machined from welds characterized by the tensile axis perpendicular to the welding line. The results were plotted in terms of nominal stress and nominal strain (Figure 7). For each testing condition, at least three repetitions were performed in order to take into account the experimental scatter.
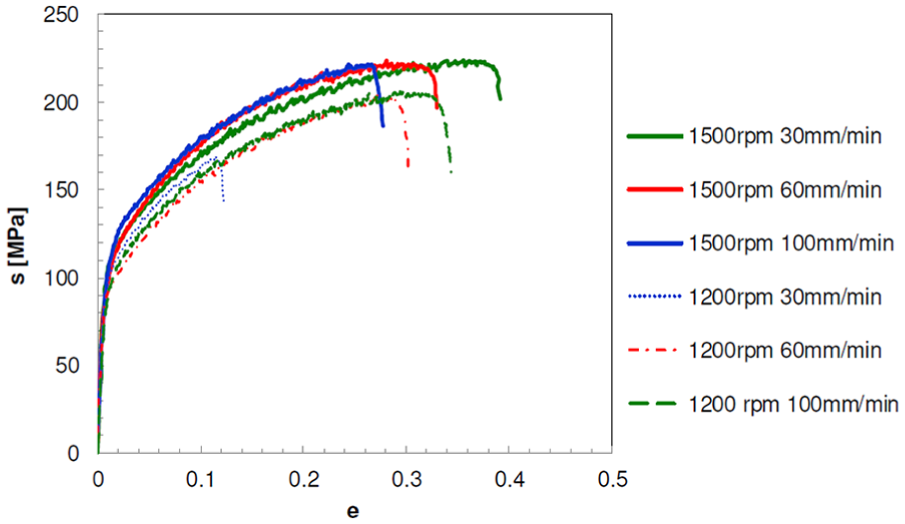
Effect of rotational speed and welding speed on typical nominal stress versus nominal strain curves.
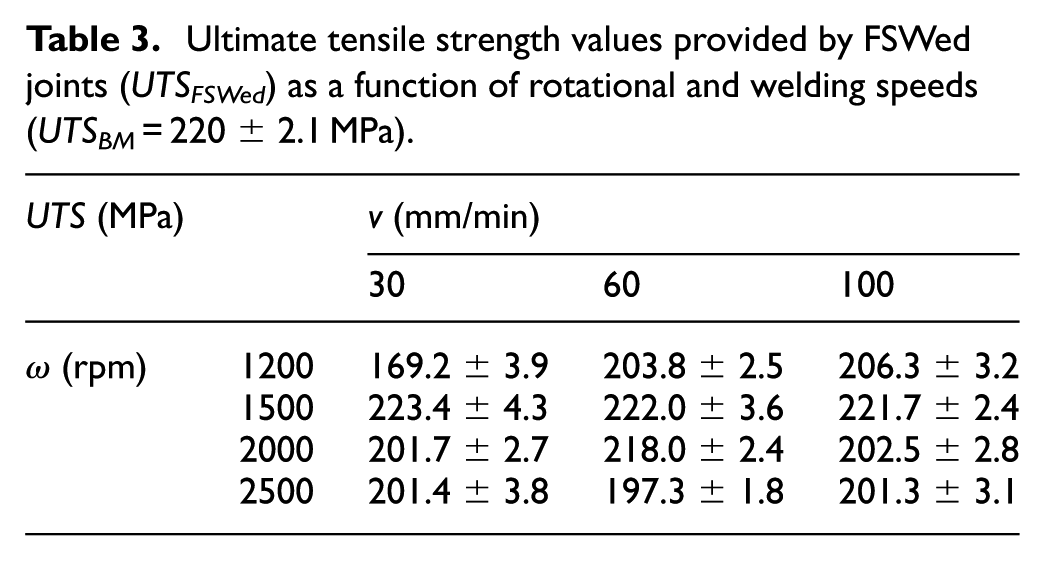
Table 3 summarizes the ultimate tensile strength (UTS) values achieved on samples obtained by FSW performed at different rotational and welding speeds. It can be observed that irrespective of the v value, the welds obtained with ω equal to 1500 rpm are characterized by the highest UTS values, which are very similar to the ultimate tensile strength of the base material (BM).
Ultimate tensile strength values provided by FSWed joints (UTSFSWed) as a function of rotational and welding speeds (UTSBM = 220 ± 2.1 MPa).
Post-processing operations on FSWed blanks
Since FSW leaves a defect in form of a discontinuity in the starting position of the tool and a hole in the exit position owing to the pin tool pulling out, the two ends of the welded sheets were cut off by a semi-automatic shearing machine in order to obtain the desired length equal to 170 mm (Figure 8(a)). Then, face milling was carried out under dry cutting conditions to remove burrs developed during FSW due to the pin tool sinking. An industrial power analyzer was used to measure power absorbed during the post-processing operations.
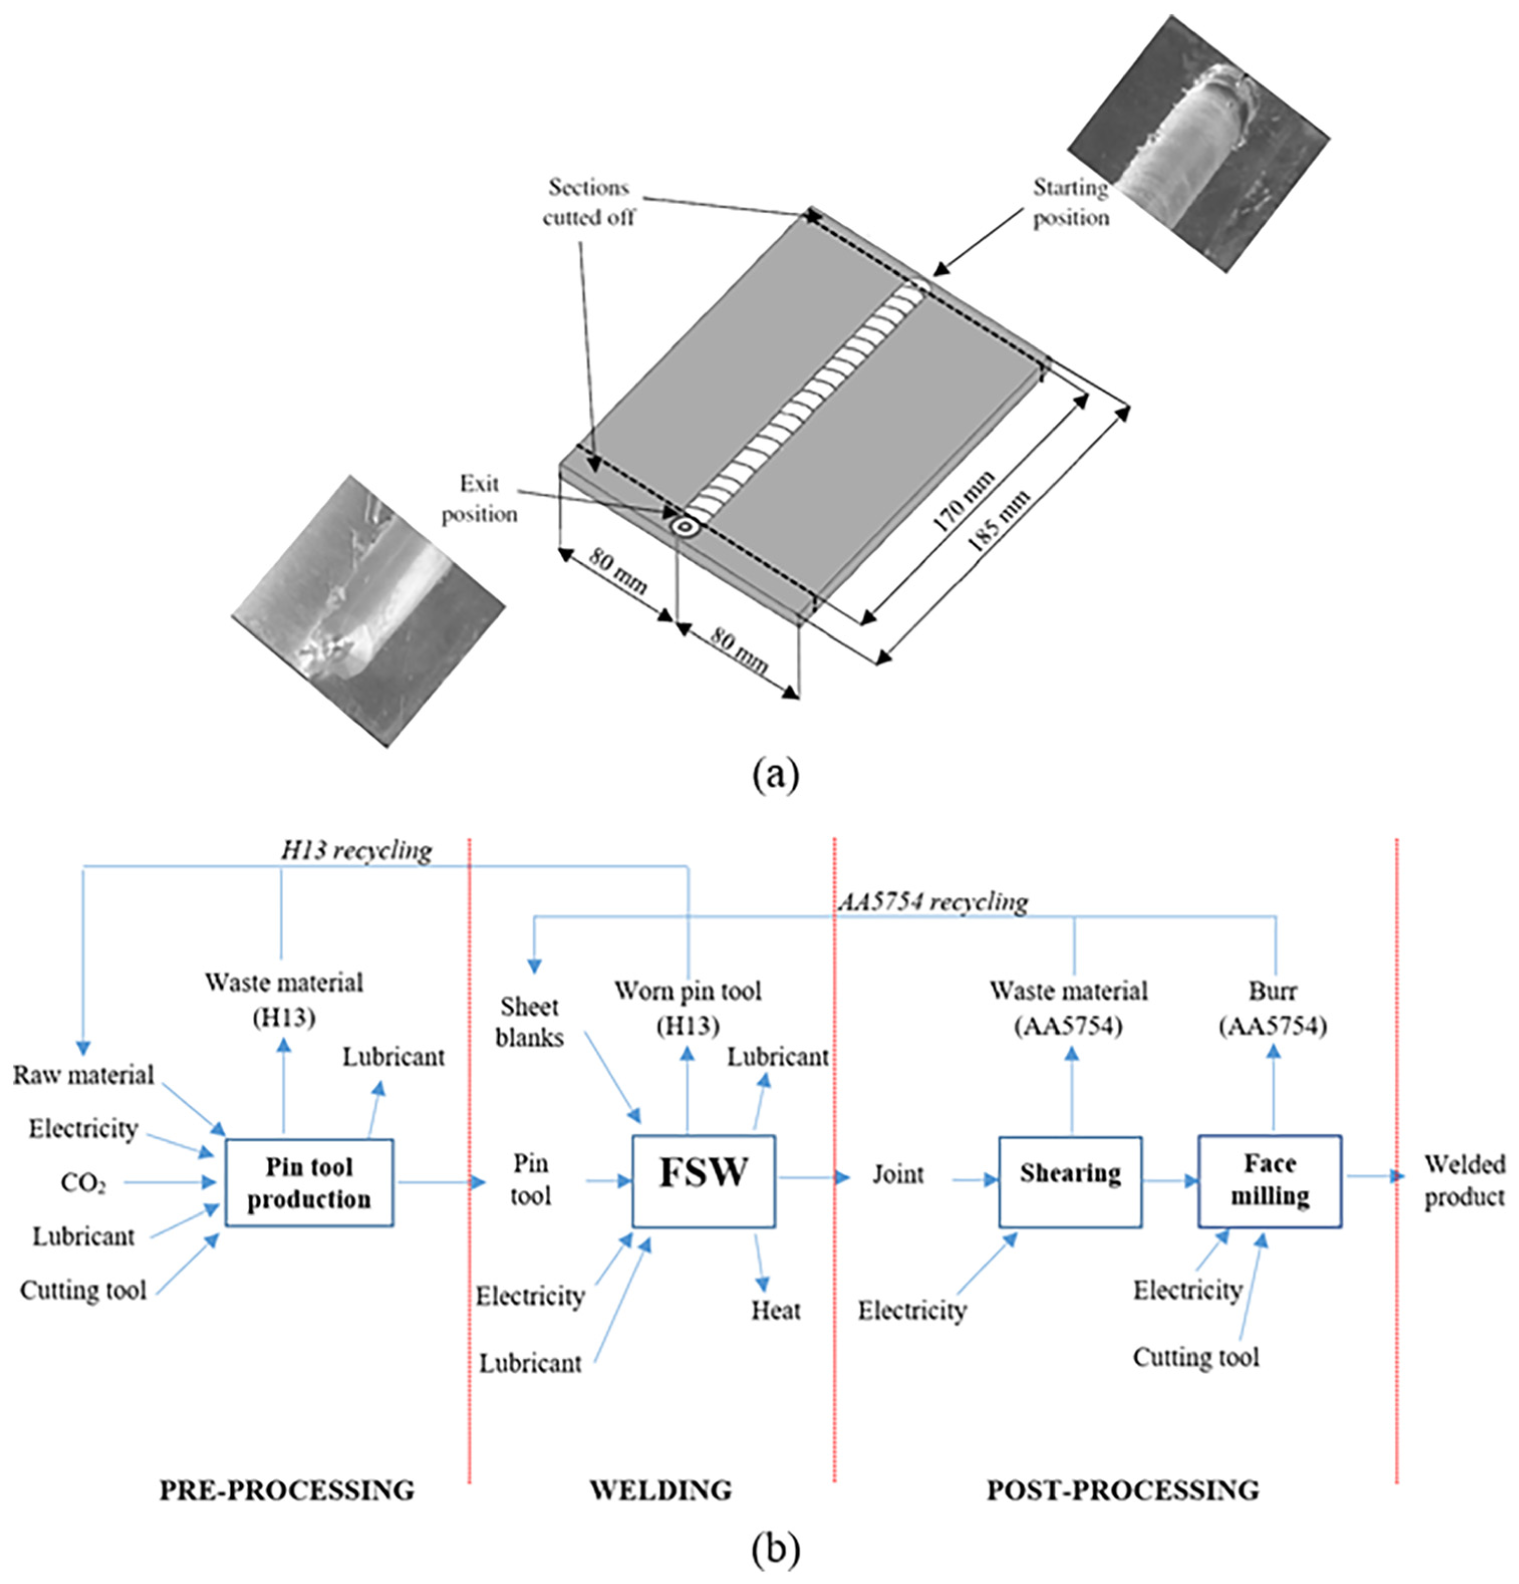
Scheme of FSW process: (a) defects left on the welded blanks and (b) process flow diagram, qualitative material and energy flows of the pre-processing, welding and post-processing stages.
LCA of FSW
According to the International Standard ISO 14040: 2006 Life Cycle Assessment–Principles and Guidelines, the LCA is a method for compiling outputs and inputs of energy and materials connected to a service or product life cycle and for analysing the associated environmental impact. This method supports policy and decision makers to evaluate the best practice from environmental point of view.41–45 LCA consists of four phases: (i) Goal definition and scoping, (ii) Life Cycle Inventory (LCI), (iii) Impact Assessment and (iv) Interpretation. The first one, ‘Goal definition and scoping’, identifies the study objective and determines the system boundaries and assumptions based upon the functional unit definition. The second phase, ‘Life Cycle Inventory’ (LCI), quantifies the inputs and outputs in terms of raw material, water, energy and other releases connected to every life cycle stage. The third one, ‘Impact Assessment’, analyses the human health and environmental impact associated with inputs and outputs quantified by the Life Cycle Inventory. Finally, the ‘Interpretation’ phase evaluates opportunities for reducing raw material, water and energy inputs, or environmental impact at every stage of the product life cycle.
Goal definition and scoping
The product system to be studied is AA5754-H111 sheet blanks welded by means of FSW. The functional unit, that is the base to compare the effect of the process parameters on the environmental impact of FSW process, is related to the maximum tensile force that can be applied to the weld during service without causing failure. In particular, the weld efficiency, defined as the ratio between UTSFSWed and UTSBM, has to be equal to or higher than 80%. By considering the results provided by tensile tests and shown in Table 3, only the joint obtained withω = 1200 rpm and v = 30 mm/min does not match such criteria since its weld efficiency is equal to 76.9%.
The second criterion for the functional unit is based on geometric features; the weld length was set equal to 170 mm. For this reason, the initial length of the sheet blank to be FSWed is higher than the reference one due to the sacrificial material at each end that must be removed after welding by the post-processing operation (Figure 8(a)).
Three processes were considered: the pre-processing operations of blanks, their welding process and post-processing of FSWed blanks. The analysis did not consider the transportation phase of raw material to the welding plant and further transportation phases of assembled sheets. The welding machine fulfilment was also excluded by the analysis. Some production cycle phases (e.g. handling, fixturing) and equipment-related processes (e.g. the machine maintenance) were neglected by the system boundary since the scope of study is focused on the defined welding product system.
Life cycle inventory
The system boundary defines energy, material and substance flows belonging to the boundaries. These are the environmental aspects to be quantified in the LCI and considered as inputs or outputs flowing from the system.
During FSW, both resources, in form of energy and material, were used; they were either converted to be part of the welded blank or consumed to drive the FSW process. Wastes were also generated.
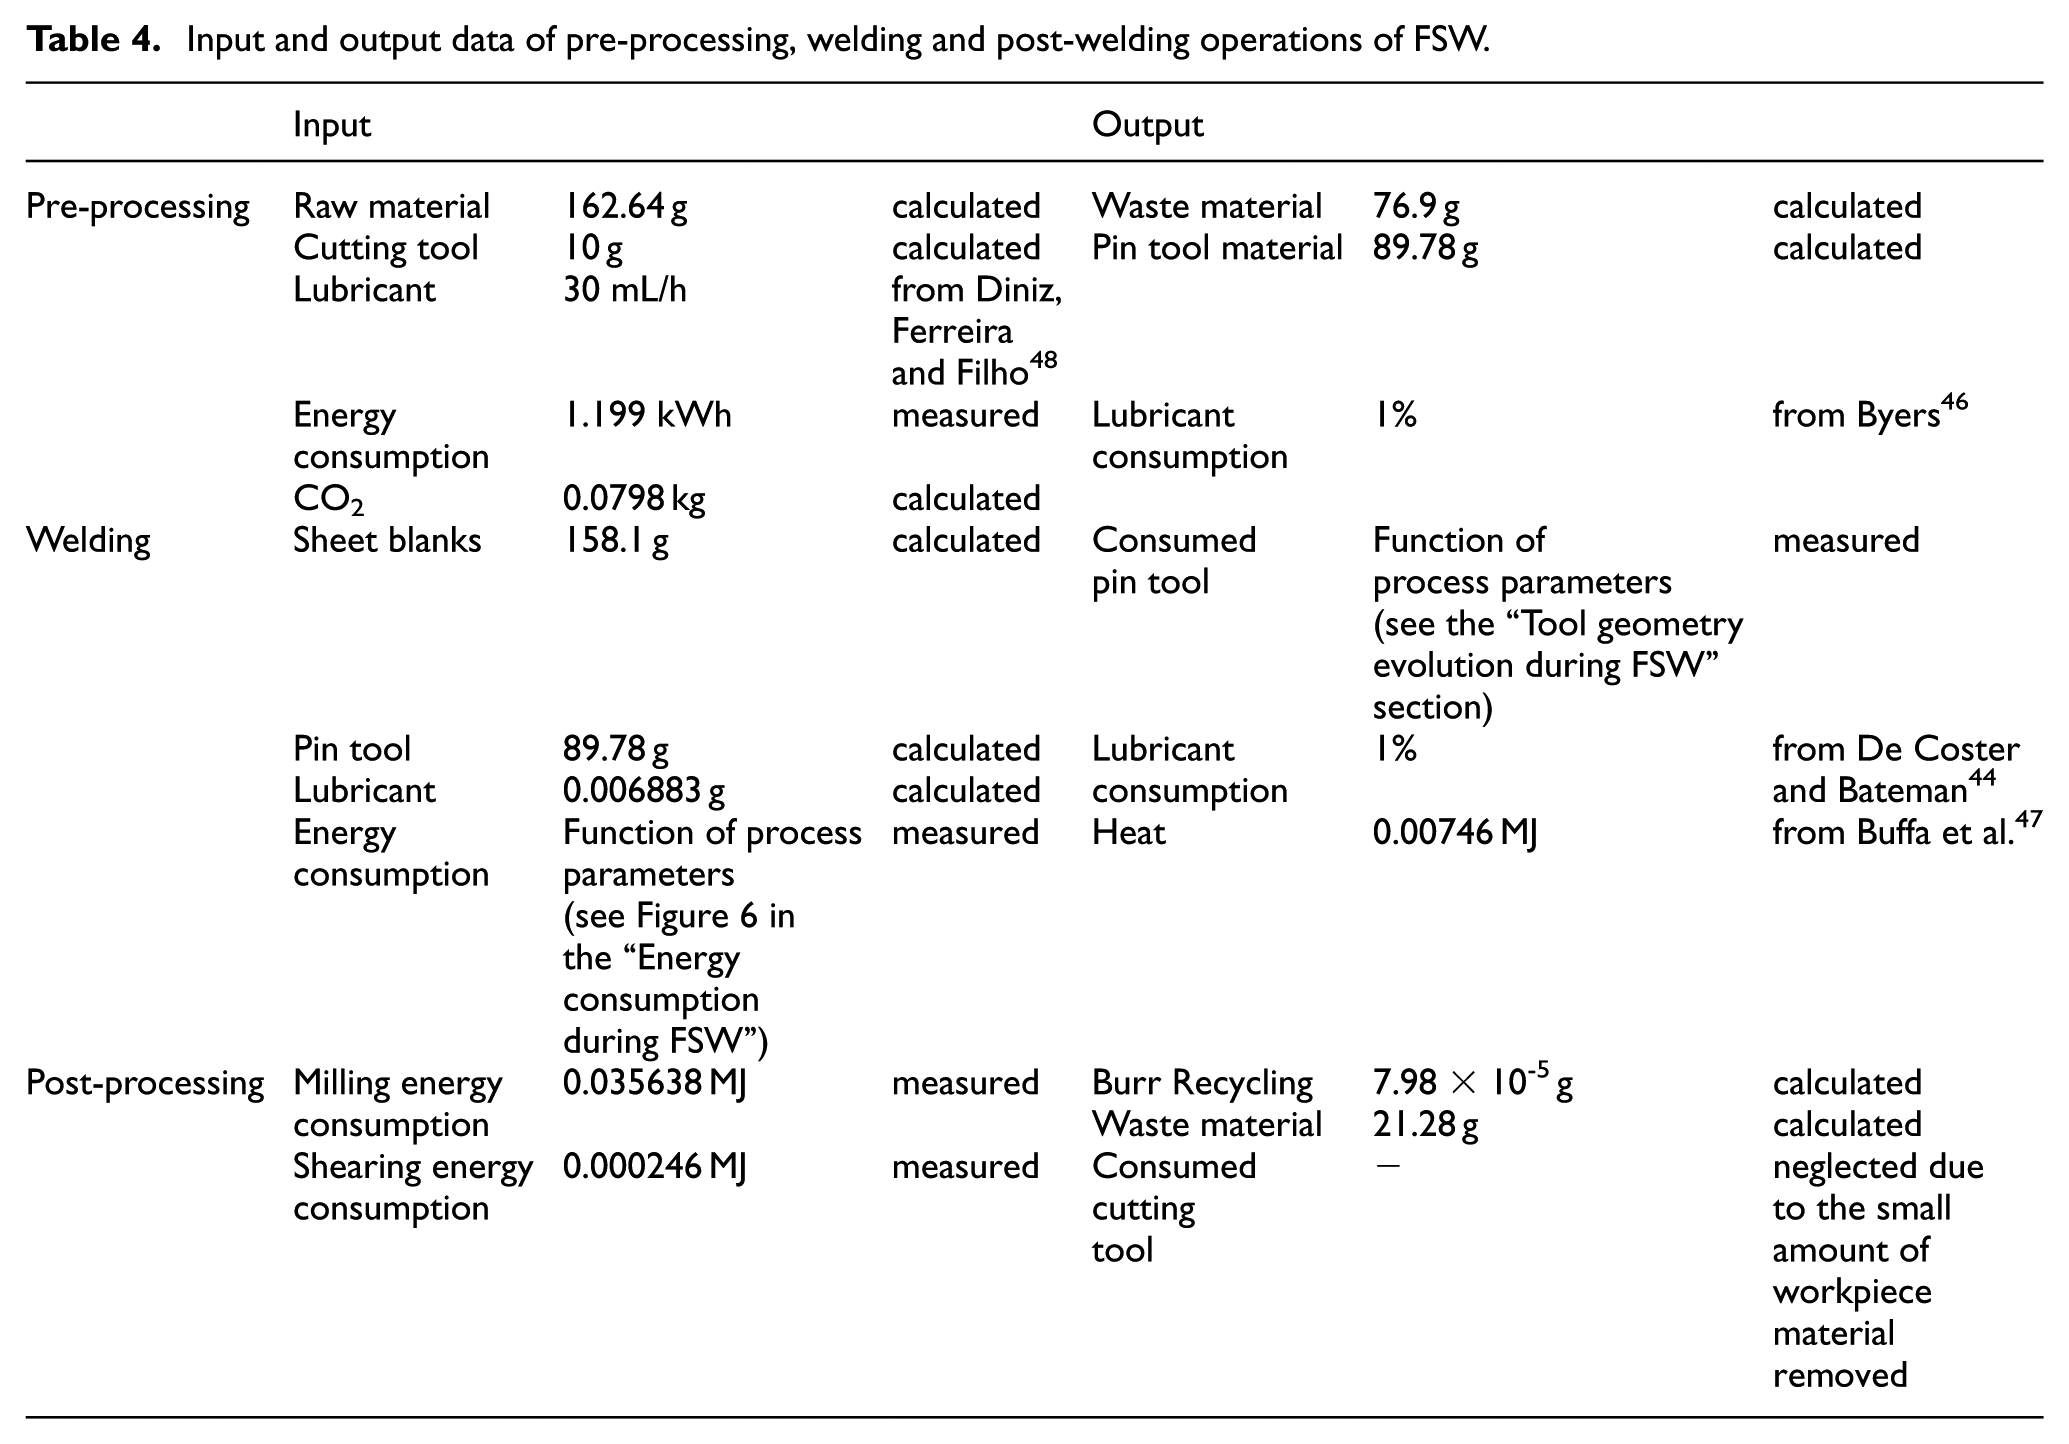
The inputs and outputs associated with pre-processing, welding and post-processing stages of FSW are shown in the material/energy flows of Figure 8(b). Most of them were measured even if some data were extracted from references.46–48 Table 4 summarizes the main energy and material flows involved in the pre-processing, welding and post-processing stages.
Input and output data of pre-processing, welding and post-welding operations of FSW.
Impact assessment of FSW
The IMPACT 2002 + V2.2 method, based on a combined midpoint/damage oriented approach, 49 was used in order to quantify the environmental burdens associated with energy, materials and substances. Such method considers several midpoint categories;50–54 however, in the present work only six categories were taken into account due to the industrial and mechanical nature of the study: (i) human toxicity carcinogenic effects, (ii) aquatic ecotoxicity, (iii) respiratory inorganics, (iv) terrestrial acidification/nitrification, (v) global warming, and (vi) non-renewable energy consumption (Appendix 1). In order to develop the Life Cycle Impact Assessment, SimaPro v7.3 and the Ecoinvent 3.1 database were used. Italian data were selected if available; otherwise, average European data were used.
Table 5 reports the values of the selected midpoint categories and, consequently, the different types of impact on the natural environment corresponding to the FSW processes carried out at different ω and v values. Irrespective of ω, each category is characterized by an environmental impact that decreases with increasing welding speed. Such behaviour can be attributed to the marked reduction in the energy absorbed during FSW with the increase in welding speed (Figure 6). As far as the rotational speed is concerned, irrespective of v, the effect of ω value on the environmental impacts is less marked. Furthermore, for each midpoint category, such behaviour leads to an increase in the environmental impact with ω reaching a peak value at ω = 1500 rpm. This is consistent with the results shown in Figure 6 in which a slight increase in the energy with rotational speed is observed until ω = 1500 rpm, followed by a slight decrease in the energy absorbed with increasing ω value. The process condition withω = 2500 rpm and v = 100 mm/min is characterized by the highest environmental sustainability.
Influence of rotational and welding speeds on midpoint categories corresponding to typical FSW processes.
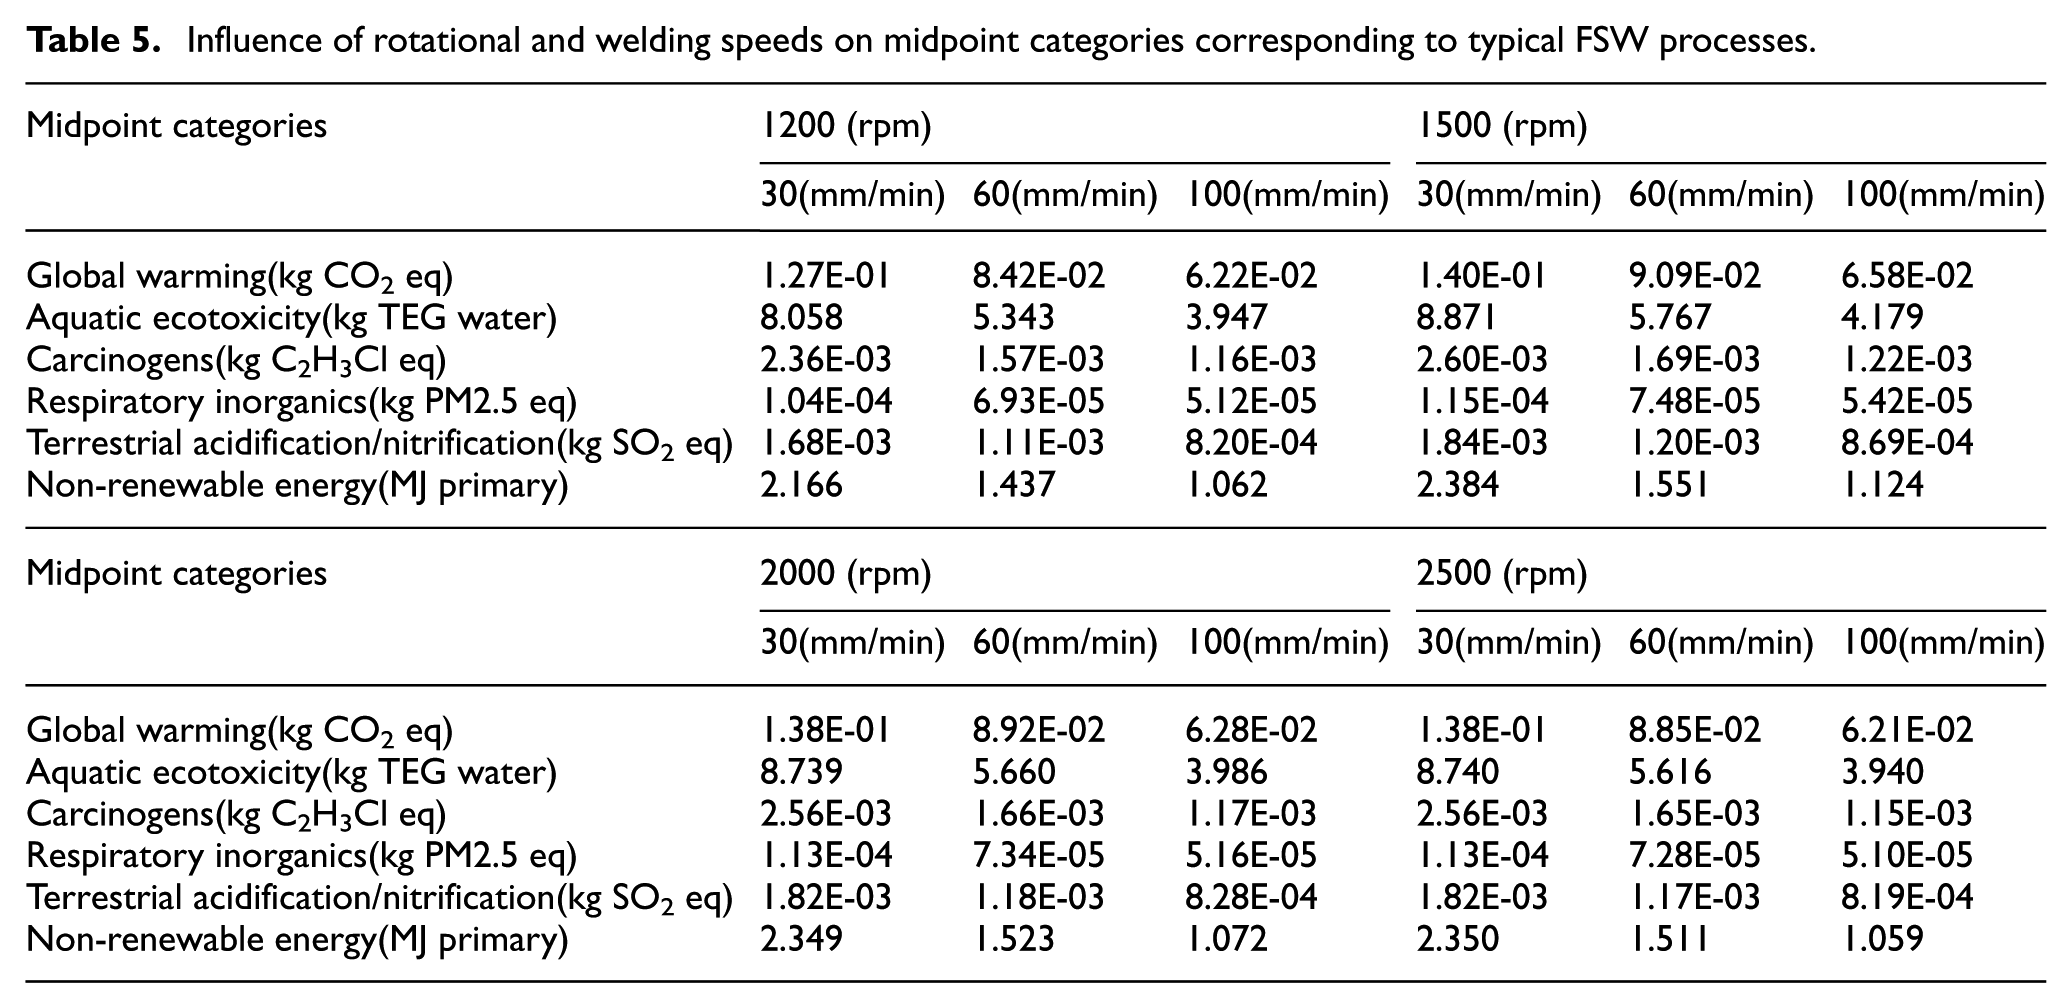
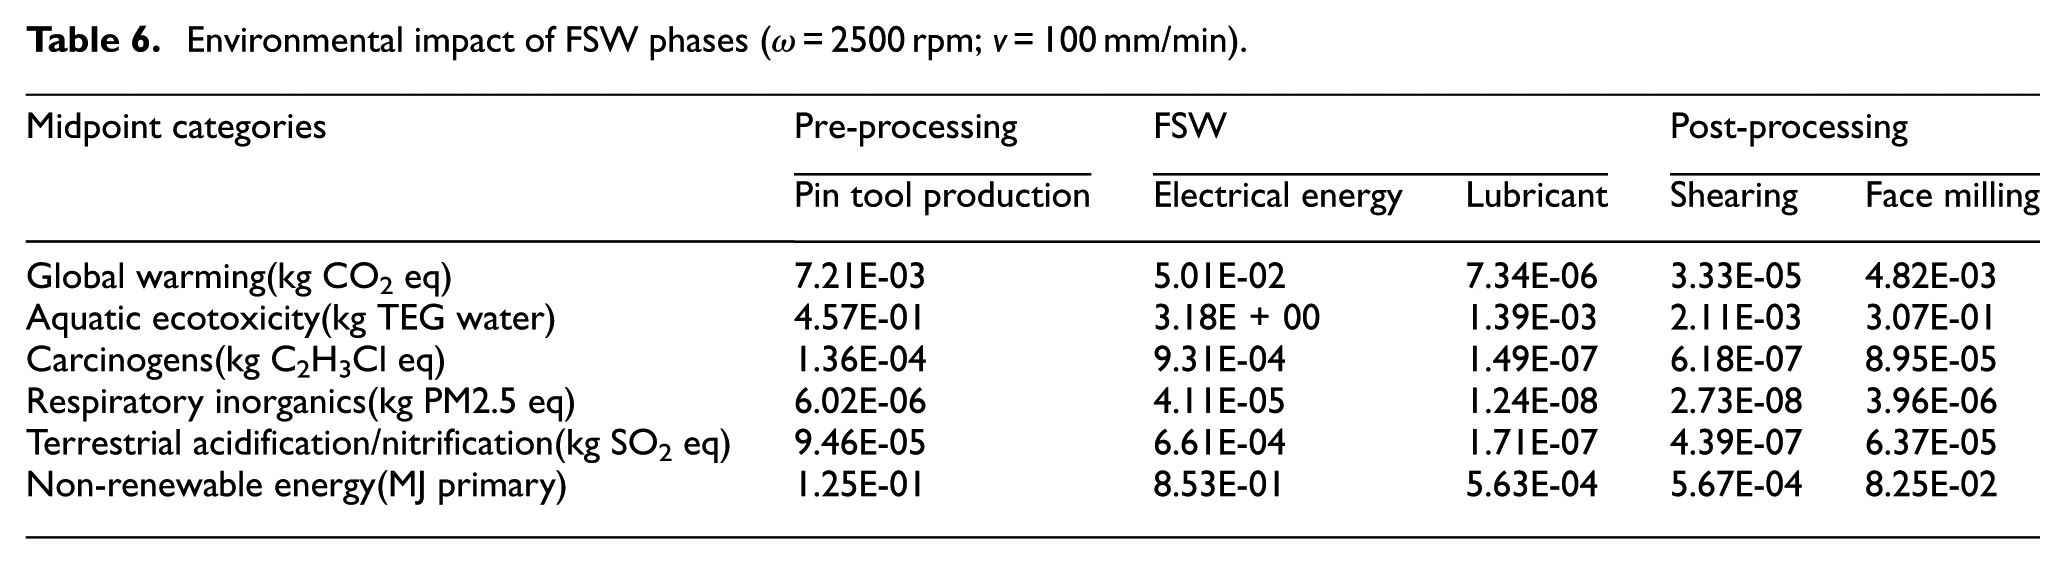
Table 6 shows the main contributions related to the pre-processing, FSW and post-processing stages on the environmental impact. Such results refer to FSW carried out at 2500 rpm and 100 mm/min, even though similar environmental impacts, in percentage values, were obtained by performing welding at different ω and v values.
Environmental impact of FSW phases (ω = 2500 rpm; v = 100 mm/min).
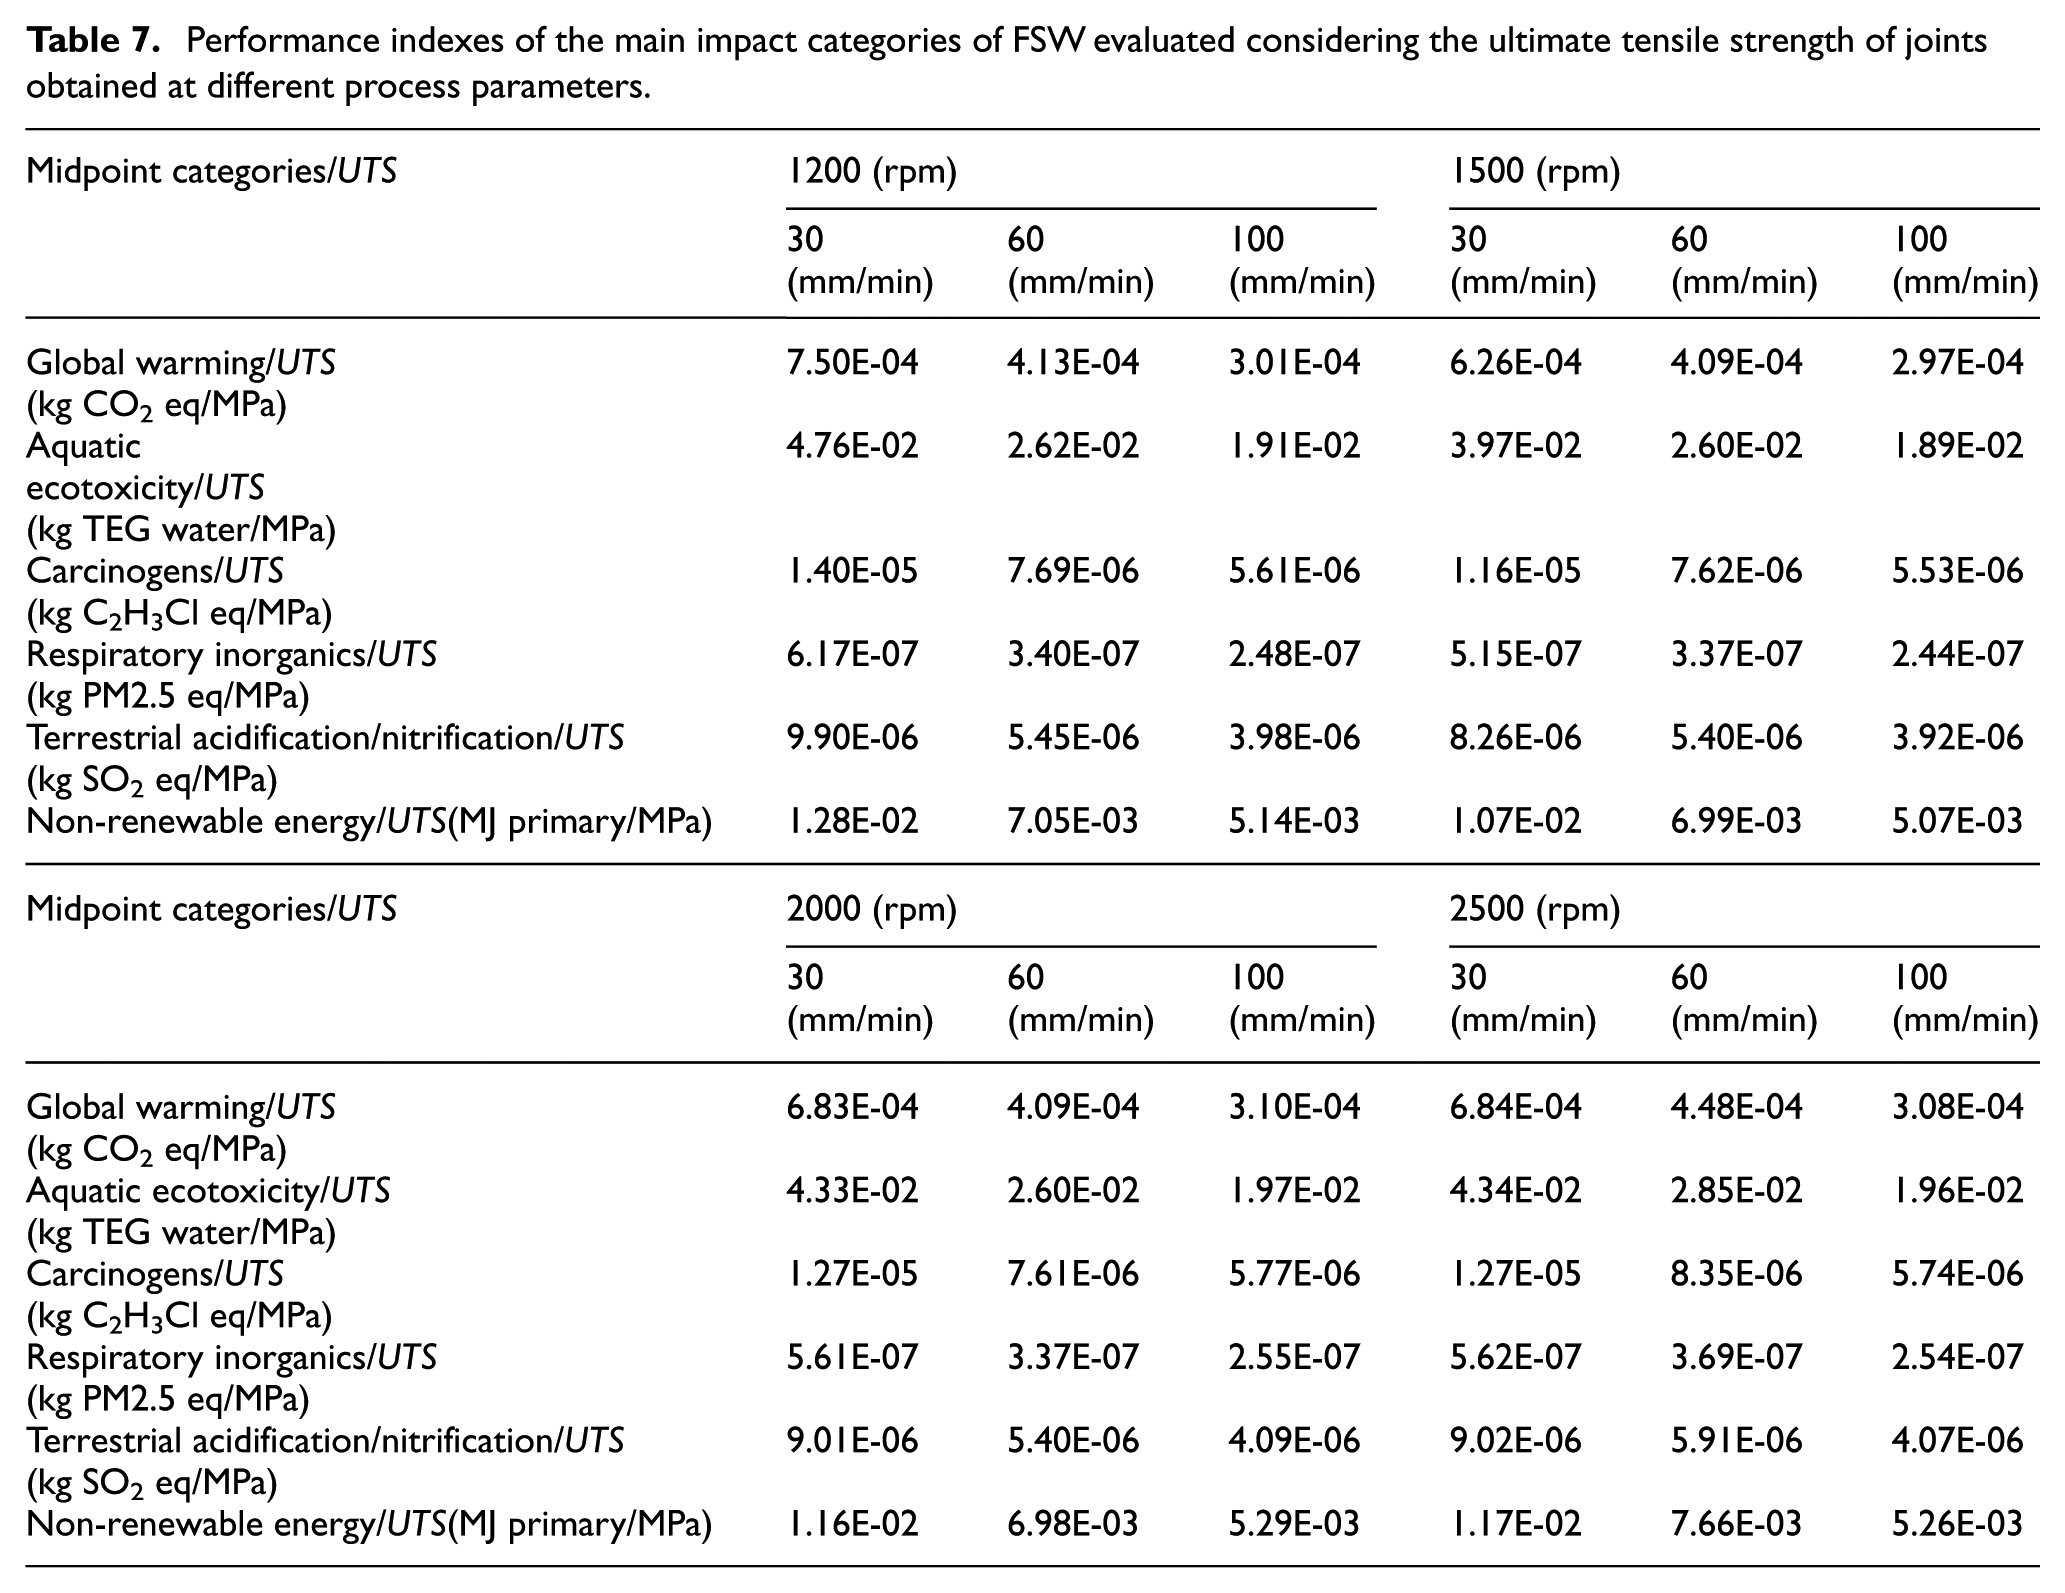
Since one of the criteria for the functional unit, deriving from structural design requirement, is based on the strength of FSWed joint, it can be useful to define a further performance index obtained by considering both the midpoint category impact (Table 5) and the UTS (Table 3). To this purpose, by indicating with X a generic midpoint category, the impact category index for unit of UTS (XUTS) was defined according to the following equation
Table 7 reports the XUTS values for the different midpoint categories as a function of rotational and welding speeds. It can be observed that for a given ω value, such performance index decreases with increasing v; furthermore, irrespective of v value, a small influence of the ω on XUTS appears consistently with the results obtained without considering the material strength (Table 5). As an example, Figure 9(a) shows the effect of ω and v values on the midpoint category Global warming index while Figure 9(b) shows the influence of process parameters on the Global warming index per unit of UTS. It can be observed that the process condition with ω = 1200 rpm and v = 100 mm/min is the best compromise between the environmental impact and material strength. Furthermore, it appears that atω = 1500 rpm, irrespective of welding speed, the Global warming index for unit of UTS takes advantage of the highest UTS values compared with other welding conditions (Table 3). The same trend shown in Figure 9 is exhibited by the other midpoint category indexes for unit of UTS reported in Table 7.
Performance indexes of the main impact categories of FSW evaluated considering the ultimate tensile strength of joints obtained at different process parameters.
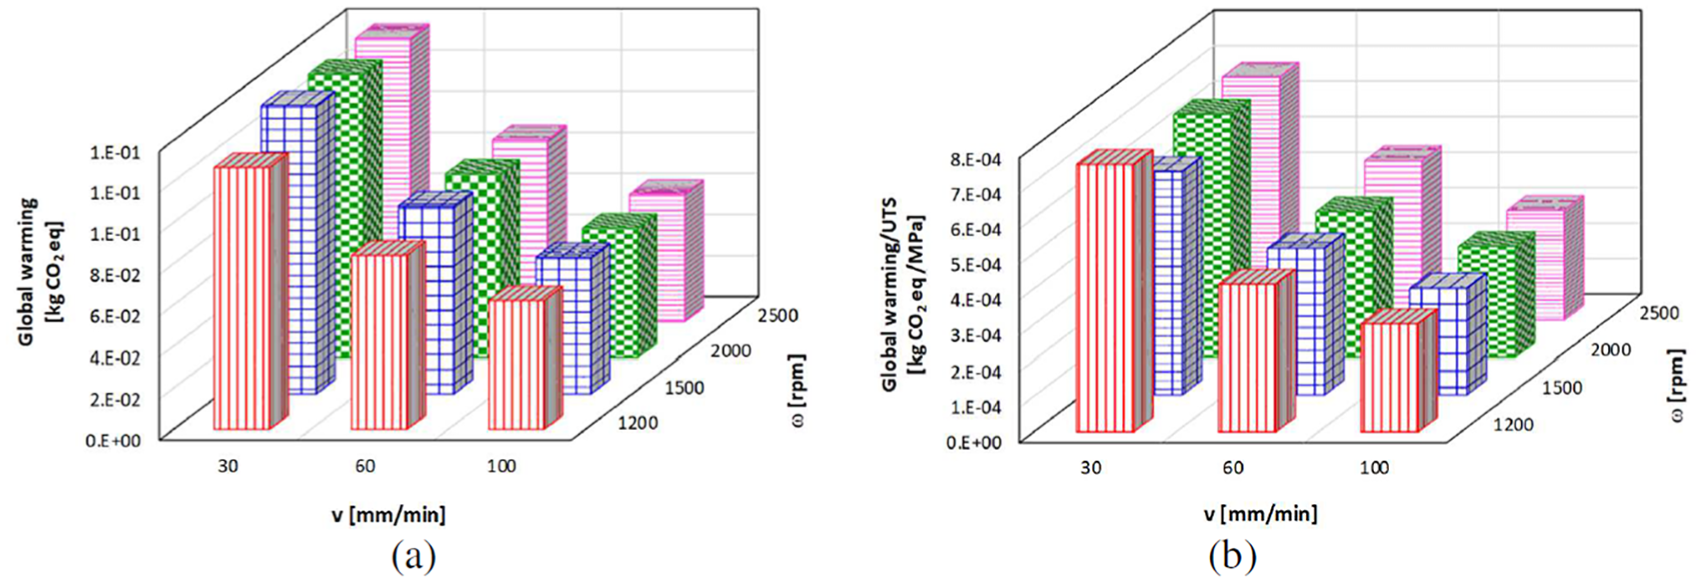
Effect of rotational and welding speeds on (a) the Global warming index and (b) the Global warming index per unit of UTS of AA5754-H114 FSWed joints.
Comparison among environmental impact of friction stir, laser beam and gas tungsten arc welding processes
The research and industrial welding community consider FSW as a green process that consumes less energy compared with fusion welding technologies.17,55 It is attributed to the solid-state nature of FSW and, consequently, to the lower temperatures achieved during the process. Furthermore, FSW does not require shielding gases, filler material, chamfering or edge preparation of sheet blanks and cleaning of edges, and no dangerous gas emission is generated during process.
In order to evaluate the environmental sustainability of FSW, the LCA analysis was also carried out for GTAW and LBW processes. It should be taken into account that aluminium alloys are very difficult to be welded by means of fusion techniques since they have a strong tendency to solidification cracking and, in some cases, an increased susceptibility to stress corrosion cracking in the as-welded condition. Furthermore, preheating may be necessary, particularly where thick sections are encountered. Aluminium alloys require high heat inputs to melt and may suffer from large deformations. Finally, aluminium rapidly develops a tenacious surface oxide film as it is exposed to air. Unless the oxide film is destroyed or removed before and during welding, it will interfere with the coalescence of the workpieces and, if applicable, the filler material. For such reasons, the weldability window of aluminium alloys is very narrow as compared with that of FSW. Preliminary tests, performed on AA5754-H114 alloy using the two fusion welding processes investigated in the present work, have confirmed the above mentioned issues. As a matter of fact, the GTAW and LBW processes led to sound welds only under well-defined process parameters.
Sheet blanks with the geometry defined in Figure 10(a) were used in both welding processes. After welding, the ends of the welds were cut off in order to obtain the desired functional length of 170 mm.
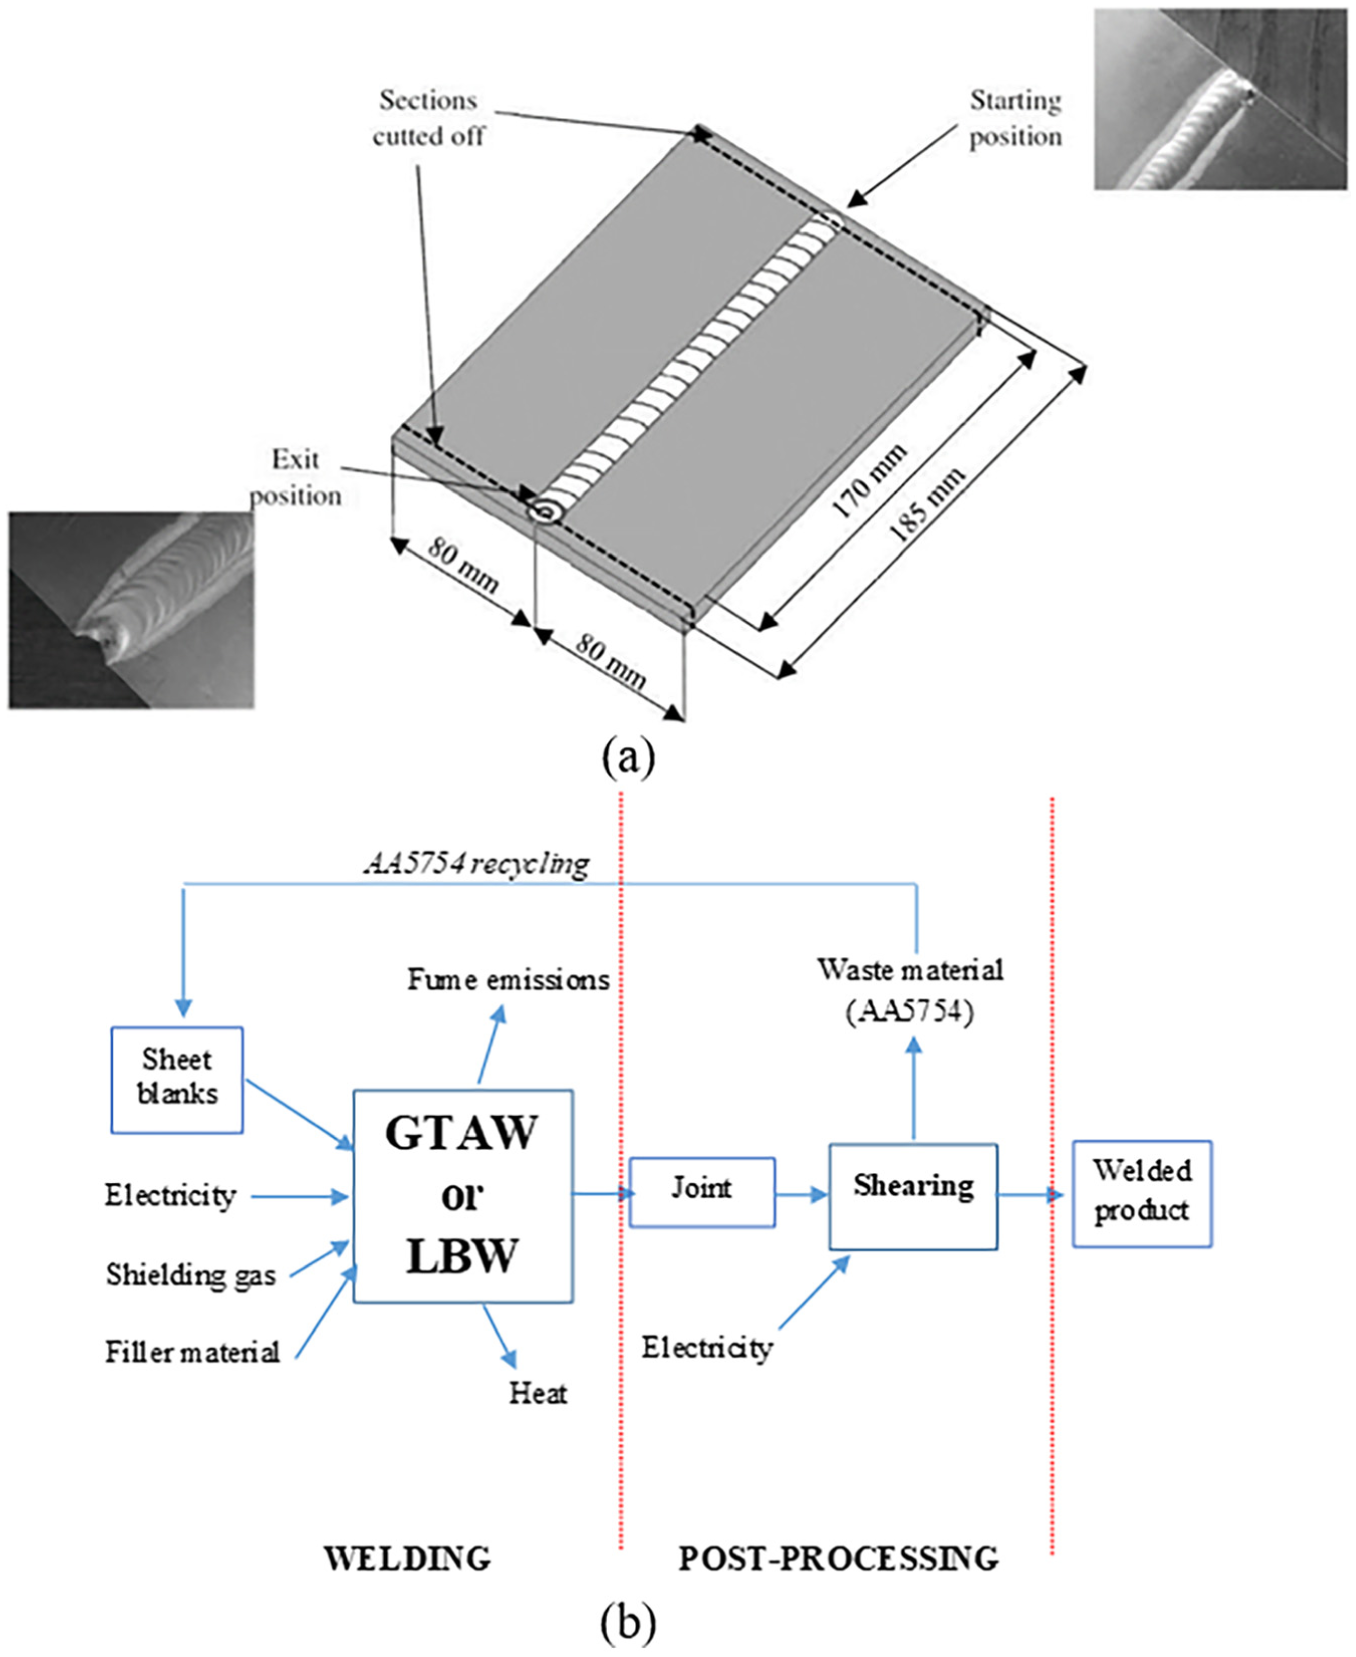
Scheme of GTAW and LBW processes: (a) sheet blanks geometry and (b) process flow diagram, qualitative material and energy flows and post-processing operation used in both technologies.
GTAW parameters
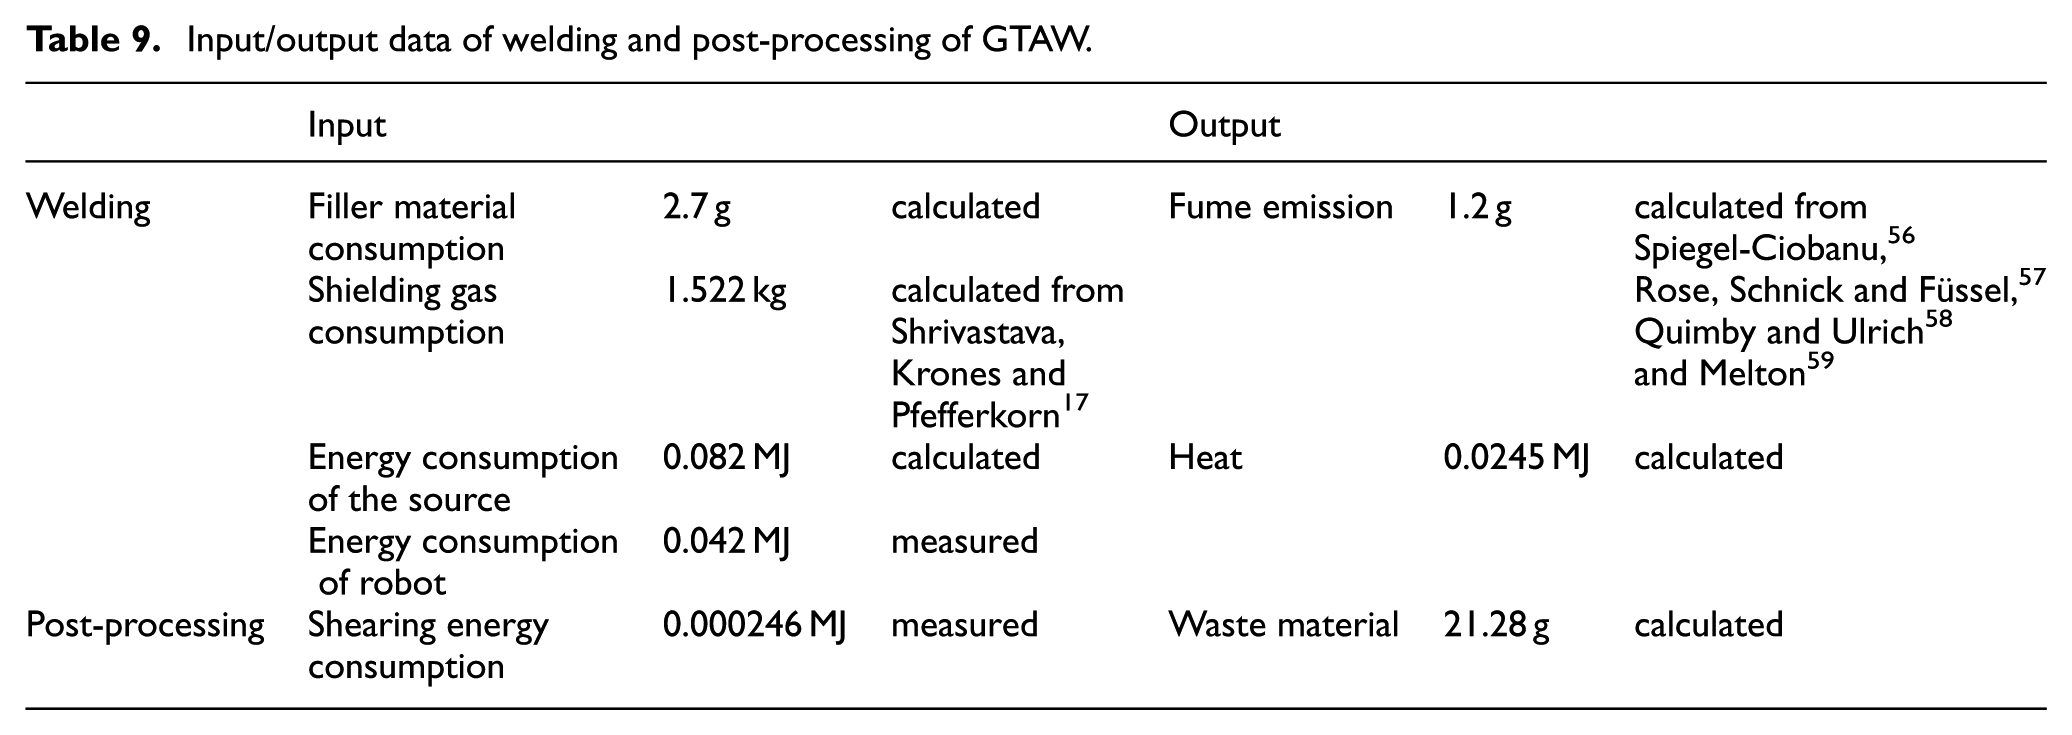
Sheet blanks in AA5754-H114 alloy were welded using a robotized welding system. GTAW experiments were carried out with alternating current, according to the welding parameters reported in Table 8. Pure argon was used as a shielding gas; the filler material was AA5356 wire, 2.4 mm in diameter, typically used in welding of Al alloys. The sheet blanks were butted with an assembly clearance of 1.5 mm and kept on a copper backing plate. The full penetration weld was obtained by a single pass process. The input and output data associated with welding and post-processing stages of GTAW are shown in Figure 10(b), while Table 9 reports the main material and energy flows involved.17,56–59
Welding parameters used in the GTAW experiments of AA5754-H114 alloy.
Input/output data of welding and post-processing of GTAW.
LBW parameters
Butt joints in AA5754-H114 alloy were also obtained by means of robotized LBW. During welding, the top and bottom surfaces of the welding zones were shielded by argon. Table 10 summarizes the process parameters of the LBW experiments.
Welding parameters used in the LBW experiments of AA5754-H114 alloy.
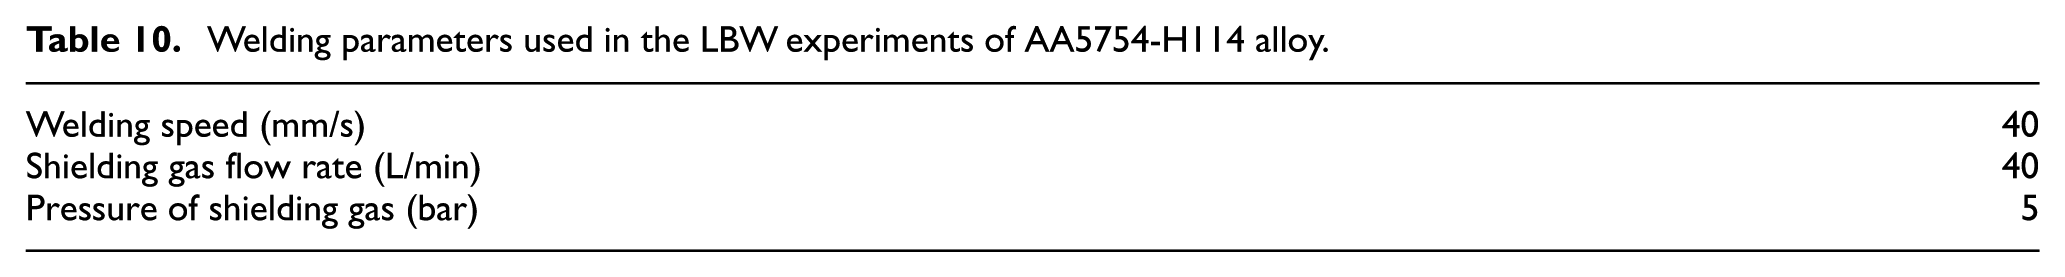
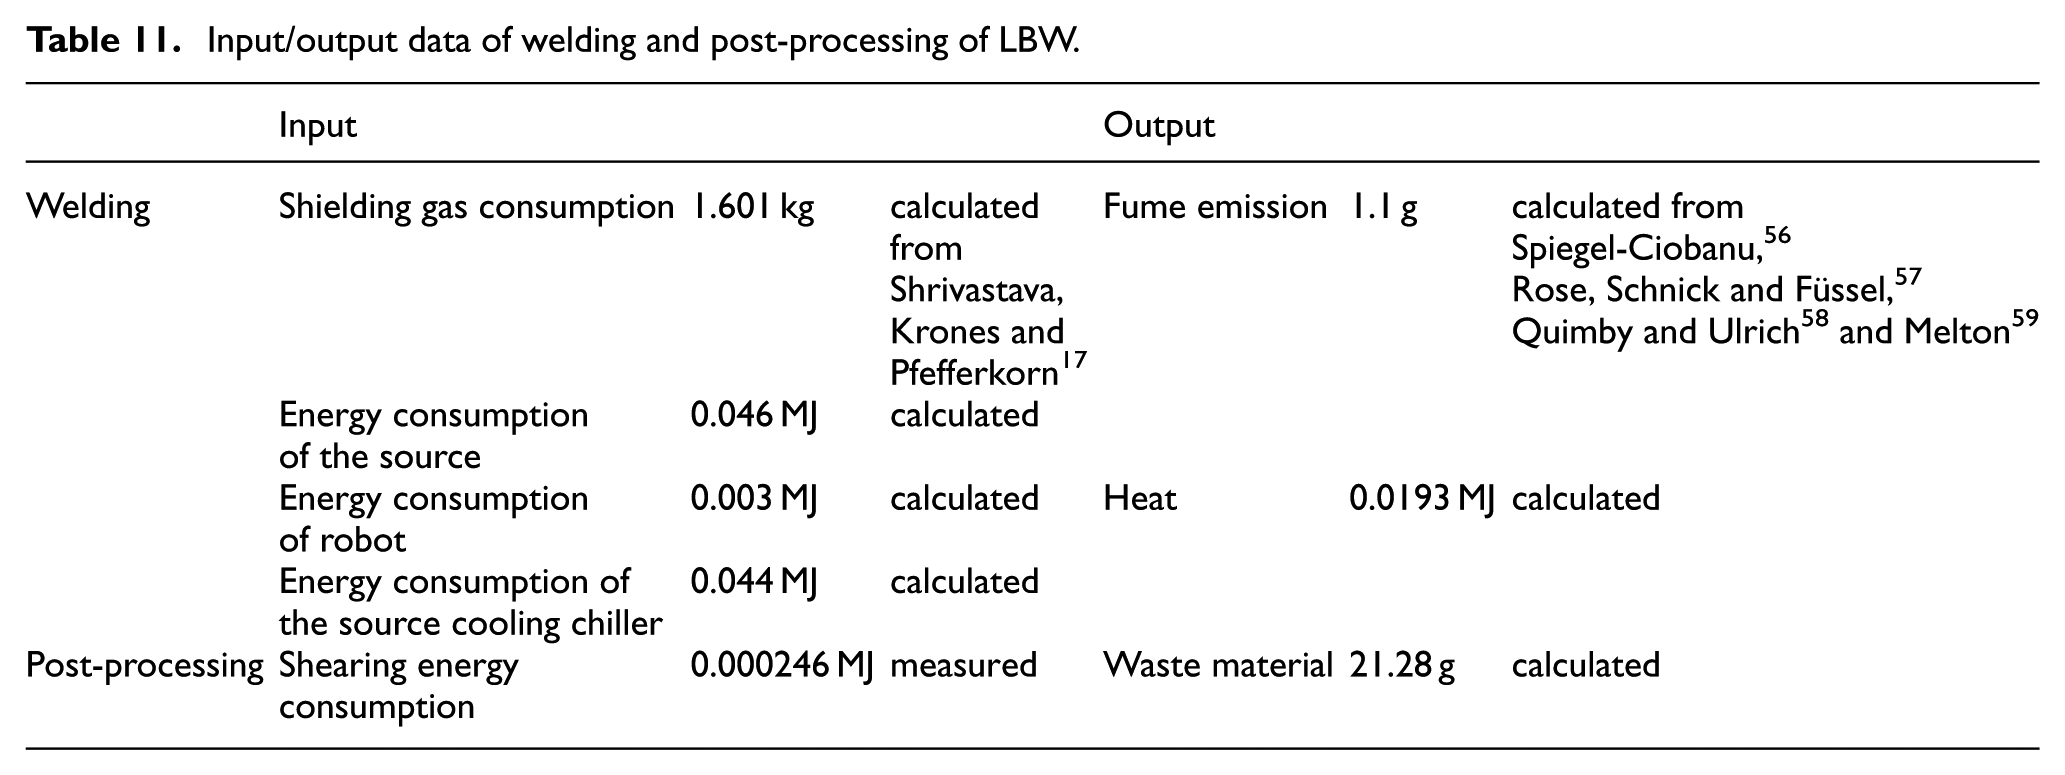
Figure 10(b) shows the inputs and outputs related to welding and post-processing stages, and Table 11 summarizes the main energy and material flows.17,56–59
Input/output data of welding and post-processing of LBW.
Impact assessment of GTAW and LBW processes
The UTS values obtained by the s-e curves of AA5754 alloy joints achieved by LBW and GTAW processes are equals to 210.9 MPa and 189.2 MPa, respectively. Thus, the criteria of weld efficiency are fulfilled since the weld efficiency obtained by LBW and GTAW processes (95.9% and 86%, respectively) is higher than 80%.
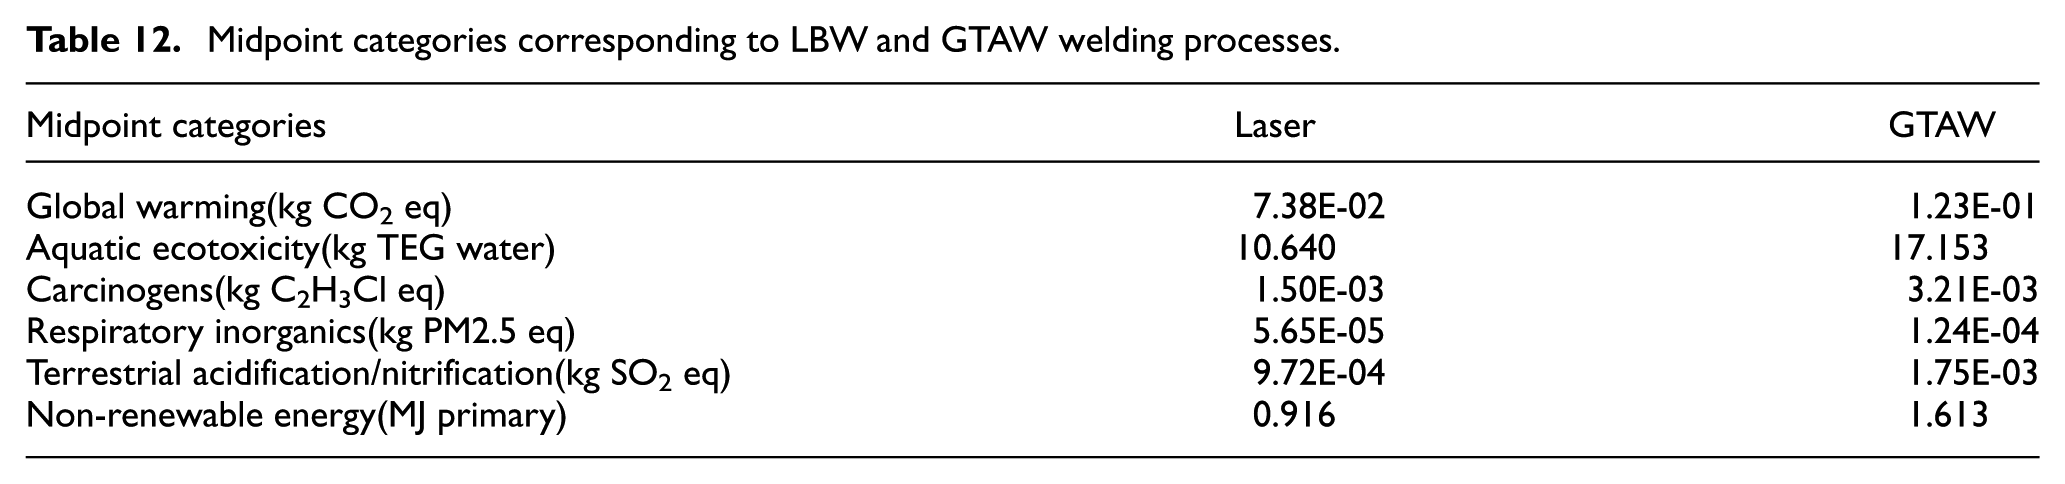
The selected midpoint categories corresponding to the LBW and GTAW processes are shown in Table 12. It appears that for each midpoint category, the environmental impact of the LBW process is much lower than that occurring in the GTAW one, denoting a higher environmental sustainability of the former compared with the latter.
Midpoint categories corresponding to LBW and GTAW welding processes.
Such results were compared with those provided by FSW performed under the process condition leading to the lowest environmental impact (ω= 2500 rpm and v = 100 mm/min). To this end, after normalization, the results expressed in terms of the selected midpoint categories were displayed in the radar chart of Figure 11 in which the six variables represented on the axes were the selected midpoint categories. The data length of a selected midpoint category is proportional to the magnitude of this variable for the data point relative to the maximum magnitude of the variable across all data points. The comparison among the three different welding technologies can quickly be visualized. In particular, since GTAW is characterized by the maximum magnitude of each midpoint category, it was represented by the external hexagon and, consequently, by the highest environmental impact. The assessment graph indicates a general advantage of the FSW process compared with LBW technology.
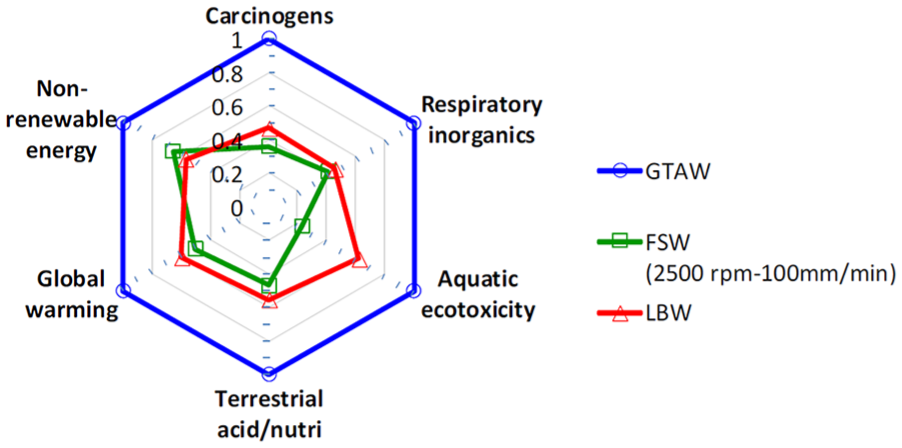
Comparison of the characterization values of the main midpoints corresponding to FSW, LBW and GTAW technologies.
Although FSW is associated with a higher consumption of electrical energy, this technique does not require the shielding gas. Indeed, the argon used in the GTAW and LBW processes is clean, ecological and inert; there is no environment impact related to its dispersion in the atmosphere and it does not develop harmful or corrosive decomposition products. Unfortunately, its production requires a large amount of electrical energy used in distilleries for the gas extraction.
In addition, from the results shown in Figure 11, a reduction (58%) of particulate matter (PM2.5eq.) moving from GTAW to FSW can be seen. This result is consistent with the studies in literature. Pfefferkorn et al. found that FSW leads to average emissions of PM 2.5 particulates of 0.018–0.029 mg/m3 for Al 6061-T6 and 0.015–0.022 mg/m3 for Al 5083-H111. 60 Cole et al. 61 analysed the rate of PM 5 particulates for GMAW of Al 6061 in the welder’s breathing zone and found an average of 12 mg/m3 for welding with Al 4043 wire and 14.1 mg/m3 for Al 5356 wire. This result is also connected to social impact. The most common health disorders in workers due to the welding emissions include irritation of the eyes, nose and throat; pulmonary oedema; and Parkinson’s disease. Health hazards due to welding processes are mainly caused by particulate emissions in the breathing zone of the welder. 62
FSW allowed reducing greenhouse gas emission in comparison with LBW (–12.4%) and GTAW (–49.4%) processes. These results, obtained in terms of CO2 eq. emissions, are consistent with those given by other studies. For instance, Shrivastava et al. showed that FSW leads to a reduction of greenhouse gas emissions of 31% compared with GMAW. 17
Only in the non-renewable energy midpoint category the LBW overperformed the FSW. This result is associated to the high consumption of electrical energy of FSW and to the electrical energy source considered for FSW that is mainly related to fossil fuels combustion.
Conclusions
The environmental impact of FSW of blanks in AA5754-H114 aluminium alloy was evaluated by the LCA methodology, as a function of process parameters as well as pin tool consumption. The welding speed influences the environmental impact more than the rotational speed due to the marked reduction in the energy absorbed during FSW.
Irrespective of the process parameters considered, midpoint values highlight that the pre-processing and the post-processing in FSW are responsible for a very low environmental impact. On the contrary, the electricity consumption during the welding process is responsible for the most impact on the analysed midpoints. The use of gas, oil and coal necessary for the electricity production are connected to impacts values on resources, climate change and human health. The fossil fuel combustion generates small inorganic and carcinogenic particles, hazardous to the human respiratory tract. The environmental impact related to the pin tool can amount up to 15% of the total impact and varies according to the ω and v values. Such result can be attributed to the high frequency of the pin tool to be replaced in FSW.
Using the same functional unit, the LCA analysis was carried out for GTAW and LBW processes, to prove the environmental sustainability of FSW. Results on the environmental impact, obtained using IMPACT 2002 + method, have shown that FSW clearly offers environmental advantages in comparison with the GTAW technique and slight environmental advantages compared with the LBW one.
Some implications and benefits of this study can be highlighted. The increasing attention of media and public opinion on environmental sustainability is pushing the manufacturing industry to adopt green engineering concepts. In particular, the LCA methodology helps to raise awareness, decision making and progress towards a defined goal. In addition, apart from environmental benefits, waste minimization and improved energy efficiency have a positive influence on an organization’s bottom line. Moreover, resource and energy management facilitate newer technology for successful implementation of sustainable strategies in the manufacturing scenario.
Footnotes
Appendix 1
Acknowledgements
Dr. Massimiliano Pieralisi and Dr. Luciano Greco are acknowledged for their contribution in the experimental work.
Declaration of conflicting interests
The author(s) declared no potential conflicts of interest with respect to the research, authorship, and/or publication of this article.
Funding
The author(s) received no financial support for the research, authorship, and/or publication of this article.