
Abstract
The nickel-based superalloy GH4169 is widely applied in the aviation industry due to its outstanding mechanical properties. However, many blades of GH4169 are still produced by milling and manual polishing, which is costly and unreliable. In this article, GH4169 superalloy components manufactured with combination processes of milling, grinding, and polishing were comparatively studied involving surface integrity and fatigue performance. Test results indicate that the final polishing is the most dominant process that influences the high-cycle fatigue life of GH4169 components. Samples produced via cubic boron nitride grinding and numerical control polishing with a diamond-rubber wheel exhibit fatigue limits of 150 MPa higher than the milled and manually polished samples. Cubic boron nitride grinding induces a considerable compressive residual stress profile with a magnitude of -930 MPa and a depth of 200 μm. Milling induces a typical “hook” residual stress profile with 318 MPa at the surface. Polishing affects the machined surface by two ways, the removal effect and the squeezing effect. The squeezing effect induces a shallow compressive residual stress with approximately −1000 MPa, therefore improves the surface condition. However, inevitable omissions, scratches, texture disorders, and knock marks in hand-polishing are the main causes of the unstable high-cycle fatigue life of hand-polished components.
Introduction
Nickel-based superalloy GH4169 (similar to Inconel 718) is widely employed in the aviation industry due to its superior strength in environmental temperature up to 200 °C–700 °C. 1 The 50% weight of the jet engine is GH4169. 2 The fatigue performances of GH4169 components depend significantly on the surface integrity induced by manufacturing processes. However, some compressor blades and impellers of GH4169 are still produced by milling and manual polishing.3,4 This process has several disadvantages. First, milling complex components of difficult-to-cut material with weak rigidity is complicated. Then, manual polishing is environmentally unfriendly. Most importantly, manual polishing can significantly reduce the reliability of components, especially when polishing is the finishing operation. Thus, it is necessary to determine an alternative process for milling and hand-polishing. Many investigators have recently turned to develop preferable combination processes including grinding, milling, and polishing to enhance fatigue life of components.
The cubic boron nitride (CBN) abrasive has the characteristics of sharp cutting edge and high thermal conductivity. 5 Therefore, CBN grinding tends to induce deep compressive residual stress, which is reported beneficial to fatigue resistance. Many researchers reported the positive effect of CBN grinding on the fatigue life of components.6,7 On the contrary, Li et al. recently found that CBN grinding is harmful to fatigue life on both GH4169 and Ti1023. Because CBN grinding produces more stochastic surface topography than conventional milling.8,9 Thus, without regard to final polishing, the advantage of CBN grinding is under argument.
With the consideration of final polishing, Wu et al.10,11 conducted a comprehensive study on the surface integrity and fatigue performance of GH4169 components produced with five combination processes including cutting, shot-peening, and polishing. They found that final polishing, especially axial texture polishing, 11 has a noticeable improvement on the shot-peened components due to the reduction of surface roughness. They also found that both pre-polishing and post-polishing can increase the fatigue life of shot-peened components. 12 Pre-polishing prepares a uniform surface condition for shot-peening, while post-polishing further decreases the shot-peened surface roughness and removes the defects and pits. However, as for the superiority of polishing, some research showed different results. Novovic et al. 13 concluded that polishing has no improvement in fatigue life at room temperature because the decisive factor is residual stress instead of surface roughness. However, they pointed out that polishing can improve fatigue life when the residual stress has degenerated at high temperatures. Chen et al. 14 reported the same finding in their research of broaching, polishing, and heat treatment on Inconel 718 superalloy. Warren and Guo 15 compared four combination processes of hard turning, grinding, and polishing on surface integrity and rolling contact fatigue performance. They resulted that polishing may not improve the fatigue life of the sample surface, but increases the fatigue life of bearing assembly, which means the life before the failure of any component of the bearing assembly (sample, ball or washer). Gao et al. reported a study of seven combination processes including grinding, electro-polishing, hard chromium plating, and shot-peening on 40CrNi2Si2MoVA steel. They found that electro-polishing has little improvement in fatigue life. 16
The above researches have made essential contributions to the optimization of processes. However, the knowledge of combination processes of milling, CBN grinding, and polishing is still lacking. The differences between numerical control (NC) polishing and hand-polishing have received little attention. Notably, hand-polishing was widely used in these researches, but the effect of polishing instability on surface integrity and fatigue life has never been assessed. The objective of this study is to fill in the knowledge gap and solve these problems. This study investigates the combined effect of milling, grinding, and polishing treatment on the surface integrity and fatigue performance of GH4169. The evolution of surface integrity during the machining processes is revealed. Notably, the effect of polishing on surface integrity and fatigue life is discussed.
Equipment and methodology
Workpiece material and machining tools
A nickel-based superalloy, GH4169, consisting of 0.04% C, 19% Cr, 53% Ni, 0.5% Co, 3% Mo, 0.5% Al, and Fe for the balance (in wt%), was selected in the present study. All samples were heat-treated to a final hardness of 470 HV1 (Vickers-hardness) and an ultimate tensile strength of 1440 MPa. The heat-treatment process is as follows: heating at 965 °C for 1 h, followed by air cooling, subsequent heating at 720 °C for 8 h, furnace cooling to 620 °C at a cooling speed of 50 °C/h, and finally heating at 620 °C for 8 h followed by air cooling.
The cutters and tools are shown in Figure 1. The cutter used in the milling test was an 8-mm-diameter end milling cutter with a physical vapor deposition (Ti, Al) N/TiN-coated carbide insert. The grinding wheel was an electroplated CBN wheel with a maximum diameter of 14 mm and a barrel radius of 3 mm, and the grit size was 200#. A self-developed polishing wheel with a maximum diameter of 40 mm and a barrel radius of 6 mm was used. The size of the polishing abrasive was 2000#. This type of flexible wheel consisted of a rubber matrix inside, diamond abrasives outside, and the connection layer between them. Hand-polishing was conducted on a table grinder using a 120-mm-diameter wool wheel and brown aluminum oxide polishing paste.
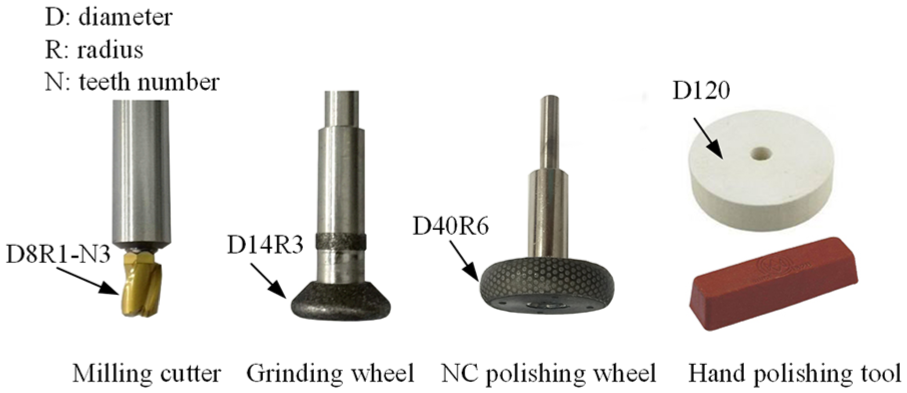
The milling cutter, grinding wheel, and polishing wheels used in this study.
Machining experiment and surface integrity measurement
The descriptions of all samples tested in this study are shown in Table 1. For surface integrity study, a rectangular sample of dimensions 80 mm × 40 mm × 15 mm was cut by wire-cut electrical discharge machining (WEDM). Six unique surface types were produced to explore the influence of machining combinations on the surface integrity of GH4169. The samples respectively are the sample milled in condition as shown in Table 2 (sample M), the sample milled and NC polished in parameters as shown in Table 3 (sample MP), the sample ground using conditions displayed in Table 4 (sample G), the sample ground and NC polished in condition as shown in Table 3 (sample GP), the sample milled and hand-polished (sample MH), and the sample ground and hand-polished (sample GH).
Lists of all samples investigated in this article.
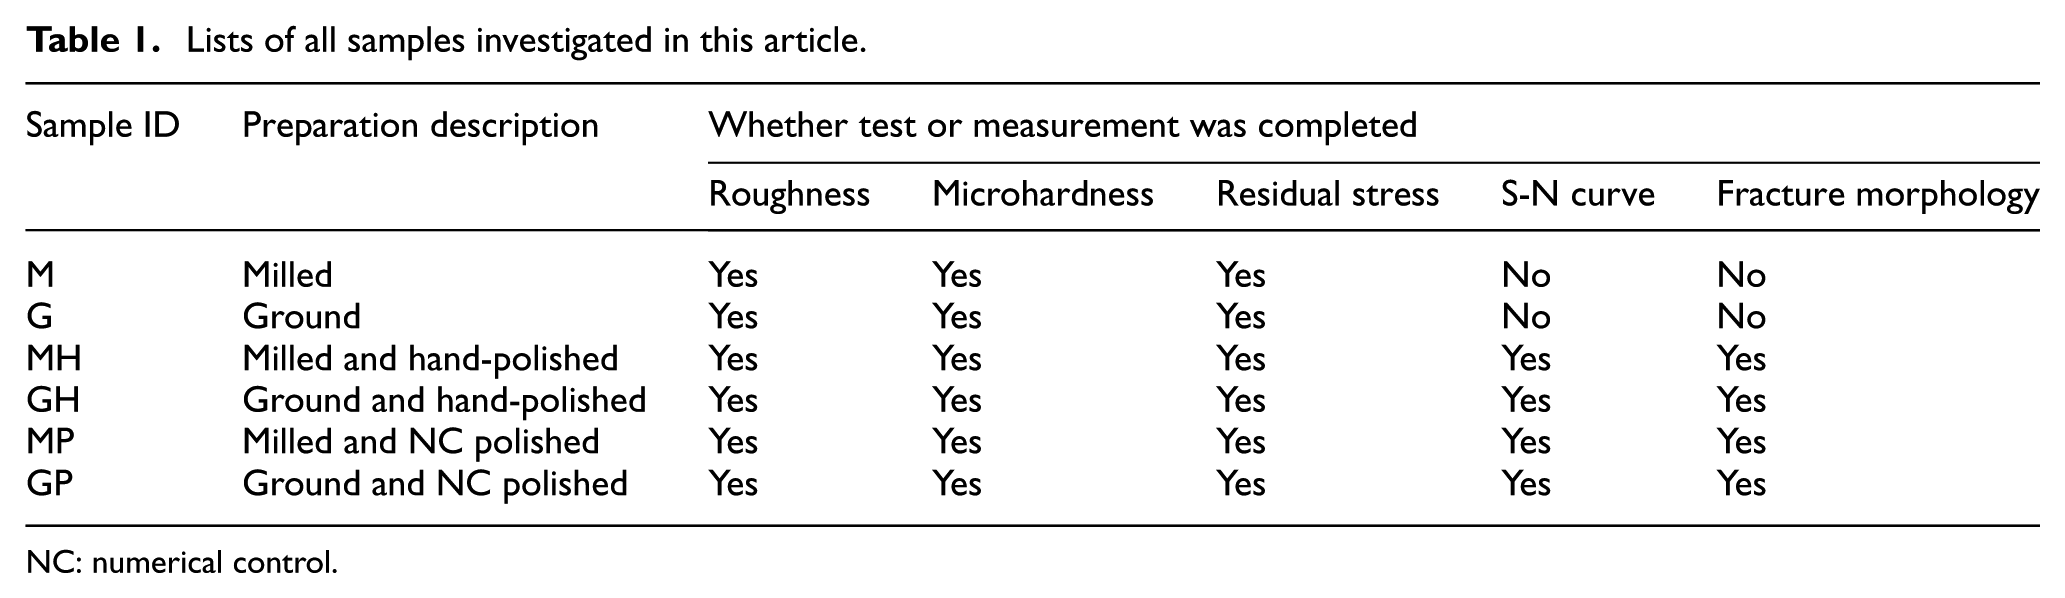
NC: numerical control.
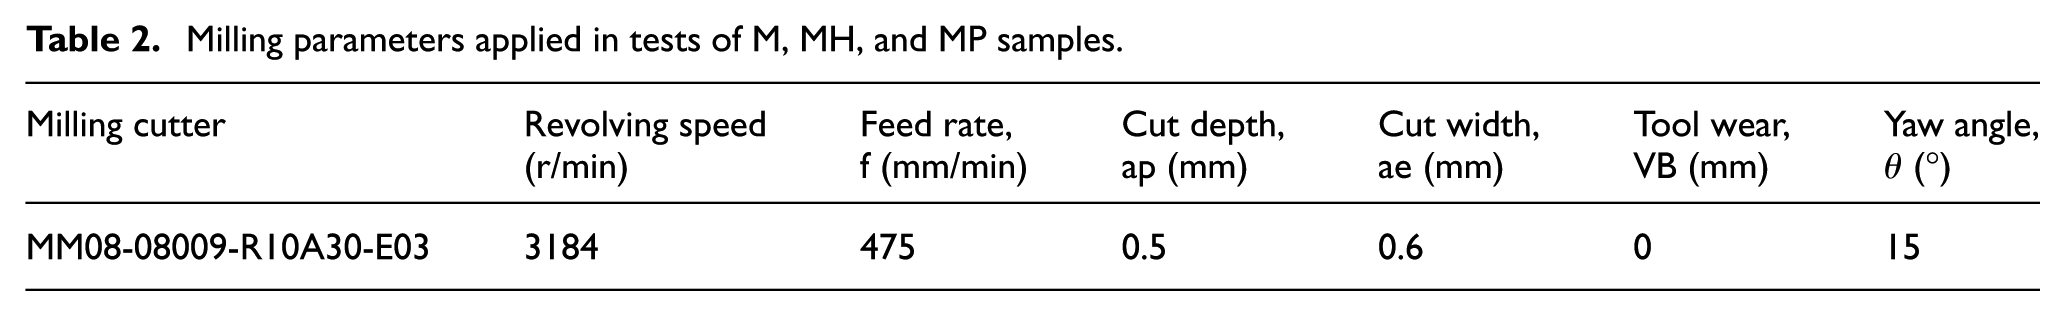
Milling parameters applied in tests of M, MH, and MP samples.
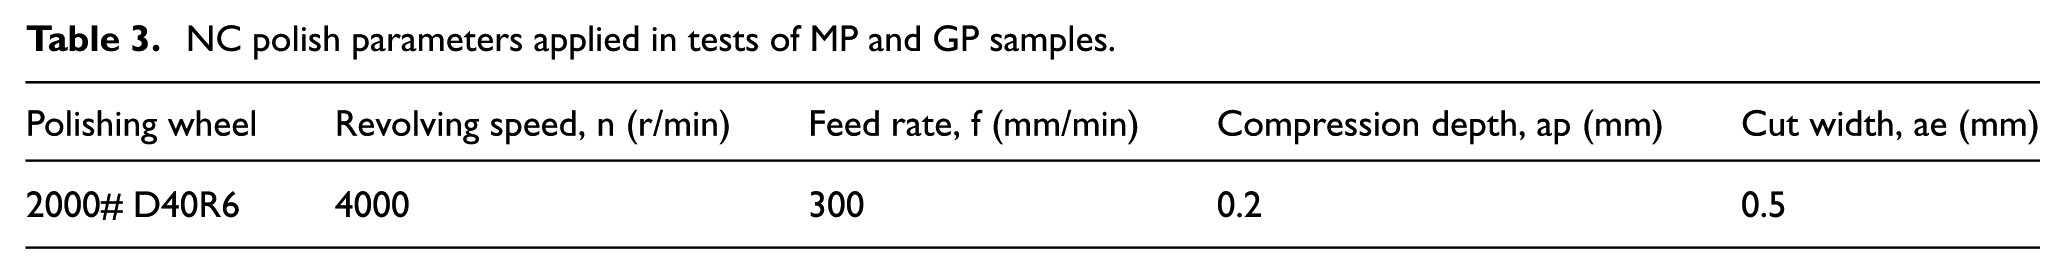
NC polish parameters applied in tests of MP and GP samples.
Grinding parameters applied in the study in tests of G, GH, and MP samples.
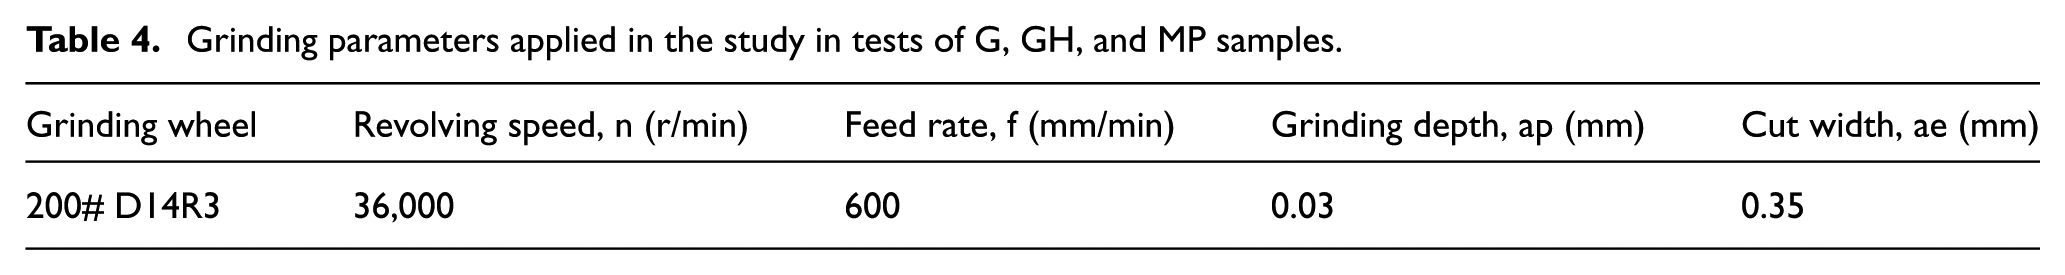
The schematic of the experimental set-up is shown in Figure 2. The selected milling parameter and cutter were consistent with the machining conditions of a real compressor blade (seeing Table 2). The hand-polishing was conducted by a practiced polishing worker from a blade factory to ensure the consistency of surface states of machining samples and real components. The spindle speed of the table grinder was 2400 r/min. The grinding and NC polishing parameters used in the study have been optimized on processing efficiency, satisfying the accuracy and roughness requirements of the blade. All the milling, grinding, and NC polishing experiments were performed on a QMK50A five-axis blade grinding machine.
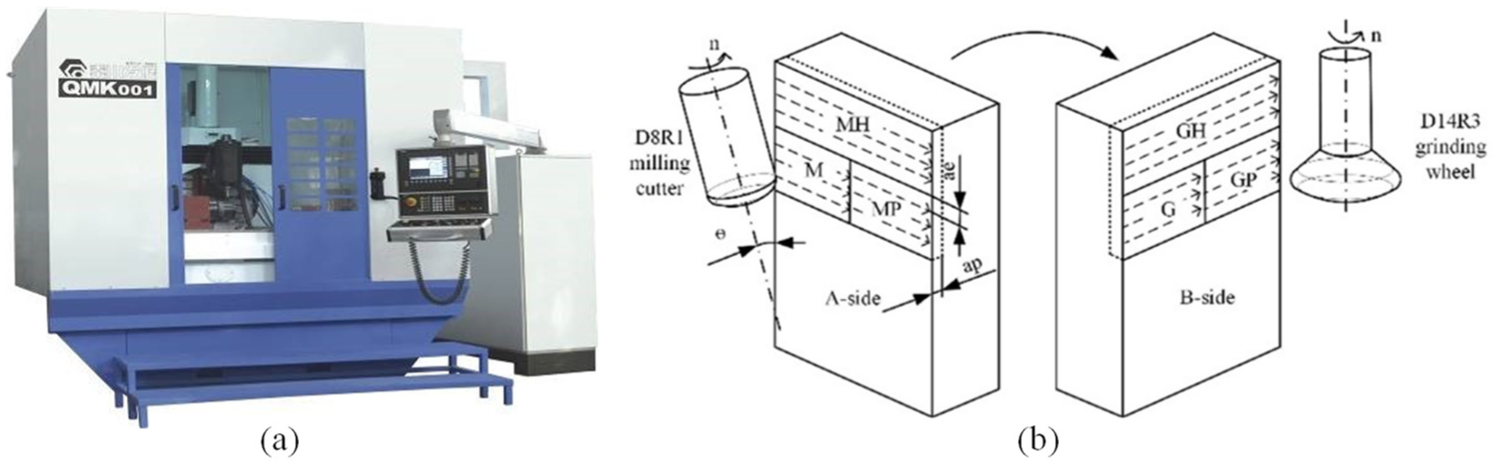
Experimental set-up for machining: (a) schematic of machining tests and (b) the QMK50A five-axis machine tools.
After the machining tests, surface integrity factors, including surface texture, surface roughness, residual stress, and microhardness, were characterized. The surface structure was characterized via an optical microscope, and the surface roughness along the step-over direction was measured via Taylor Hobson stylus (PGK 120 with 90° and 2 μm radius tip). The cutting off length was 0.8 mm, and the evaluation length was 4 mm. The surface residual stress was measured via the X-stress-3000 (AST, USA). An X-ray source with target material Mn-Kα X-rays was used. Successive layers of material were removed by electro-polishing to determine the in-depth residual stress profile. The microhardness was measured by HV1000 under a load of 9.8 N with the keeping time of 10 s.
Fatigue specimen and fatigue tests
In order to compare the fatigue properties of GH4169 components machined by different finishing processes, a smooth fatigue specimen (Kt = 1) was designed, as shown in Figure 3(a). Four series of fatigue test samples corresponding with sample MH, MP, GH, and GP were prepared. The schematics of different processes are shown in Figure 3. All the fatigue specimens were double-ended clamped and processed into a circumferential texture.
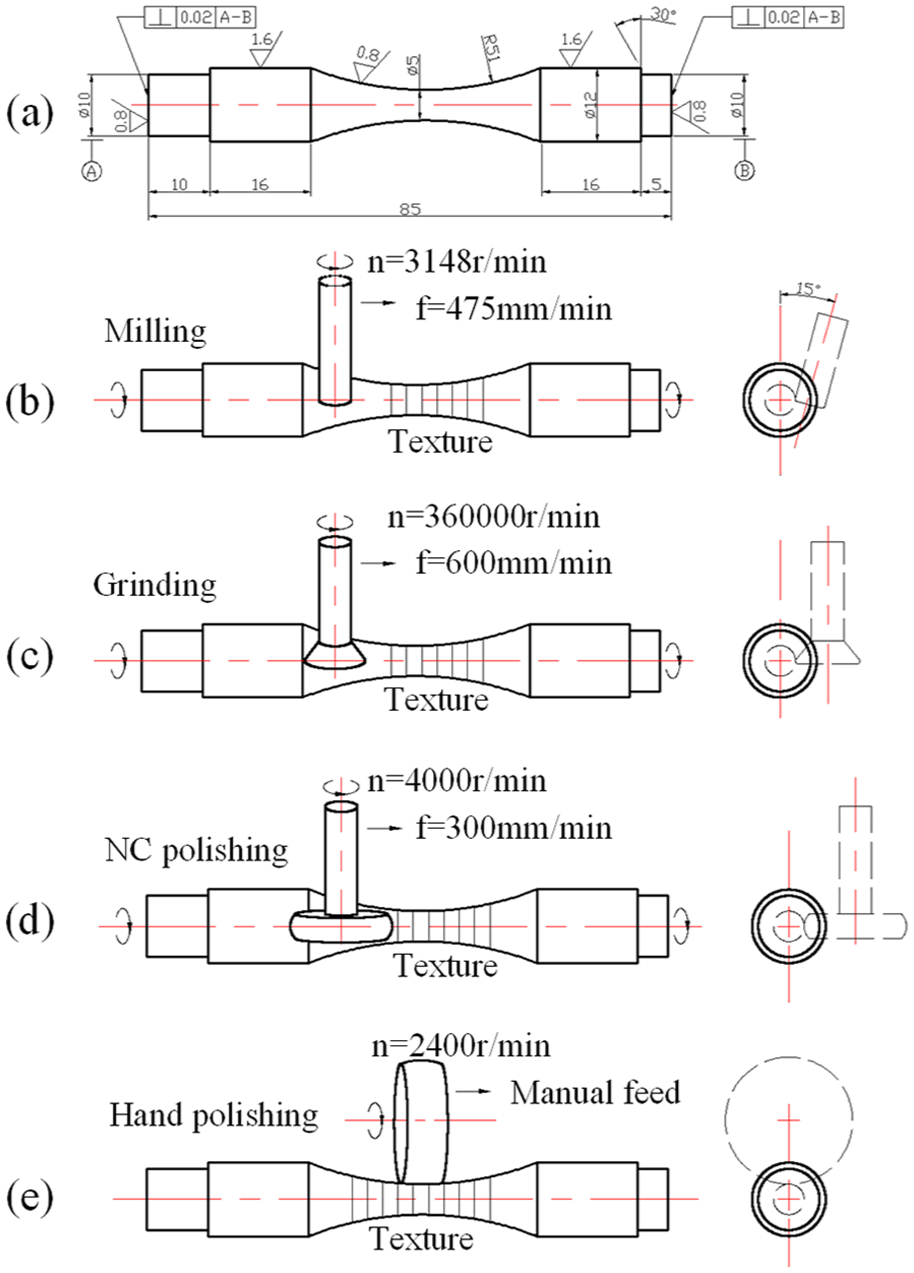
Schematics of fatigue specimen and fatigue sample preparation: (a) fatigue sample size, (b) milling set-up, (c) grinding set-up, (d) NC polishing set-up, and (e) hand-polishing set-up.
Room temperature fatigue tests were performed using a QBG-50 high-frequency tensile fatigue testing machine. A circle load was applied at a natural frequency of 100–104 Hz as a sinusoidal waveform. The cyclic stress ratio was 0.1. After the fatigue test, the microscopic analysis of the fatigue fracture was performed using a scanning electron microscope (SEM).
Results and discussions
Surface appearance and roughness
The optical micrograph of the machining tested surfaces is exhibited in Figure 4. The surface texture of the sample M agrees with the step width and feed engagement of the milling parameter. The grooves of sample G seem denser, deeper, and more random than sample M. After polishing, both milled and ground surfaces become smoother. Polishing has a decisive influence on the surface appearance of components. Besides, the hand-polished surface texture is remarkably similar to that of the NC polished surface. It means that the hand-polished and NC polished samples are equivalent in appearance.
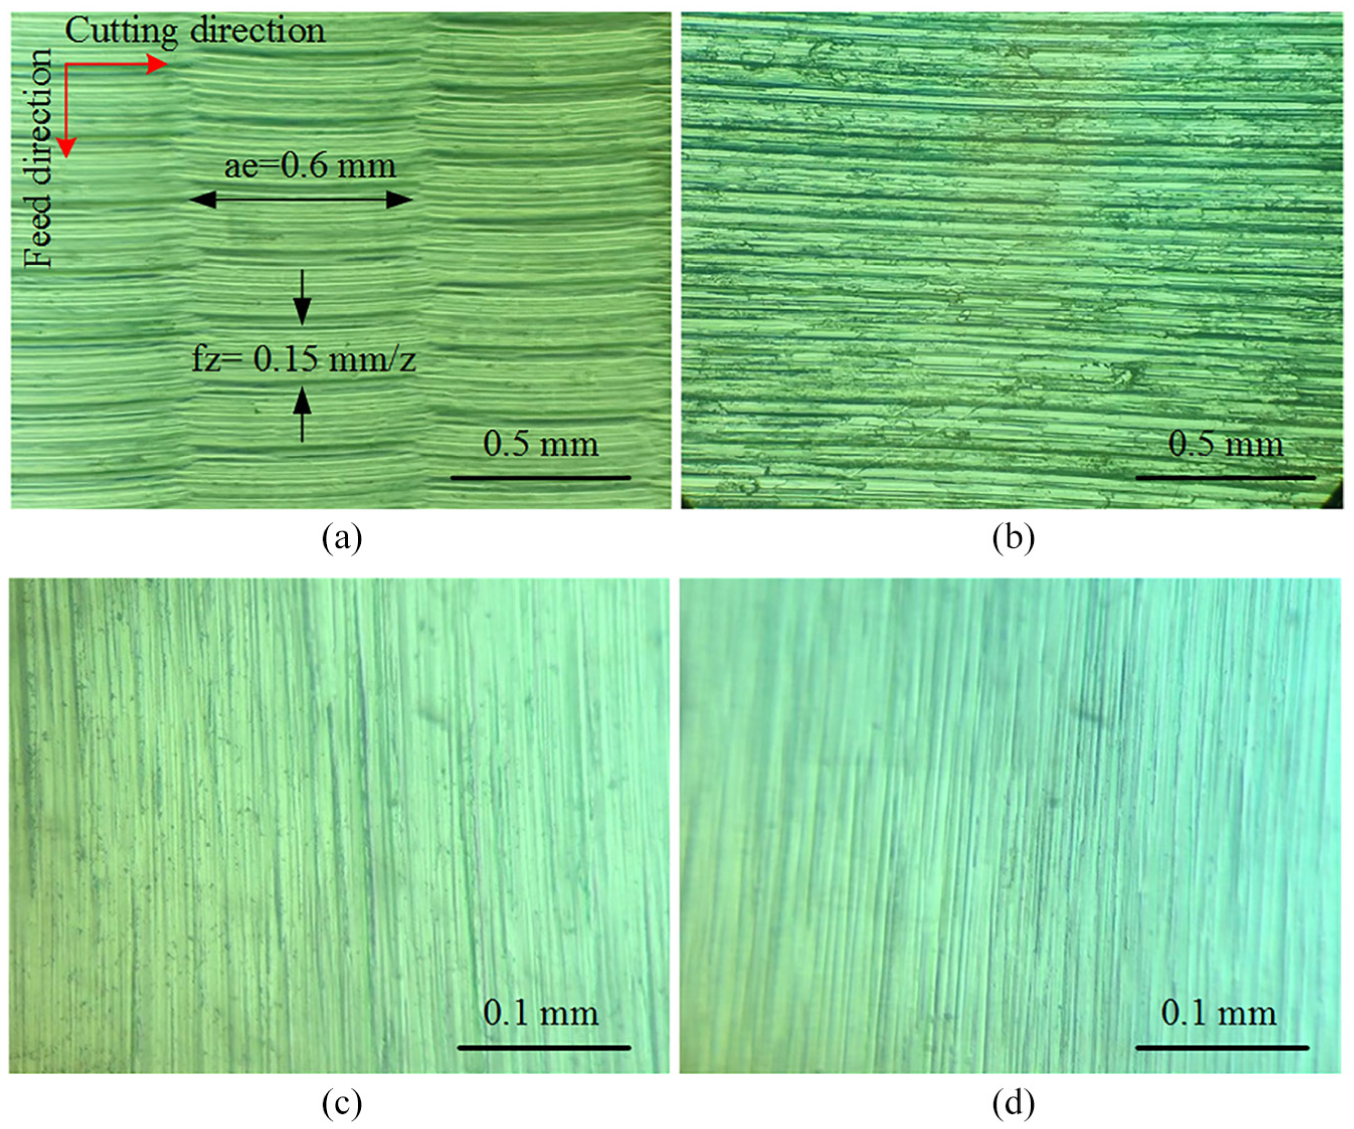
Optical microscope images of the surface appearance of fatigue samples: (a) sample M, (b) sample G, (c) sample MH/GH, and (d) sample MP/GP.
However, as shown in Figure 5, random defects such as omission, scratch, texture disorder, and knock marks inevitably occur in the hand-polishing of curved surfaces. The random degradations observed on both MH and GH surfaces will become potential crack origins in fatigue tests. Figure 5(a) and (b) shows typical surface images of fatigue cracking source areas.
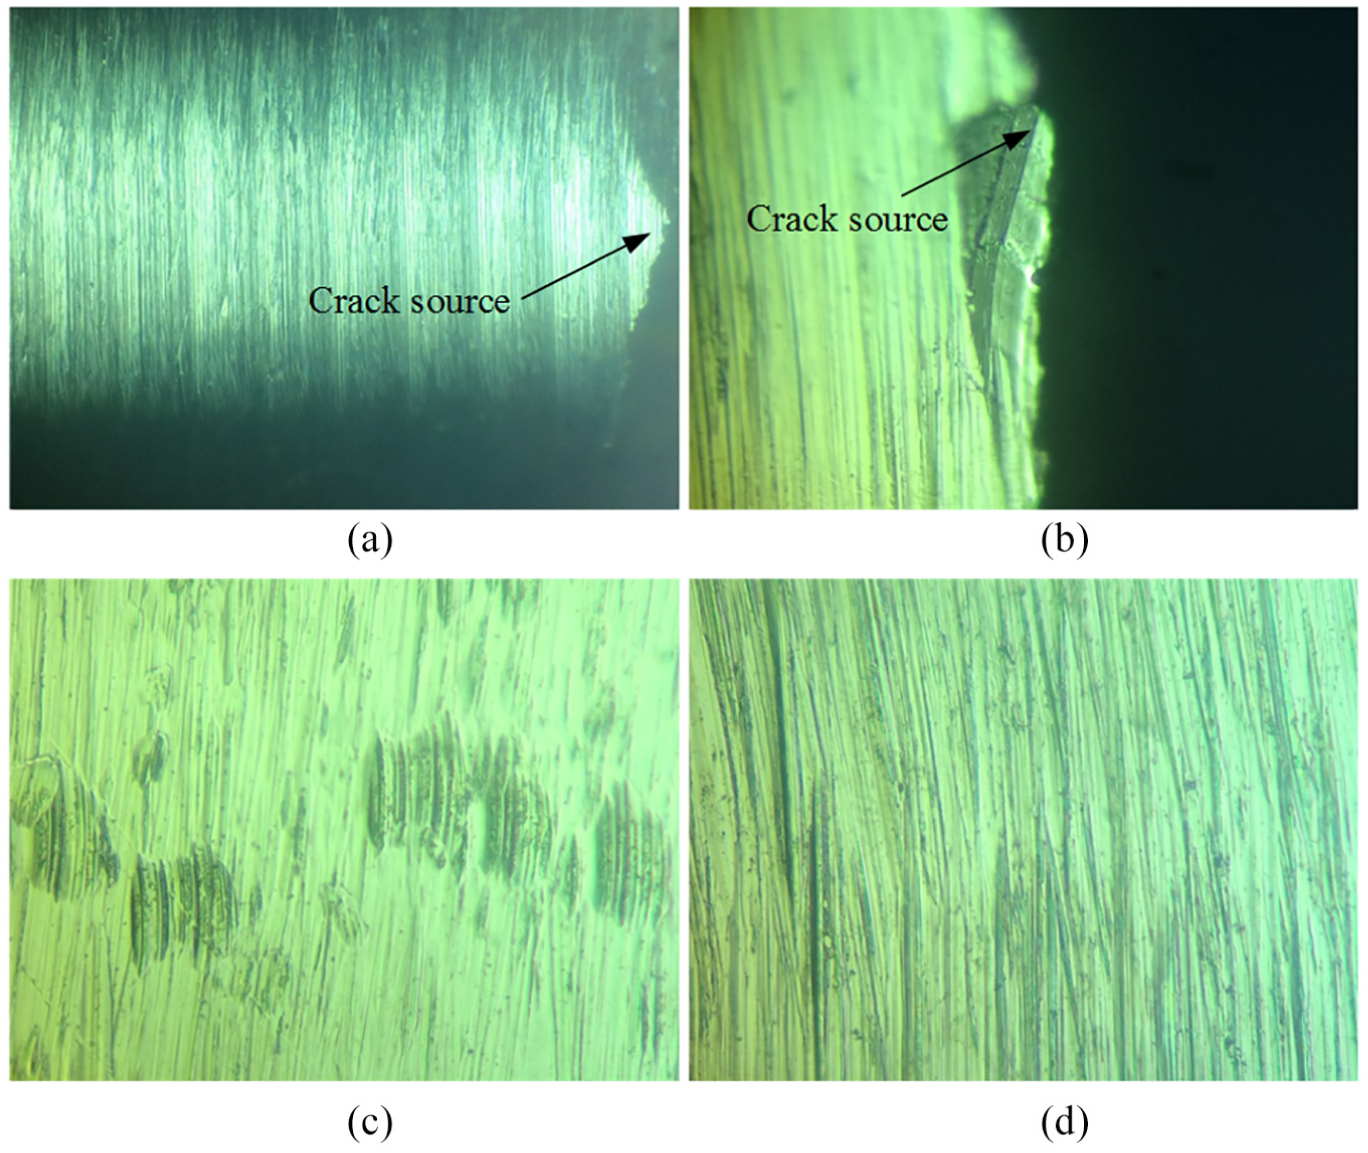
Random defects observed on the hand-polished surface: (a) omission, (b) scratch, (c) knocked mark, and (d) texture disorder.
The surface roughness data, including arithmetical mean deviation (Ra) and the 10-point height of irregularities (Rz) of the profile, are shown in Figure 6. Both Ra and Rz of sample G are higher than sample M. The high roughness of sample G agrees with its rougher texture in Figure 4. Hand-polishing reduces the roughness of milled samples from Ra 0.53 μm to Ra 0.17 μm and reduces the roughness of ground sample from Ra 0.88 μm to Ra 0.16 μm. NC polishing reduces both of them to Ra 0.18 μm. The roughness of NC polished surfaces is slightly higher than the hand-polished surfaces no matter what the previous process is. This result indicates that the hand-polished sample has an advantage in surface roughness. Similarly, the roughness of ground surfaces is slightly higher than the milled surfaces no matter what kind of polish is conducted later. It shows that the milled sample has an advantage in surface roughness. The rough surface of the ground sample is primarily attributed to the large grain size of 200# abrasive and the great grinding depth. Zeng et al. reported that grinding depth is the most critical parameter that determines the surface roughness of superalloy components. When the grinding depth increases from 0.005 to 0.04 mm, the surface roughness Ra sharply increases from 0.0284 to 0.896 μm. 17 Besides, the small radius of the grinding wheel and the untrimmed abrasives applied in this study reduce the number of active grains, which further results in a severe roughness.
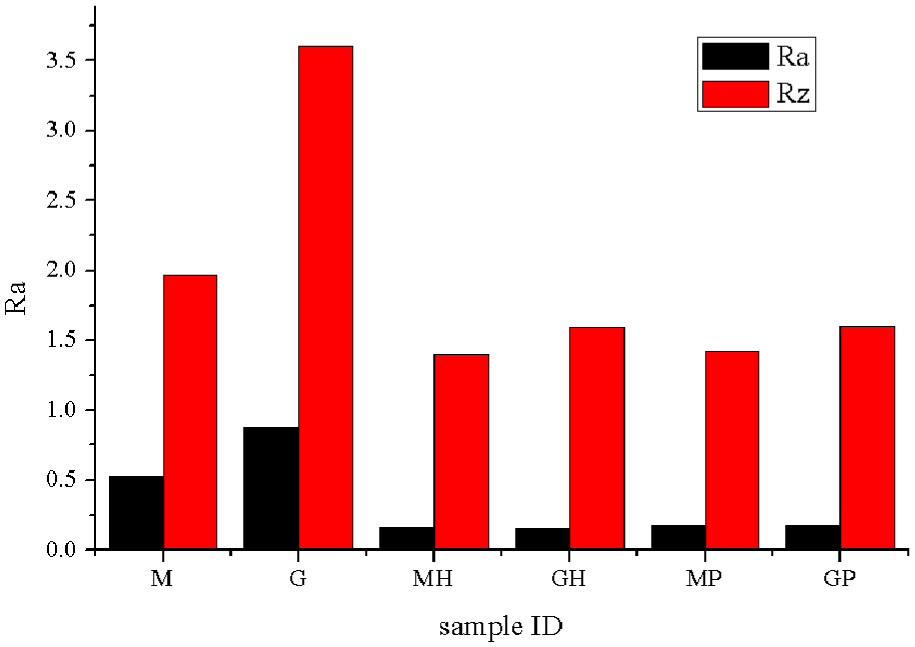
The influence of processing combinations on surface roughness Ra and Rz.
Surface and subsurface microhardness
The microhardness of the matrix material is determined to be 470 HV1. Figure 7 displays the microhardness profiles of the M/MP/MH group and G/GP/GH group, and several rules are as follows.
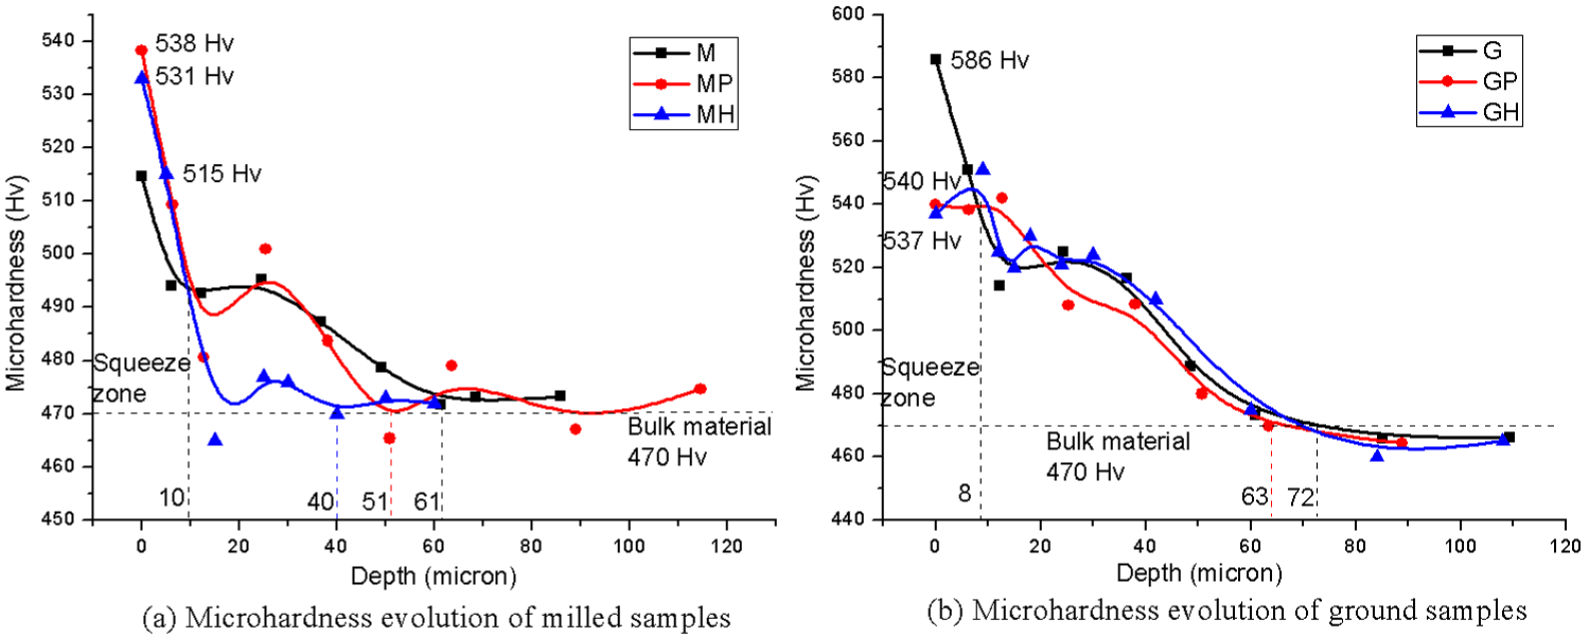
Microhardness profiles of samples of (a) M/MP/MH group and (b) G/GP/GH group.
The hardness of G is 586 HV1 at the surface and then decreases to bulk material hardness at a depth of 84 μm. The hardness of M is 515 HV1 at the surface and then decreases to bulk material hardness at a depth of 61 μm. The significant hardening effect of grinding is due to the typical negative rake angle of grinding abrasives and the high thermal conductivity of CBN abrasives. The cutting resistance is increasing in line with decreasing rake angle, and so is the plastic deformation and the work hardening of the workpiece. 18 Many researchers have verified the negative rake angle of grinding abrasives. 19 Thus, grinding can induce noticeable surface hardening. 20 Matsumoto et al. 21 reported that appropriate hardening is beneficial to restrain the initiation and propagation of fatigue crack. Thus, ground samples have advantages over milled samples in the surface hardening.
For the M/MP/MH group, as shown in Figure 7(a), both NC polishing and hand-polishing increase the surface hardness of the M sample but decrease its hardening depth. NC polishing increases the surface hardness from 515 HV1 to 538 HV1 and reduces the hardening depth by 10 μm. Hand-polishing increases the surface hardness to 531 HV1 and, reduces the hardening depth by 21 μm. The shift of hardness profile curves can be attributed to a “removal effect” of polishing. It shows that hand-polishing has a removal depth twice deeper than that of NC polishing. Another effect of polishing shown in Figure 7(a) is the “squeezing effect,” which causes the surface hardening in polishing. Figure 7(a) shows that the squeezing depths of MP and MH are both 10 μm. That NC polishing and the manual polishing have similar squeezing depths on milled samples.
For the G/GP/GH group, as plotted in Figure 7(b), both polishing methods reduce the surface hardness of ground samples from 586 HV1 to 540 HV1. As for the “removal effect” of polishing, the removal depth of GP is 9 μm, consistent with the removal depths of MP. However, the removal depth of GH is nearly zero. A possible reason for the instability removal is that hand-polishing process is manually controlled and visually judged. The polishing worker reflexively polishes the milled samples for a longer time because of the rougher waviness. A typical omission area shown in Figure 5(a) proves this point. Besides, Figure 7(b) infers that NC polishing and hand-polishing have similar squeezing effects on ground samples.
To sum up, the influencing mechanism of polishing on the microhardness profile is concluded in Figure 8. The polishing process plays two independent roles in microhardness. First, polishing leads to the removal of surface material, resulting in a reduction of hardening depth. The reduction of hardening depth is equal to removal depth in theory. Then, as a mechanical process, polishing causes a slight cutting force, resulting in a shallow hardening zone at the surface. If the polishing-induced surface hardness is beyond the inherent surface hardness, the polishing-induced hardness determines the final surface hardness (shown in Figure 7(a)). Otherwise, the origin surface hardness determines the final surface hardness (shown in Figure 7(b)). In this research, the squeezing depth of polishing is about 10 μm and the squeezing hardness is about 538 HV1.
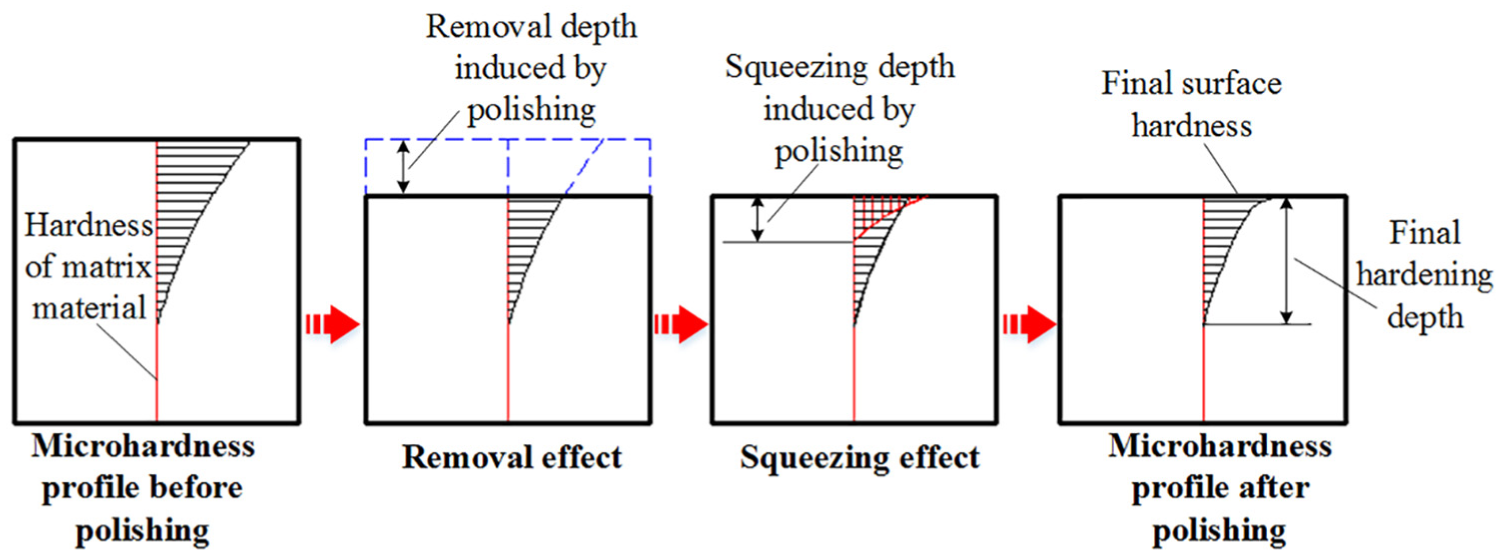
Schematics of the removal effect and the squeezing effect on the microhardness profile.
Surface and subsurface residual stress
In this study, the residual stress exhibits a higher magnitude in the feed direction than in cutting direction. Since the feed direction is in line with the loading direction of fatigue tests, the residual stress in the feed direction has a more considerable influence on the high-cycle fatigue life (HCFL). The residual stress curves in feed direction are plotted in Figure 9.
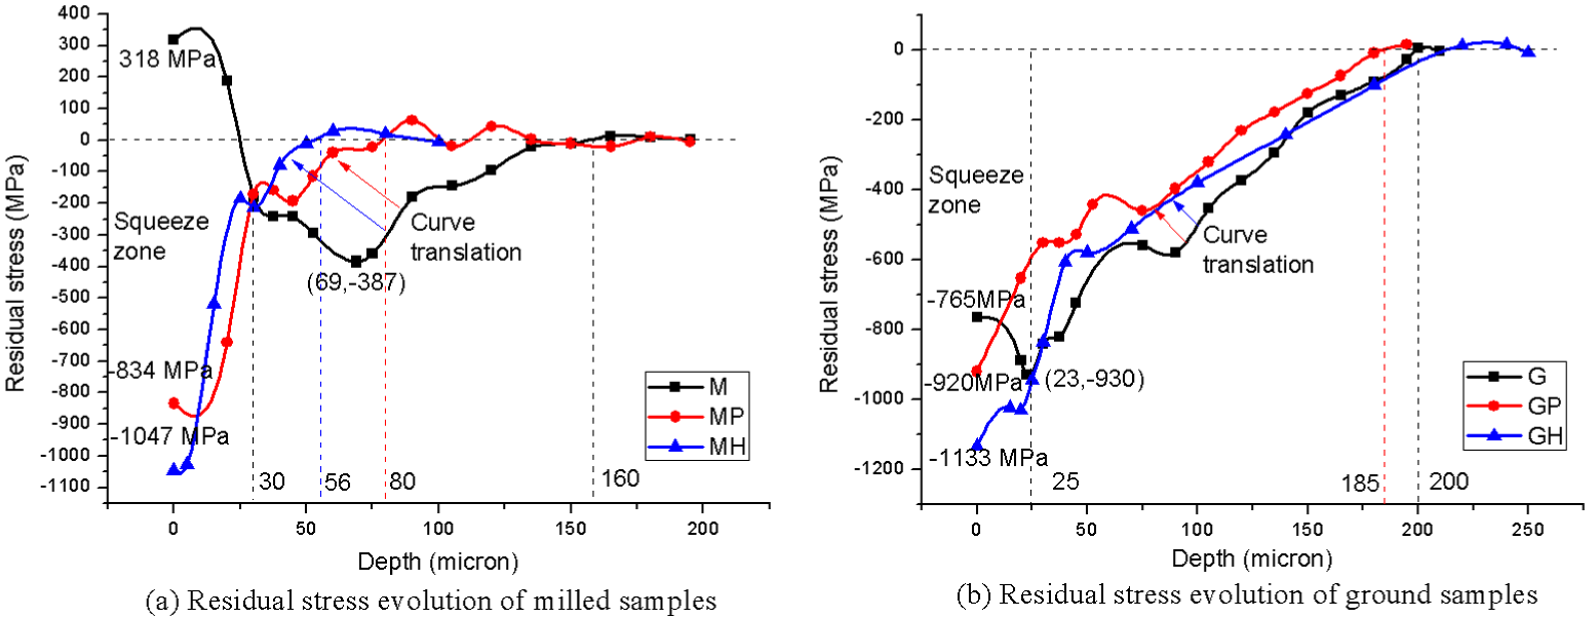
Residual stress profiles of samples of (a) M/MP/MH group and (b) G/GP/GH group.
The residual stress profile of Sample M is a typical “hook” shape profile with a significant tensile residual stress (318 MPa) at the surface. The tensile residual stress is widely reported as harmful to fatigue life.22,23 The residual stress profile of sample G is also a “hook” shape. Sample G has a significant compressive residual stress from the surface (–765 MPa) to a high depth of over 200 μm. The compressive residual stress has been widely proved as beneficial for fatigue endurance, as summarized by Schwach and Guo. 24 Just as the explanation of the deep hardening of sample G, the deep compressive residual stress of the ground sample is also a consequence of the typical negative rake angle and the high thermal conductivity of CBN abrasives. The rake angle of cutting tools has a critical influence on residual stress. 25 The cutter with a more effective negative rake angle and higher thermal conductivity generate more compressive residual stress. 26
For the M/MP/MH group, as shown in Figure 9(a), polishing completely removes the tensile stress of the sample M. The residual stress of sample MP is −834 MPa at the surface and monotonically decreases to 0 MPa at a depth of 80 μm. The residual stress of sample MH is −1047 MPa at the surface and decreases to 0 MPa at a depth of 56 μm. It means that both the squeezing effect and the removal effect of NC polishing are smaller than those of manual polishing. The depth reduction of residual stress area of MP and MH is 80 and 104 μm, respectively, much larger than the removal depths inferred from microhardness profiles (10 and 21 μm, respectively). This phenomenon can be explained as a result of the “stress release.” Residual stress is a result of misfits between different regions of the components. 27 When the misfit of the surface layer is removed, the profile of residual stress rebalances. For the same reason, the depths of squeezing zones of MP and MH are about 30 μm, much larger than the actual hardening depth of 10 μm.
For the G/GP/GH group, Figure 9(b) shows that NC polishing and hand-polishing increase the surface compressive stress of sample G to −920 and −1133 MPa, respectively. The depths of the squeezing zones of GP and GH are around 25 μm. The depth reduction of residual stress areas of GP and GH are 15 and 0 μm, respectively, consistent with the removal depths inferred from microhardness profiles in Figure 7(b). The mentioned “stress release” is not observed, because the slight release of compressive residual stress is balanced by the surface squeezing.
Figure 10 is a schematic of the removal effect and the squeezing effect of polishing on residual stress. First, polishing removes the surface material, resulting in a translation of the residual stress curves toward the surface. Because of the mentioned “stress release,” the curve translation depth is greater than the actual removal depth. Then, the polishing force has a squeezing effect on the surface, resulting in a considerable surface compressive residual stress (approximately −1100 MPa). We have to point out that we only give a qualitative explanation of the polishing effect. A detailed model is our next target.
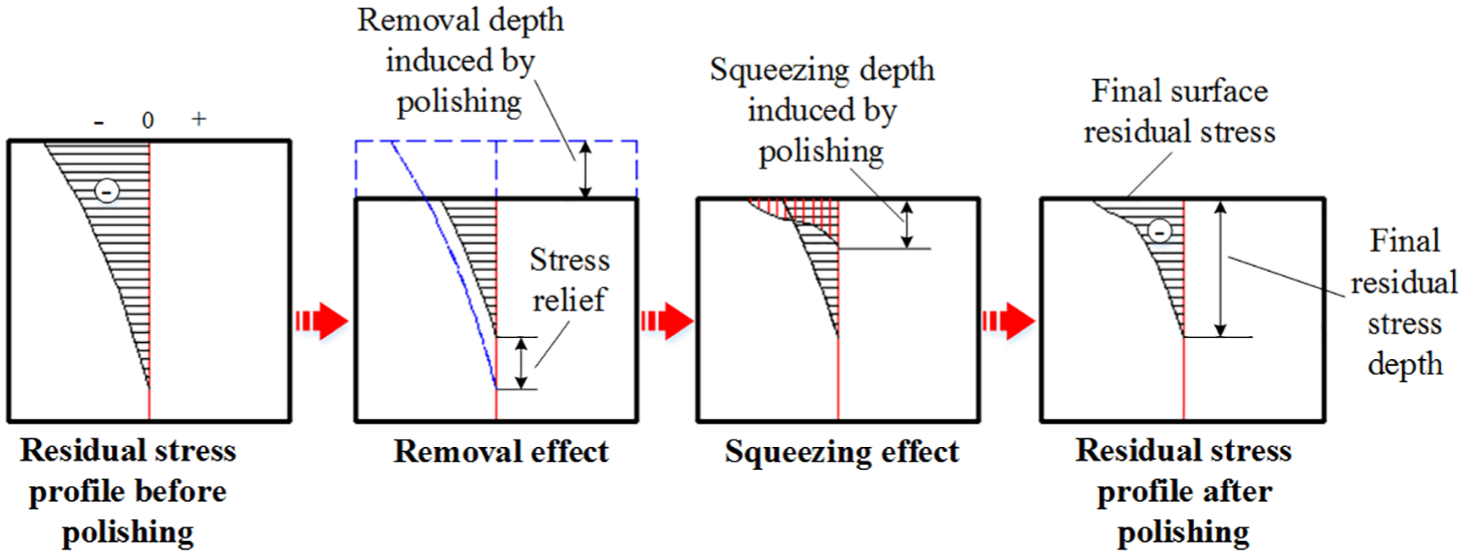
Schematics of the removal effect and the squeezing effect on the residual stress profile.
Analysis of S–N curves
The S–N curves are plotted in Figure 11. The high-cycle fatigue limits of sample MP and sample GP are 1140 and 1150 MPa, respectively. The fatigue limit of sample GH is approximately 1000 MPa, and that of sample MH is below 1000 MPa. Polishing is the most crucial factor that affects the HCFL of GH4169 components, while milling and grinding have little influence.
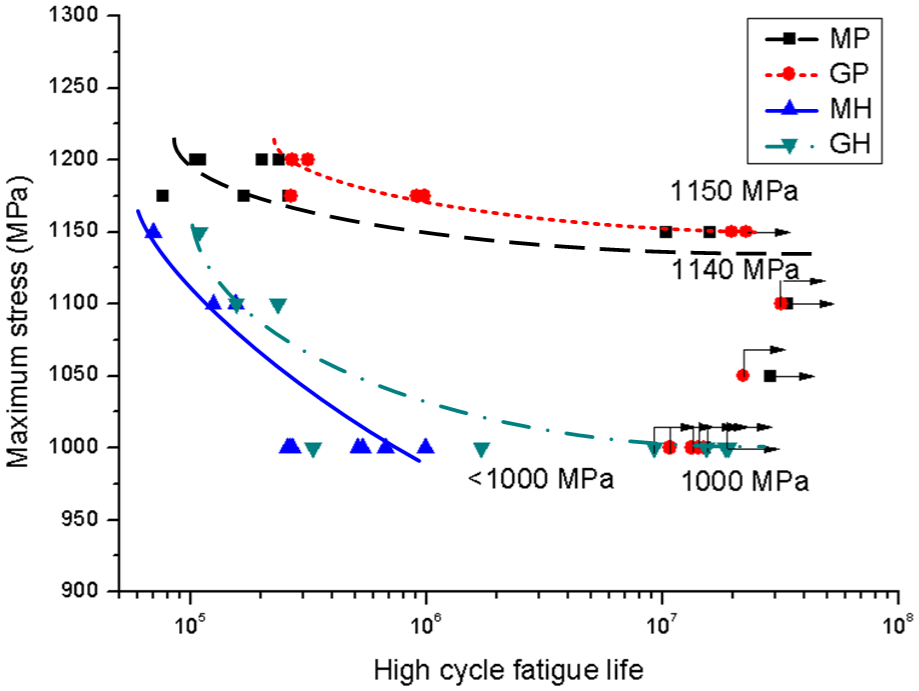
The S–N curves of samples MP, GP, MH, and GH.
NC polishing versus hand-polishing
The fatigue strength of NC polished samples exceeds that of the hand-polished samples by at least 150 MPa (15%). The dispersions of the fatigue life of MP and GP samples are considerably lower than those of hand-polished samples. Since the MP (or GP) and MH (or GH) samples are nearly equivalent in surface integrity characteristics, the possible interpretation of their different fatigue behaviors is the instability of the hand-polishing. This result has been confirmed by the random defects shown in Figure 5. The same conclusion is reported by Klocke et al. He revealed that process stability is the more critical factor that determines the fatigue life as opposed to the average surface roughness. 28 Novovic et al. 13 also found that the influence of non-uniform surface defects on the fatigue life is much more significant than that of the surface integrity indexes.
Milling versus grinding
The fatigue strength of GP and GH samples are slightly higher than that of the MP and MH samples, respectively. It indicates that ground and polished samples have slight advantages over milled and polished samples. Although surface roughness and surface residual stress are determined by the final polishing, the residual stress and hardness of the subsurface layer are controlled by grinding and milling. The slight superiority of the ground samples is potentially due to its more compressive residual stress. 22
Analysis of fracture specimens
Some of the fracture pictures are listed in Figure 12. The fatigue fractures of all groups show similar morphology. Every fracture is divided into three regions by various colors and roughness: the fatigue crack source region (region 1), the crack propagation region (region 2), and the collapse fracture region (region 3). The crack propagation region is further divided into a steady propagation region (region 2-a) and a rapid propagation region (region 2-b). Most fracture morphologies have single crack sources, while double crack sources exist in sample MH (shown in Figure 12(b) and (c)). It is a result of the instability of manual polishing. When more human errors are introduced, the crack initiation density increases. Figure 12(i) shows a sample where the fatigue crack initiates from the internal material, indicating the existence of material defects. This sample has been excluded from the S–N curves.
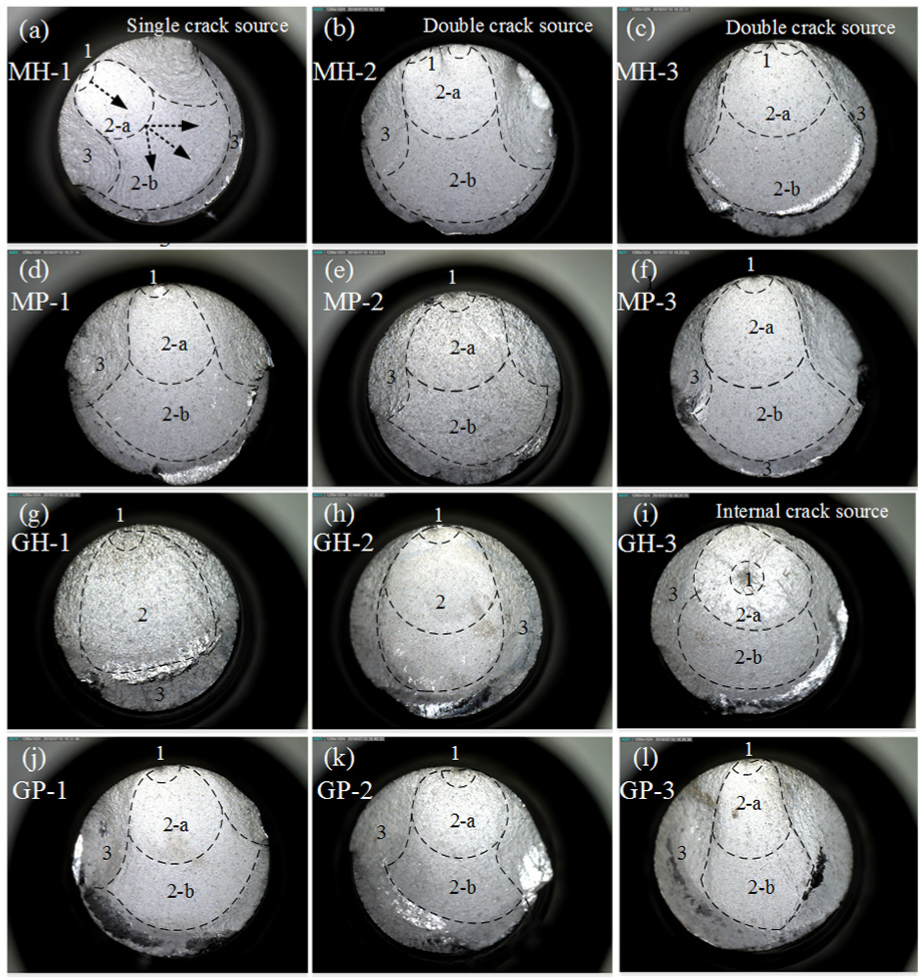
Fracture morphology of failure specimens: (a) MH-1, (b) MH-2, (c) MH-3, (d) MP-1, (e) MP-2, (f) MP-3, (g) GH-1, (h) GH-2, (i) GH-3, (j) GP-1, (k) GP-2, and (l) GP-3.
A typical fatigue failure process is shown in Figure 12(a). First, the main crack starts in region 1. Then, the crack expands to the center of the specimen with a small divergence angle, not along the surface (region 2-a). When the crack reaches the center of the section, it turns to expand around with a large divergence angle (region 2-b). The final break region (region 3) is the surface ring of the sample. This result is different from some reported GH4169 fracture images. 29 Wang et al. 30 reported a similar phenomenon named “crack goes around,” indicating the surface strengthen of components.
Discussion of efficiency and cost
In order to evaluate the efficiency and cost of different processes, machining tests were conducted on a real compressor blade component. Table 5 lists the processing time, the specific cost items, the profile accuracy, and the fatigue strength. The important evaluation indexes are highlighted in bold letters. The service life of the machine tool is assumed as 10 years (28,800 working hours). All the processes meet accuracy requirements.
The efficiency, cost, and quality of different processes on production condition.
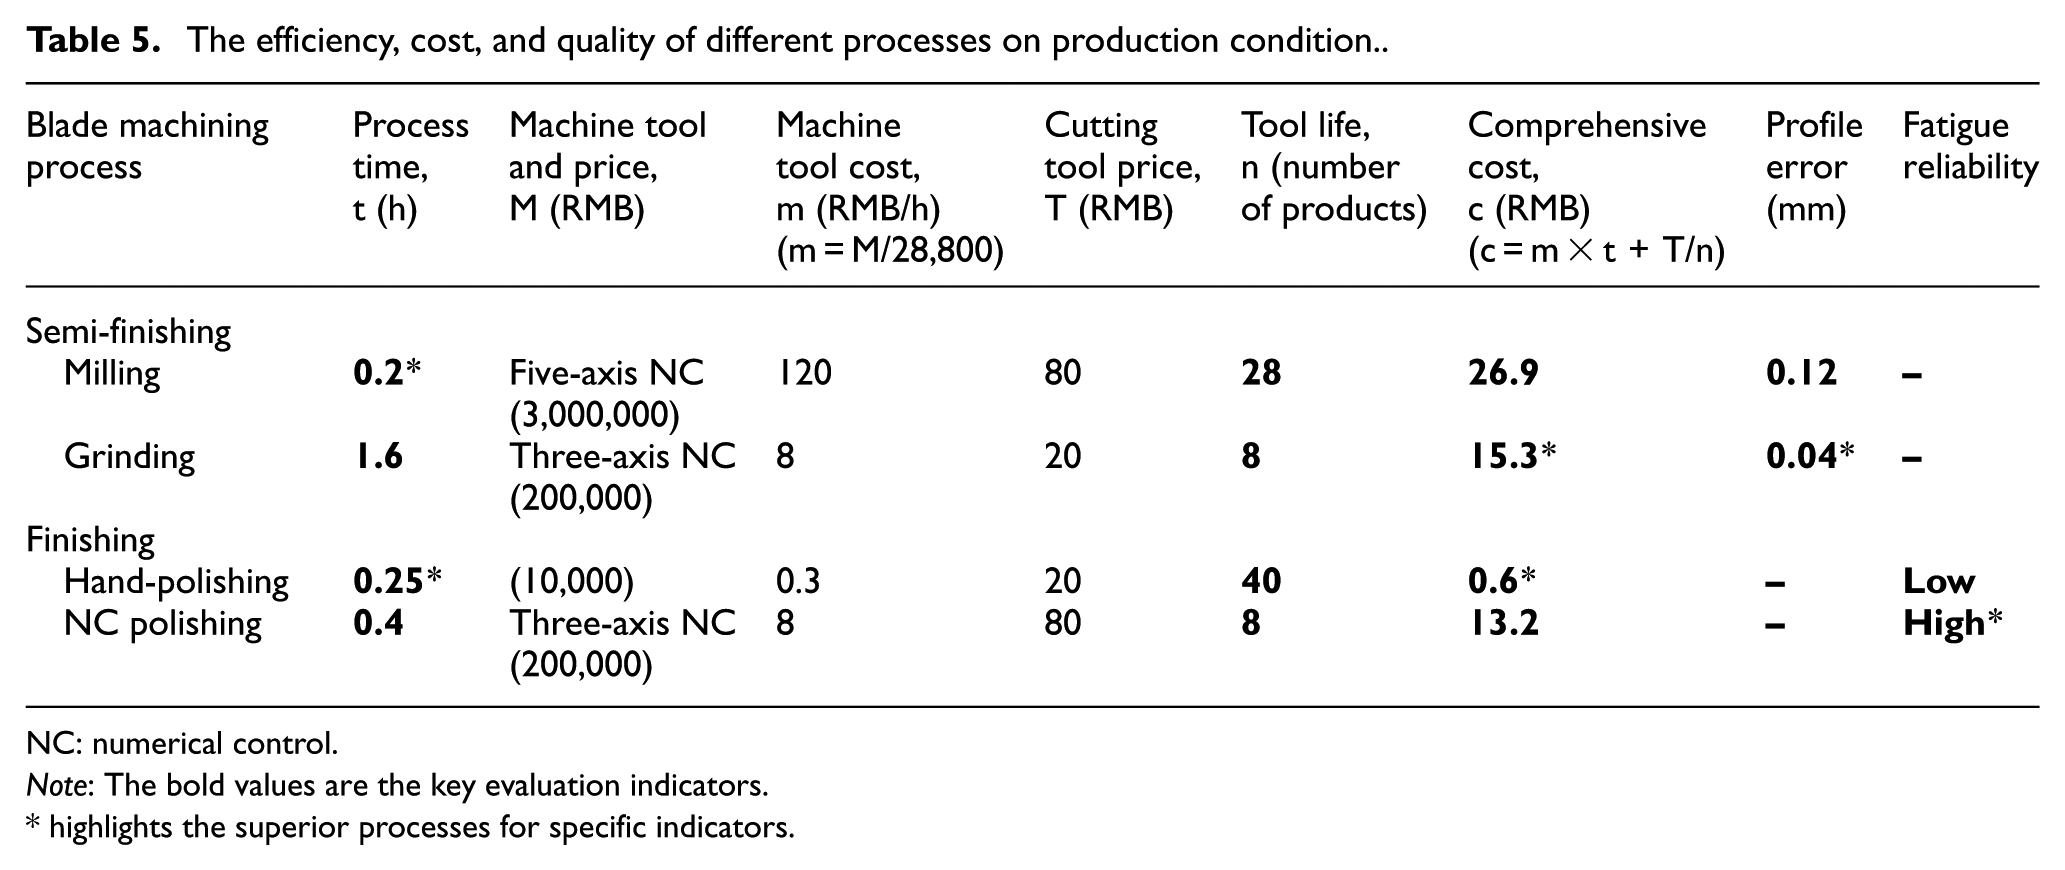
NC: numerical control.
Note: The bold values are the key evaluation indicators.
highlights the superior processes for specific indicators.
The data indicate that different processes have their advantages from different aspects. The milling efficiency is eightfold than the grinding efficiency. However, milling requires expensive five-axis NC machine tools, which generate a high comprehensive processing cost, approximately double the grinding cost. Besides, the profile error of the ground blade is only one-third of that of the milled blade. High precision is of great value for the manufacturing of high-performance turbine engines. Thus, CBN grinding is beneficial when producing high precision parts in a small amount.
Polishing has little influence on profile precision. The efficiency of hand-polishing is nearly double the efficiency of NC polishing. In addition, when polishing the same blade, the hand-polishing only costs 4% of the NC polishing. Although the hand-polishing has an overwhelming advantage in efficiency and cost, its fatigue reliability is unacceptable. Thus, NC polishing is an inevitable trend in the aviation manufacturing industry.
Conclusion
The focus of this study is to study the effects of process combinations of milling, grinding, and polishing on the surface integrity and fatigue life of GH4169 components. The HCFL of four different surface types was tested, and the surface integrity before and after hand-polishing and NC polishing was compared. The major findings are as follows:
Polishing is the crucial factor of HCFL of GH4169 components. The fatigue strength of NC polished sample is higher than that of the hand-polished sample by at least 150 MPa (15%).
CBN grinding induces a considerable compressive residual stress profile with a magnitude of -930 MPa and in a depth of 200 μm. Milling induces a typical “hook” residual stress profile with 318 MPa at the surface. Polishing shows two effects on machined surface, removal effect and squeezing effect. The squeezing effect induces a shallow compressive residual stress with approximately −1000 MPa, therefore improves the surface condition.
The hand-polished surface is equivalent to the NC polished surface in terms of surface integrity. However, inevitable omissions, scratches, texture disorders, and knock marks in hand-polishing are the leading causes of the unstable HCFL of hand-polished components.
Footnotes
Declaration of conflicting interests
The author(s) declared no potential conflicts of interest with respect to the research, authorship, and/or publication of this article.
Funding
The author(s) disclosed receipt of the following financial support for the research, authorship, and/or publication of this article: This study was financially supported by the National Science and Technology Major Project of the Ministry of Science and Technology of China (grant no. 2015ZX04001201).