
Abstract
The micro-topographic quality of a product’s surface directly affects the performance of the virtual assembly. The computational precision of the fractal dimension has a significant effect on the accuracy of the virtual assembly model. To address the imprecision and large deviation of the calculation method under some conditions, a virtual product assembly surface modeling method is proposed in this article based on the root mean square of the area residuals. First, the fractal dimension of the surface is calculated using the regional residual root mean square (3R method). The feasibility of the 3R method is verified by comparing with the existing methods on isotropic and anisotropic surfaces. Second, the fractal dimension of a real part surface is obtained using the 3R method. According to the Weierstrass–Mandelbrot function, a partial surface model of the machined part is established. The surface contours, roughness, waviness, and flatness of the part are extracted by wavelet transform. Then, the digital surface model for virtual assembly with the same profile parameters is generated by reconstructing the surface contours of the actual parts. Finally, the method proposed by taking the virtual assembly of a VTM200/F5 turn-milling composite machining center guideway is verified in this article.
Keywords
Introduction
The virtual prototyping technology uses the advantages of a virtual environment in visualization and interactive exploration of virtual objects functionality to realize virtual assembly and analyze assembly performance. Its very important to verify the assembly properties and predict the assembly accuracy by constructing a micro-topography of the part in virtual assembly. Early research on surface modeling of virtual prototype models focused on semantic modeling.1,2 Digital modeling technology has been used widely in recent years. 3 The existing digital simulation methods based on fractal theory mainly involve the modeling of fractal functions,4–6 the calculation method of fractal dimension,7,8 the extraction of surface parameters, and so on.9,10
In the area of fractal modeling, the Weierstrass–Mandelbrot function (W-M function) is one of the most commonly used models. The W-M function was initially used to characterize fractal curves. 11 To facilitate its application, Ausloos and Berman 11 introduced the W-M function into a three-dimensional (3-D) rectangular coordinate system. Since then, many scholars have done a lot of research and applied it to engineering. Qiu et al. proposed a surface topography modeling method based on a multiscale altitude field. The normalized fractal function is used to simulate the surface microstructure of parts. 12 Liao et al. 13 proposed a method to determine the contact stiffness and contact force of a shrink-fit tool-holder joint based on Hertz contact and fractal geometry theory. Ma et al. 14 characterized the rough surface by W-M fractal function to study the thermal contact conductance in vacuum environment.
In researching the calculation methods of surface fractal dimension, various traditional methods have been proposed such as the differential box counting (DBC) method,15,16 the triangle prism area method (TPSA),17,18 and the variation method (VM).19,20 With the efforts of many scholars, many other methods have been derived from traditional methods, which can be divided into two-dimensional (2-D) and 3-D areas. Liu et al.
21
proposed a two-stage method based on the power spectrum method and structural function method to improve the precision of a 2-D fractal dimension calculation. Zuo et al.
22
proposed a 2-D root mean square (RMS) method to estimate the fractal dimension, and studied the relationships between surface roughness, fractal dimension and material hardness, elongation, spindle speed, and feed rate, respectively. As for the 3-D problems, Zuo et al.
23
proposed a 3D RMS method to calculate the dimensions of machined surfaces. Jing et al.
24
proposed the perimeter-volume method which combined the virtues of the DBC method and the Peleg blanket method to calculate the dimensions of
Once the modeling is complete, the surface parameters need to be extracted to verify the correctness of the model. Wavelet analysis is an efficient tool for extracting the surface parameters. The height information of the part is taken as the input signal, and the surface parameters can be taken as the output. Moktadir and Sato 25 used wavelet transform to characterize the surface roughness of anisotropically etched silicon. Wang et al. 26 introduced a wavelet packet transform for surface roughness characterization and surface texture extraction. Tangjitsitcharoen et al. 27 proposed a method to predict the surface roughness during the ball-end milling process by utilizing the wavelet transform to monitor and decompose the dynamic cutting forces. Pang et al. 28 put forward an extraction and reconstruction method for arbitrary 2-D and 3-D frequency features in precision machined surfaces based on the combination of power spectrum density and continuous wavelet transform to analyze the potassium dihydrogen phosphate crystal surface topography.
The research described above has made progress in fractal theory and surface parameter extraction which has been applied to practical engineering problems like surface modeling of machined parts and material wear. Semantic modeling and digital simulation are common methods of virtual assembly modeling. In semantic modeling, assembly semantics focuses on macroscopic assembly properties by describing the constraint relationships between parts by assembly semanteme. In digital simulation, the 2-D method can only describe the surface of turning parts, and its applicability is relatively poor. In some cases, the 3-D calculation method has unstable calculation accuracy and large deviation. To this end, a product modeling method for virtual assembly based on the RMS of regional residuals (3R method) is proposed in this article.
First, according to the actual surface information, the fractal dimension is solved by using the 3R method proposed in this article. The W-M fractal surface is constructed according to the obtained fractal dimensions, and the real parts are simulated with the digital model. Second, wavelet transform is used to extract the contour components, including roughness, waviness, and flatness contour and the reconstructed components are then synthesized. A surface model with the same profile parameters as the actual part is obtained. Finally, the method is verified in a virtual assembly using the VTM-200/F5 turn-milling composite machining center.
The rest of the article is arranged as follows. The second section is an overview of the proposed approach. The details of the method are explained in section “Calculation of Fractal Dimension by the area residuals method.” In section “Case study,” an experiment that involves slide in a computer numerical control (CNC) tool is conducted. The final section presents the conclusions.
Overview of approach
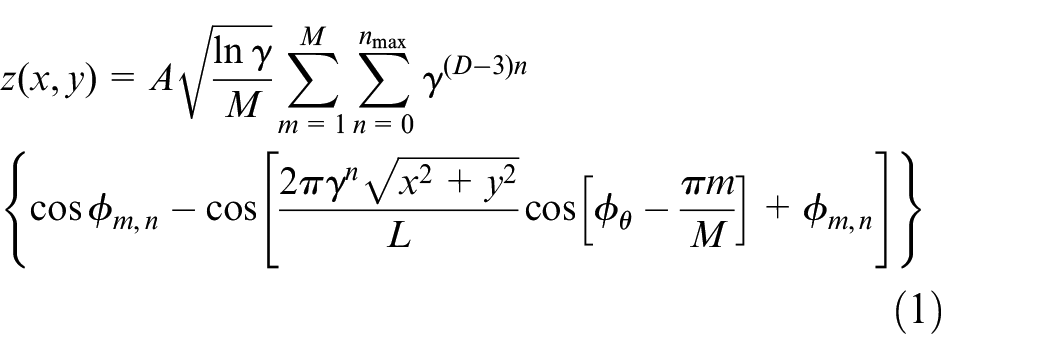
Its necessary to present a brief introduction of the W-M function. Ausloos and Berman 11 derived the W-M function in Cartesian coordinates expressed as in equation (1)
where
This article presents a method for modeling part surfaces for virtual assembly. The main ideas are as follows: calculating the fractal dimension
Fractal dimension
The
According to the different “wavelength” of each surface component, wavelet transform is used to separate each contour component. The surface of each component is reconstructed and integrated according to the design parameters. By this method, a surface model with the same contour parameters as the actual part surface is obtained.
Calculation of fractal dimension by the area residuals method
Surface modeling based on fractal theory
The W-M fractal function can be applied to the microsurface of the machined part of the simulator. Researches show that the W-M function can simulate the isotropic surfaces like electrical discharge machining (EDM), grinding, and the polishing parts, and the anisotropic surface like turning and milling parts. 23 However, it still has some shortcomings and limitations. For surfaces with larger dimensions and tolerances, the W-M function may appear to be a large amount of data, time-consuming, and error-prone. For the surface with too small precision, it is also easy to cause the relative error to be too big and not cost-effective. Most of these surfaces belong to simple geometric surfaces, and it is rarely used on freeform surfaces. That is why the W-M function was chosen as the basis of the modeling method in this article.
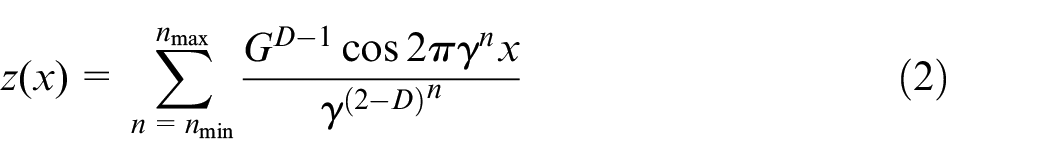
The W-M function is commonly used in the field of surface roughness modeling and satisfies the self-similarity of fractal geometry on the statistical level. The curve of the function is continuous but non-differentiable at any point. The 2-D W-M function can be expressed as 11
where
To apply the W-M function to a 3-D field, Ausloos and Berman
11
introduced binary parameters
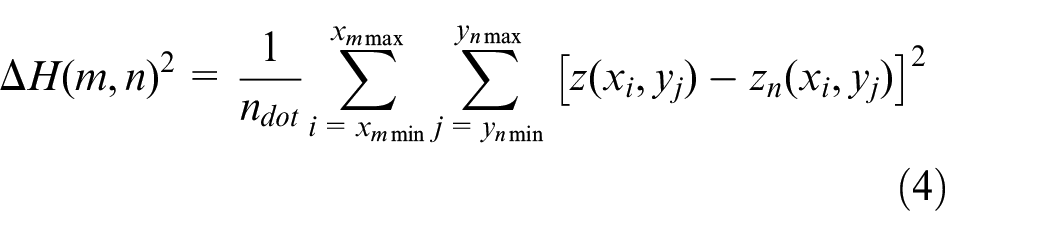
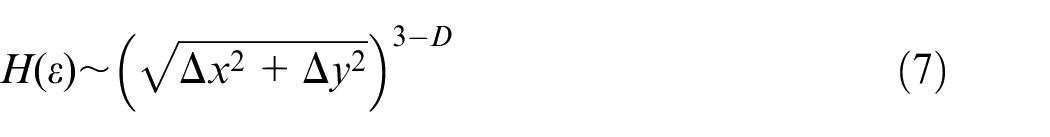
Fractal dimension calculation method based on the RMS of regional residuals
The unique advantage of the W-M function in describing geometric error modeling of part surfaces has been proved in a large number of studies. Different computing methods lead to different results of fractal dimension in practical applications. Therefore, the accuracy of the fractal dimension is very important to the final model.
There are two strategies for calculating the fractal dimension according to the different characteristics of the 3-D fractal surface. The first strategy is dimension reduction. Based on Mandelbrots study,
7
the relationship between the 2-D dimension
Take a grid of the surface area as an example to illustrate the detailed calculation method. Suppose the projection range of the sample point cloud in the
where
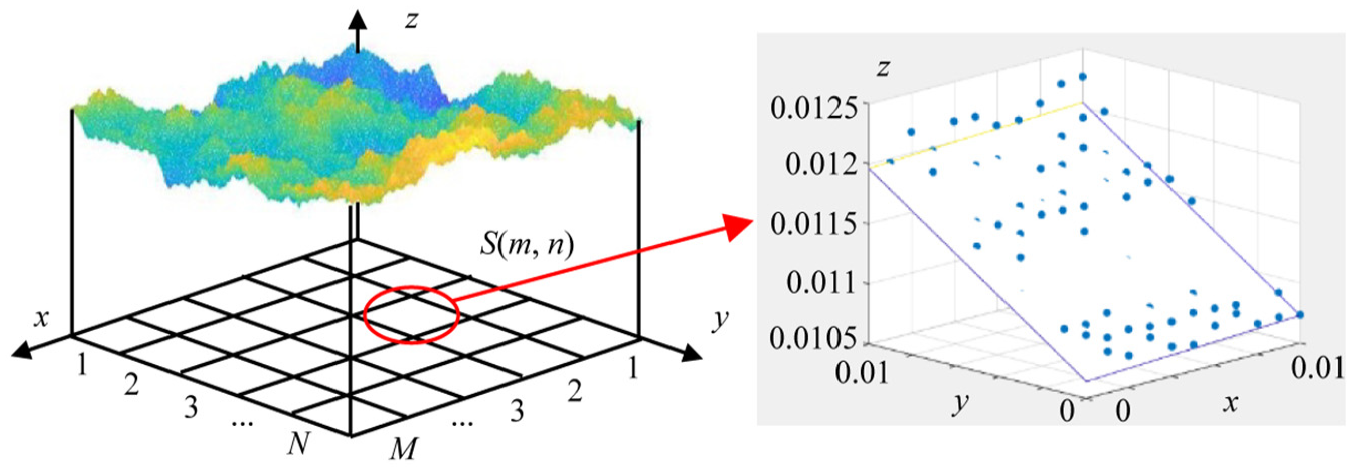
Division of the calculation region.
By fitting the minimum mean square plane
where
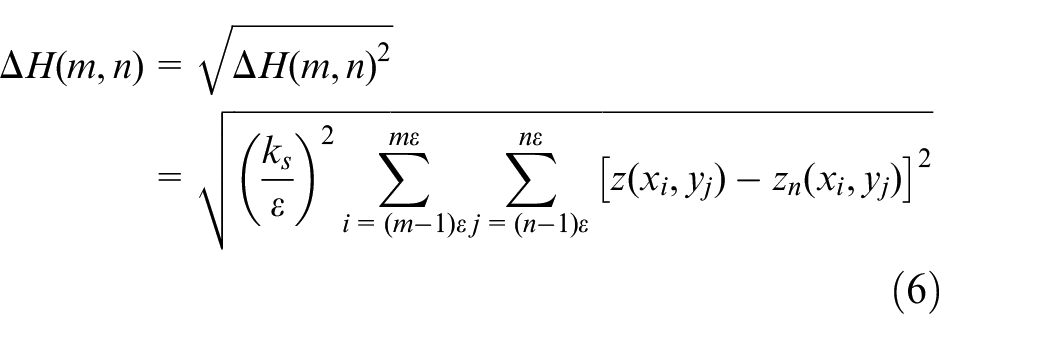
Assuming

Under the representation of
The value of
This shows that the calculated value of
Step 1: Set the initial value of
Step 2: Divide the sample region into
Step 3: Calculate the
Step 4: Calculate the
Step 5: Change the value of
Step 6: Go to Step 7 when
Step 7: Fit the slope of
Step 8: Calculate the value of
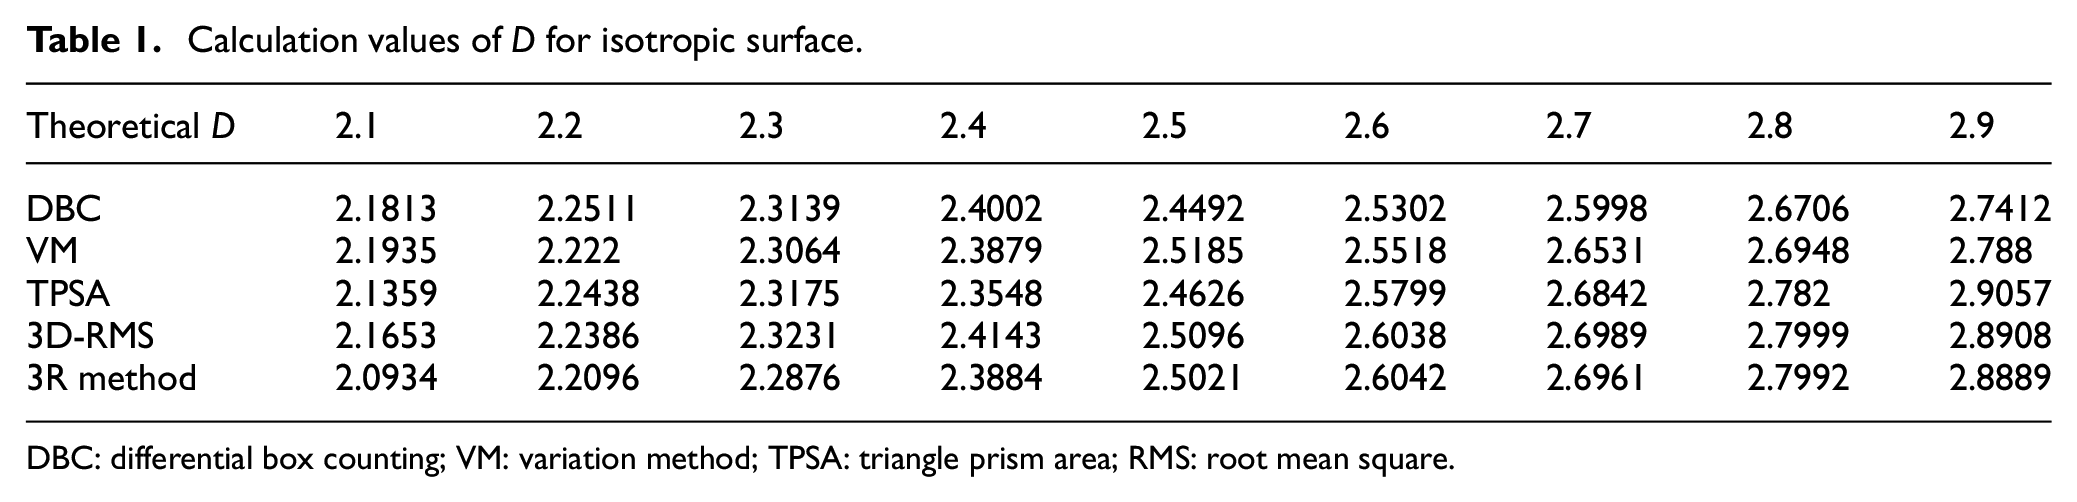
Comparison of calculation results
In this article, the proposed 3R method is used to calculate the anisotropic and isotropic surfaces. To make a comparison, the DBC method, VM method, TPSA method, and the recently proposed 3D-RMS method are chosen to calculate the same surfaces. Then a comparison of these methods is carried out.
Application on isotropic surface
The isotropic surfaces with certain fractal dimensions are generated by equation (1). The fractal dimensions range from 2.1 to 2.9 with the step of 0.1. To simplify the comparison, the parameters given in Zuo et al.
23
are used in calculations. The value range of
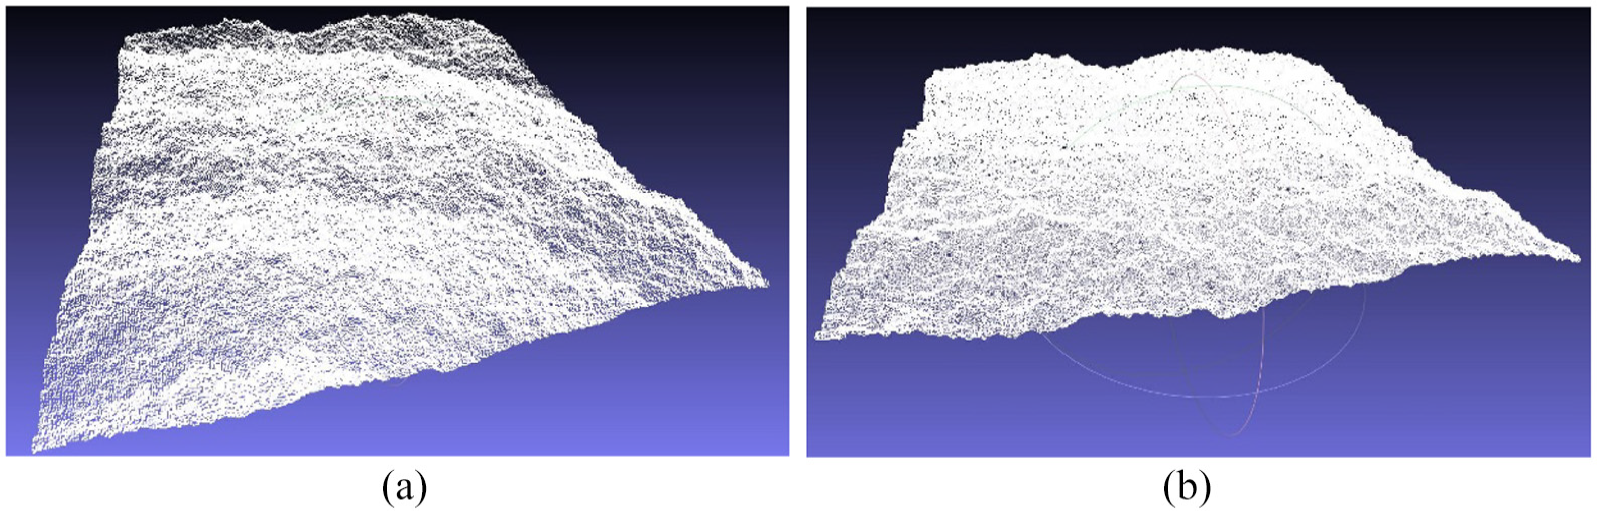
Isotropic fractal surface: (a)
For each given standard dimension
Calculation values of D for isotropic surface.
DBC: differential box counting; VM: variation method; TPSA: triangle prism area; RMS: root mean square.
Absolute errors for isotropic surface.
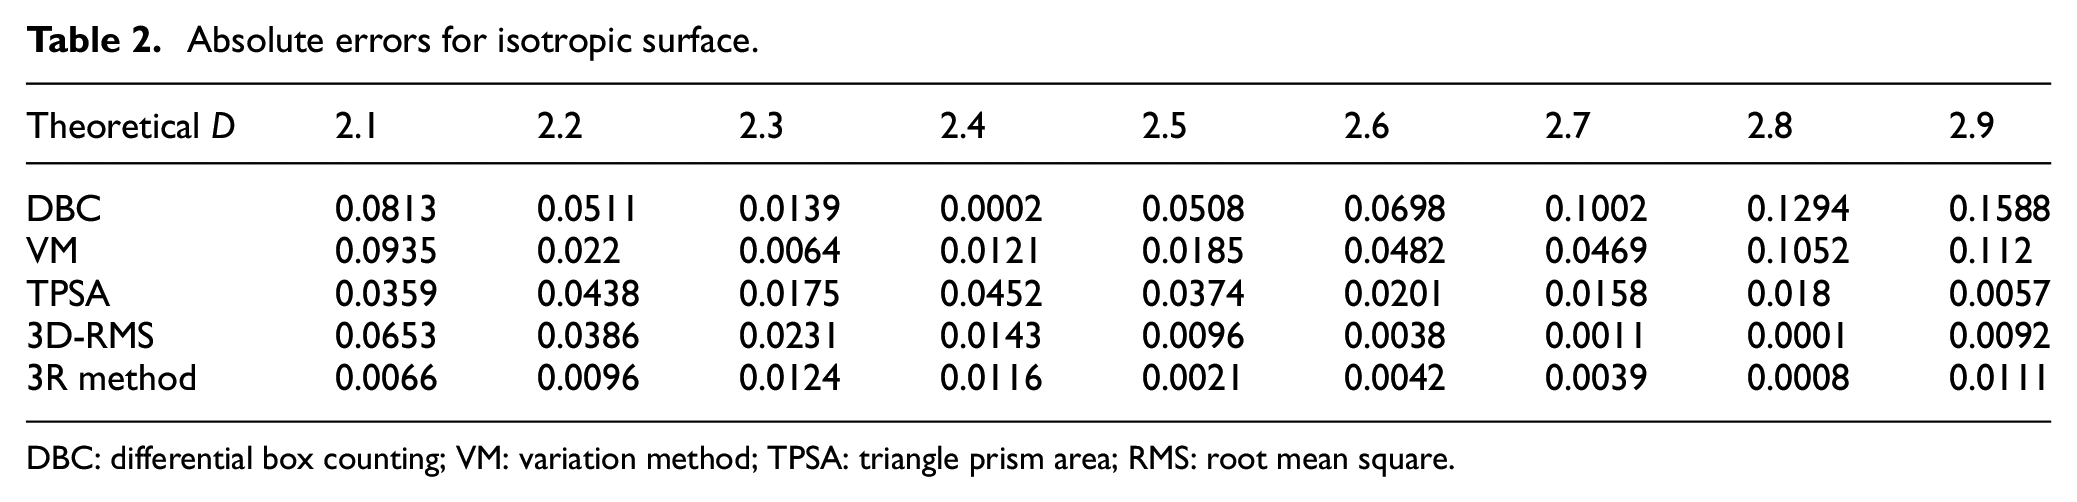
DBC: differential box counting; VM: variation method; TPSA: triangle prism area; RMS: root mean square.
Relative errors for isotropic surface.
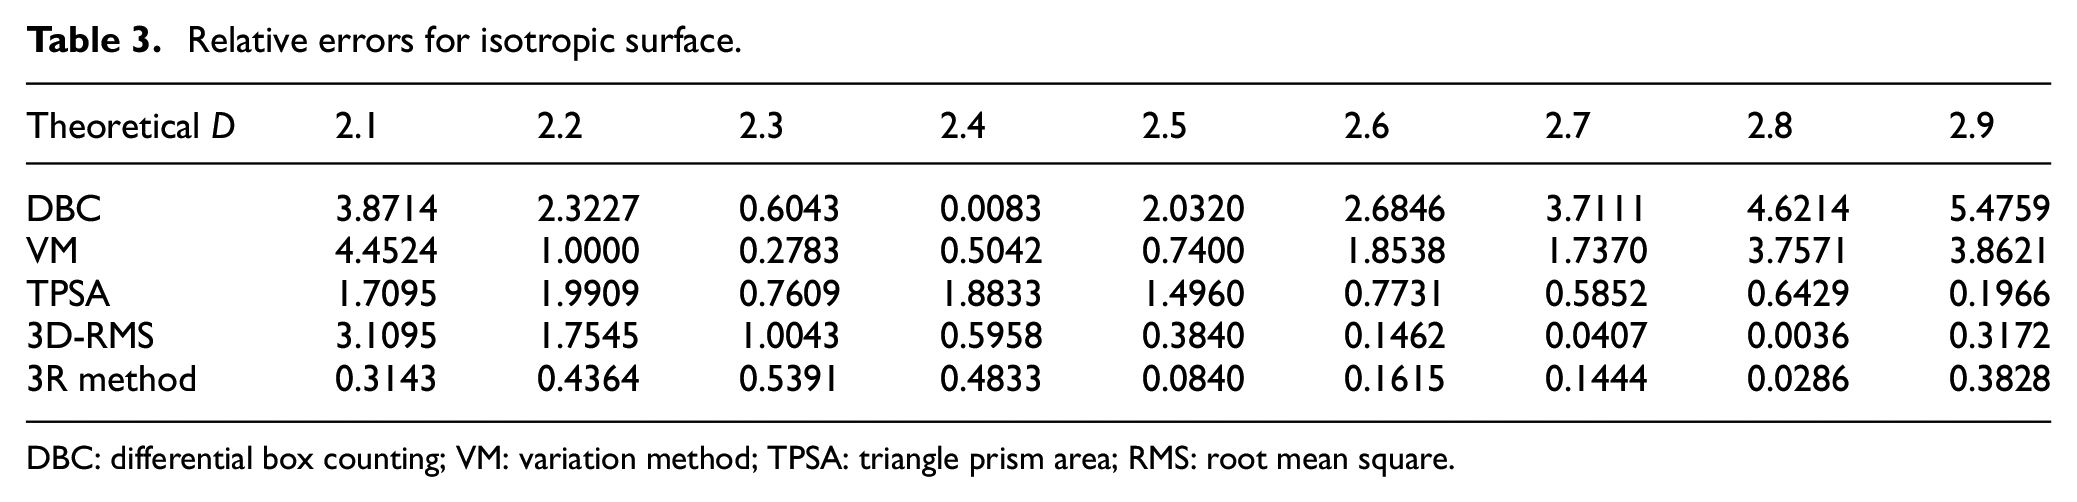
DBC: differential box counting; VM: variation method; TPSA: triangle prism area; RMS: root mean square.
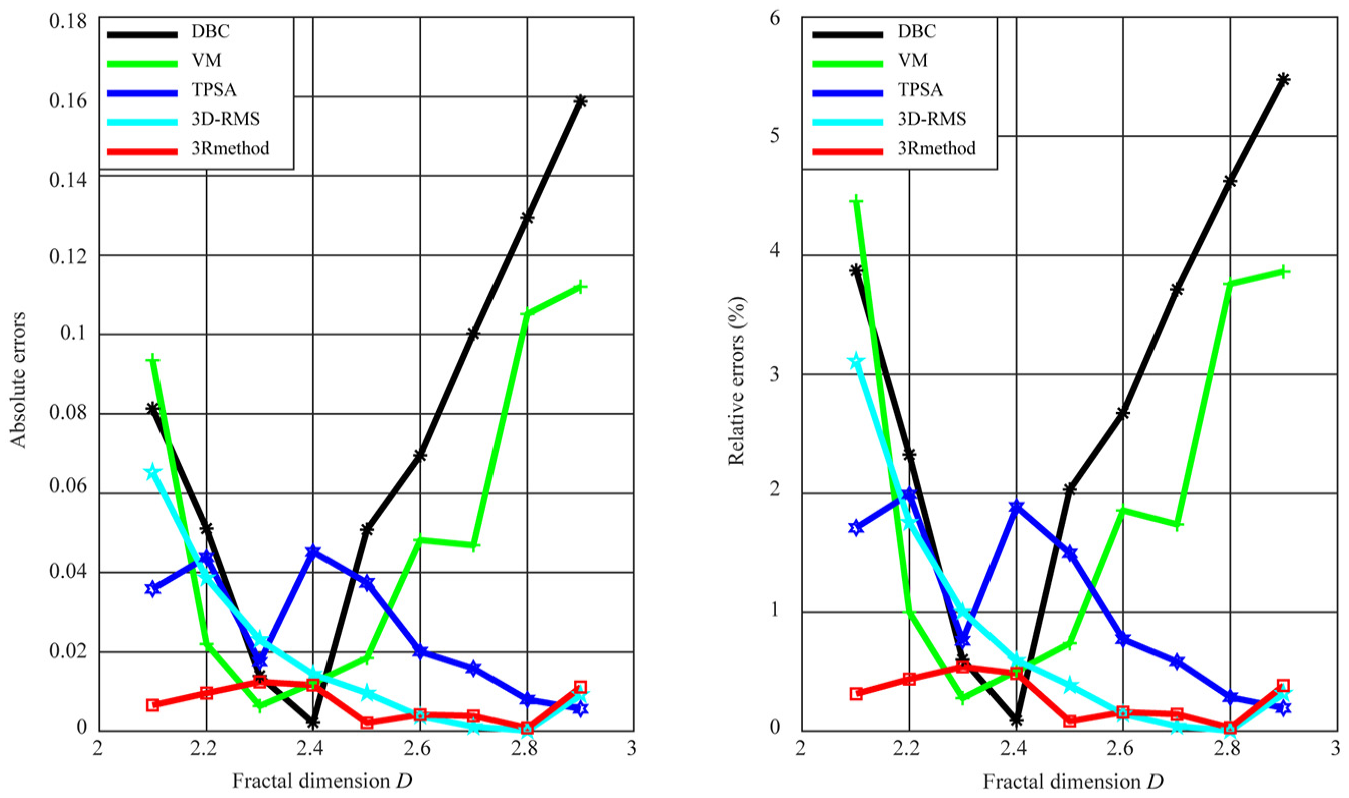
Comparative diagram of absolute errors and relative errors for the isotropic surface.
Application on anisotropic surfaces
The surface parameters of anisotropic surfaces are different in different cross-sectional directions. Therefore, it is not wise to measure the whole surface with a single surface curve in a certain direction. When it comes to the anisotropy surface, the second strategy is the only method to use.
An anisotropic surface with a certain fractal dimension can be obtained by generating a curve in the directions of
Equation (2) denotes the expression of the 2-DW-M fractal function. The fractal dimensions range from 2.1 to 2.9 with the step of 0.1. The value range of
Anisotropic fractal surface: (a)
For each given standard dimension
Calculation values of D for anisotropy surface.
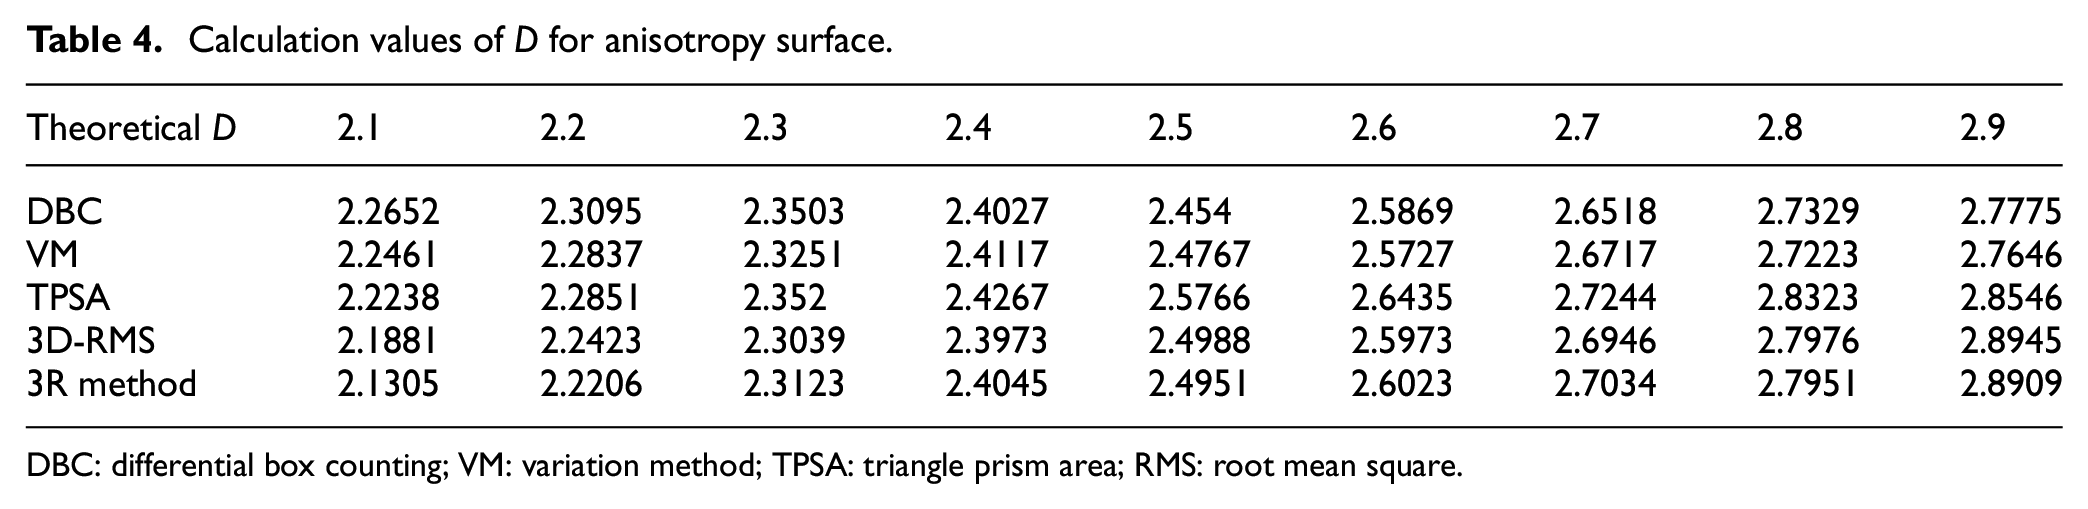
DBC: differential box counting; VM: variation method; TPSA: triangle prism area; RMS: root mean square.
Absolute errors for anisotropy surface.
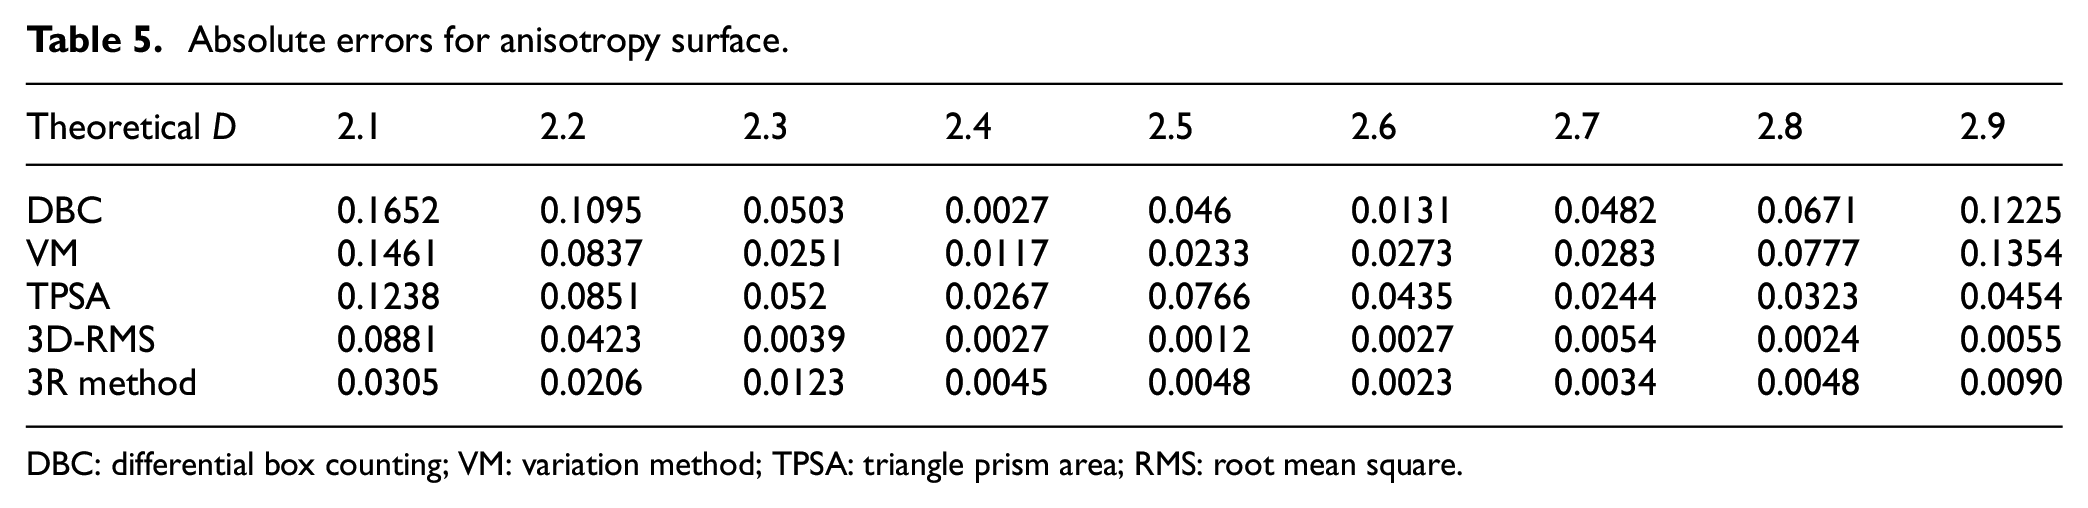
DBC: differential box counting; VM: variation method; TPSA: triangle prism area; RMS: root mean square.
Relative errors for anisotropy surface.
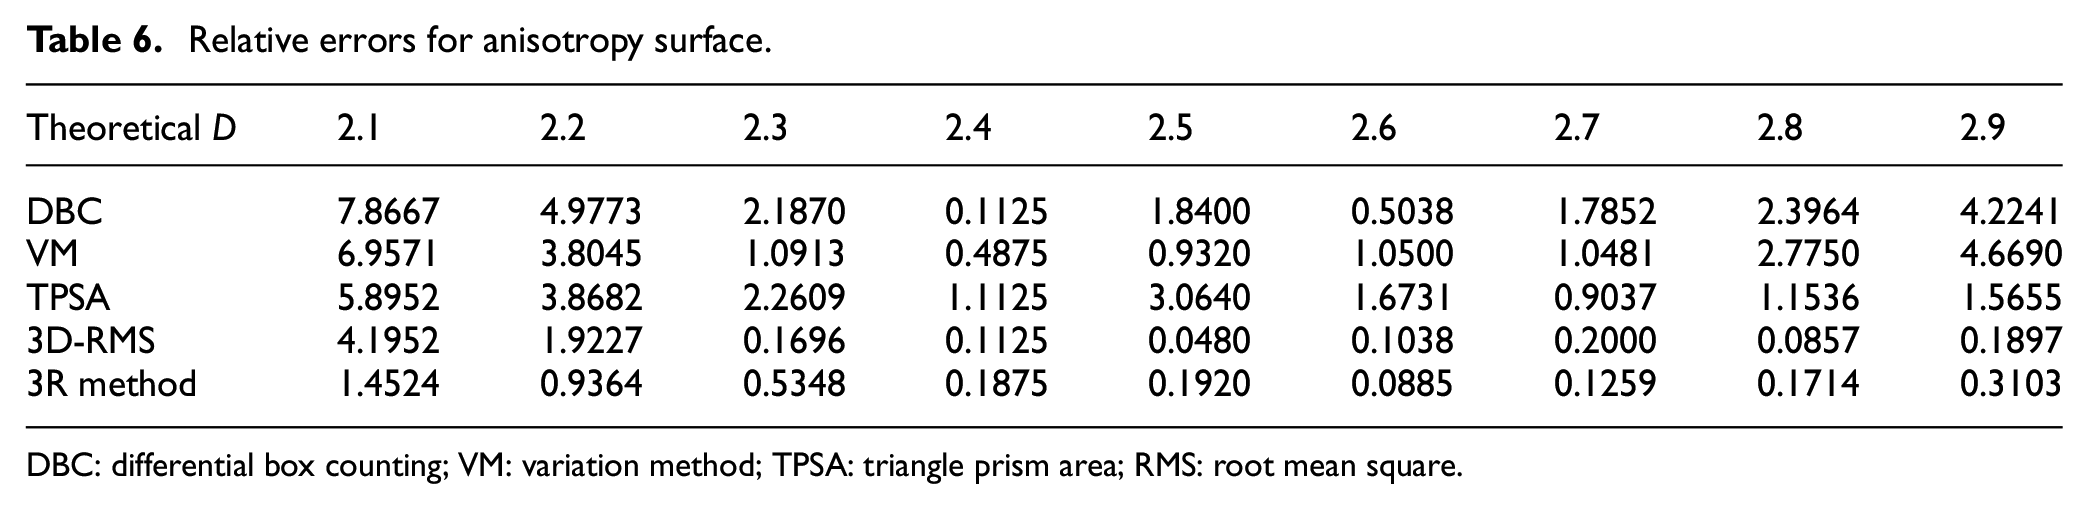
DBC: differential box counting; VM: variation method; TPSA: triangle prism area; RMS: root mean square.
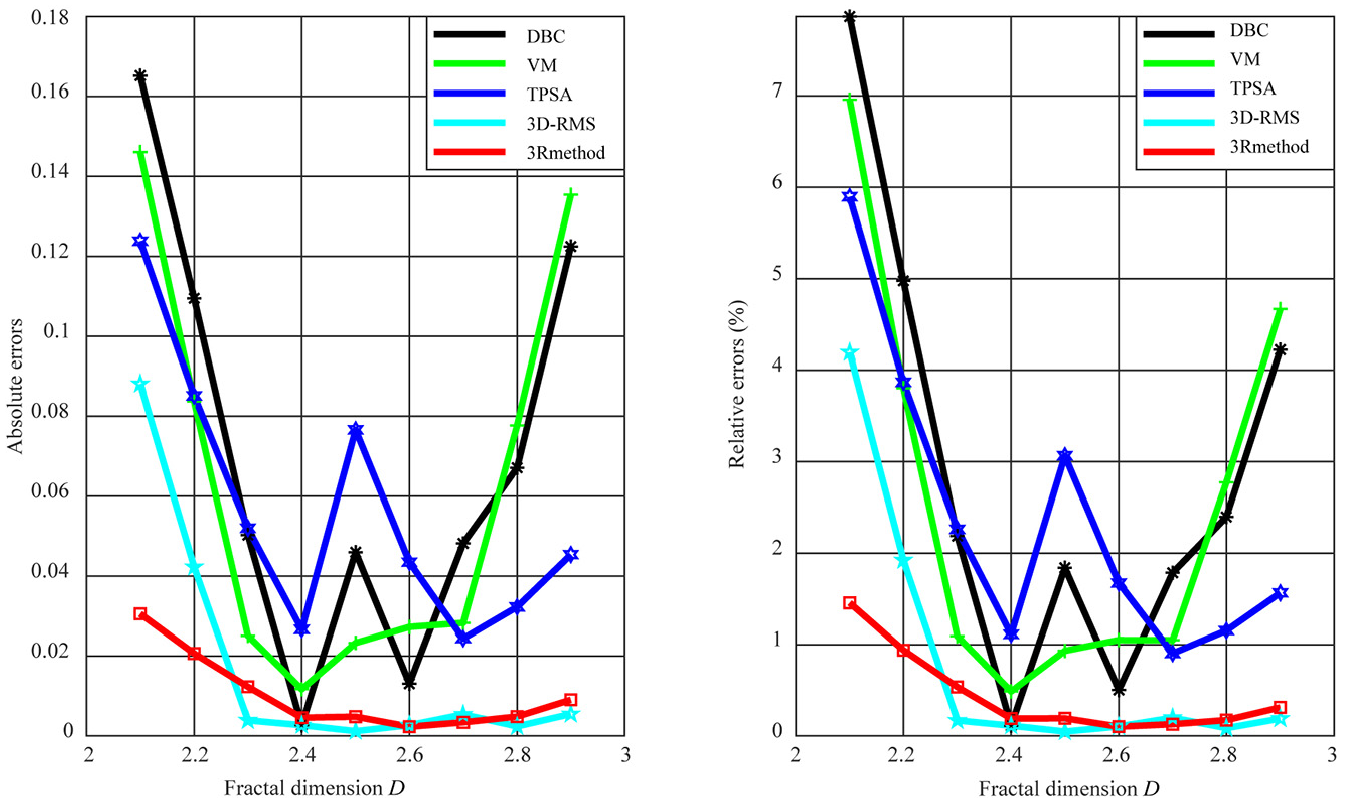
Comparative diagram of absolute errors and relative errors for the anisotropic surface.
Analysis of results
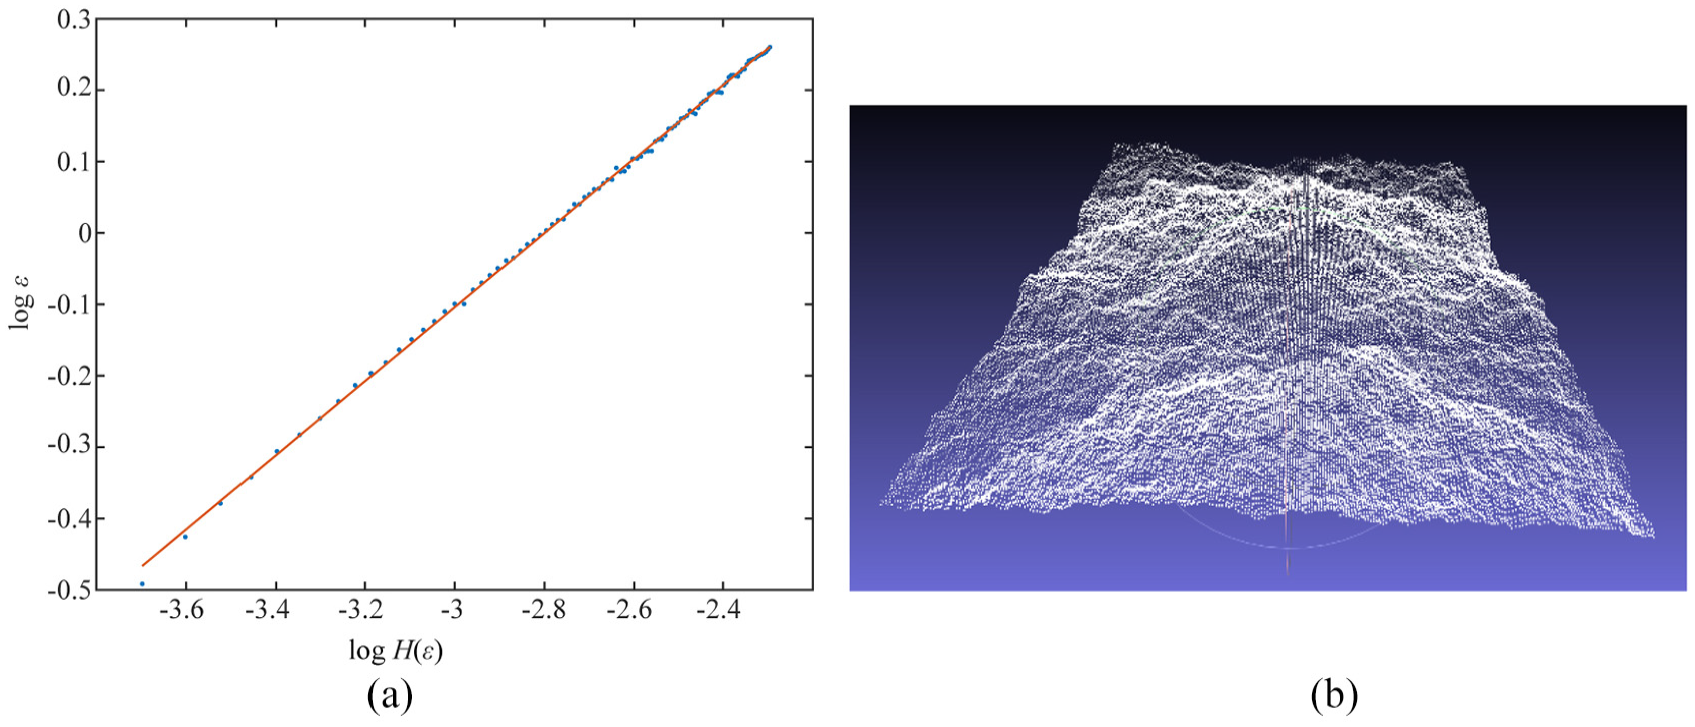
For the isotropic and anisotropic surfaces, the results obtained by the 3R method proposed in this article, and the DBC, VM, TPSA, and 3D-RMS methods have been compared, respectively, in sections “Application on isotropic surface” and “Application on anisotropic surfaces,” and are shown in Tables 1–6. From Figures 3 and 5, there is no doubting that the 3R method has the smallest calculation error among these methods. The calculation accuracy of the DBC method depends on the box size. At a small box size condition, the fitting error is very large, and if the size is too large, the calculation results tend to be meaningless. For the VM method, the calculation formula is complex and time-consuming and the accuracy is no better than the DBC method. These two methods have large relative errors at both very low and very high dimensions. When calculating the isotropic and anisotropic surfaces, the maximum relative errors of the DBC and VM methods are 5.4%, 7.8% and 4.5%, 6.9%, respectively. The TPSA method uses special points to represent the entire surface, which leads to the reduction in precision. There are no obvious trends of error in Figures 3 and 5, because of the insufficient use of data. Their relative maximum errors are 1.9% and 5.8% in the isotropic and anisotropic surfaces. For the RMS method, it has a better performance than the DBC, VM, and TPSA methods. However, excessive pursuit of linearity leads to a weak performance in low fractal dimension. The relative maximum errors are 3.1% and 4.1% in the isotropic and anisotropic surfaces. For isotropic surfaces, the maximum relative error of the 3R method is only 0.5%. And for anisotropic surfaces, the relative errors of the 3R method are less than 0.5% in most cases, except in two computational cases that are near 1%, which is far less than other algorithms. Compared with those methods, only 3D-RMS can achieve similar results. However, when the fractal dimension is 2.1 and 2.2, the 3R method is more accurate than the 3D-RMS method with margins of 2.7% and 1%. The results show that the 3R method has the highest accuracy and the best stability with comprehensive consideration of the outcomes in both the isotropic and anisotropic surfaces with a large applied range among the methods, which demonstrates that the proposed method can be applied in the calculation of fractal dimension of both the isotropic and anisotropic surfaces.
Surface modeling method based on the 3R method
The difficulty of surface modeling machined parts lies in the reproduction of micro-geometric error information. The surface can be regarded as the superposition of a roughness, waviness, and form error contour whose wavelength range is greater than
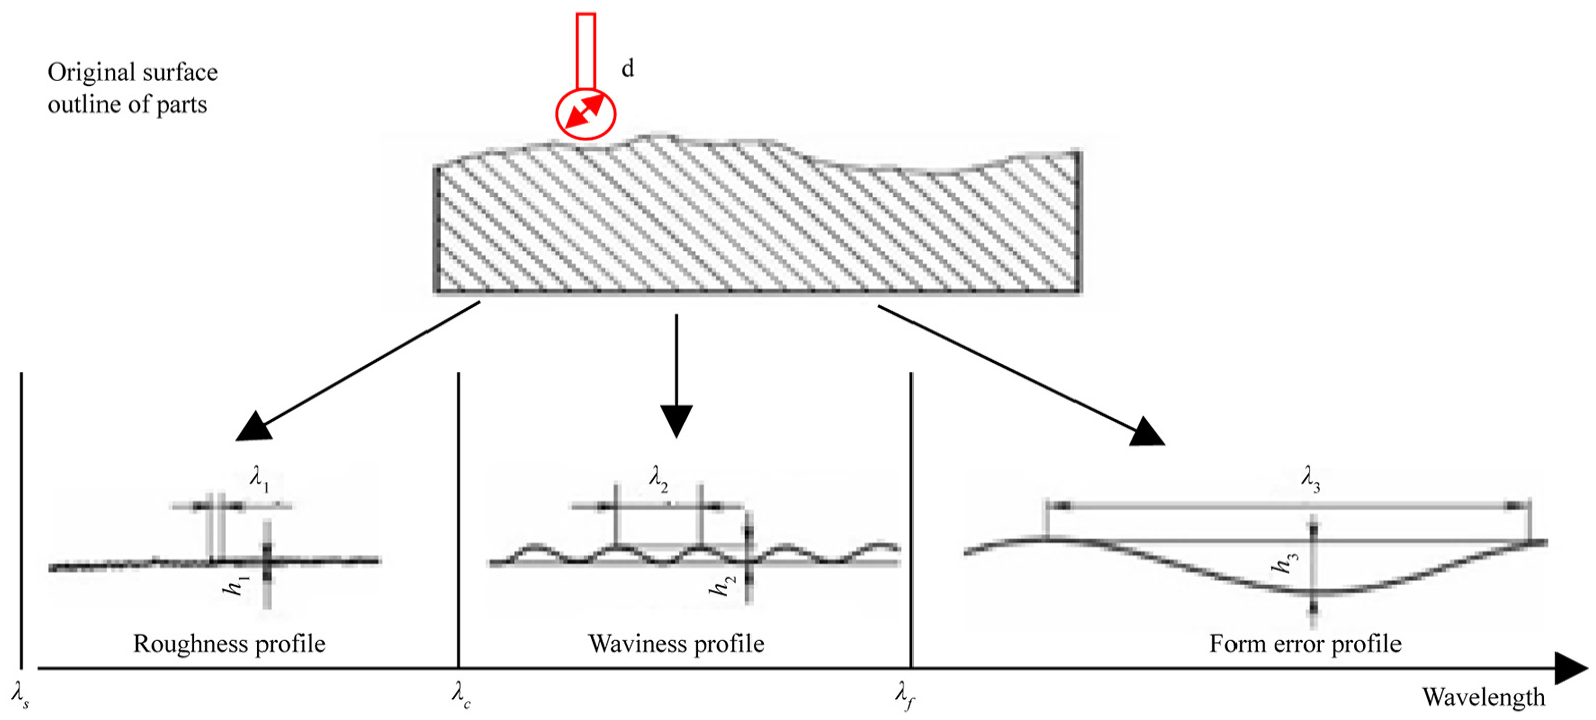
Surface profile.
This is the key to constructing the surface model using the 3R method to calculate the fractal dimension of the actual parts surface. But the value of
Wavelet reconstruction is an inverse process of decomposition. After wavelet transform, the roughness, waviness, and form error profile are obtained. The correction coefficients
Case study
In this article, the VTM-200/F5 turning and milling composite machining center made by Qinchuan Machine Tool & Tool (Group) Corp. is taken as a research object as shown in Figure 7(a), taking the slide of the
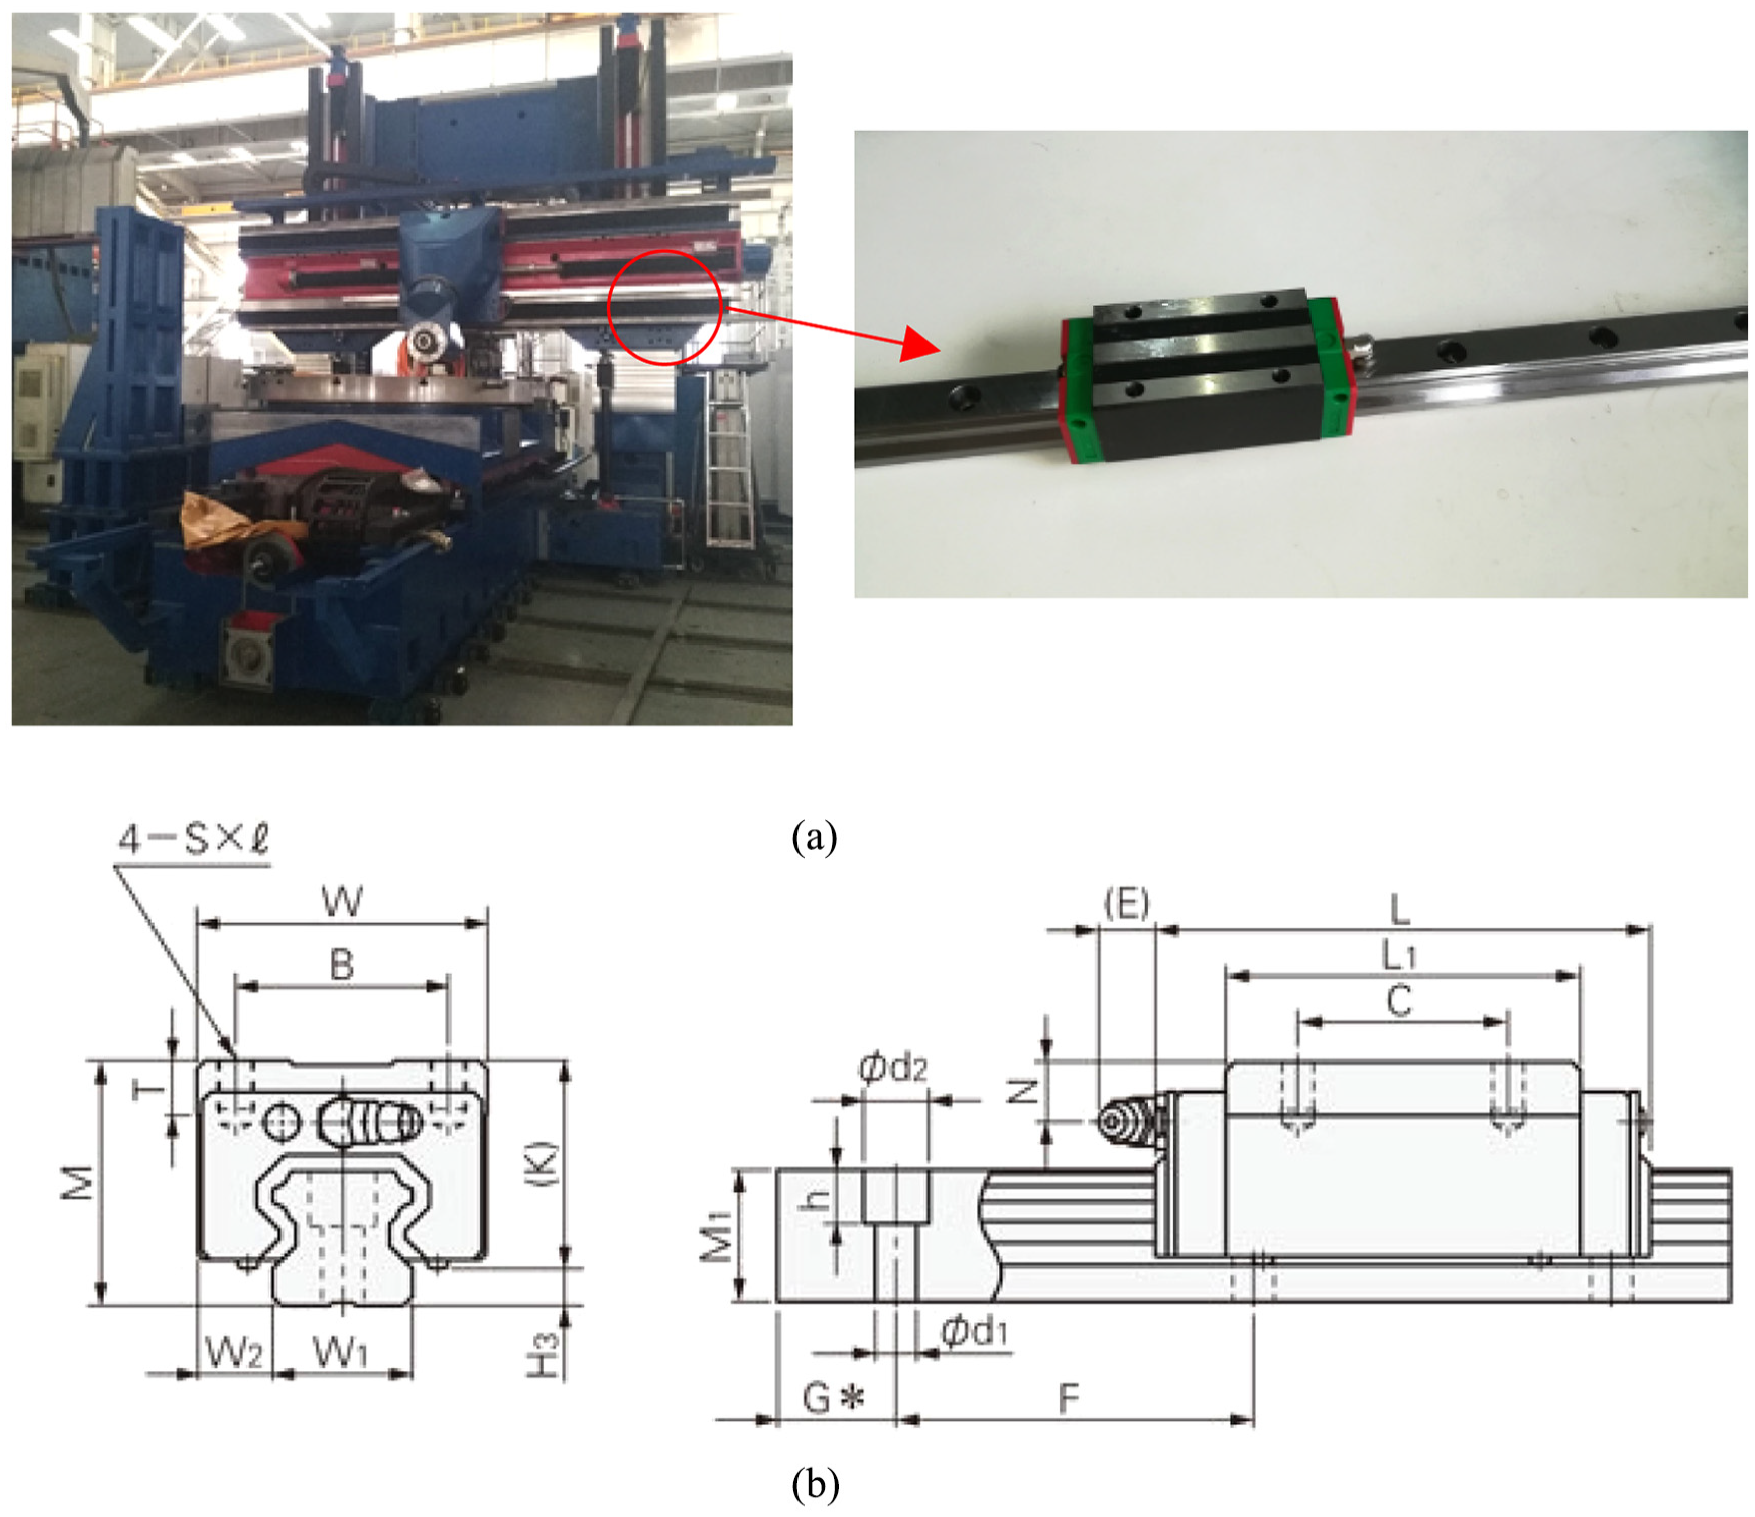
Model of the case: (a) Physical prototype of the VTM200/F5 and the slide, and (b) Schematic diagram of linear guideway parameters.
Some parameters of the slide are as follows:
The initial value of
The value of
(a)
The surface of the slide is reconstructed using the W-M function with
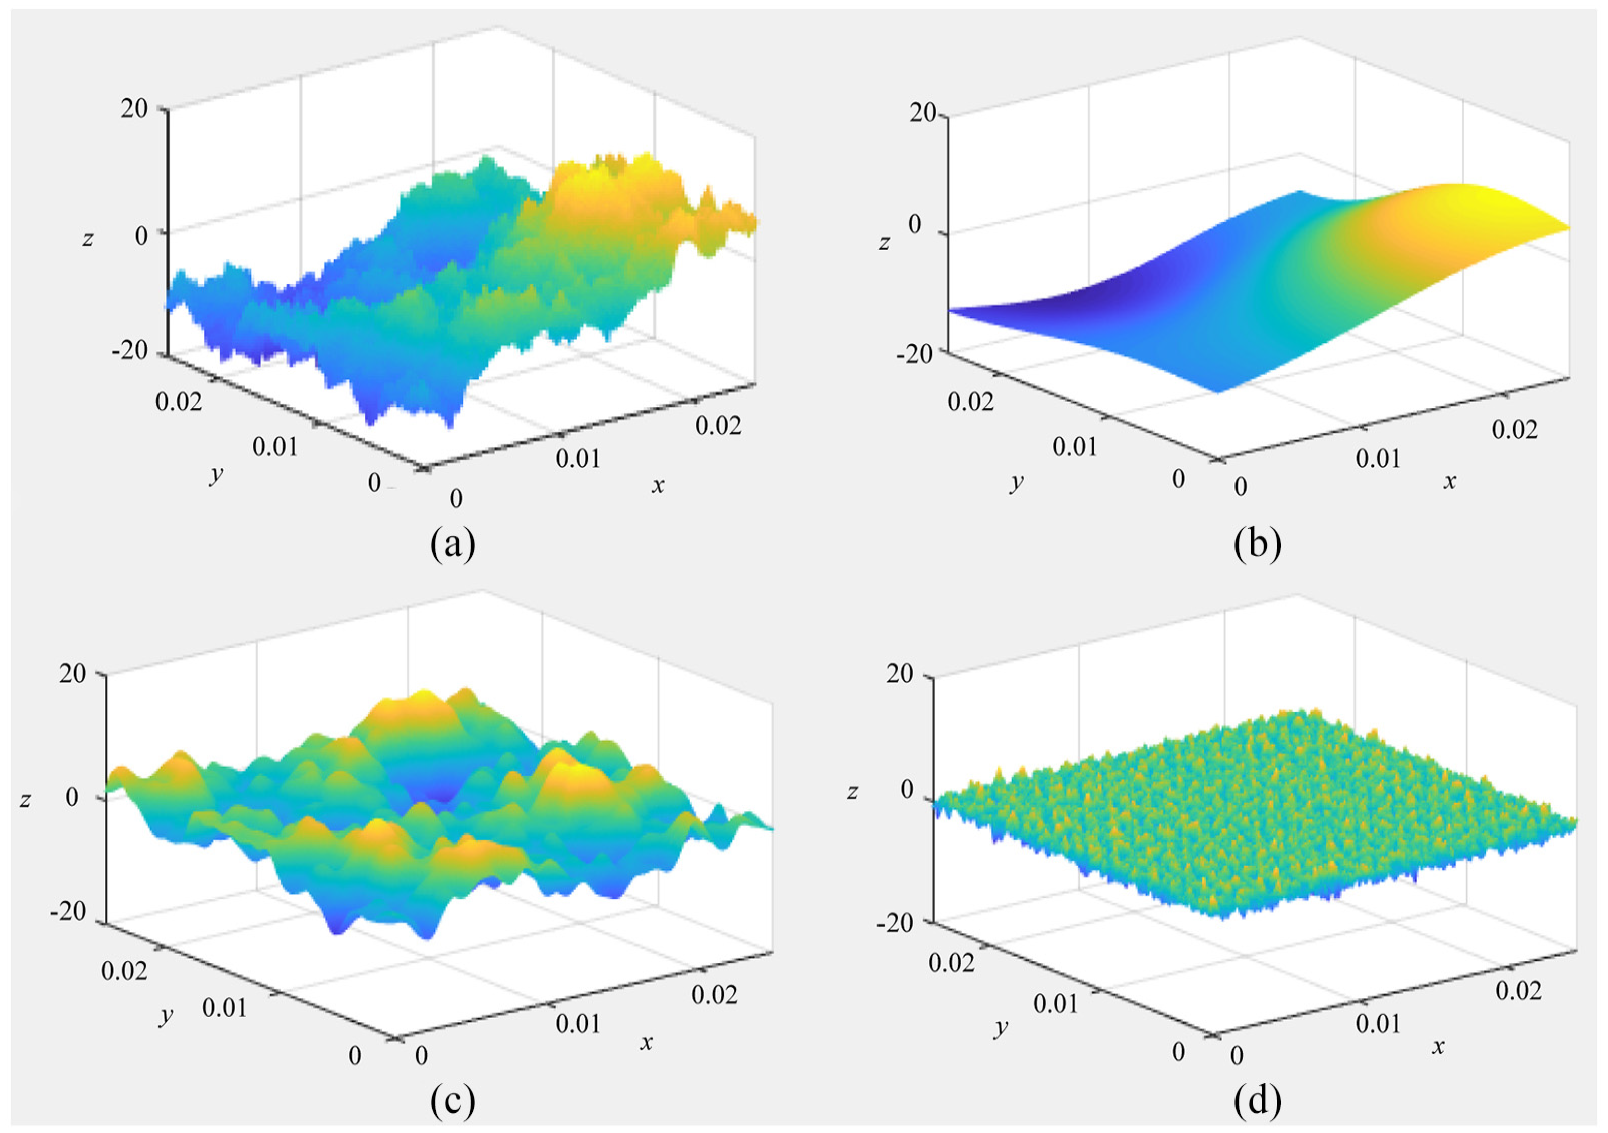
Wavelet decomposition: (a) W-M fractal surface with
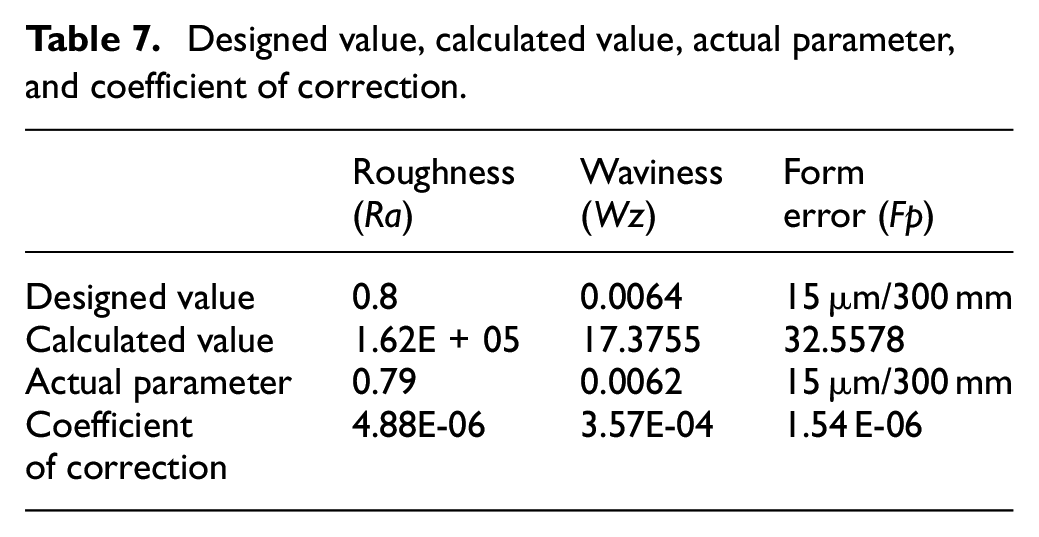
The surface correction coefficients are calculated according to the design parameters as shown in Table 7. Then the hidden surface height information is released with a scaling factor
Designed value, calculated value, actual parameter, and coefficient of correction.
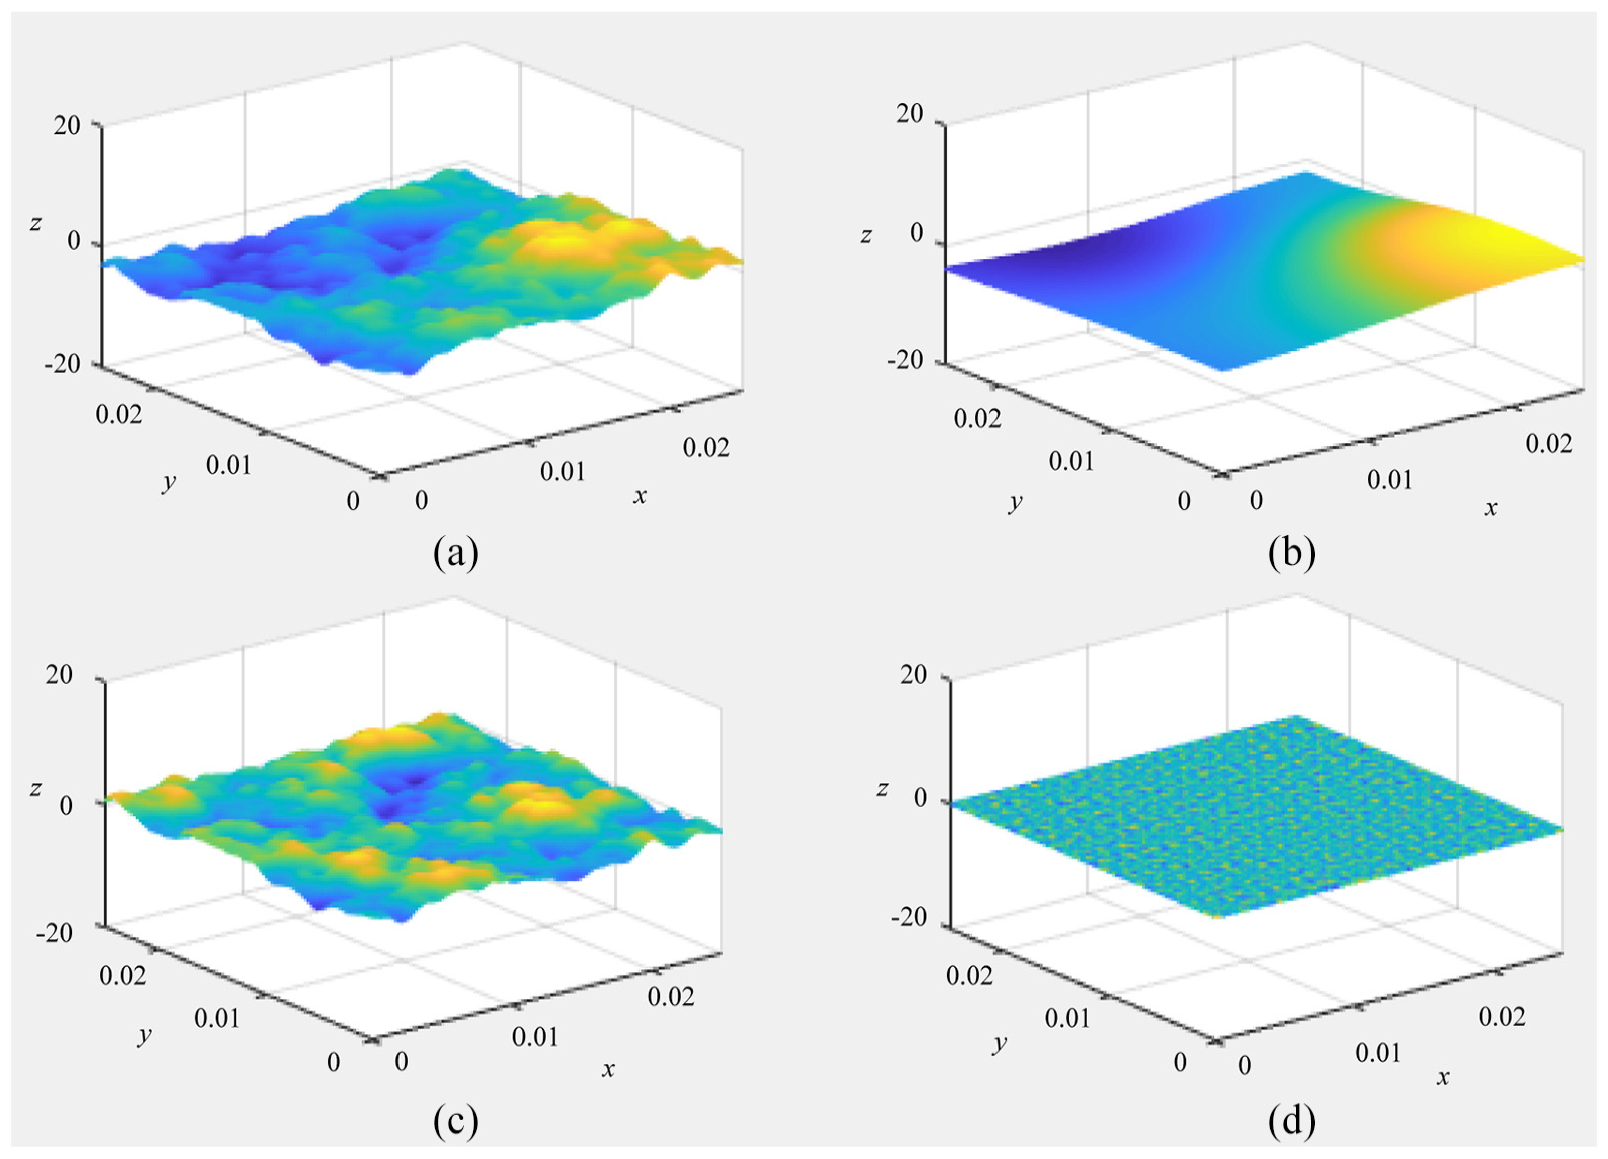
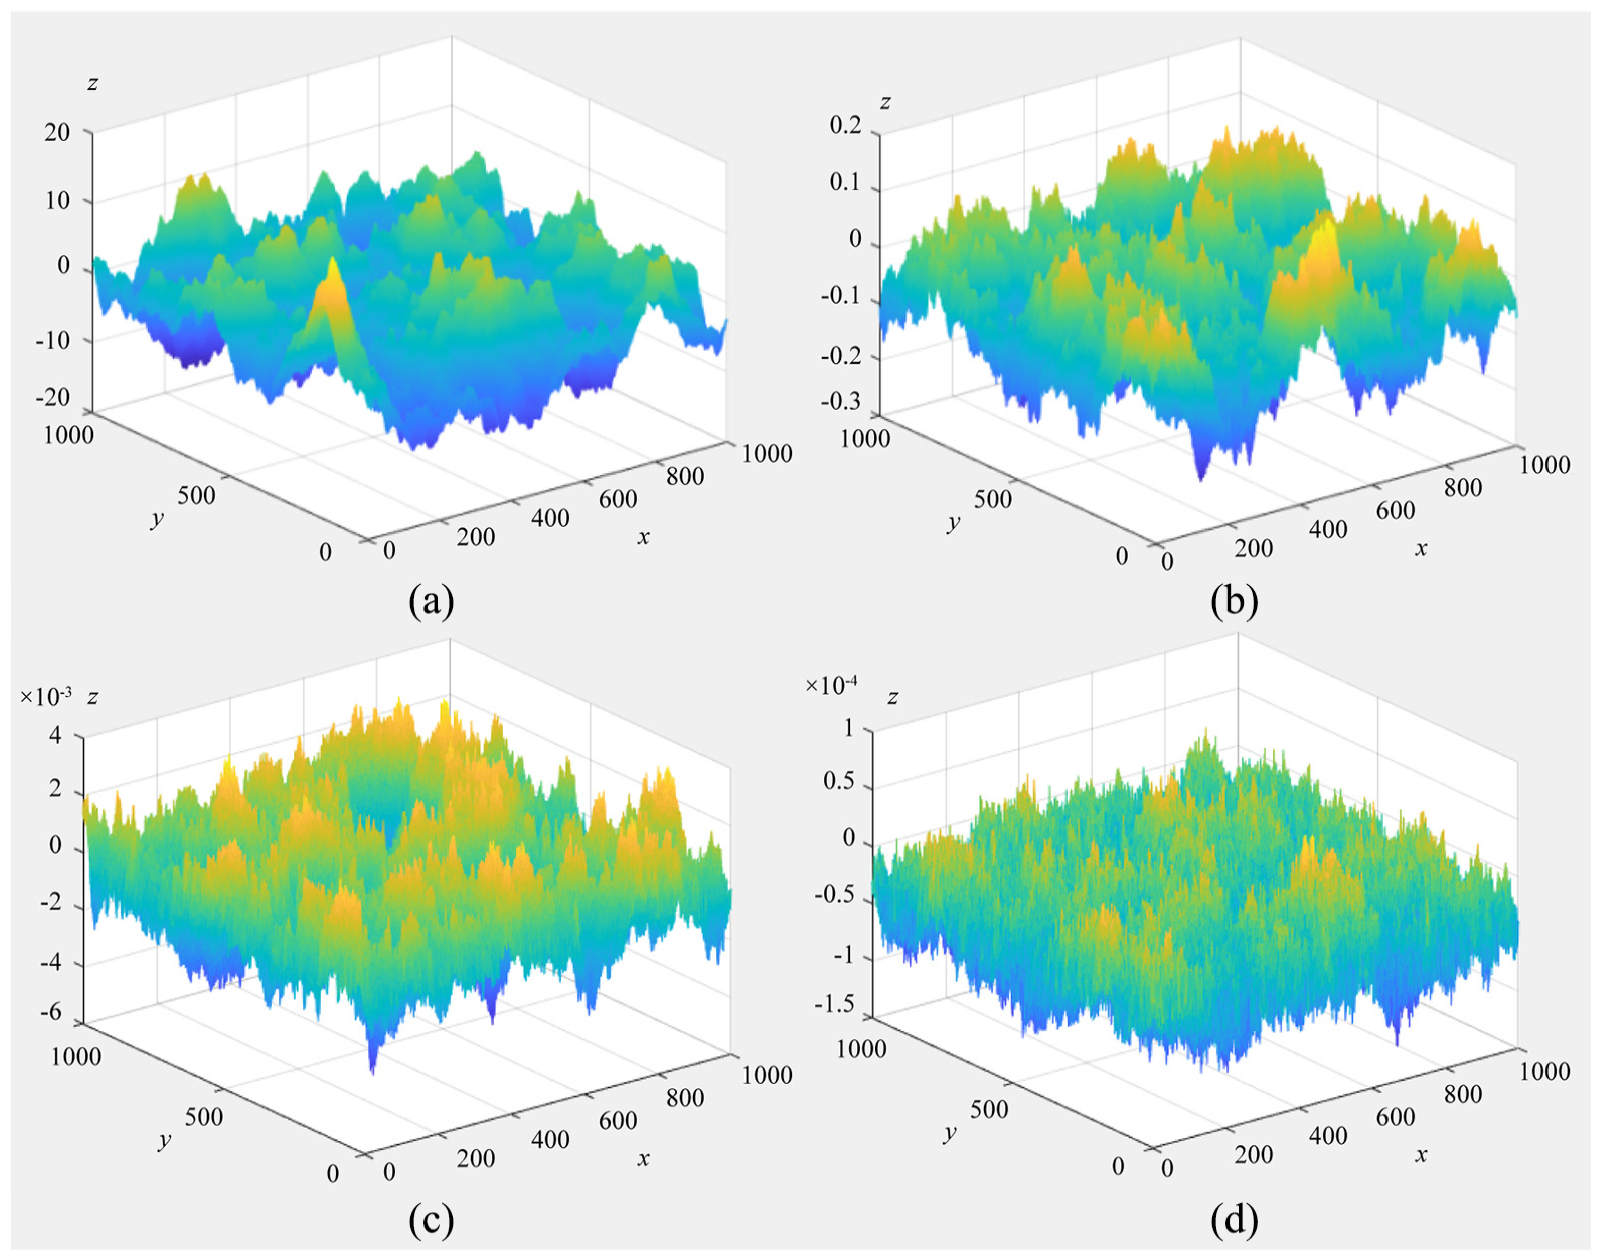
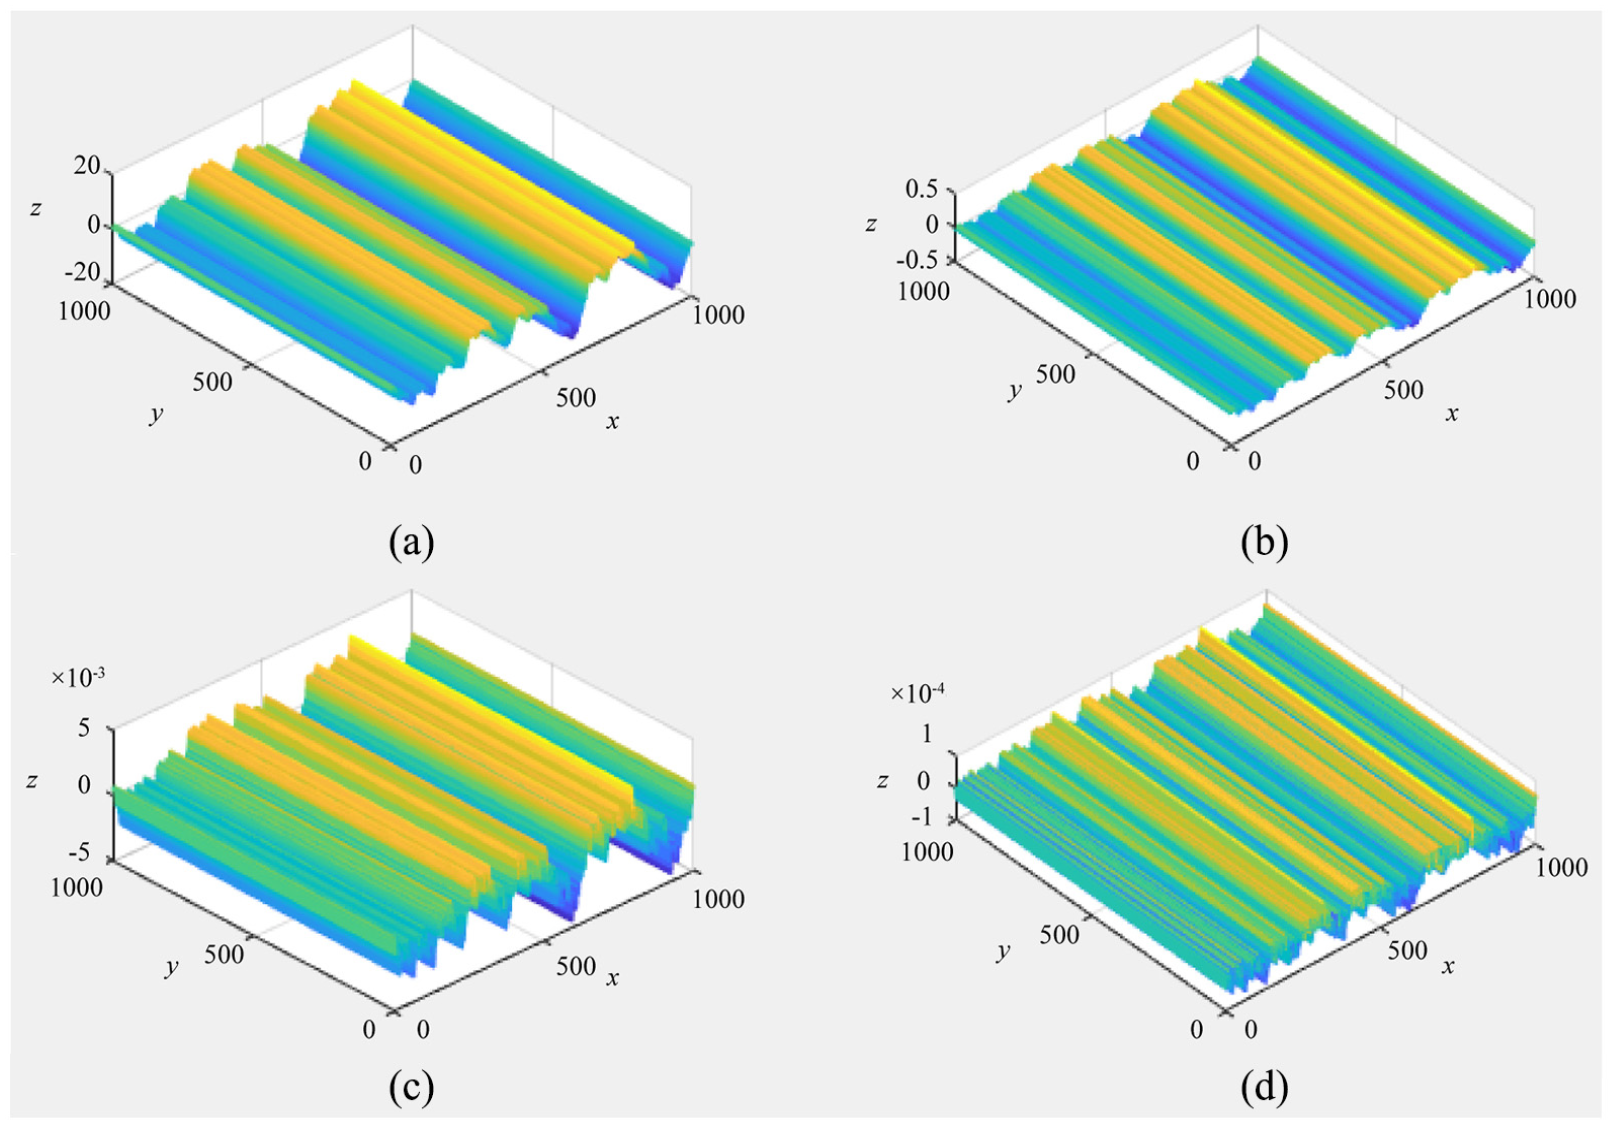
Reconstruction of surface: (a) Contour surface, (b) Form error, (c) Waviness, and (d) Roughness.
The reconstructed surface is imported into the computer-aided design (CAD) system to obtain the point-cloud model, the grid model, and the surface model in virtual reality environment, as shown in Figures 11 and 12.
Reconstructed model: (a) Point-cloud model, and (b) Gridding model.
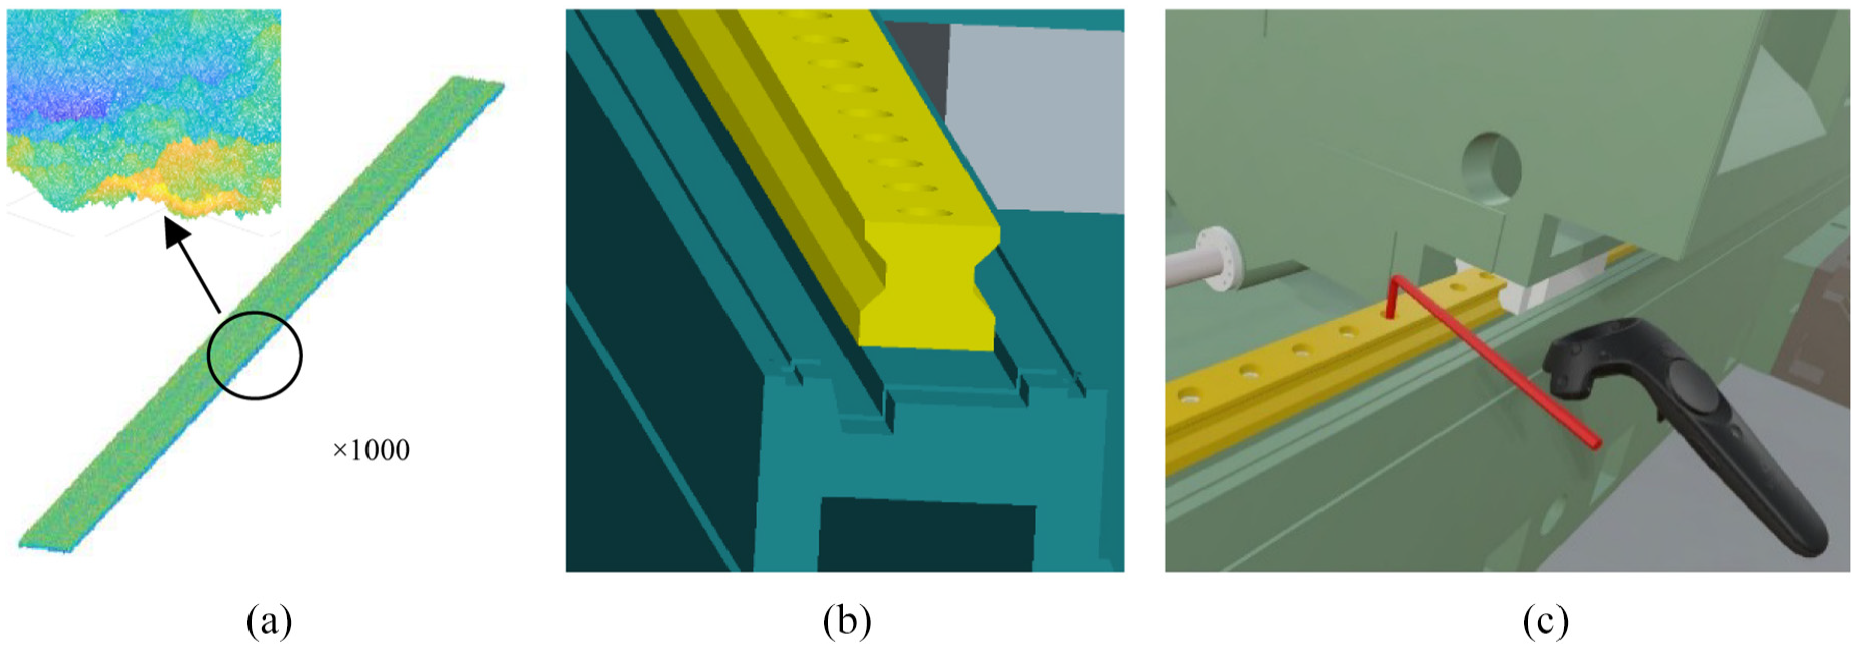
Virtual assembly of guide rail in VTM-200/F5 turn-milling composite center: (a) Surface model, (b) Guiderail model, and (c) Assembly model of machine.
Finally, the modeling result was compared with the other two methods from other related literatures, which could be obtained from Zhang et al. 3 and Wang et al. 5 . The modeling results are shown in Figure 13, and the details can be seen in Table 8. The traditional fractal modeling method can build the computer-aided geometric design (CAGD) model based on primary W-M theory, which is simple with less storage data, but has a bad efficiency and an unsatisfied result. The method can only be a simple representation of the surface. A novel modeling method can produce point-cloud model and surface model based on nonuniform rational basis spline (NURBS) surface. However, the good result depends on complex operation and a large amount of data. The method is cost-effective to apply to the modeling of complex and special surfaces and the following research. The surface modeling method based on the 3R method proposed in this article can produce the point-cloud model and surface model based on W-M theory mixed with reconstruction of model by wavelet transform. Compared with the three methods, it is simple and logic and does not require too much data as well. Moreover, it takes measures for maintaining surface parameters by wavelet decomposition and reconstruction, which is the most obvious advantage over others.
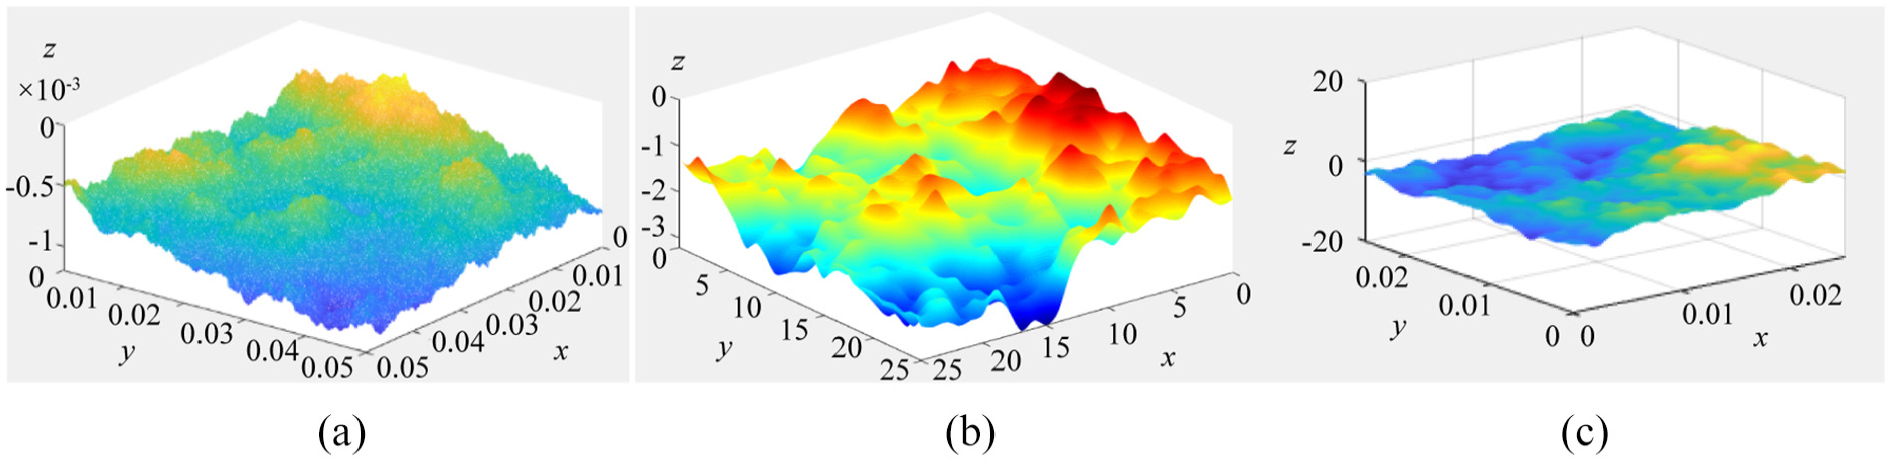
Comparison of modeling results: (a) Fractal modeling method, (b) A novel modeling method, and (c) A surface modeling method based on 3R method proposed in this article.
Comparison of modeling results and modeling methods.
W-H: Weierstrass-Mandelbrot; NURBS: nonuniform rational basis spline; CAGD: computer-aided geometric design.
The surface model constructed by the 3R method proposed in this article is helpful in maintaining the surface morphology of parts. From Figure 8(a) it can be seen that the linearity of the slope fitting is good, which verified the feasibility of the 3R method. In the constructed virtual model, the surface roughness information of the actual parts were maintained, and the virtual model was realized. It is proved that the 3R method can be used in a situation such as virtual reality, virtual prototyping, or digital twin application.
Conclusion
The following conclusions are drawn:
A 3R method was proposed in this article to solve the problems involved in 3-D fractal dimension calculation. This method can take full advantage of the surface point-cloud data and obtain calculations that are closest to the real value. Moreover, it maintained good stability in calculation accuracy. By comparing the results of the isotropic and anisotropic surfaces with those of other traditional methods, the relative error of the proposed method was controlled within 0.5.
According to the 3R method, the fractal dimension of the real part surface was calculated, and the digital model of the part for virtual assembly of the product was constructed. Then, the roughness, waviness, and flatness components were extracted by wavelet transform, and the surface was reconstructed according to the design parameters and the hidden surface information related to
The 3R method was validated in the application of the virtual assembly of the guiderail of the VTM-200/F5 turn-milling composite center. The established virtual assembly surface model can be further applied to predict the virtual assembly accuracy, which will be studied in future research.
Prospect
The assembly precision of mechanical parts is an important index to measure the product performance. The factors that determine the assembly quality of the product can be divided into manufacturing factors and assembly factors. Reliable prediction of assembly performance is of guiding significance to assembly activities. The contact surfaces in mating zone can be represented by the digital model based on the proposed method shown in Figure 14. The manufacturing factor refers to the dimension deviation in the geometric plane of the part. The base surface of the part can be achieved by fitting the virtual surface model, and the irregular surface of the fractal surface can be viewed as the manufacturing error. We are trying to propose a potential tolerance transfer theory to predict the assembly precision based on the modeling method in this article and hypothesis above. And the functional requirement (FR) will be the research object based on the virtual assembly contact model. As shown in Figure 14, the geometric tolerance of A1 relative to the datum after assembly will be an example of FR, which will be a case study in the future research.
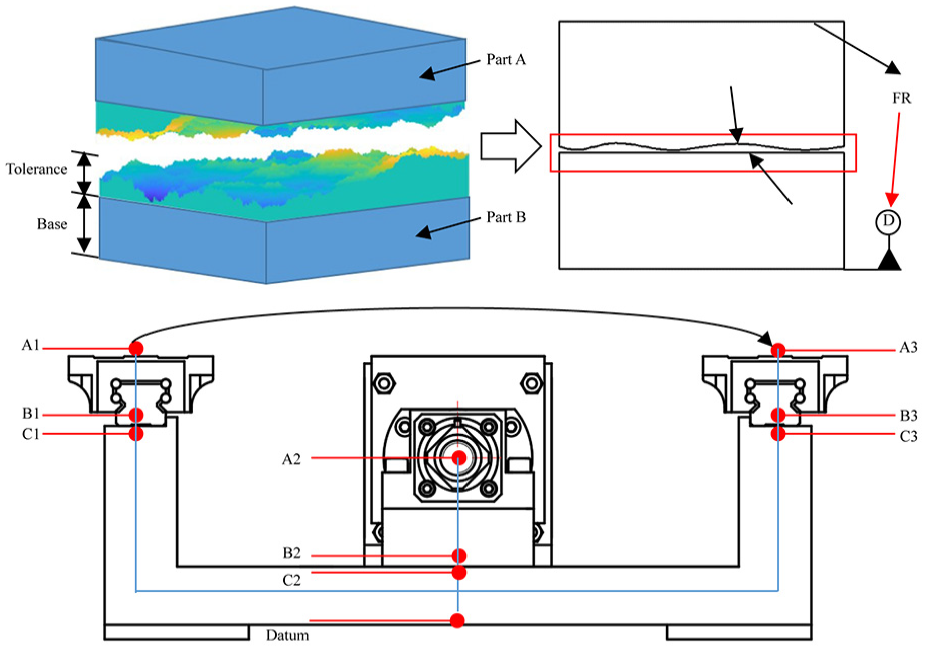
Potential experiment in the following research.
Footnotes
Declaration of conflicting interests
The author(s) declared no potential conflicts of interest with respect to the research, authorship, and/or publication of this article.
Funding
The author(s) disclosed receipt of the following financial support for the research, authorship, and/or publication of this article: The National Natural Science Foundation of China (51875516), the Youth Funds of the State Key Laboratory of Fluid Power and Mechatronic Systems of Zhejiang University (SKLoFP _ QN _ 1702), Collaborative Innovation Center of High-end Manufacturing Equipment, and the Natural Science Foundation of Zhejiang Province (LY18E050001).