
Abstract
Fault-influencing factors analysis is an important part of the quality supervision process. There are double functions for high-voltage switchgears that switch off and protect electric circuits in power transmission lines. Such devices have serious impact on power grid–operating efficiency, factory operation, and resident life, which will cause economic losses. As it was difficult for traditional methods to analyze fault-influencing factors accurately and comprehensively, a novel method based on industrial big data was proposed to analyze high-voltage switchgears fault-influencing factors in the process of quality supervision in this article, which integrated the qualitative and quantitative analyses method. In this model, the Classification Based on Multiple Class-Association Rules based on Gaussian Mixture Model as the qualitative analysis method was adapted to analyze the whole life cycle of fault-influencing factors of high-voltage switchgears comprehensively, and supplied fault-influencing factors with discrete interval value ranges. The logistic regression method based on qualitative analysis was constructed to calculate fault occurrence probability quantitatively, including the single-fault occurrence probability and the multiple-faults joint occurrence probability. In addition, the single-fault occurrence probability was used to modify the discrete interval value ranges calculated by the qualitative analysis method, which could make the ranges more accurately. Consequently, the proposed method could provide important reference for high-voltage switchgears operation maintenance, and it would be possible to design accurate maintenance plans before equipment failure. The final instance demonstrates the effectiveness of the proposed methodology.
Keywords
Introduction
High-voltage switchgears can not only close and disconnect normal working current but also promptly cut off overload current and short-circuit current in line failure to guarantee power grid safe operation. Due to a variety of complex and potential factors, faults of high-voltage switchgears have occurred frequently, such as the control loop fault, the mechanical fault, and the power supply system fault, which seriously threaten power grid safe operation, so fault-influencing factors analysis of high-voltage switchgears plays an important role in the entire power grid–operating efficiency, operation of factories, and resident life. At present, the production process of high-voltage switchgears and the product itself are becoming more and more intelligent, and the whole life cycle of high-voltage switchgears produces a large number of heterogeneous data, including design and production parameters, test detection parameters, environment parameters, and operation parameters during operation, and regular spot inspection data during maintenance, which lead to a more complicated analysis of fault-influencing factors. Fault-influencing factors analysis of high-voltage switchgears has the following characteristics: (1) Wide range of fault-influencing factors, operation data come from regional substations; design data, production data, and test data come from design, production, testing, and other enterprises. (2) Diversity of fault-influencing factors, the process of fault-influencing factors analysis has the characteristics of diverse natural environment, diverse equipment parameters, diverse data types, and so on. (3) Qualitative analysis dominated by artificial experience is difficult to analyze and verdict faults accurately. Therefore, it is necessary to start from the whole life cycle big data analysis of high-voltage switchgears to explore a quantitative analysis method of fault-influencing factors and obtain quantitative relationship between parameter change of fault-influencing factors and fault occurrence probability, which supports preventive maintenance and reduces fault frequency and harm degree in the operation process. It is of great practical significance to provide high-quality and safe electric power protection for a rapidly developing national economy.
A lot of data-driven methods have been proposed for high-voltage switchgears fault-influencing factors analysis. Ni et al. 1 proposed an approach based on an adaptive kernel principal components analysis (PCA) and support vector machine for real-time fault diagnosis of high-voltage circuit breakers (HVCBs), this approach achieved balance between real time and accuracy, could also deal with various situations of fault diagnosis for HVCBs, and was capable of detecting and recognizing the faults efficiently. To perform online fault diagnosis of transmission lines, Zhao et al. 2 proposed a hybrid method combining stochastic time domain simulation and history-driven differential evolution to generate simulated fault and system data so as to improve the computational speed of fault diagnosis and handle the possible malfunction of protective relays and circuit breakers. Wang et al. 3 developed a method based on Fuzzy Reasoning Spiking Neural P systems, Fuzzy Reasoning Spiking Neural P systems to handle incompleteness and uncertainty in power transmission network fault diagnosis in electric power systems; this approach provided intuitive illustration of graphical models and understandability of diagnosis model-building process. Groenewald and Aldrich 4 proposed a method by means of causality maps and extreme learning machines for root cause analysis to deal with highly nonlinear systems. Tian et al. 5 presented a fault diagnosis method based on current kernel density estimation for transistor open-circuit fault using current kernel density estimation, Euclidean distance, fault detection, and isolation to analyze the influence factors of thermic cycling and voltage surge. Leone et al. 6 applied a data-driven prognostic algorithm for the estimation of the remaining useful life of a product, which played an important role in preventive maintenance of the medium-voltage circuit breakers and HCVBs. Then, Zhang et al. 7 and Huang et al. 8 introduced a mechanical fault diagnosis method for HVCBs based on variational mode decomposition and support vector machine, and time segmentation energy entropy was extracted to construct feature vectors for describing the energy distribution of HVCB vibration signals in the time and frequency domain. Zhu et al. 9 proposed a method based on particle swarm optimization-support vector domain description and particle swarm optimization kernel-based Fuzzy C-means for adaptive fault diagnosis of HVCBs. Ramentol et al. 10 presented an imbalanced learning preprocessing algorithm, called SMOTE-FRST-2T, which combined the well-known synthetic minority oversampling technique with a strategy of instance selection based on Fuzzy Rough Set Theory to predict the need of maintenance. Lin et al. 11 constructed a hierarchical assessment index system based on intelligent electronic device monitoring data and proposed a method which integrates Fuzzy Set Theory to analyze the circuit breaker condition assessment indices provided by the intelligent electronic devices. To improve the identification accuracy of HVCBs mechanical fault types without training samples, Wang et al. 12 introduced a mechanical fluctuation diagnosis method of Bayes using a hybrid classifier constructed with support vector data. Razi-Kazemi et al. 13 developed diagnosis framework for online monitoring system to accurately assess its condition while under operation, and to foresee any risk of failure, used a data-mining process to cluster the captured data against past-recorded data of circuit breaker diagnosis. Luo et al. 14 applied the wireless instrumented milling cutter system with embedded polyvinylidene difluoride (PVDF) sensors to protect the milling from loopholes and different types of faults. Rawat et al. 15 proposed a multilayered fault estimation classifier, based on the dominance-based rough set to protect the system from vulnerabilities and different kinds of faults and provided a robust system for fault diagnosis using the status of an intelligent electronic device and circuit breakers which could be tripped by any kind of fault. Ksal and Batmaz Testik 16 published a review of data-mining applications for quality improvement in manufacturing industry, whereas Zhang et al. 17 and Chang et al. 18 presented a big data analysis architecture for the entire lifecycle of the product without deep discussion of the mentioned analysis techniques. Based on supervisory control and data acquisition control systems, Astolfi et al. 19 and Simons and Cheung 20 studied the data-mining algorithm to analyze the relationship between fault and influence factors in the process of product operation; the performance and the validity of the method was proved through the production operation example. Cai et al. 21 analyzed and studied the fault correlation of high-voltage switchgears, integrated data mining, Fuzzy Set Theory, Bayesian Network, expert comprehensive judgment, and other data analysis methods for relevant reliability index and influence factors to provide support for the inspection and maintenance of HVCBs. To apply the massive manufacturing quality data effectively to the quality analysis of the manufacture enterprise, He et al. 22 proposed a generalized health prognosis method for cylinder-head manufacturing system, which is presented based on the deep fusion of quality-oriented big data of operational process of manufacturing systems, and according to a wide range of production operations and statistical analysis, He et al. 23 also presented the mapping relationship between the produced product reliability and mission reliability of the manufacturing system to build the mission reliability model. Based on the real-time management of data and information, Menon et al. 24 described the product (not for high-voltage switchgears) life cycle management challenges in detail from the existing literature and presented solutions using industrial Internet platform openness and related dimensions as well as sub-dimensions. These methods have played a significant role in fault analysis, factor identification, maintenance, and life prediction of high-voltage switchgears. However, most of these studies mainly focus on the fault analysis in the process of equipment operation, and the influence factors analysis does not cover all phases of the product life cycle and cannot explore the root cause of fault. At the same time, most of these studies are unable to make use of the massive data from the whole life cycle of the product, fault-influencing factors analysis in the massive data is insufficient to meet the requirements of the fault-influencing factors analysis under the massive data. In addition, most of these methods are based on qualitative analysis, quantitative analysis is rare and cannot supply quantitative data. Considering that high-voltage switchgears are in highly intelligent complex operation condition, fault-influencing factors analysis can’t solve these problems effectively and makes equipment maintenance have some difficulties and certain limitations.
Accordingly, the industrial big data analysis method was introduced into fault-influencing factors analysis of high-voltage switchgears in this article and the fault-influencing factors set was constructed. A method integrated Classification Based on Multiple Class-Association Rules (CMAR) based on Gaussian Mixture Model (GMM) and logistic regression was proposed, where qualitative analysis and quantitative analysis were considered. In the proposed method, association rules between fault-influencing factors and fault based on CMAR were determined to obtain discrete interval value ranges of different fault-influencing factors for different fault types. On the basis of qualitative analysis, the model based on logistic regression was presented to calculate the single-fault occurrence probability used to modify discrete interval value ranges and the multiple-faults joint occurrence probability. According to precise ranges, maintenance strategies can be developed in advance to support preventive maintenance during the operation of high-voltage switchgears.
The rest of this article is organized as follows. The “Method of high-voltage switchgears fault-influencing factors analysis based on industrial big data” section introduces the high-voltage switchgears fault-influencing factors analysis model based on industrial big data, where qualitative and quantitative analyses based on CMAR and logistic regression are proposed. In the section “Application case of high-voltage switchgears fault-influencing factors analysis,” the proposed method is validated by instance and a big data analysis with parallel computing platform is built to demonstrate its effectiveness. Finally, the conclusion are given in the “Conclusion” section.
Method of high-voltage switchgearsfault-influencing factors analysis based on industrial big data
To analyze fault-influencing factors of high-voltage switchgears, the method which integrates qualitative and quantitative analyses based on CMAR and logistic regression, respectively, is proposed. This method offers the specific discrete interval value ranges of different fault-influencing factors, the single-fault occurrence probability, and can also provide the multiple-faults joint occurrence probability.
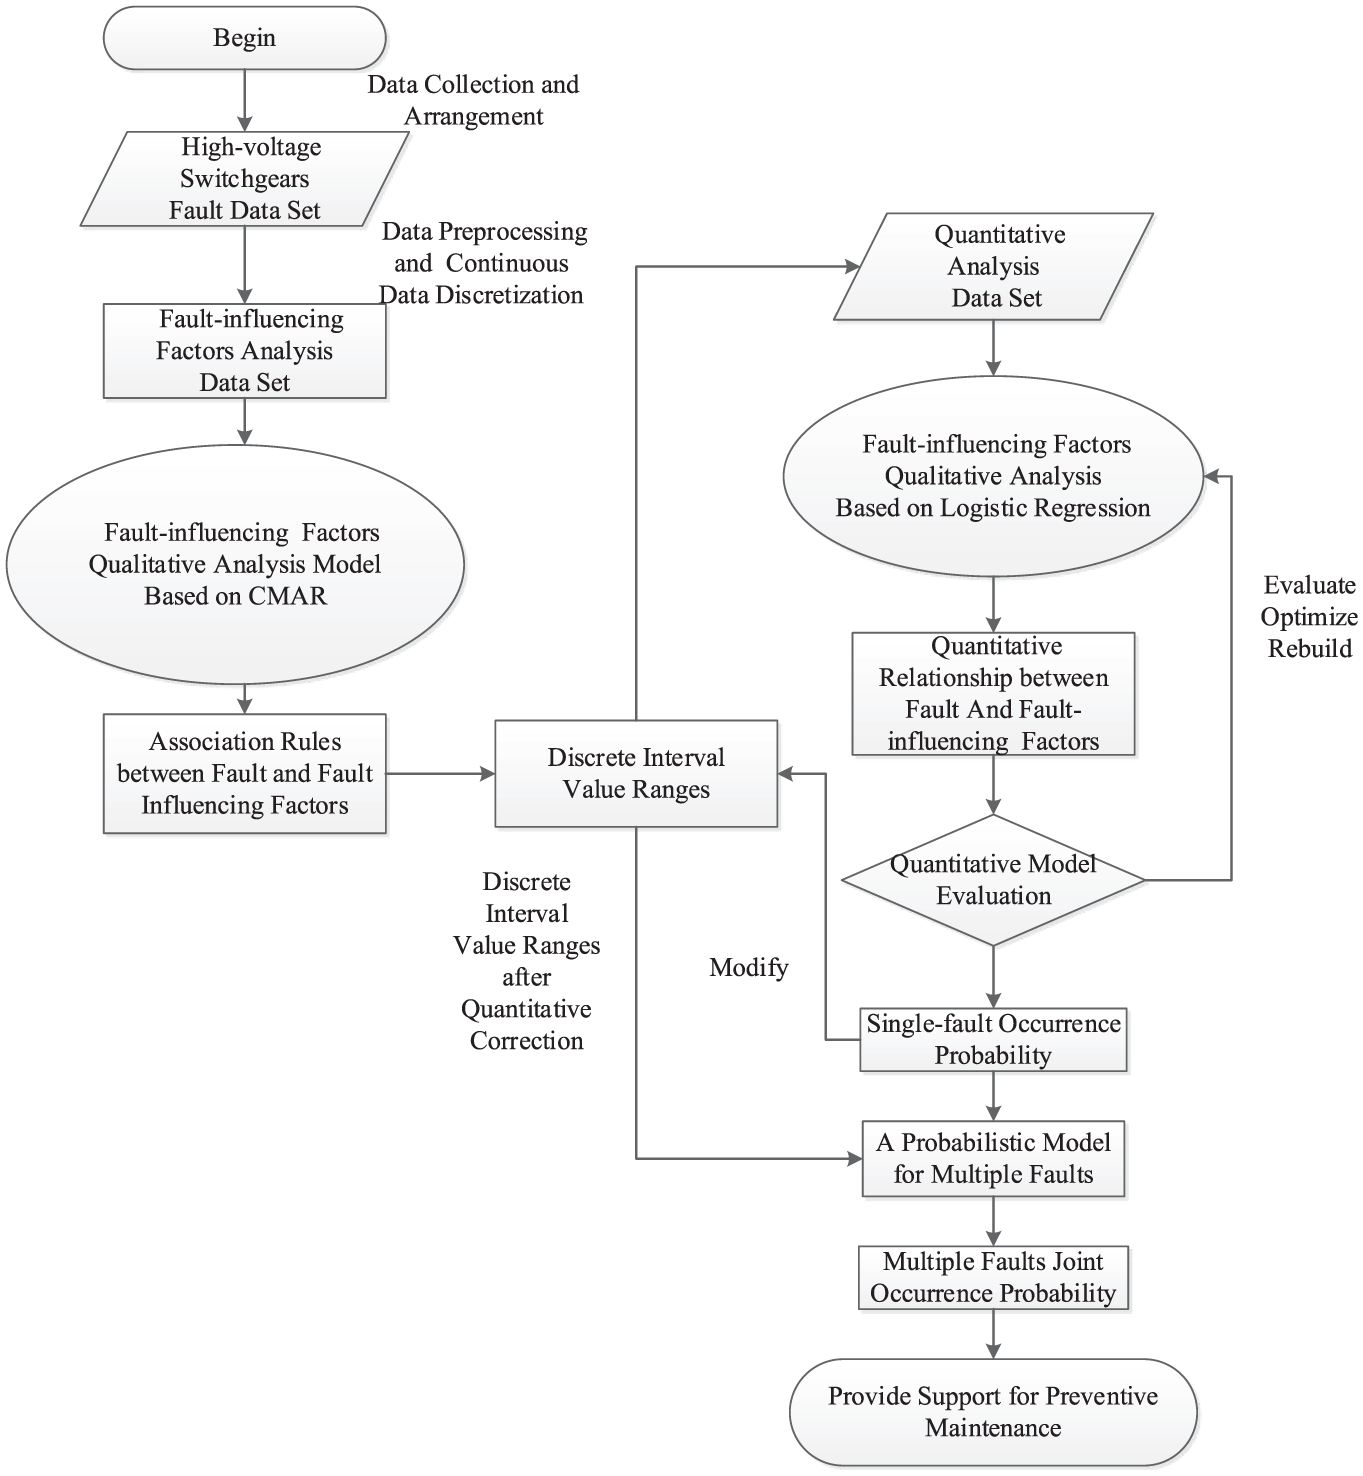
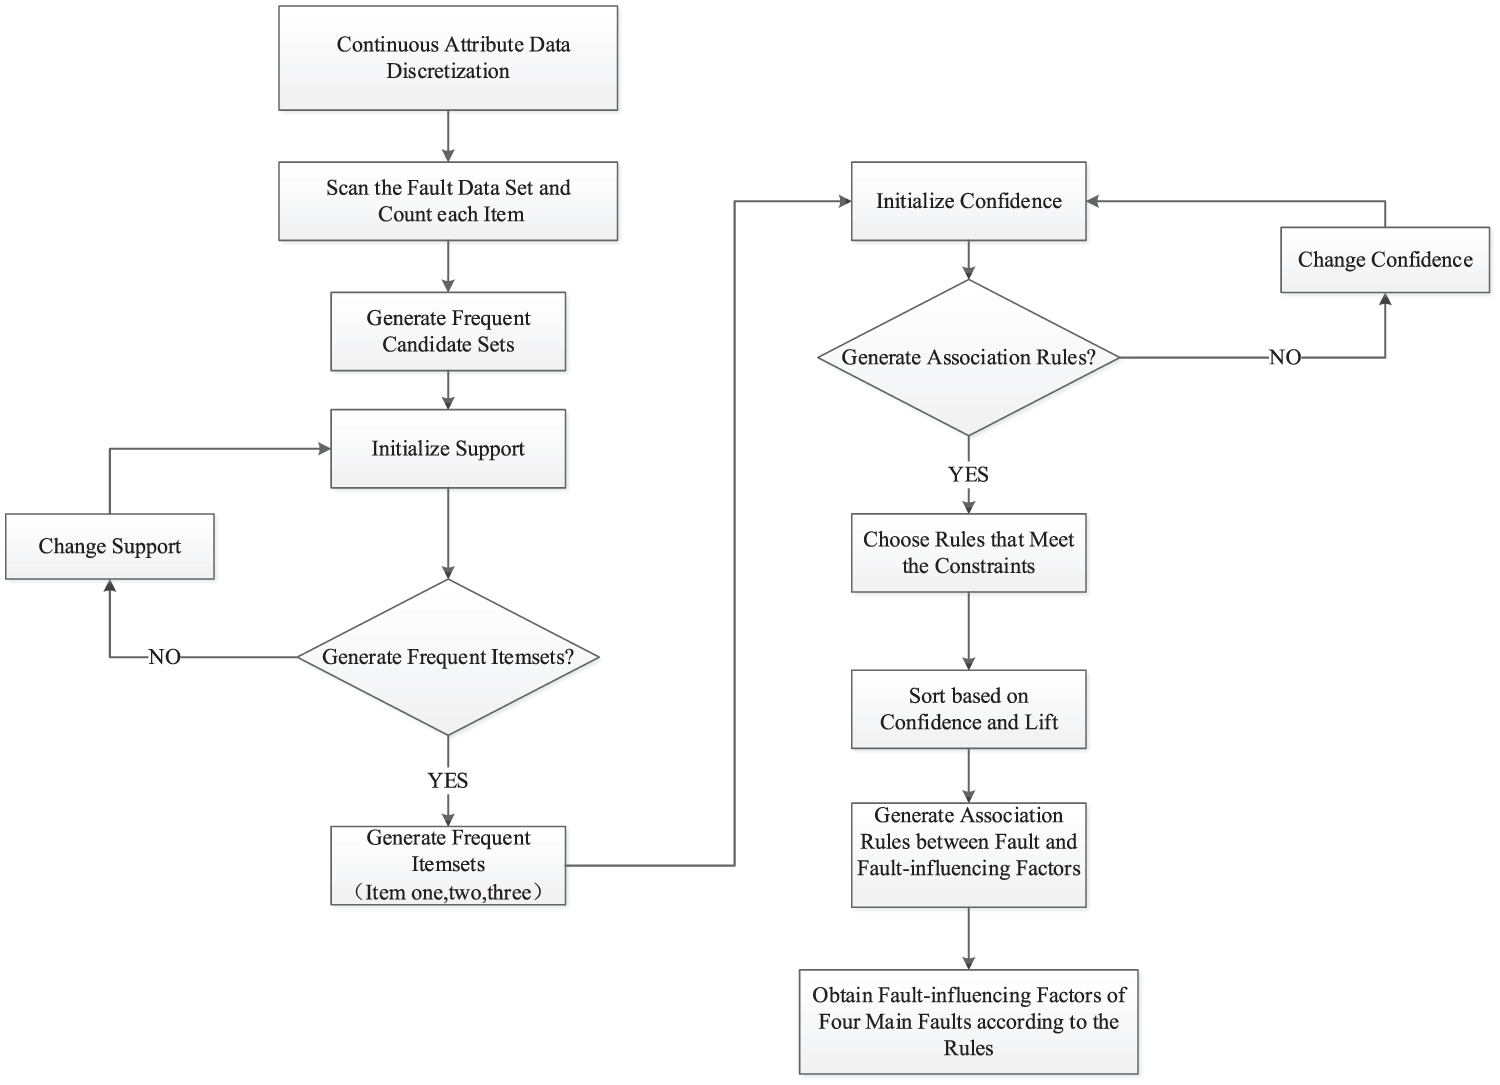
The main procedure of the proposed method is illustrated in Figure 1. The entire process can be divided into a qualitative stage and a quantitative stage on the basis of CMAR and logistic regression, respectively. The four key steps of the proposed method are as follows:
Data preparation: collect the whole life cycle fault data of high-voltage switchgears as the fault data set, the data set of fault-influencing factors analysis is built through data preprocessing and continuous data discretization.
Qualitative analysis: CMAR based on GMM as the qualitative analysis method is proposed to get association rules between faults and fault-influencing factors and can also get associated discrete interval value ranges.
Quantitative analysis: logistic regression, the quantitative analysis method, is proposed to obtain the single-fault occurrence probability, the data set of this method is the associated discrete interval value ranges obtained by qualitative analysis.
Intervals modification: modify the discrete intervals value ranges obtained by qualitative analysis using the single-fault occurrence probability and obtain the multiple-faults joint occurrence probability.
Method of qualitative and quantitative analyses based on CMAR and logistic regression.
Data resource processing and qualitative analysis based on GMM and CMAR
The fault data of high-voltage switchgears consist of continuous and discrete data. Before constructing a qualitative analysis model, all continuous attributes in the fault data need to be discretized. The CMAR method based on GMM is used to process data and supply data for qualitative and quantitative analyses.
1. Discretization of continuous attributes based on GMM.
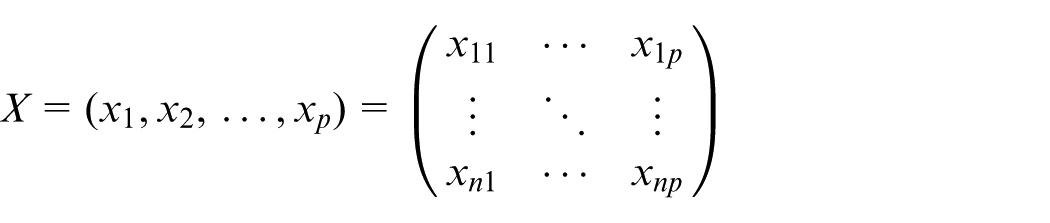
Assume that there is a group of fault-influencing factors, given observation is
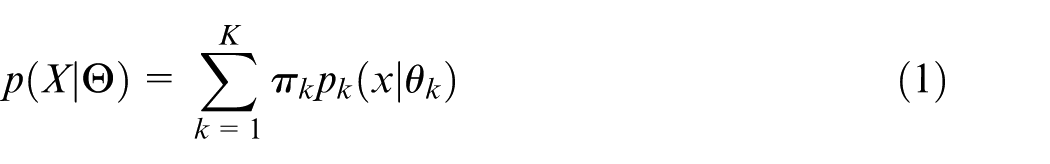
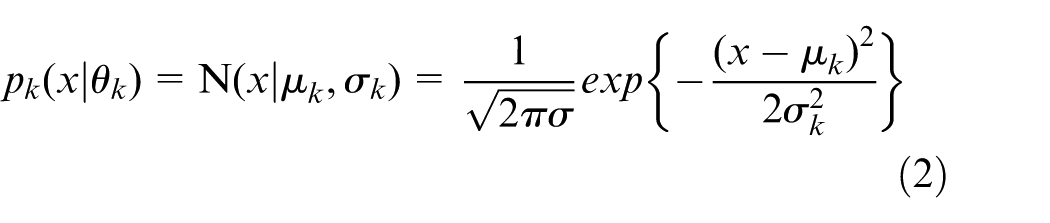
In these two equations,
The logarithm likelihood function
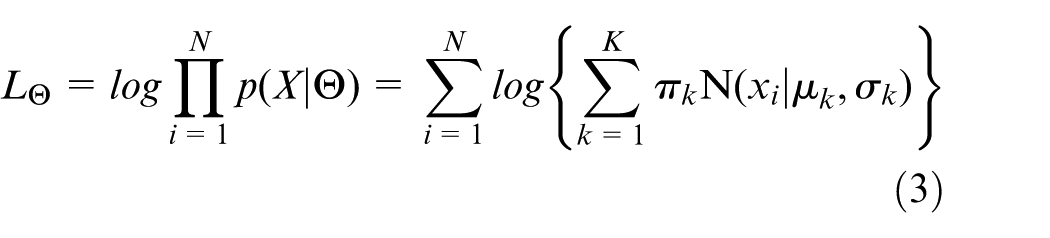
To achieve discretization of continuous attributes, the GMM is fitted by
2. Determination of the Optimal GMM by Bayesian Information Criterion
Typically, the number of mixed components of the GMM is determined in advance. A too great value of K means that the number of mixed components is large, then the error of the model fitting will be very small; however, the noise in the data can possibly lead to overfitting, whereas a small K will lead to underfitting, which cannot capture the underlying data trend.
Bayesian Information Criterion (BIC), developed by Bayesian theory, is a criterion for model selection. The main principle is to find the best evaluation criterion by means of model complexity and the ability of data interpretation. BIC is formally defined in equation (4)

where k represents the number of free parameters in the model space, which is composed of the parameter space
Continuous attributes fault data intervals are discretized by single variable. Assume that the continuous observation in fault data is
3. Construction of qualitative analysis model based on CMAR
The CMAR algorithm 27 is gradually developed on the basis of the classification-based association (CBA) method. 28 The CMAR algorithm and CBA algorithm are based on the Association Rules algorithm. CMAR is the transformation method of frequent pattern (FP)-growth that evolved from CBA, which can mine association rules sets satisfying the minimum support and minimum confidence, and several strong association rules are used to determine the class label of the new sample. Different from the traditional association analysis method, the classification method based on the association rules requires that the regular pattern be classified when mining frequent patterns, and such rules are called Class-Association Rules (CARs). CMAR is the classification method to mine a set of CARs. 29 The difference between CMAR and FP-growth is that FP-growth belongs to the Association Rule algorithm, and CMAR belongs to the classification algorithm. CMAR is a method to mine strong associations between the frequent attribute set and the class label based on the training sample, CMAR has a stricter requirement for the FP-growth construction process.
Main reasons for adopting CMAR in the qualitative model are the following points:
The fault data resource has the fault class label, which meets the need of Supervised Learning. This method is more suitable compared with simply using the Association Rules method for the scenario discussed in this article and switch equipment data.
The classifier obtained by CMAR is a descriptive model with the rule class and easy to understand. It is suitable for fault-influencing factors qualitative analysis and can be used to construct the rule-based qualitative analysis model.
CMAR combined with FP-growth is very suitable for fault-influencing factors qualitative analysis compared with the traditional CBA method, which greatly improves the running efficiency and adapts to the large-scale data set.
As shown in Figure 2, the analysis based on CMAR is roughly divided into two parts, first, mining strong relationship between frequent attribute sets and class labels according to high-voltage switchgears training samples, association rule sets based on fault classes are generated and stored in the CR-Tree (Class Rules Tree), then, the rules that conform to constraint conditions are selected on the basis of the association rules and sorted by confidence and lift, thereby, the qualitative fault-influencing factors are obtained.
Fault-influencing factors qualitative analysis based on CMAR.
CMAR can be used to deal with the high-voltage switchgears data more effectively, which can improve the effectiveness of fault-influencing factors analysis. Because of its nature of supervised learning, rule sets contained in the classifier based on CMAR can fully excavate discrete interval value ranges, so the larger the data set, the more accurate the mining result will be.
The calculation process is as follows:
Browse the data set of fault-influencing factors, find out the “attribute-classification” set F which satisfies the given minimum support (minsup), as shown in Table 1.
Sort F in descending order by support count, the highest frequency “attribute-classification” pair appears first in the rule sets.
Browse the data set S for a second time and establish the CR-Tree with class labels. For each transaction Tk in S, put each “attribute-classification” pair corresponds to F in the CR-Tree and insert the class label of Tk while the last “attribute-classification” pair is inserted.
The frequent patterns are excavated from the bottom to the top. In the cyclic process, classifying the class condition of the node to the parent node, which is similar to the generation of frequent patterns in the FP-Tree, the frequent patterns with the class labels are finally obtained. 27
Frequent rules set F of “attribute and classification.”
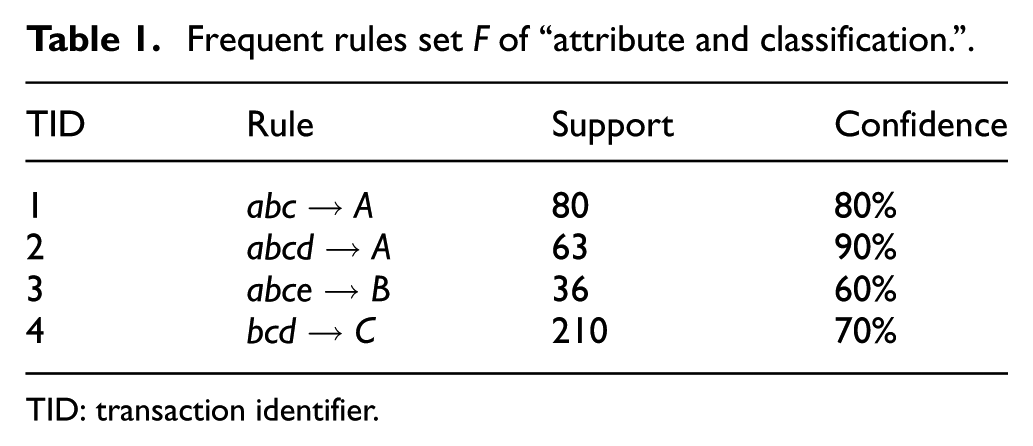
TID: transaction identifier.
Fault-influencing factors quantitative analysis of the single-fault occurrence probability and the multiple-faults joint occurrence probability based on logistic regression
On the basis of qualitative analysis, the quantitative analysis model is built for occurrence probability to get the quantitative relationship between fault and fault-influencing factors, including the construction of quantitative data set, the quantitative analysis based on logistic regression, 30 and the regression evaluation.
Build a quantitative data set. Filter samples and build the quantitative data set for each fault with reference to discrete interval value ranges.
Construct a quantitative analysis model based on logistic regression. Compared with the traditional linear regression with continuous dependent variables, the dependent variable of logistic regression is a discrete variable, so it is a generalized linear regression, and there are many similarities between logistic regression and multiple linear regression analysis. Their model forms are essentially the same with WTX + b, where W is a parameter matrix with coefficients to be evaluated, and b is a constant parameter vector. For logistic regression, the function L (logistic function) corresponds WTX + b to a state p, where p = L(WTX + b), and determines the value of dependent variables according to the number of p and 1 –p. The relationship between different parameters and the causes of defects are obtained by regression analysis, and the quantitative relation is described by the logistic regression equation in the range of certain confidence intervals.
The analysis steps of the application of the logistic regression algorithm to get the single-fault occurrence probability and the multiple-faults joint occurrence probability are as follows:
In the case of missing data, samples with serious missing data in the main dimensions will be removed. When the missing data are not serious, the mean method and mode method can be used to complete the data.
In the case of possible outliers, the probability model of the data distribution is assumed beforehand based on the characteristics of the data set, and then the exception is determined according to the inconsistency of the model on a significant level, which is directly deleted for the determined exception value.
For eliminating differences caused by different dimensions of the continuous attributes data, it is necessary to reduce and normalize the data to the same scale.
First, determine the dependent variable, and the dependent variable is the fault type according to the target.
Second, determine the independent variable, and all factors other than fault are listed as independent variables according to data conditions.
The fault type of high-voltage switchgears is represented by
The fault regression model is the logistic regression model as shown in equation (5)
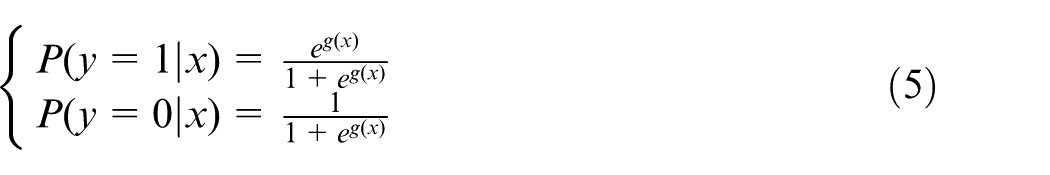
where
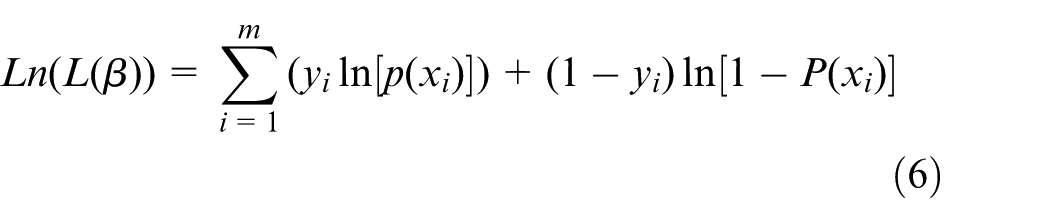
Because the dependent variable of logistic regression is fault type, and it is a discrete variable, the least squares estimation is no longer applicable, the maximum likelihood estimation is used to determine the regression parameters, and the logarithm likelihood function is defined as equation (6)
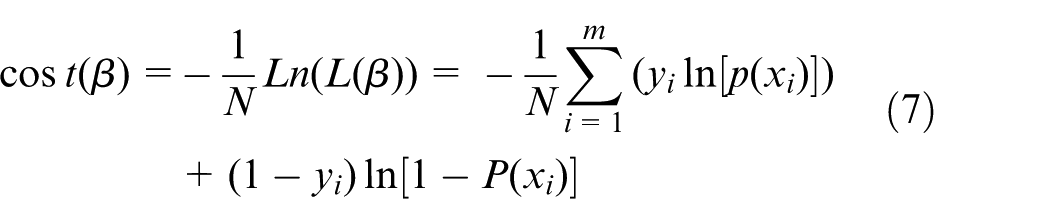
where m represents the number of data, P(xi) represents the fault occurrence probability, and according to the principle of extremum in differential calculus, the loss function is equation (7). Taking the minimum value of the loss function and coefficients in this condition as the final regression coefficients, the fault occurrence probability of different fault-influencing factors can be obtained as
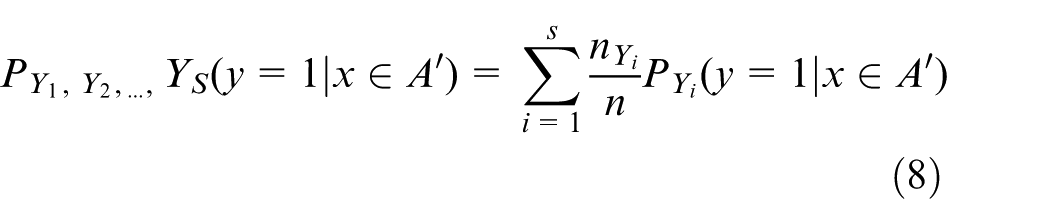
Based on the quantitative analysis of single fault, a joint probabilistic model of multiple faults is designed. For the fault-influencing factor, Xi, A is the discrete interval data set of s kinds of fault Y1, Y2, …, YS obtained by qualitative analysis, and A′ is obtained by modifying A according to the single-fault occurrence probability calculated in step 4. Y1, Y2, …, YS represent the probability of fault Y1, Y2, …, YS that occur together, the joint occurrence probability is calculated as equation (8)
3. Analysis and evaluation of regression results
Evaluate the regression and determine the rationality of the result, and finally obtain fault-influencing factors and their weights. In this article, the likelihood ratio (LR) test method is used to test the overall significance of the model. The measured statistic LR is defined as equation (9)

where ln L represents the logarithm likelihood function value of the maximum likelihood estimation for the logistic regression model, and ln L0 represents the logarithm likelihood function value of the model only with estimated intercept. By calculating the statistical P value of LR, we can get the probability of the sample observation results when the hypothesis model is with intercept only. If the P value is very small, the occurrence probability of the original assumption is very small, so the original hypothesis according to the small probability principle is rejected, and the model fitting effect can be determined as significant. When the test results show that the model is significant, the variables of the regression model can be used to filter the fault-influencing factors.
Application case of high-voltage switchgears fault-influencing factors analysis
Data processing and qualitative analysis based on GMM and CMAR
1. Data processing based on GMM and CMAR
The method proposed in this article is applied to analyze fault-influencing factors of SF6 HVCBs. The mechanical fault of SF6 HVCBs accounted for 70%, the auxiliary and control loop fault accounted for 19%, the main circuit electrical fault accounted for 11%, and main faults of SF6 HVCBs are “operating mechanism fault” and “SF6 leakage.” According to the actual business situation, fault types of SF6 HVCBs are divided into five categories, namely, “other faults” (F1), “operating mechanism anomaly” (F2), “SF6 leakage” (F3), “auxiliary components damage” (F4), and “main components deterioration” (F5), where the “operating mechanism anomaly” indicates the abnormal mechanism and abnormal transmission system.
The SF6 HVCBs fault sample data set mainly comes from the record of the problem of breakers failure in multiple regions by a power supply company. Its information attributes of fault data samples are shown in Table 2, mainly composed of equipment parameter information, environment parameter information, operation parameter information, and fault type information, in which the number of discrete attributes is 7, and the number of continuous attributes is 4.
Information attributes of samples data.
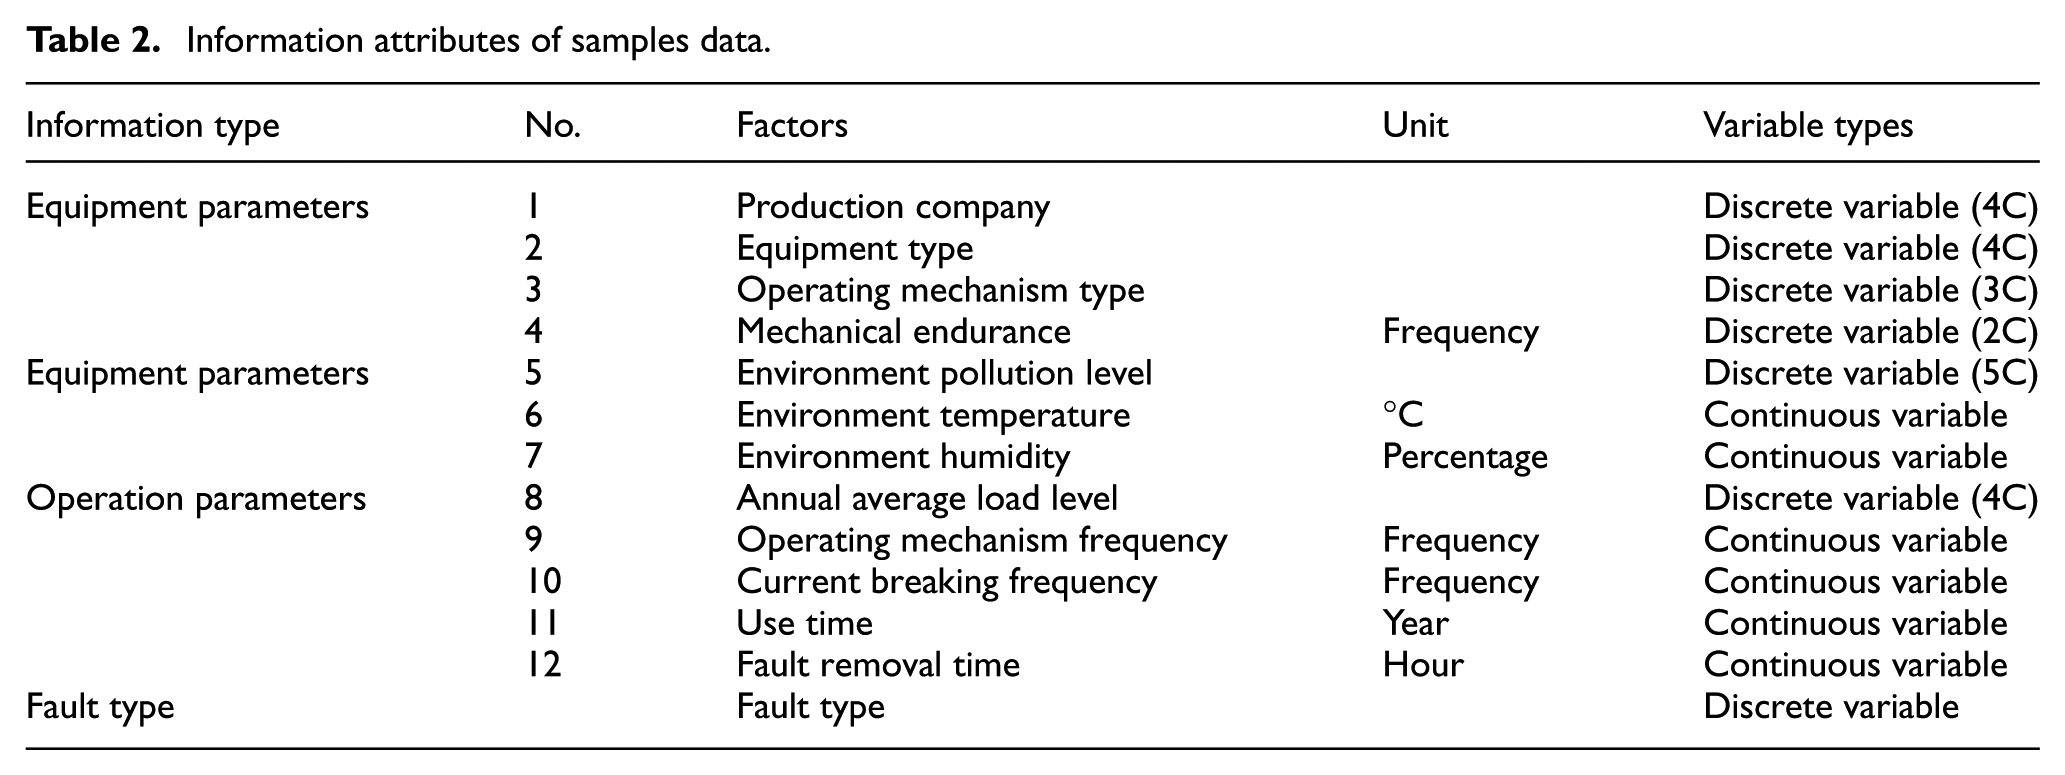
The fault sample data of high-voltage switchgears from region 1 are shown in Table 3, and all attributes are restricted in the constraint conditions according to the specific business conditions. For example, for the discrete variable “operating mechanism type,” its value can only be one of the three values “MecType1,”“MecType2,” and “MecType3”; for the continuous variable, “environment temperature,” the operating temperature of HVCBs should meet −40°C to 40°C according to the GB standard, so taking −45°C to 45°C as the range of this attribute, thus, not in this interval, are abnormal values. Value detection of all other attributes follows this method and eliminates these exceptions. The multiple interpolation method is used to calculate and interpolate the missing values of continuous attributes, and four complete data sets are generated after calculating for four times, and then the regression prediction method is used to fill continuous missing values. The discrete attributes are filled with the mode of attributes, for example, such as the missing value of “environment pollution level,” which is filled by the highest frequency d-level.
Fault sample data set 1 of high-voltage switchgears operation process (part).
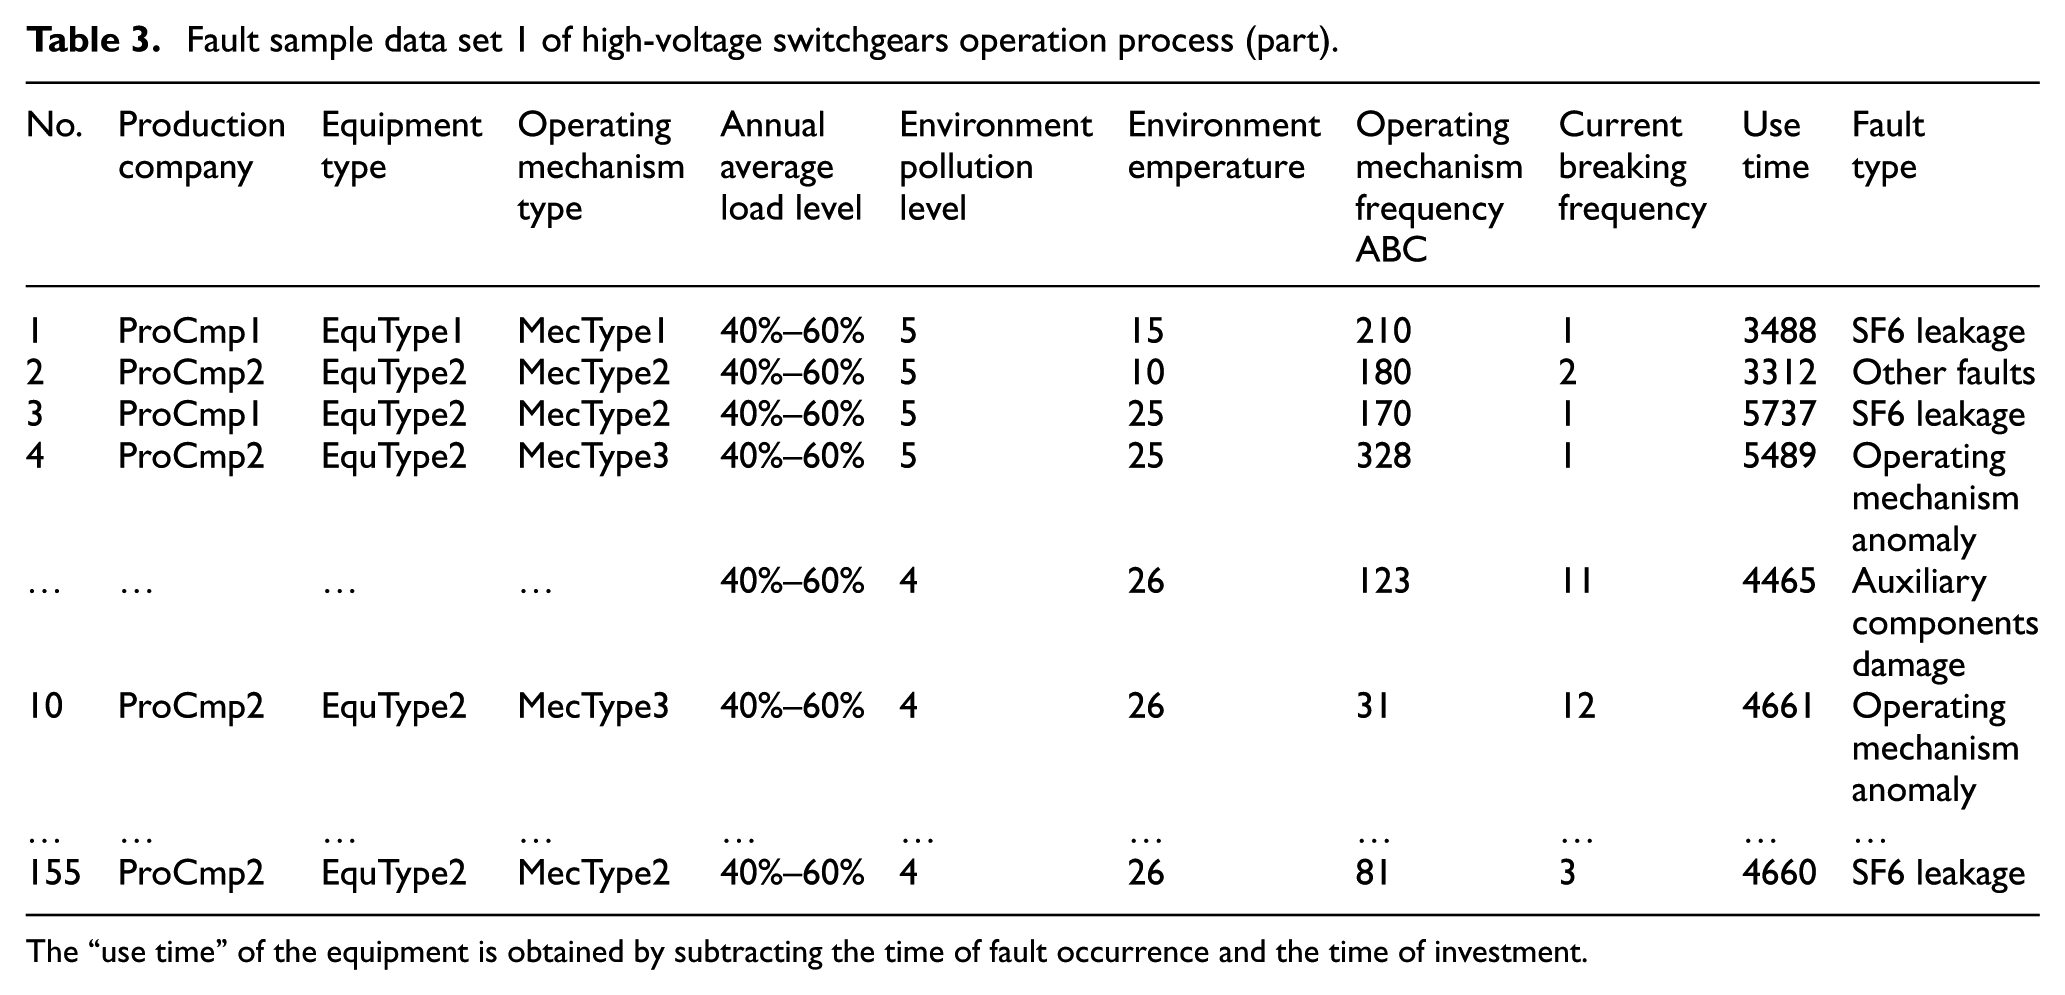
The “use time” of the equipment is obtained by subtracting the time of fault occurrence and the time of investment.
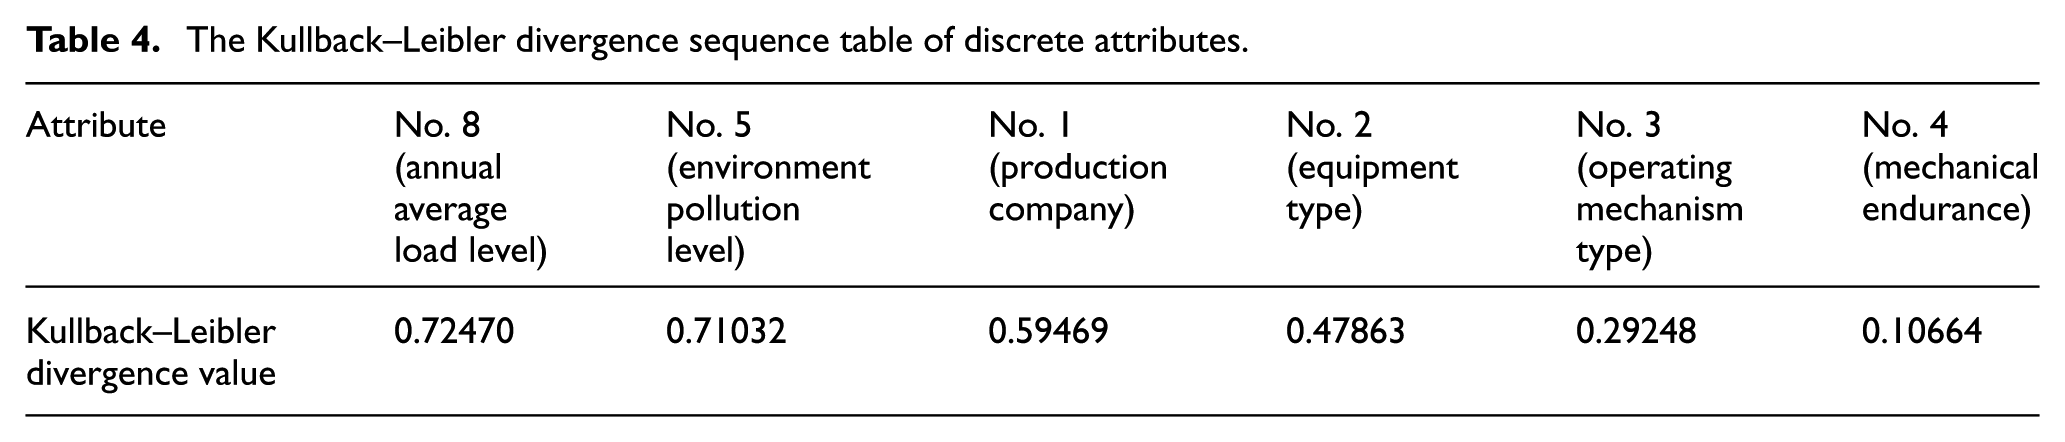
PCA is used for continuous attributes reduction. Continuous attributes are nos. 6, 7, 9, 10, 11, and 12, and the cumulative contribution rate of these four attributes, nos. 6, 9, 10, and 11, is 0.987, so these four attributes are selected as the main components and subset of continuous attributes reduction. For discrete attributes, the Kullback–Leibler divergence is used to reduce attributes; calculate the Kullback–Leibler divergence of all continuous attributes at first, and sort them in descending order; results are shown in Table 4, and the first two attributes are chosen as the subset of feature selection. The discrete attributes removed by attributes reduction are nos. 1, 2, 3, and 4, and nos. 5 and 8 as two discrete attributes were kept. The attributes in the data set after attributes reduction are nos. 6, 9, 10, 11, 5, and 8.
The Kullback–Leibler divergence sequence table of discrete attributes.
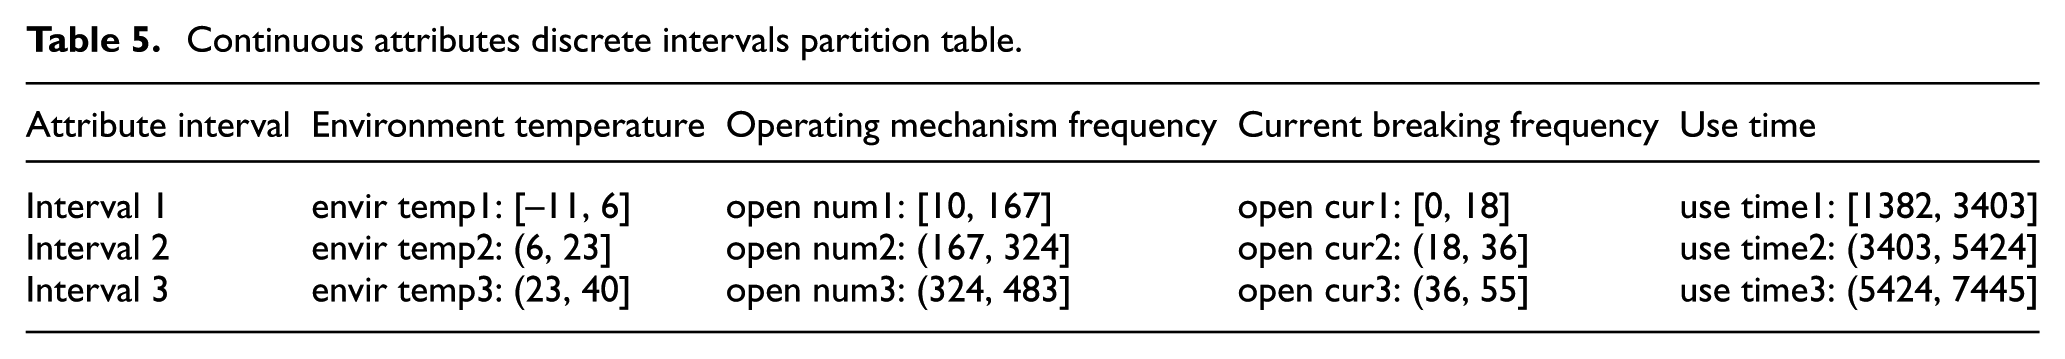
The discretization of continuous attributes is clustered by GMM, and the number of mixed components of the GMM is
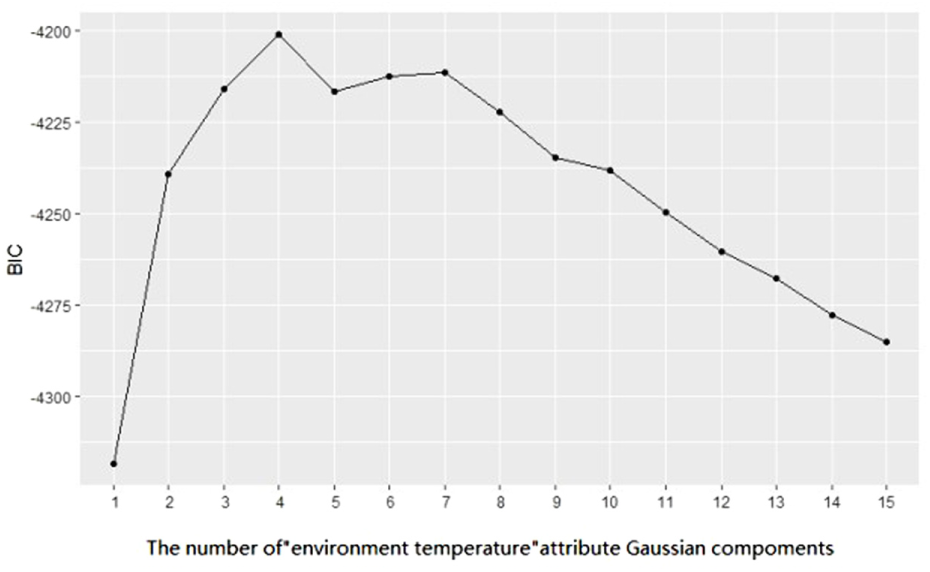
The BIC value of Gaussian Mixture Model of “environment temperature.”
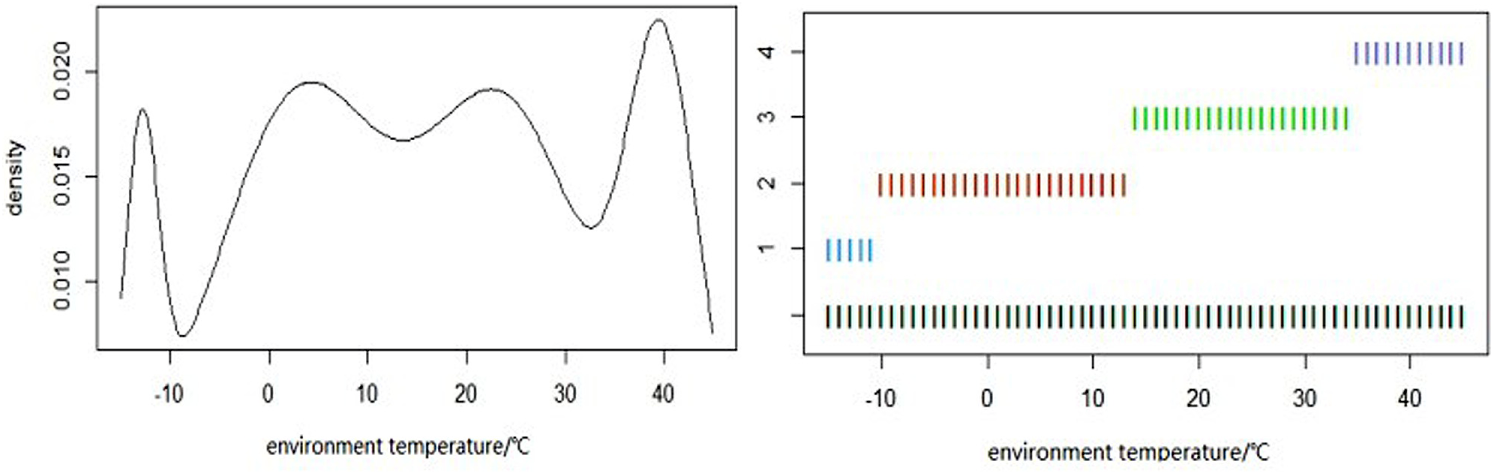
Density curve (left) and clustering samples (right) of “environment temperature.”
Continuous attributes discrete intervals partition table.
2. Qualitative analysis based on GMM and CMAR
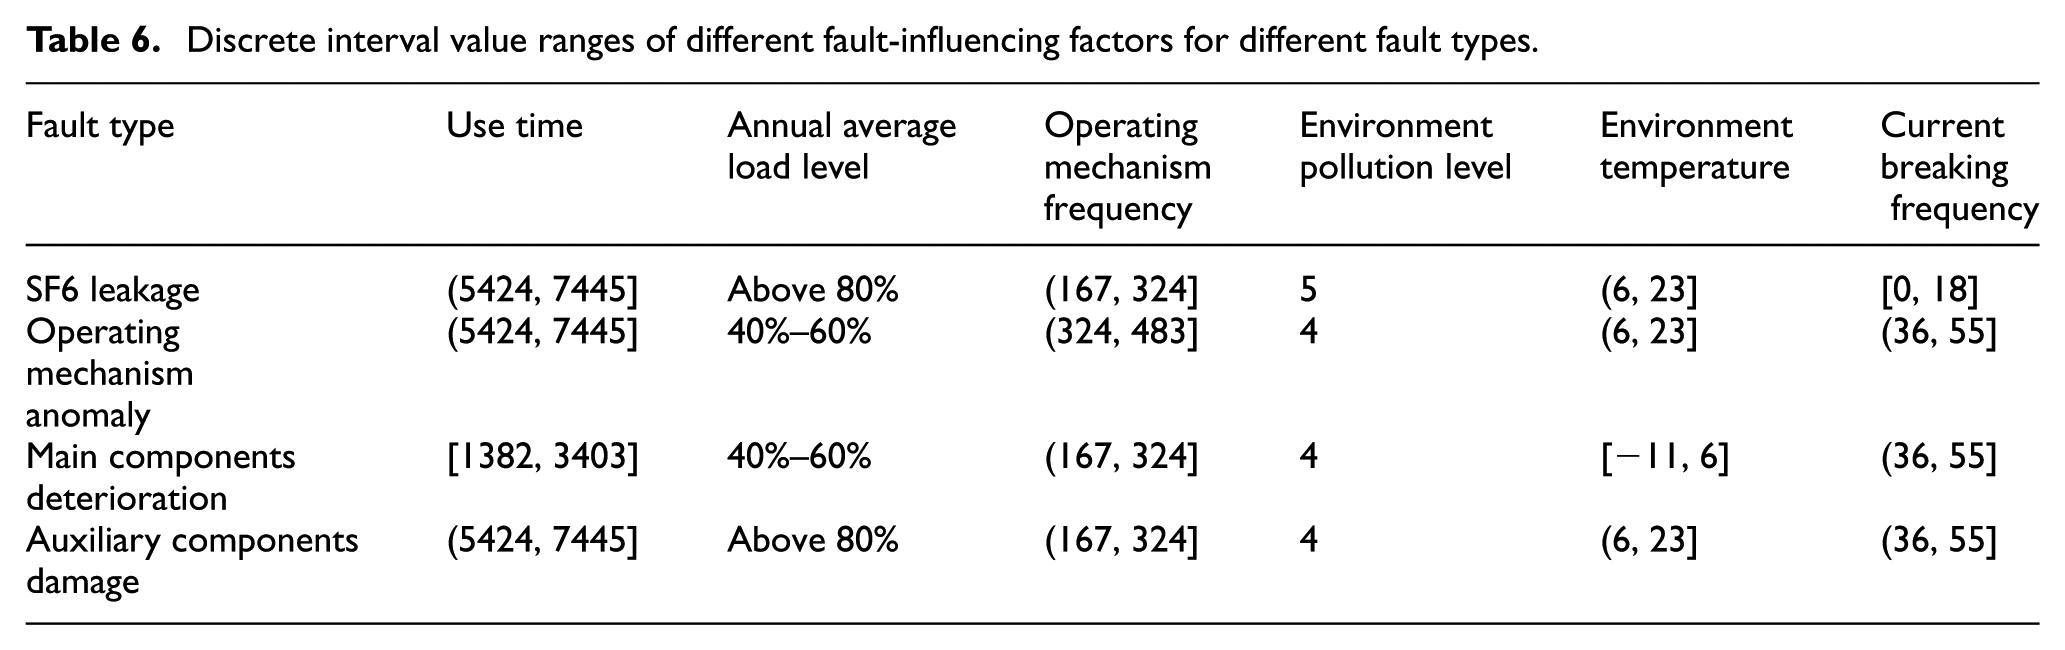
Calculated by CMAR, the obtained results are shown in Table 6 with relatively high confidence and support, and lift is more than 1, we can see clearly the discrete interval value ranges of different fault-influencing factors.
Discrete interval value ranges of different fault-influencing factors for different fault types.
Fault-influencing factors quantitative analysis of multiple-faults joint occurrence probability
1. Quantitative data sets
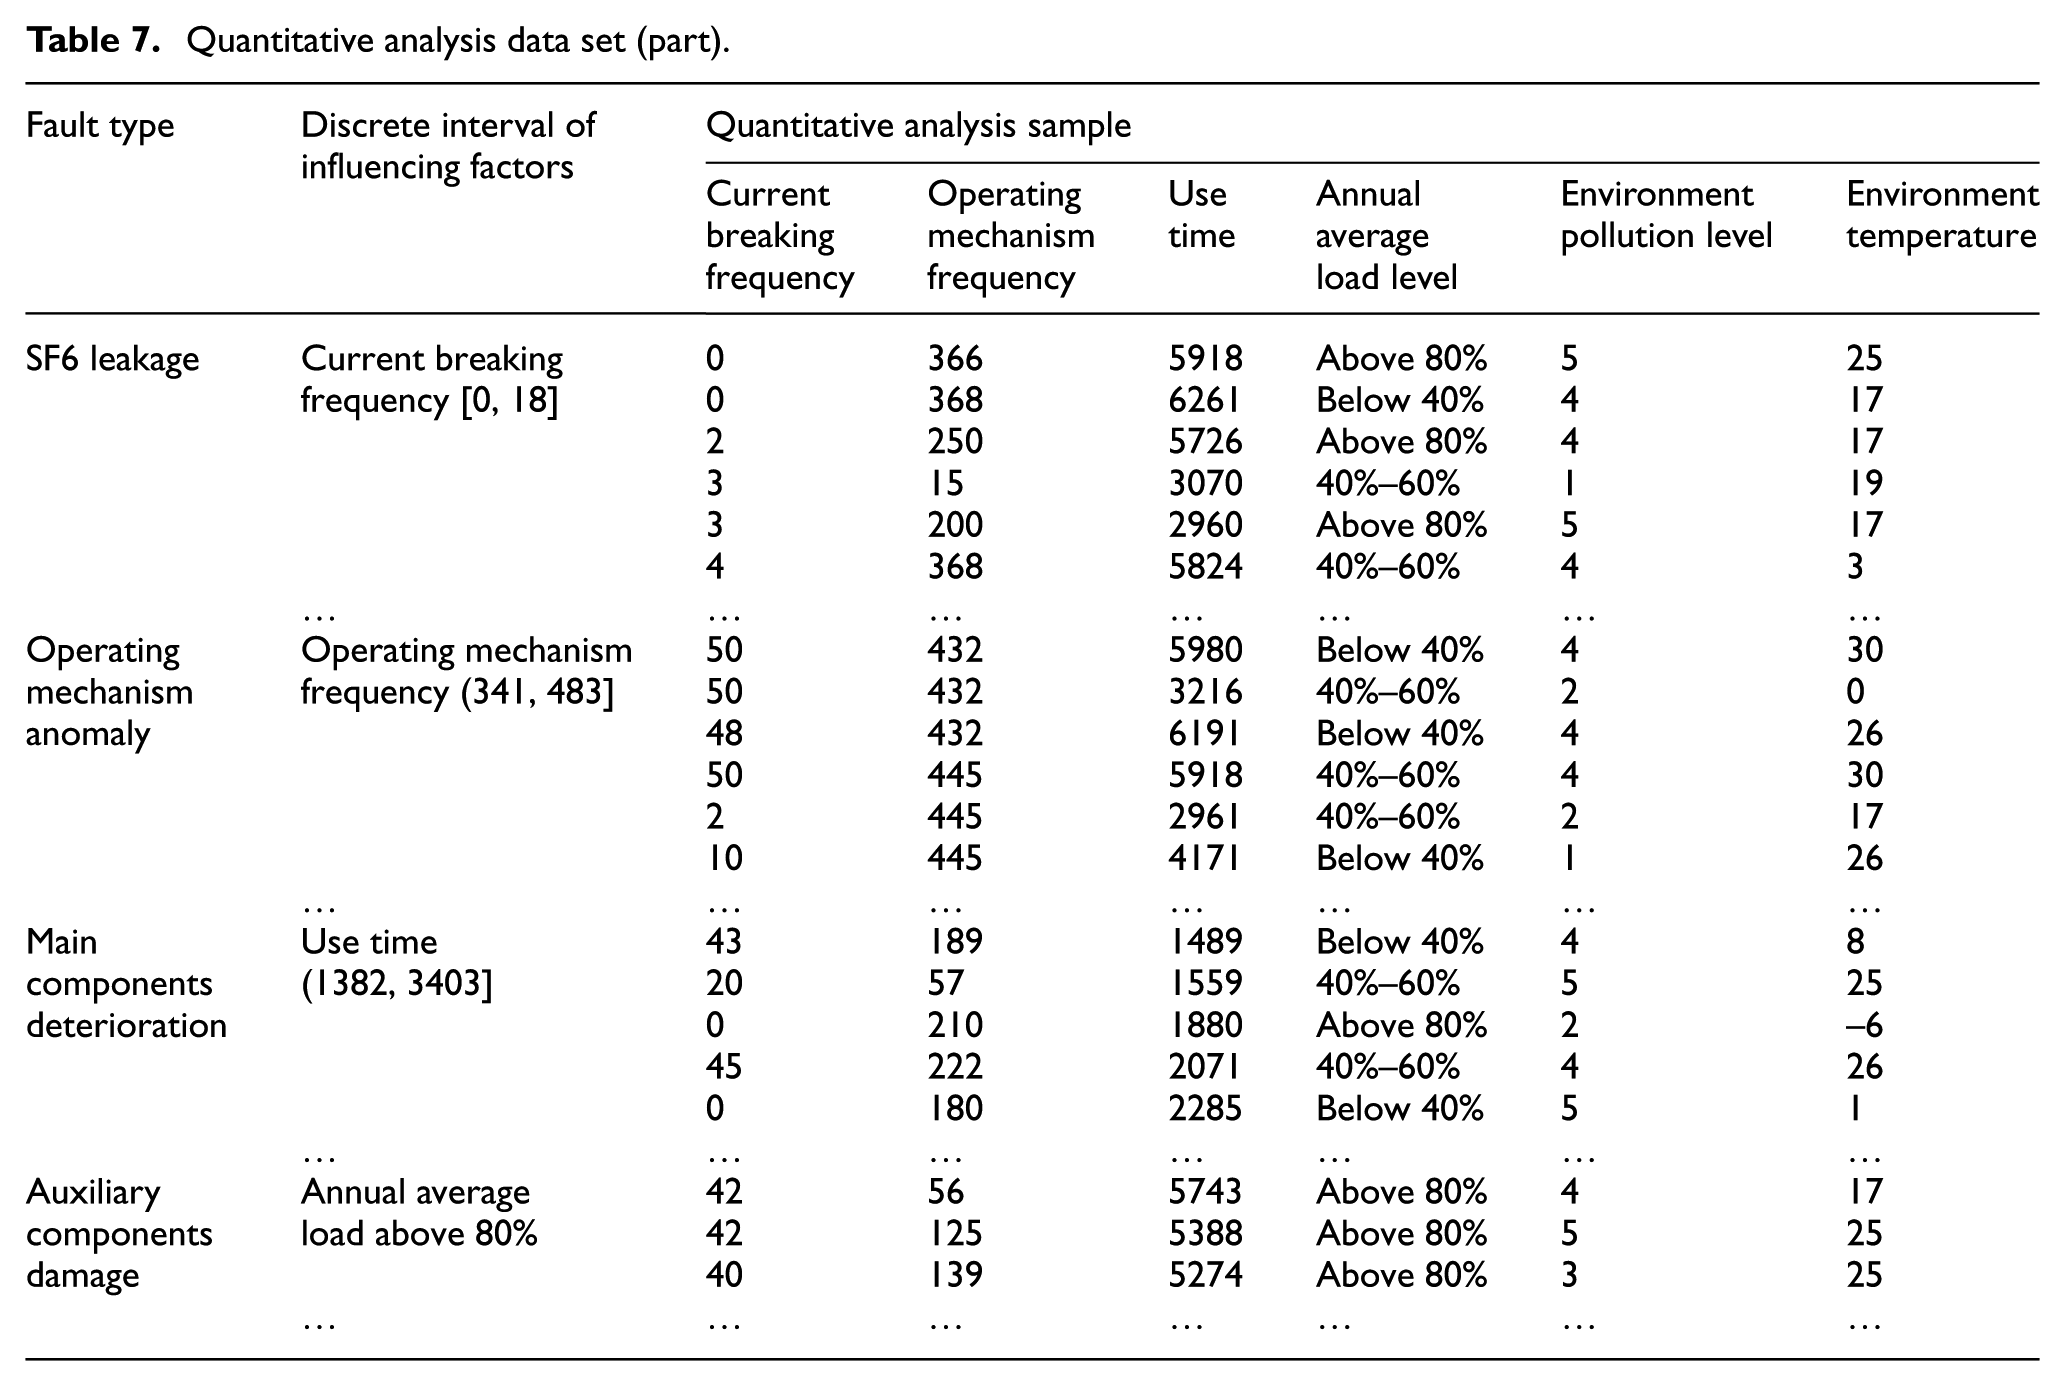
Quantitative data sets are filtered in sample space according to the discrete interval value ranges as shown in Table 6. For fault type “SF6 leakage,” the discrete interval value range of “current breaking frequency” is [0, 18], the number of its filtered data entries is 10; the discrete interval value range of “operating mechanism frequency” is [167, 324], the number of its filtered data entries is 9; the discrete interval value range of “use time” is [5424, 7445], the number of its filtered data entries is 14; whereas “annual average load level” is above 80%, the number of its filtered data entries is 8; “environment pollution level” is 5, the number of its filtered data entries is 5; and when the discrete interval value range of “environment temperature” is [6, 23], the number of its filtered data entries is 12; and the total number of filtered data entries for “SF6 leakage” is 58. The method of quantitative data screening for other fault types is the same, and finally get 473 entries of quantitative analysis sample data, as shown in Table 7.
Quantitative analysis data set (part).
2. Fault-influencing factors quantitative analysis of the multiple-faults joint occurrence probability based on logistic regression
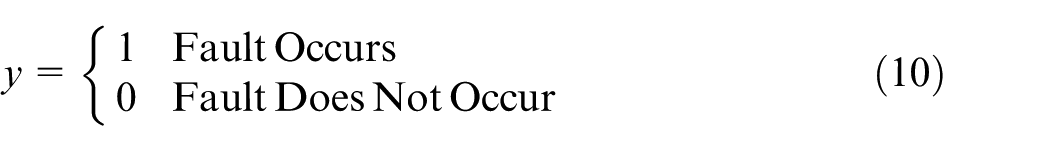
There are five types of fault in this instance: “operating mechanism anomaly,”“auxiliary components damage,”“SF6 leakage,”“main components deterioration,” and “other faults.” When there is 1 fault occurrence, and 0 no fault occurrence, as shown in equation (10)
Define

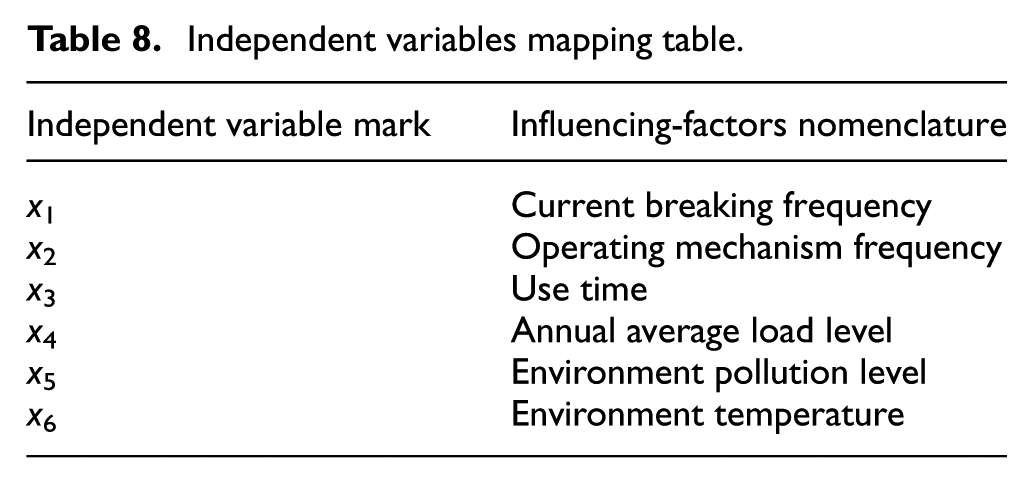
y represents dependent variables, which is fault; independent variables are shown in Table 8.
Independent variables mapping table.
According to Table 7, the quantitative analysis model of “operating mechanism anomaly,”“auxiliary components damage,”“SF6 leakage,” and “main components deterioration” is established to conduct quantitative analysis.
1. Calculation of the single-fault occurrence probability
When “operating mechanism anomaly” occurs, the range of “current breaking frequency” is 36–55, establishing the regression equation with “operating mechanism anomaly” as dependent variable and independent variables are “current breaking frequency,”“operating mechanism frequency,”“use time,”“annual average load level,”“environment pollution level,” and “environment temperature” based on equation (5), and the following linear regression equation is obtained according to equations (6) and (7)
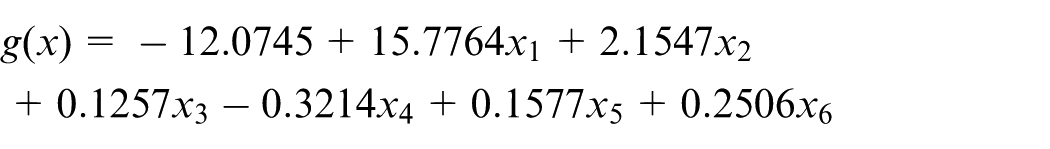
In the statistical test, the confidence usually takes 0.1, judging the significance of attributes in terms of confidence, and eliminating x2, x3, x4, x5, and x6, these five independent variables: “operating mechanism frequency,”“use time,”“annual average load level,”“environment pollution level,” and “environment temperature,” and reestimating weight coefficients after elimination.
Finally, the following regression equations are obtained
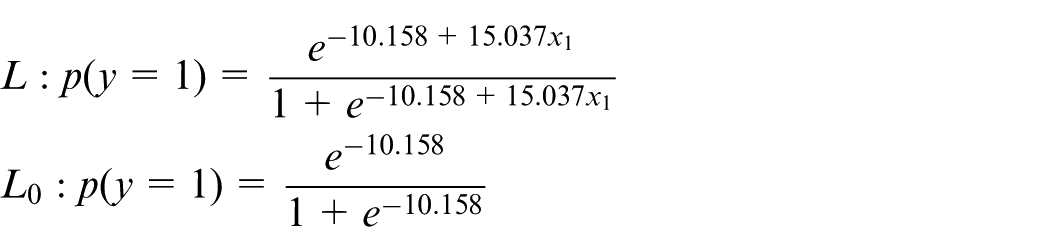
According to equation (6), the logarithm likelihood value of L is ln L = –0.007575845, the logarithm likelihood value of L0 is ln L0 = –10.15803876, and then the test statistic is obtained based on equation (9)
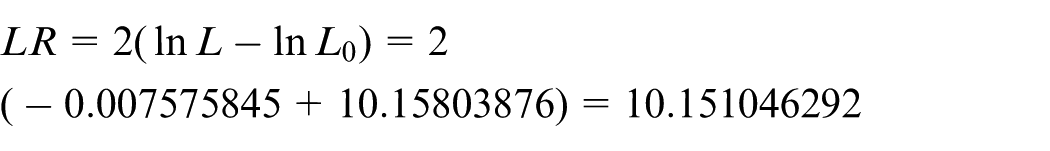
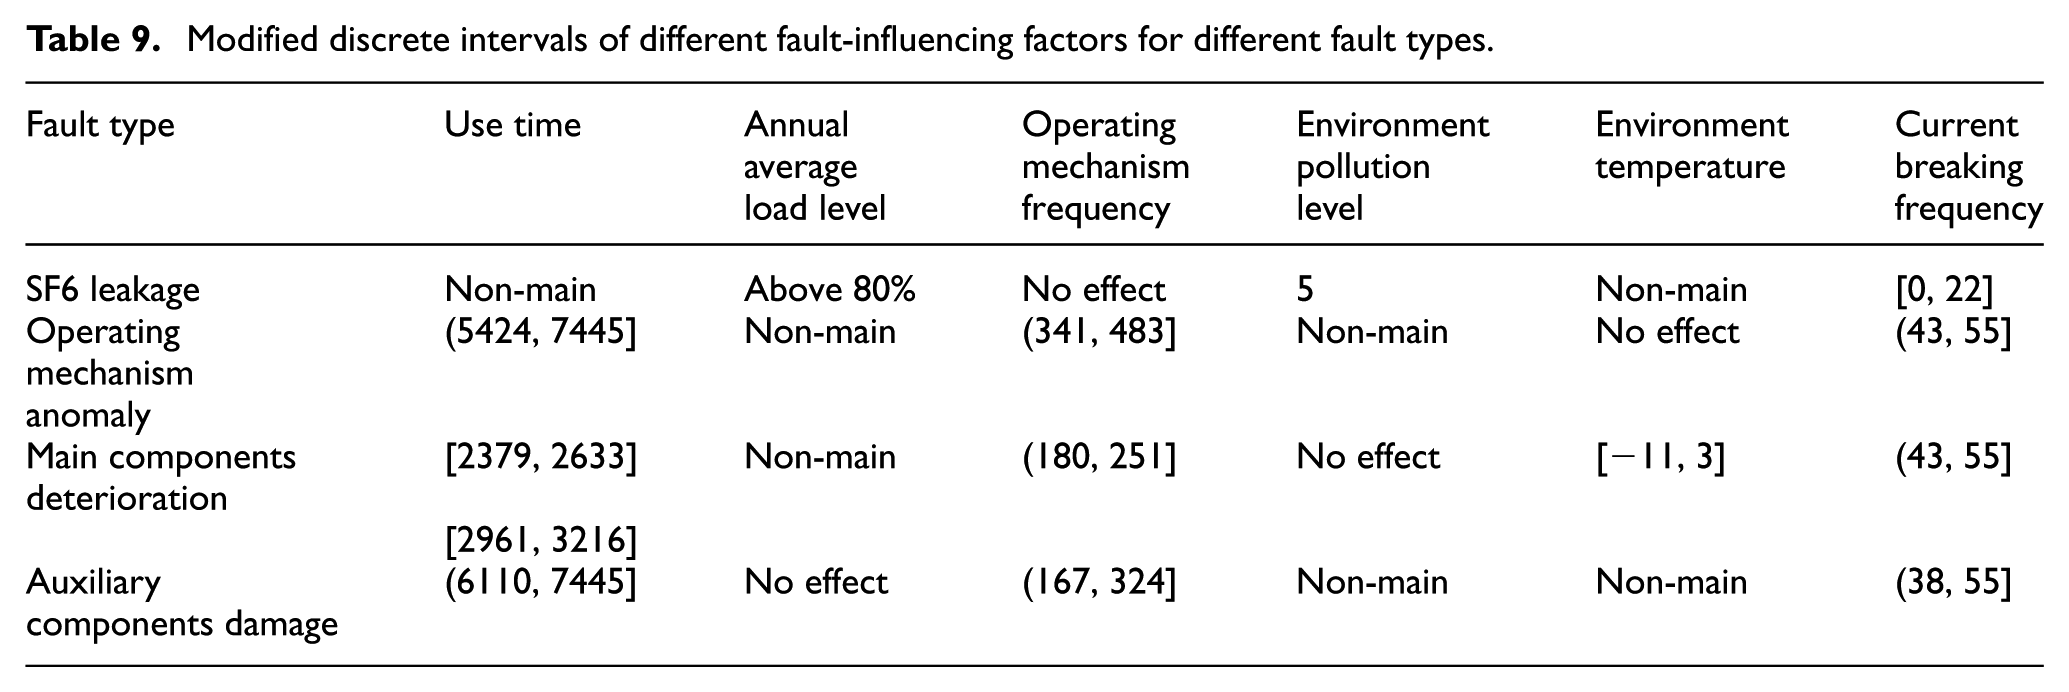
Because the value of LR is small, it is proved that L is significant, and the model fitting effect is good. When the range of “current breaking frequency” is 36–55, the quantitative effect on “operating mechanism anomaly” is shown in Figure 5. When the normalized value of “current breaking frequency” is below 0.763636, that is, the range of “current breaking frequency” is 36–43, and the occurrence probability of “operating mechanism anomaly” approaches 0, the fault will not occur; when the normalized value of “current breaking frequency” is above 0.763636 with corresponding discrete interval value range 43–55, and the occurrence probability approaches 1, fault is likely to occur in this interval, so it is necessary to pay more attention and prepare for fault repair in advance. For the analysis of “SF6 leakage,”“operating mechanism anomaly,”“auxiliary components damage,” and “main components deterioration” caused by “current breaking frequency” are the same as above. The final discrete interval value ranges are shown in Table 9.
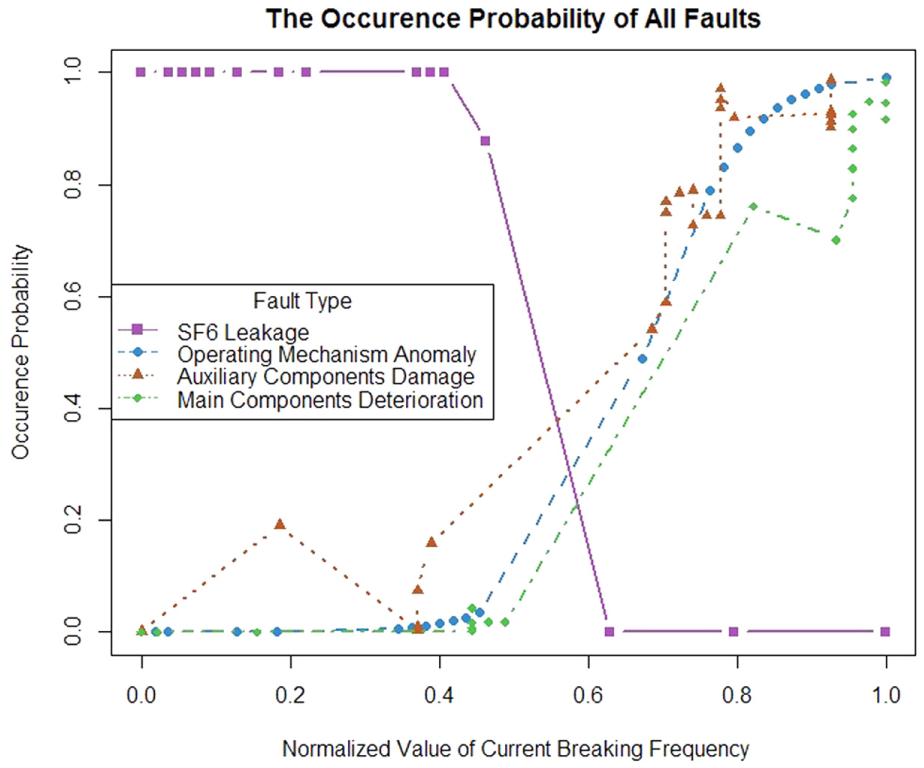
Curves of all faults occurrence probability under “current breaking frequency.”
Modified discrete intervals of different fault-influencing factors for different fault types.
The analysis process of the occurrence probability of “operating mechanism anomaly” is the same as the abovementioned detailed analysis, and the results are shown in Figure 6; the analysis shows that the occurrence probability will not exceed 0.5 no matter what ranges “annual average load level,”“environment pollution level,” and “environment temperature” are, it can be considered that these three factors are not the main factors affecting this fault. Also, when the range of “operating mechanism frequency” is 341–483, current breaking frequency” is 43–55, and “use time” is 5824–7445, the fault occurrence probability is close to 1, so these three fault-influencing factors are the main factors and need to be monitored during the operation of switchgears.
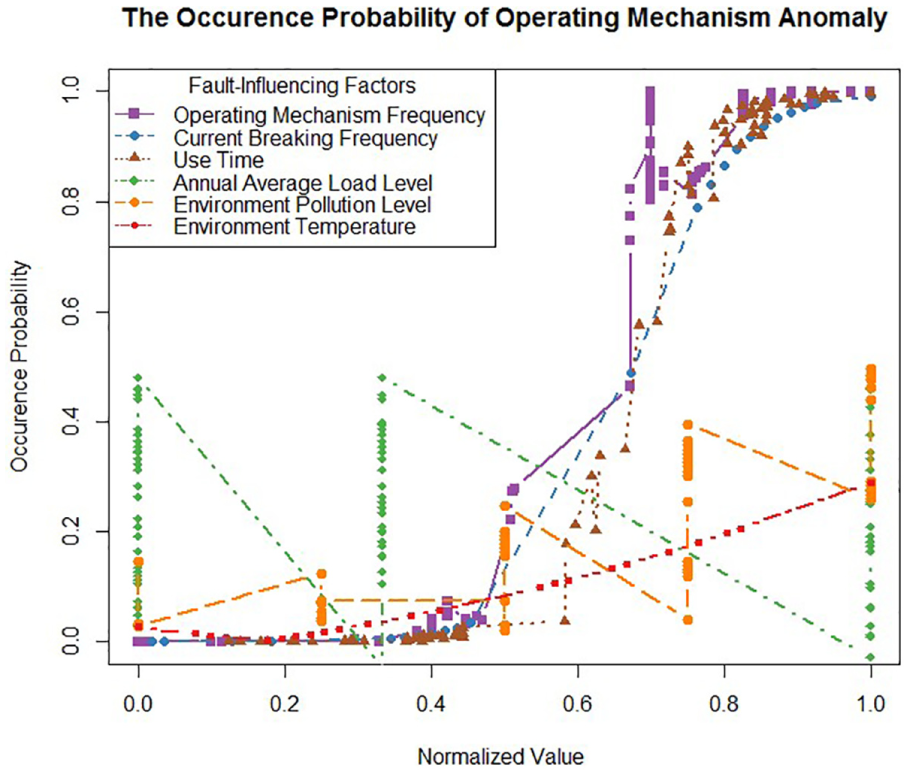
The occurrence probability of “operating mechanism anomaly” for different fault-influencing factors.
2. Calculation of multiple-faults joint occurrence probability
Calculation of the multiple-faults joint occurrence probability is based on the modified discrete interval value ranges. As shown in Table 9, “current breaking frequency” can cause “operating mechanism anomaly,”“main components deterioration,” and “auxiliary components damage” kinds of faults, and the common range of “current breaking frequency” is 43–55 obtained by quantitative calculation. The joint occurrence probability is calculated according to equation (8), when the joint occurrence probability is very high, it is necessary to focus on the fault occurrence with the “current breaking frequency” in this value range, in addition, consider these three kinds of fault at the same time when developing maintenance strategy.
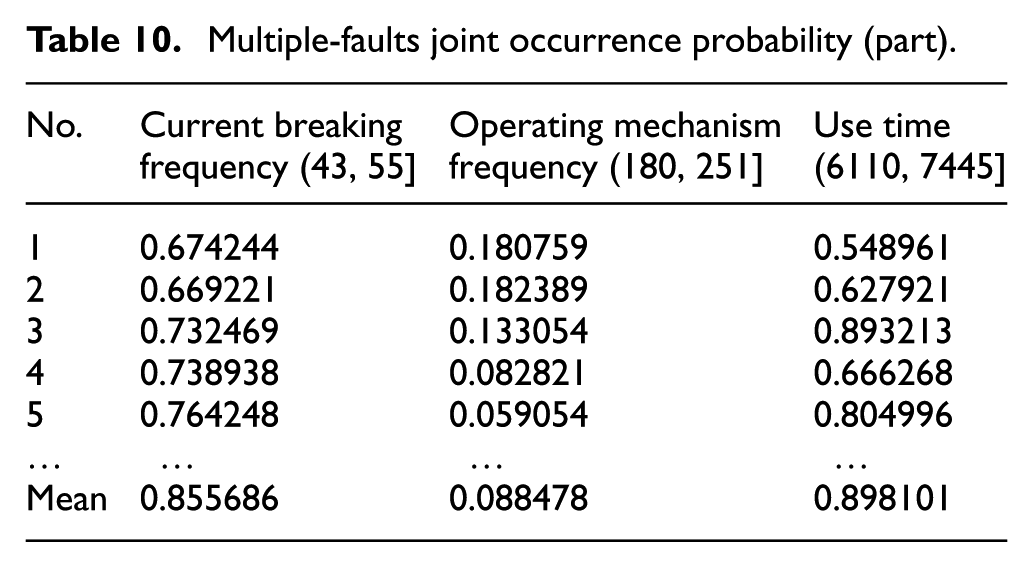
The calculation method of the multiple-faults joint occurrence probability caused by other fault-influencing factors are the same as the calculation mentioned above, and concrete results are shown in Table 10. When “current breaking frequency” is in the range of 43–55, the mean of the joint occurrence probability for “operating mechanism anomaly,”“auxiliary components damage,” and “main components deterioration” kinds of faults is 0.855686. When “use time” is in the range of 6110–7445, the mean of the joint occurrence probability for “operating mechanism anomaly” and “main components deterioration” is 0.898101. Hence, the strategy of simultaneous maintenance of multiple faults should be considered for the joint occurrence if probability is close to 1.
Multiple-faults joint occurrence probability (part).
Comparative validation analysis
1. Comparative analysis of the method
The method proposed in this article combines qualitative and quantitative analysis, which is a typical association-based classification and regression problem. To verify the proposed method, the Xgboost algorithm is introduced for comparative analysis. The Xgboost algorithm 31 is a well-designed GBDT (Gradient Boosting Decision Tree) algorithm that can efficiently process sparse data and implement distributed parallel computing flexibly. At present, research has been carried out through “lifting” idea of Xgboost to diagnose faults 32 and has achieved good application results.
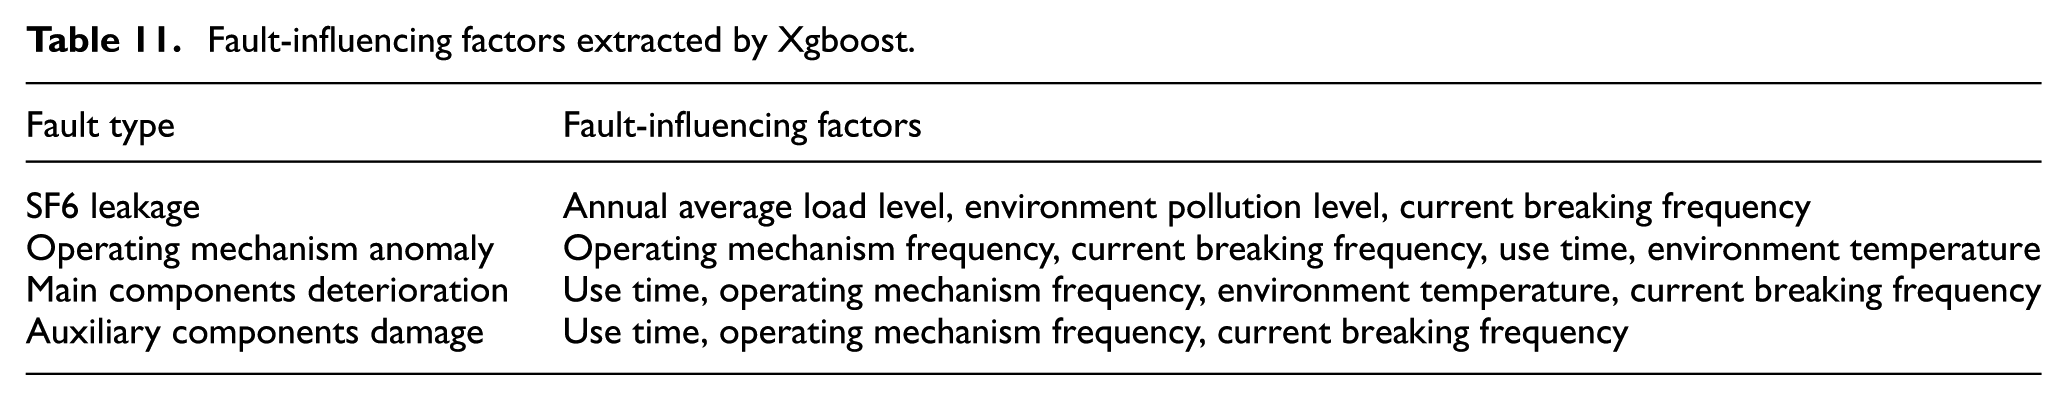
Based on the fault sample data set 1 in Table 3, the Xgboost algorithm is used to extract the fault-influencing factors. The results are shown in Table 11, the fault-influencing factors extracted by Xgboost algorithm are basically consistent with the method proposed in this article, where the fault-influencing factors of “operating mechanism anomaly” are different, which adds the “environment temperature.” The “environment temperature” was verdicted as “Non-main” by the method proposed in this article.
Fault-influencing factors extracted by Xgboost.
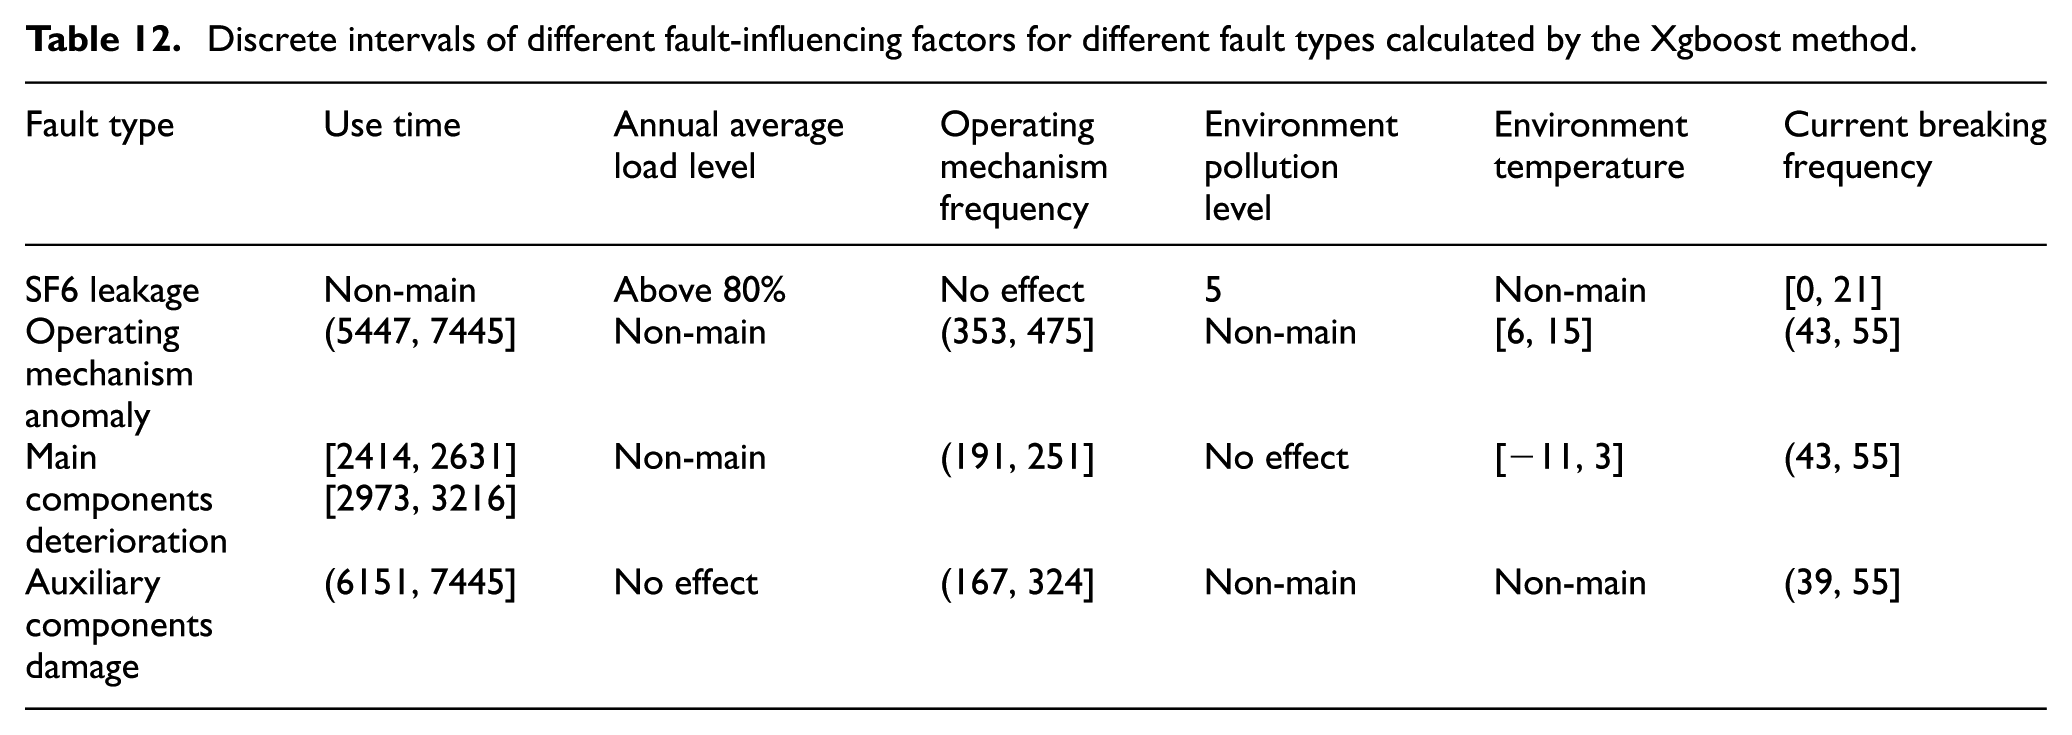
Based on the above fault-influencing factors extraction results, the Xgboost algorithm is used to calculate the single failure probability. The quantitative effect on “operating mechanism anomaly” under “current breaking frequency” calculated by the two methods is shown in Figure 7, the two methods have the same trend. However, according to the specific probability comparison, the method of this article is more practical. For example, when the normalized value of “current breaking frequency” is 0.4, the occurrence probability of “SF6 leakage” obtained by the method is 1, while the probability of the Xgboost method approaches 0.95; when the normalized value of “current breaking frequency” is 0.2, the occurrence probability obtained by the method is 0.13, and the probability of the xgboost method is 0.21. Therefore, the proposed method can better reflect the probability of actual fault, and the model constructed in this article is more explanatory than the Xgboost model. The discrete interval value ranges calculated by the Xgboost method are shown in Table 12.
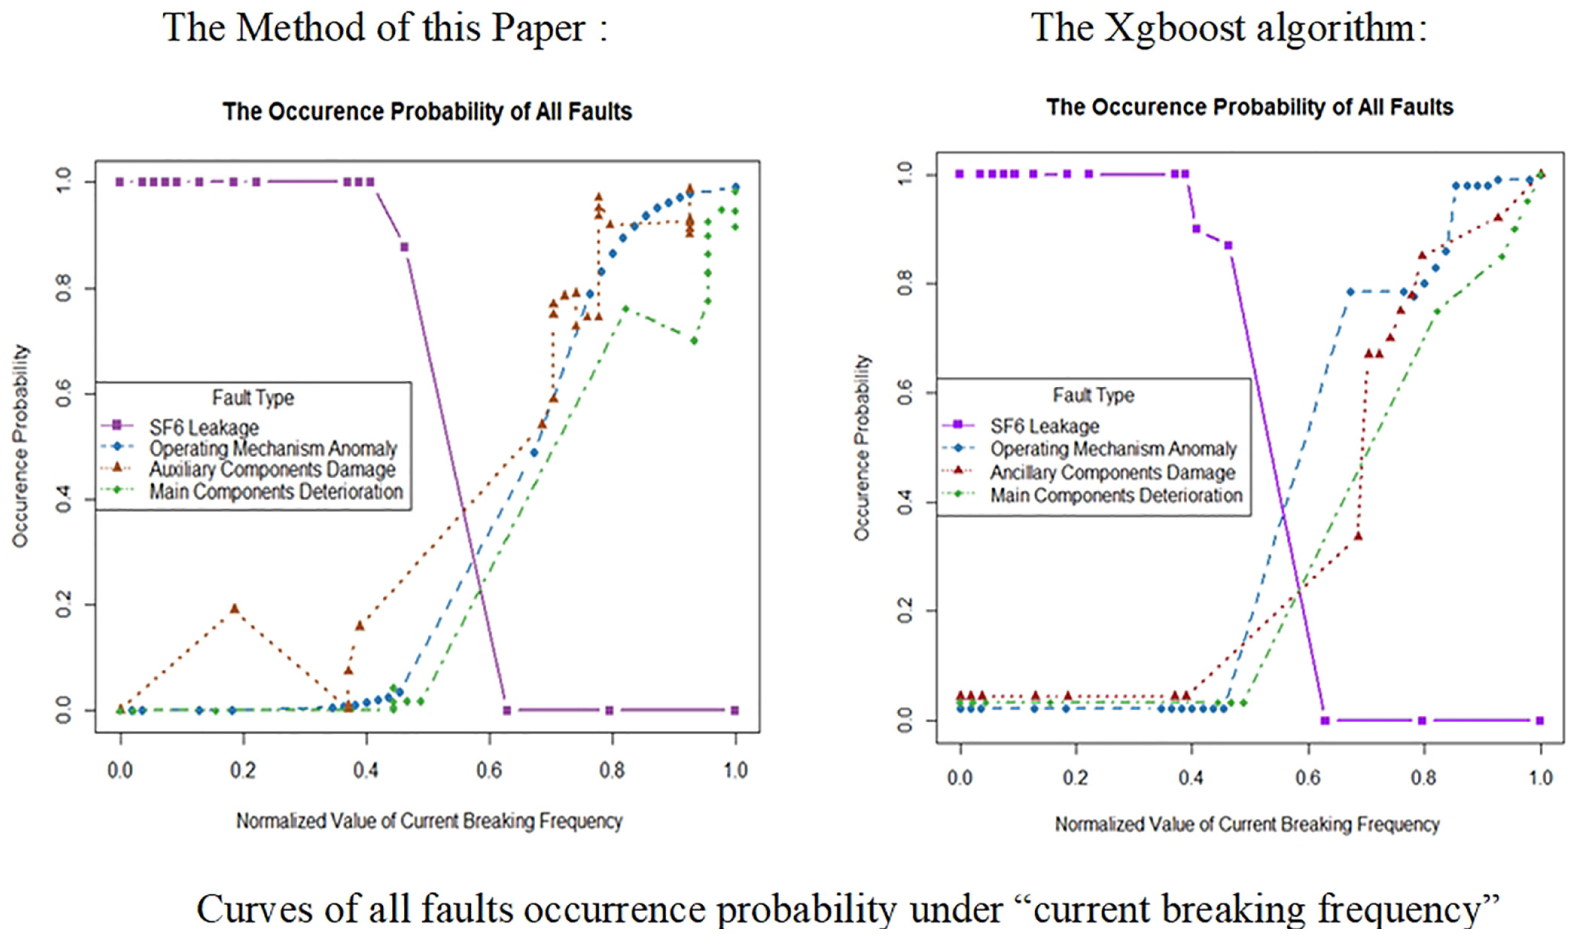
The two methods effect comparison chart.
Discrete intervals of different fault-influencing factors for different fault types calculated by the Xgboost method.
2. Multi-region data validation
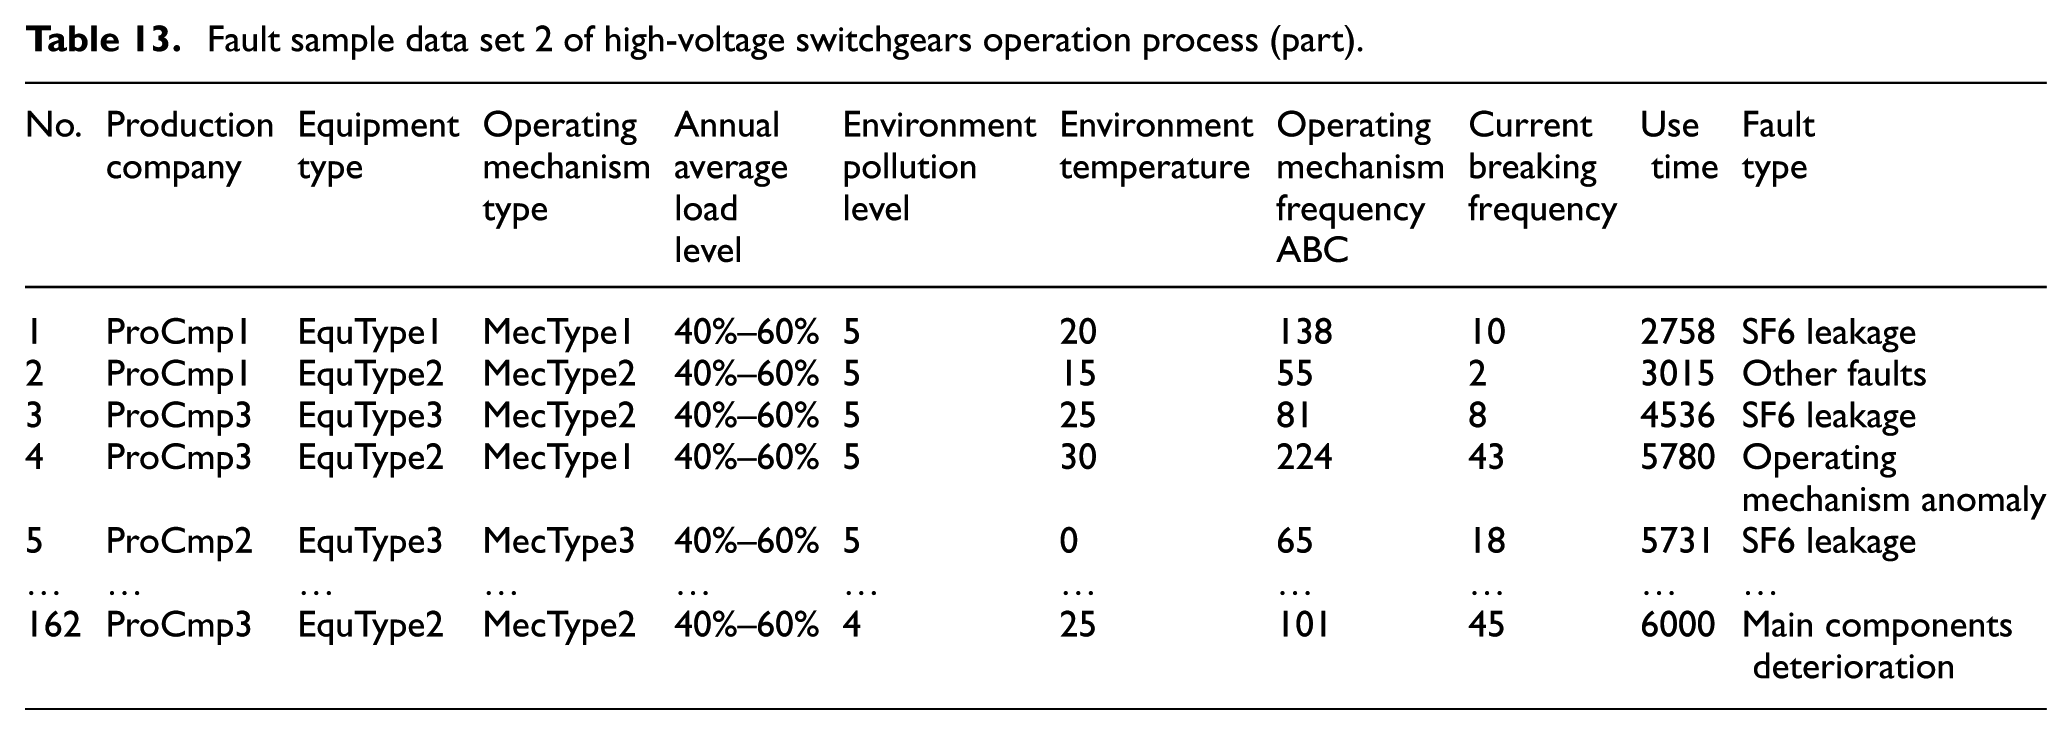
The fault sample data of high-voltage switchgears from region 2 are shown in Table 13, based on the data set from region 2, and the comparison results of the final discrete interval value ranges based on two region fault samples are shown in Table 14.
Fault sample data set 2 of high-voltage switchgears operation process (part).
Comparison of fault-influencing factors analysis results using different methods.
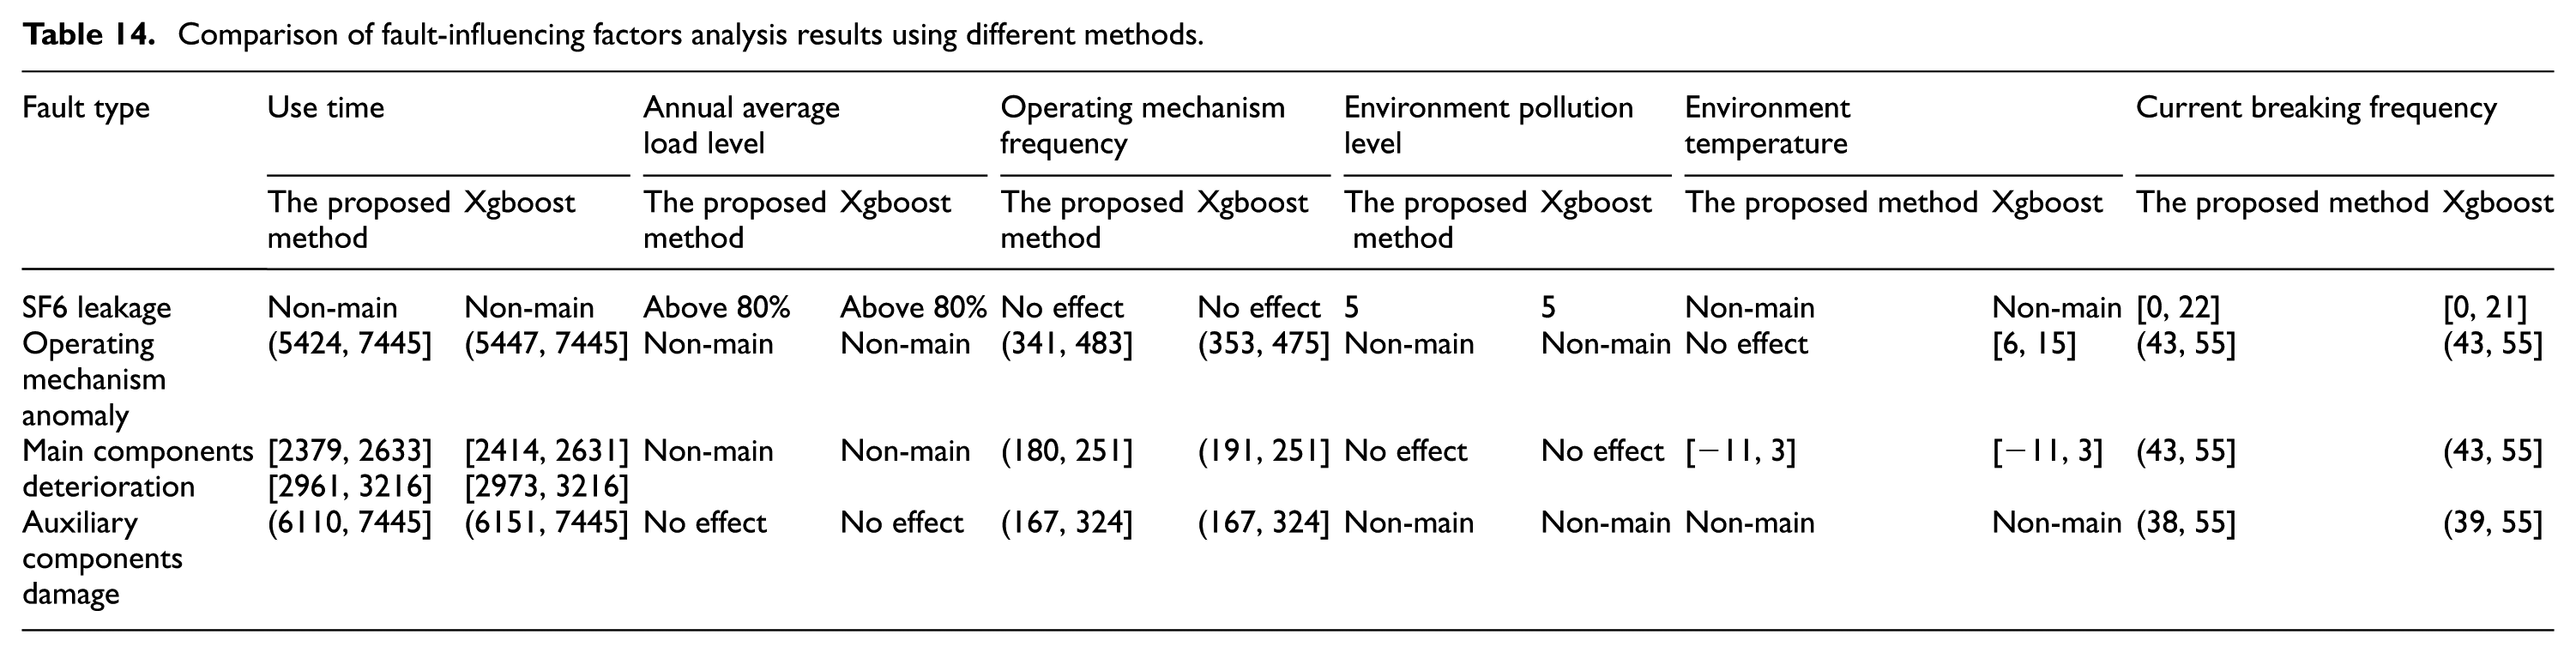
It can be seen from the comparison in Table 14 based on two fault sample data set of two different region that the fault-influencing factors for different fault types are the same, and the discrete intervals of different fault-influencing factors for different fault types are basically the same. Therefore, the effectiveness and generalization of the proposed method is proved.
Conclusion
In this article, we proposed a new method for fault-influencing factors analysis of high-voltage switchgears using the machine learning algorithm based on the traditional analysis. The model of this proposed method integrated qualitative and quantitative analyses. For qualitative analysis, CMAR based on GMM was used to mine the association rules between fault-influencing factors and fault, and specific discrete interval value ranges were obtained with further analysis. Logistic regression was adapted as the quantitative analysis method to calculate fault occurrence probability in the corresponding discrete interval value ranges, eliminate the intervals in which the fault occurrence probability was close to 0 and keep the intervals in which the occurrence probability was close to 1, and then obtain the accurate discrete interval value ranges; in addition, the multiple-faults joint occurrence probability could be obtained. Taking the above accurate discrete interval value ranges and the mean of the joint occurrence probability into consideration, the fault-influencing factors analysis method can provide reference for the switchgears overhaul. It would be possible to plan for the required maintenance on high-voltage switchgears sufficiently and improve operation efficiency for the enterprise to a certain extent.
Footnotes
Acknowledgements
The authors would like to appreciate the editor, associate editor, and the reviewers for their valuable comments and suggestions.
Declaration of conflicting interests
The author(s) declared no potential conflicts of interest with respect to the research, authorship, and/or publication of this article.
Funding
The author(s) disclosed receipt of the following financial support for the research, authorship, and/or publication of this article: This work was supported by National Natural Science Foundation of China under Grant no. 51505357, Shaanxi Province International Cooperation Project under Grant No. BD18016040001 (2016KW-048), and the Free exploration fund (JB170404).