
Abstract
Dimensional accuracy in additive manufacturing and especially for parts produced via material extrusion has been actively investigated in an effort to proceed from a prototyping process to a mature technology capable of manufacturing functional parts. Typically, accuracy in material extrusion is not the same along the different printing directions or it may vary according to the geometric feature that is fabricated. Therefore, it is considered as a problem with multiple responses and is typically tackled with multiple-objective optimization strategies in order to achieve optimal parameter settings that simultaneously satisfy contradicting requirements. In this work, response surface methodology is applied on the part, in order to obtain feature-specific models that predict dimensional accuracy. According to the proposed methodology, dimensional accuracy on every included feature and along the different printing directions is separately optimized with enhanced flexibility regarding the derived optimal solution. Optimal settings are fed directly to the material extrusion system as modified machine instructions. Different parameter settings for different regions of the same layer, or even varying material extrusion rate and feed rate along continuous trajectory, are validated. A specific part is used for demonstration purposes. The efficiency of this novel approach is compared with multiple-objective optimization based on the desirability method. The results exhibit enhanced dimensional accuracy of the part when adaptive settings are adopted for every feature.
Introduction
Material extrusion process in additive manufacturing involves thermoplastic material in filament form that is fed into a heated nozzle. While the feedstock is extruded in mouldable state, it is simultaneously deposited on the underlying build platform, creating a three-dimensional part as a sequence of layers consisting of adjacent deposited strands. The relative translation between the nozzle and the build platform is synchronized with the feedstock extrusion rate, generally forming material strands of elliptical cross-sections. However, the sensitivity of material deposition regarding the complexity of process parameterization results in varying cross-section shapes. Therefore, dimensional accuracy in material extrusion process can be traced to material deposition variance.
Only a few attempts to model and quantify shape of extruded material strand are found in literature and this is attributed to the complex nature of the phenomena involved. 1 Boschetto and Bottini 2 proposed a mathematical model to predict height deviation between the nominal and actual strand cross-section, with respect to part’s build orientation and the defined layer thickness. A recent numerical simulation of thin-wall additive manufacturing 3 measured the actual width and height of the resulting cross-section on an improved localized laser-heating system. Likewise, numerical simulation followed by experimental verification 4 illustrated and quantified the variation in strand cross-section, according to typical material extrusion parameters, namely, layer thickness, nozzle diameter, feedstock velocity and printing velocity. The effect of printing velocity and layer thickness to the coalescence between adjacent strands was studied by Huang and Singamneni 5 in an attempt to evaluate material deposition in the internal part structure. Strand width inconsistency is also caused by acceleration and deceleration of the printing head. 6 , 7 In this light, the spreading of the strand cross-section during solidification 8 induces expansion or contraction of the part’s outer boundaries, leading to deviation from the nominal dimensions.
Unlike analytical models, which usually involve simplifications to reduce computation complexity, experiment-based methodologies are more prominent to capture real-life occurrences and noise effects during the process. Design of experiments (DoE) has been widely reported in literature, as a well-established set of methodologies, to empirically establish the effect of process parameters on the part’s dimensional accuracy in material extrusion. Taguchi method is the prevailing technique applied in many relevant cases9–11 to obtain optimum settings among typical material extrusion parameters, such as layer thickness, strand width, strand deposition angle, air gap, extrusion temperature, printing speed and part orientation. Similar attempts utilize response surface methodology (RSM), which is considered to be suitable for fitting polynomial models that predict dimensional accuracy on a continuous parameter level range.12–14 Relevant experimental approaches involve specially designed benchmarking models, used to evaluate material extrusion systems according to standardized international tolerance (IT) grades. Accuracy evaluation is based on multiple features, such as thin walls, holes, bosses and overhangs, resulting in increased granularity of the analysis and providing a more detailed insight regarding the material extrusion system capabilities.15–18
Dimension compensation at the design stage has been advocated as an alternative remedy to fabrication-induced deviations. Deviation models for prismatic and cylindrical shapes have been developed, 19 while Taguchi experiments were performed to generate data for training a predictive artificial neural network (ANN). 20 A recent study 21 presents an algorithm to extract feature-based tool-paths for a 5-axis robotic additive manufacturing, directly from STEP file rather than the error prone STL file.
Separate analysis of individual responses is vital for understanding the underlying phenomena; however, multiple goals that need to be simultaneously satisfied are commonplace in manufacturing. Regarding material extrusion, multiple-objective optimization via different techniques is widely reported in literature. Chung Wang et al. 22 integrated Taguchi experiments with grey relational analysis (GRA) with the aim to optimize dimensional accuracy, surface roughness and mechanical properties of the fabricated part. RSM was combined with non-dominated sorting genetic algorithm (NSGA) to find the optimum part orientation in order to optimize two contradicting responses: part’s tensile strength and volumetric shrinkage. 23 Neural network models were constructed in Vosniakos et al. 24 order to correlate layer thickness and part orientation with volumetric accuracy and time required to build the part. Afterwards, both objectives were simultaneously minimized utilizing genetic algorithm optimization. When not treated as volumetric deviation, dimensional accuracy is commonly perceived as a multiple-objective response since the investigated parameters may affect accuracy along the three motion axes X, Y and Z in a different manner. Indicatively, this is proved in Sahu et al., 25 which integrated Taguchi method with fuzzy logic optimization technique to obtain a global optimum. Another approach, aiming to optimize accuracy along all axes, 26 involves an optimal RSM design followed by Derringer’s desirability function.
This study attempts to evaluate a novel approach consisting in varying parameter settings on specific regions of the same layer or even on continuous trajectory, by contrast to global settings obtained from multiple-objective optimization. In both cases, minimization of deviation from the nominal dimensions is sought via empirical models that are generated from strategically designed experiments.
The article is organized as follows: In “Methodology and tools” section, the concept of this work is analyzed and an introduction regarding process parameters and the experimental design is included. The derived models according to experimental results, as well as the two different optimization strategies, are presented in “Experimental results and analysis” section, while in “Discussion” section, the obtained results are discussed in detail. Finally, “Conclusion” section summarizes the main achievements and the limitations of this work.
Methodology and tools
Motivation and concept
Slicing is the standard process planning routine for all additive manufacturing processes. Typically, parameter settings are set at this stage and they are kept constant throughout the manufacturing process. Parameterization flexibility is dictated by the capabilities of the available slicing software. Regarding enhanced flexibility, a more progressive slicing feature that tends to become standard among available software packages is adaptive slicing. 27 This refers to variable settings for subgroups of entire layers. This was initially proposed as remedy against increased surface roughness caused by the staircase effect along building direction, and is typically applied to reduce thickness in a group of layers, but also to modify thermal parameters, such as extrusion temperature. Note that state-of-the-art slicers use specific settings for entire layers but not on a continuous trajectory within each layer.
Multiple-objective optimization usually provides a direct answer when multiple, yet contradicting, responses must be satisfied. In general, the more the responses, the more severe the compromise may become. 28 Varying strand width was recently proposed by Wang et al. 29 as a strategy to tackle over- and under-filled regions in the part’s interior, facilitate thin feature fabrication and enhance self-supporting capability. Along the same lines, the approach of adaptive material deposition on individual features and different regions of a continuous trajectory on the same layer is investigated in this work, in order to improve dimensional accuracy of a specimen containing multiple features. For the first time, adaptive strategy applicability and efficiency are further evaluated through comparison with the de-facto multiple-objective optimization practice, in an attempt to fabricate the specimen closer to its nominal dimensions.
Process parameters and equipment
A multiple feature specimen was designed in Solidworks™ as depicted in Figure 1 and was used as a test specimen. A central composite design (CCD), which belongs to the RSM family, was conducted. 30 Five empirical models were retrieved to predict dimensional accuracy along X, Y and Z axes and two common features: thin walls (TW) and holes (H).
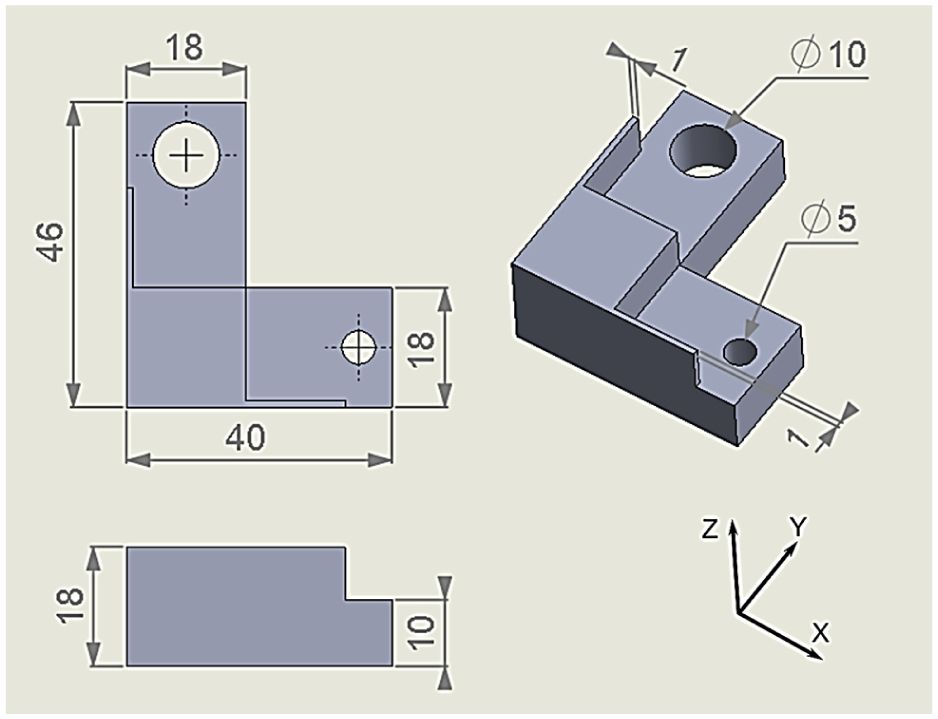
Designed specimen for evaluation of dimensional accuracy.
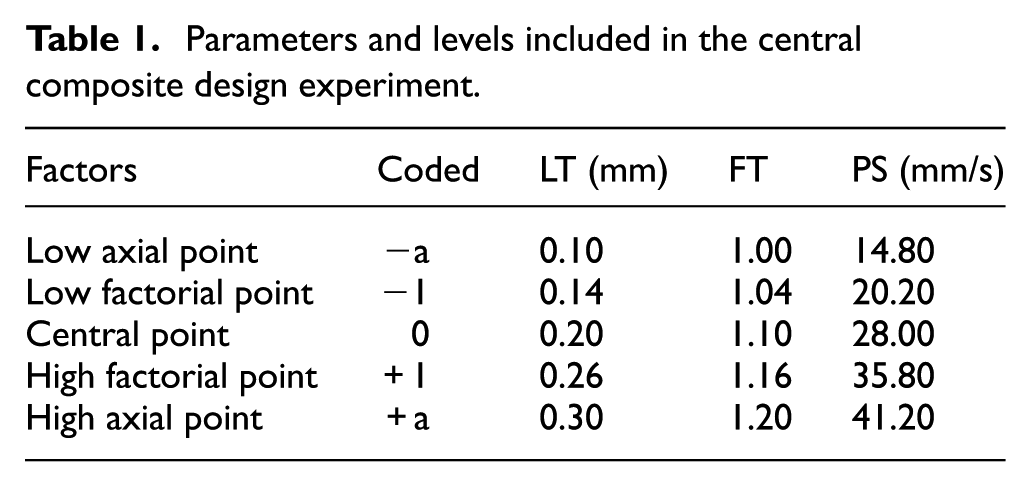
To validate dimensional accuracy in material extrusion, three fundamental process parameters were modified at different levels (Table 1) throughout the experiments in controlled manner according to CCD:
Layer thickness (LT) represents the vertical distance between the nozzle’s orifice and the build platform or the substrate formed by the previous layer. LT also determines the thickness of each new layer that is stacked upon the previous to fabricate the part, Figure 2(a).
Flow tweak (FT) essentially modifies strand width without re-arranging the distance between adjacent strands, Figure 2(b). FT value equals to 1.00 when strand width corresponds to nominal nozzle diameter, in this case, dn = 0.50 mm. FT settings induce a percentage change in strand width, resulting in varying airgap, as it is also known from literature. 26
Printing speed (PS) determines nozzle velocity during layer fabrication on the horizontal X-Y plane, Figure 2(c).
Parameters and levels included in the central composite design experiment.
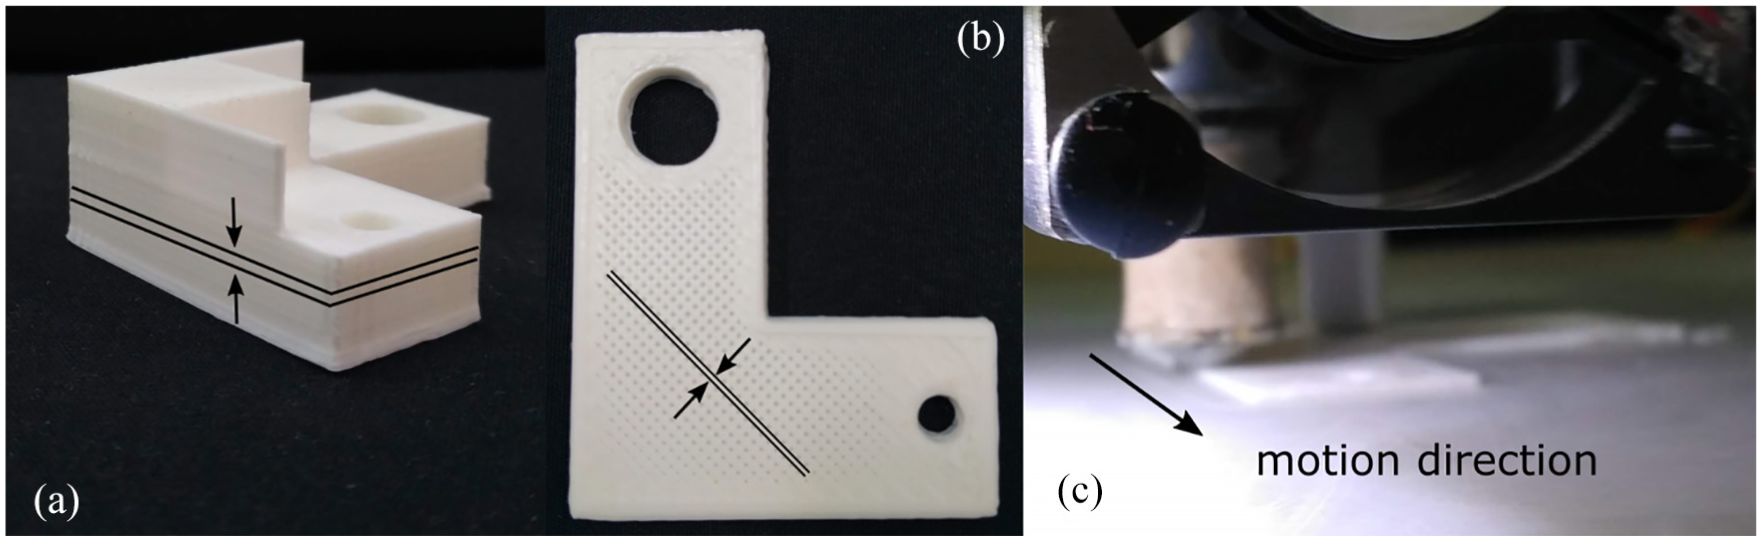
Investigated process parameters: (a) layer thickness, (b) strand width adjusted by flow tweak parameter and (c) nozzle velocity determined by printing speed parameter.
The rest of the parameters were kept constant throughout the experiments, the most important of which are stated below. Specimen tool-paths fabricate a solid outer shell of nominal thickness 1 mm. The number of fully dense layers was dictated by the layer thickness setting to add up to 1 mm thickness. Regarding the inner part of the specimen, it was fabricated with 50% material infill, which is considered a fair compromise between dense parts designated for engineering applications and reduction in total experiment time that is required. Linear infill pattern was employed for the internal structure, consisting of straight parallel strands that are inclined by 45°. Infill material overlaps by 50% with the contour strands.
Dimensional accuracy was measured as the average deviation from the nominal dimensions of the specimen, given that multiple measurements were conducted for the same feature. Dimension measurements were performed by a Starrett™ micrometre of 0.01 mm resolution while diameter measurements were performed on an Etalon™ coordinate measuring machine (CMM). Measured dimensions are categorized, with respect to Figure 1, and the denoted coordinate system as
40 mm and 18 mm length dimensions to evaluate X-axis accuracy,
46 mm and 18 mm length dimensions to evaluate Y-axis accuracy,
10 mm and 18 mm length dimensions to evaluate Z-axis accuracy,
Φ10 and Φ5 diameter dimensions to evaluate accuracy of holes (H),
1 mm thickness dimension to evaluate accuracy of thin walls (TW).
The specimen was fabricated from polylactic acid (PLA) with filament diameter of 1.75 mm. A low cost material extrusion system was employed, namely, 3D Systems™ CubeX. Process parameters were set in Kisslicer™ software generating tool-paths in G-code format. G-code commands were modified via a text-handling script, developed in VBA. To achieve this, the developed script is equipped with a search routine responsible for locating and classifying G-code sections according to the features and part regions they pertain to. The command lines that define each feature and part region were retrieved with the aid of NC-Plot™ G-code viewer, and were accordingly modified upon script execution.
Central composite design and model validation
Response surface methodology (RSM) approximates an investigated response (y) with regard to a set of parameters xj with j = {1,2,…, k}, in the form of a second-order model that is fitted through observations of designed experiments, see equation (1)
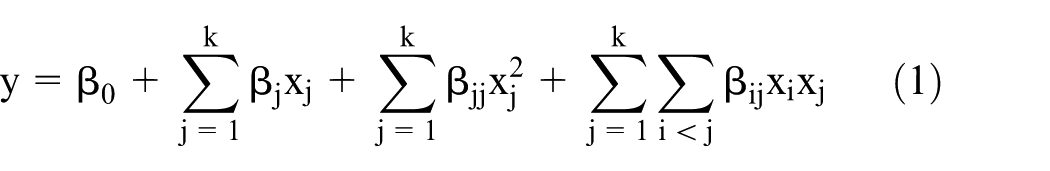
Constant term β0 and βj, βjj and βij, with i = {1,2,…, k} and j = {1,2,…, k}, are the estimated coefficients for the linear, quadratic and interaction model terms, respectively. They denote the magnitude of change in response y when the corresponding parameter level is modified.
Preliminary 23 full factorial experiment was conducted aiming to quantify the effect of LT, FT and PS on dimensional accuracy of the specimens; additional centre point runs indicating curvature in response. Therefore, a second-order model is required to better approximate the process and a central composite design (CCD) is selected. A 20-run CCD equipped with eight factorial points, six axial points and six centre points is constructed. Low and high factorial points (Table 1) are appropriately assigned to parameter levels in order to form a rotatable design and still generate level combinations that are feasible regarding the available material extrusion system. Rotatability is an important CCD property which guarantees consistent variance of predicted response throughout the experiment region. A rotatable design is determined by value a, which is the distance of axial points from the centre points in coded units and it is calculated as in equation (2)

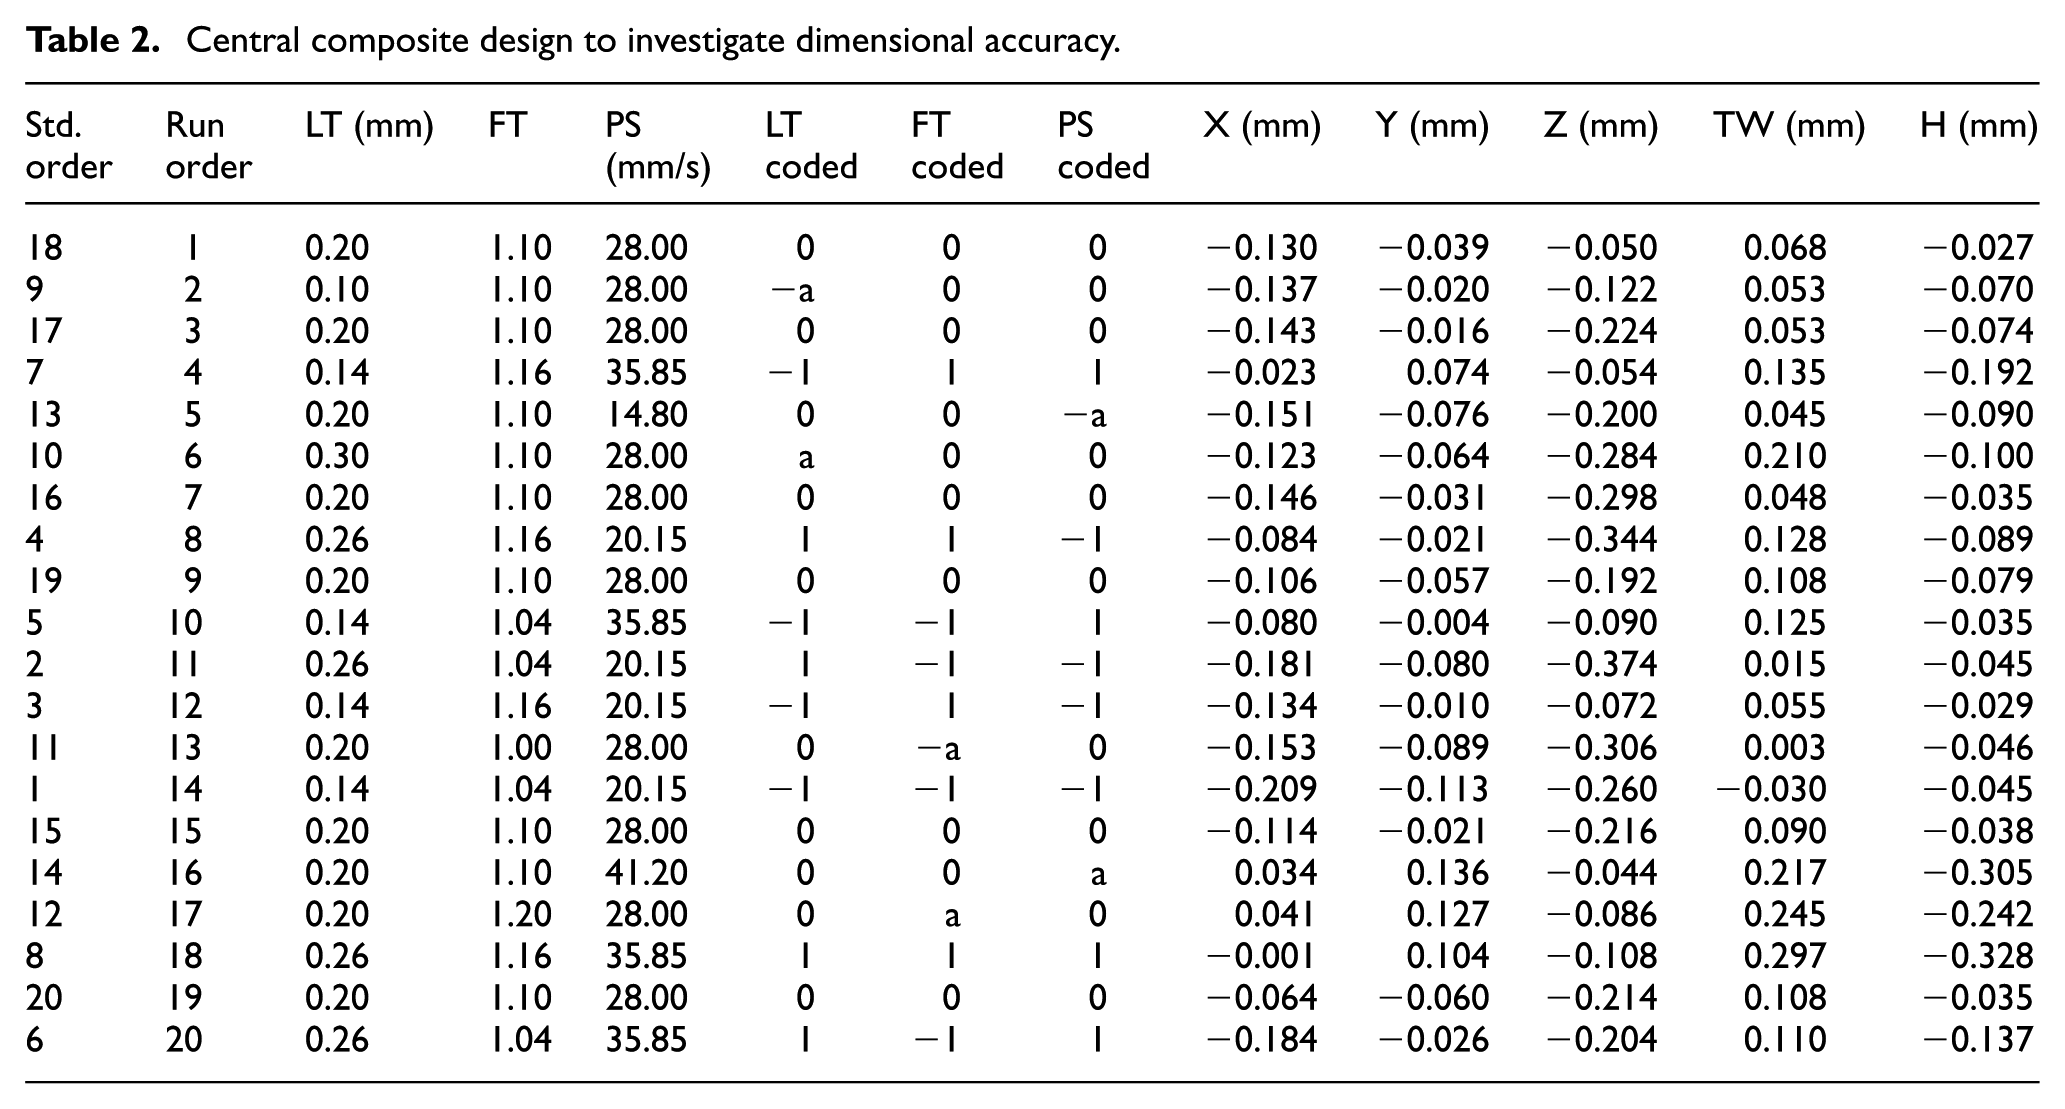
where f is the total runs of the design’s factorial portion. In the present case, f = 23 and a = 1.682. The experiment sequence is presented in Table 2.
Central composite design to investigate dimensional accuracy.
Response surface model is fitted according to the ordinary least squares (OLS) method. For the OLS-generated model to be valid, it is essential that specific assumptions are not violated. The first assumption is the normal distribution of residuals which is confirmed by Anderson-Darling normality test. Insignificant lack-of-fit denotes that the generated model sufficiently describes the process and no additional or higher order terms should be included. Coefficient of determination R2 increases as terms are added to the model and although a high R2 is desirable R2-adjusted is more suitable when comparing models with unequal number of terms. Generally, high values of R2 and R2-adjusted indicate a powerful model. A model with satisfactory prediction ability should provide a difference below 20% between R2-adjusted and R2-prediction. 26 Note that pure error is the process variability that is not explained by the model.
Desirability function
A well-established method, adopted to optimize multiple responses, is desirability function introduced by Derringer and Suich. 31 As a first step, desirability function is calculated for each i-th response individually, as a value between 0 and 1, and according to the intended performance characteristic, see equation (3). Unacceptable performance is denoted by value 0 whereas the optimum performance is denoted by value 1. In this study, measured deviation is both negative and positive. Optimal dimensional accuracy is obtained when the deviation from the nominal dimension equals to 0, and therefore, this is considered as target value
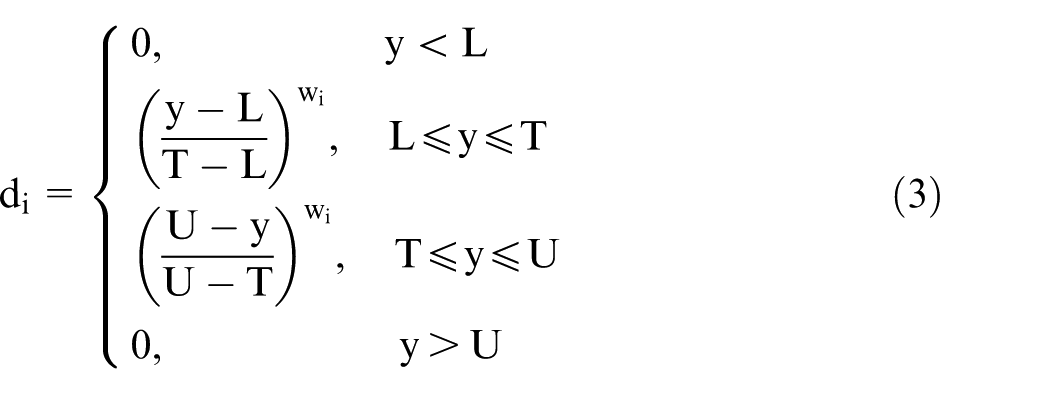
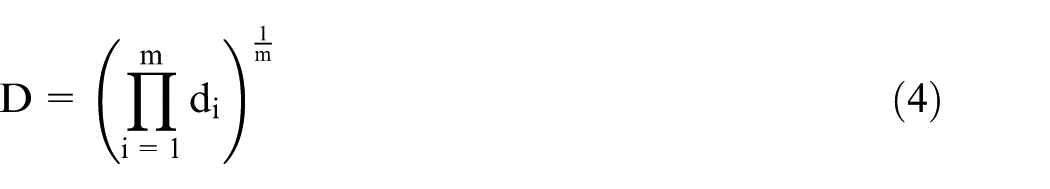
where y is the predicted response according to the corresponding model, T is the target value, wi is the assigned weight for the i-th response and L and U are the user-defined lower and upper bounding values, respectively. Outside these bounds, desirability for i-th response equals to 0 and so does the global desirability D for a total of m responses, see equation (4), signifying an unacceptable solution. Otherwise, the higher the value of D, the more satisfactory is the obtained parameter level combination
Experimental results and analysis
All results presented below have been derived by use of the Minitab™ software, which incorporates a comprehensive DoE and optimization section.
Generated models and model validity check
The experimental results are presented in Table 2. Parameter level combinations are listed both with their levels expressed in actual units and in coded values according to Table 1. Five prediction models, see equations (5)–(9), are generated to describe dimensional accuracy along X, Y, Z axes, TW and H features. Estimated term coefficients β are expressed in coded values throughout the derived models. These are normalized values to the same scale facilitating comparison among the pertinent parameters regarding their contribution to the part’s dimensional accuracy
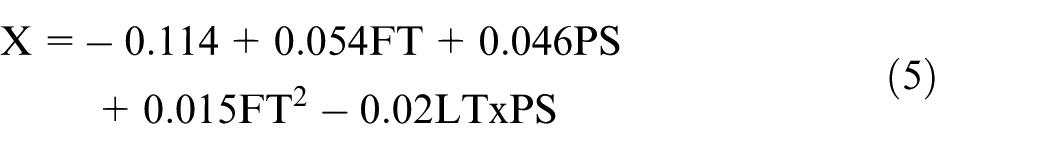
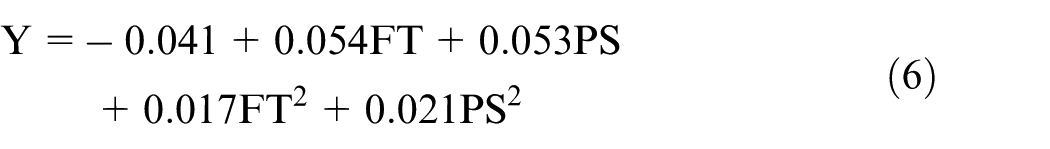

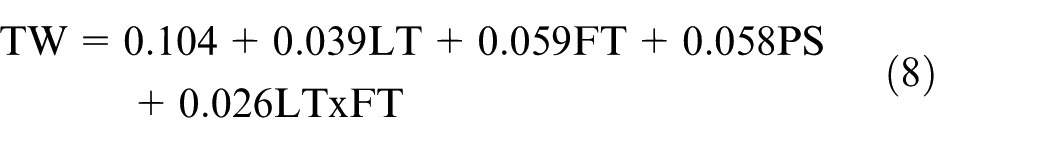
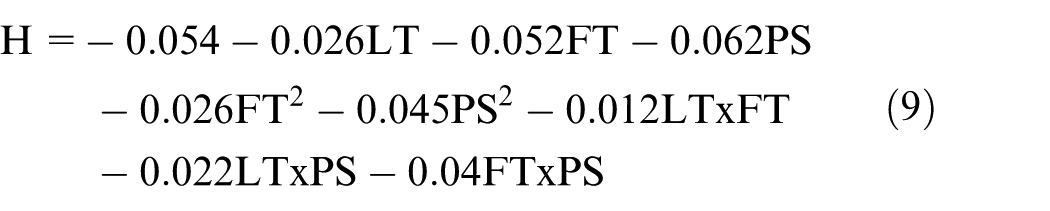
Regarding models for X and Y axes, it is easily noticed that coefficients are close to each other, which is reasonable since material deposition on a horizontal build platform is expected to present common characteristics. However, the arithmetically lower constant term for Y axis denotes that material extrusion along Y is more precise than X on average. Dimensional accuracy along Z axis is expressed by a first-order model, facilitating the understanding of the main effects of the parameters on the response. In this light, increasing FT and PS value tends to increase part height, which is constantly lower than nominal, as seen in Table 2. In addition, dimension along build direction is also dependent on how the infill structure is fabricated. As presented in Sood et al., 9 excessive material accumulation either by increasing FT, PS or material infill percentage may result in material overfilling and expansion of the layers, leading to part height increase. Regarding TW, it is concluded that the wall width is typically larger than nominal by approximately 0.1 mm. Furthermore, manufacturing of holes in material extrusion is described by a complex model, containing significant interactions of main parameters as well as second-order terms.
According to Table 3, all models are significant (p value < 0.050) at 95% confidence level, with insignificant lack of fit and normality (p value > 0.050). This is a favourable indication that these models sufficiently describe the underlying phenomena, and no higher order terms or other non-included parameters are missing. Pure error is below 5% for all performance characteristics except for the model that describes dimensional accuracy along Z axis. The higher error is mainly attributed to the first observation of the design (Table 2), which is noted to provide large residual error. Generally, observations that are based on real-life experiments are likely to contain outliers. 32 Since the observation is a legitimate experiment result, it is deliberately kept in the analysis even though it leverages model formation. A model with higher error, at least as it is validated by model diagnostics, is preferred since it depicts variation of the real process.
Model validity indices and diagnostics.
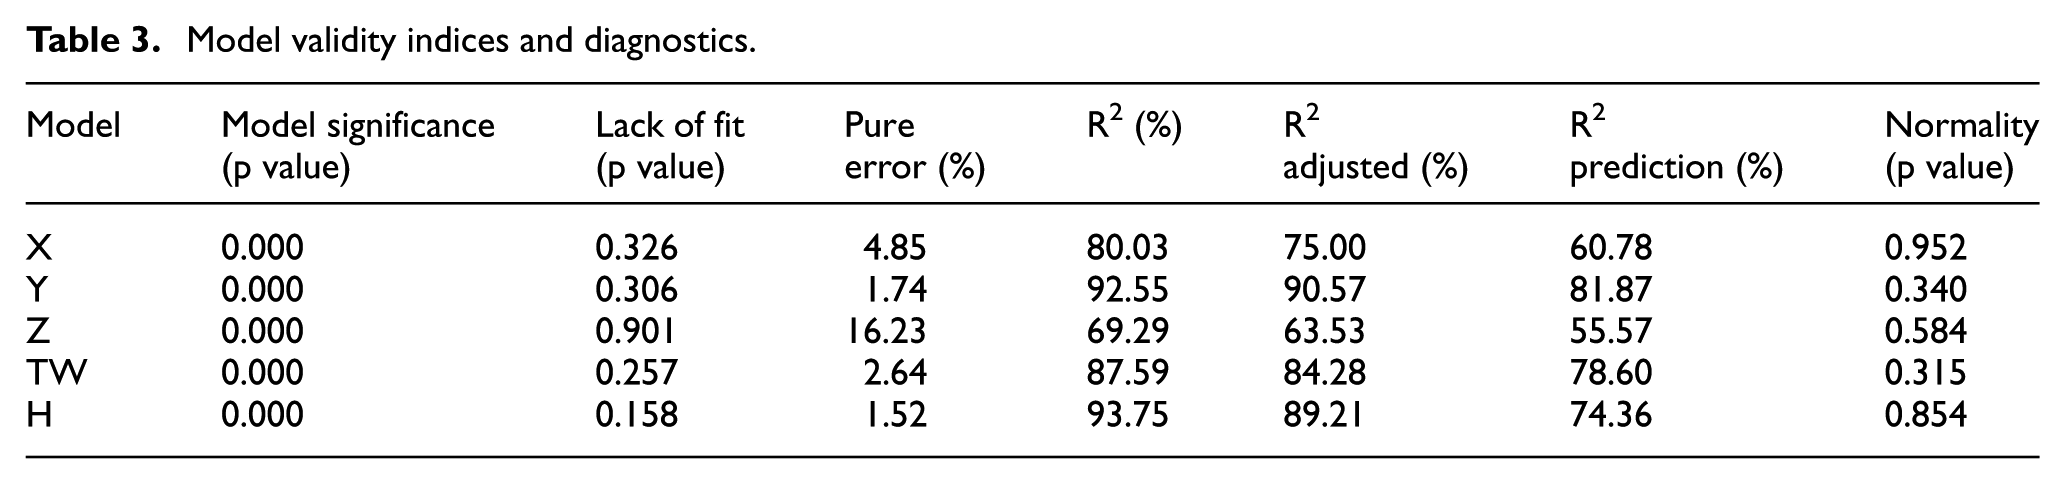
Coefficient of determination R2 is high for accuracy along Y-axis, TW and H, and satisfactory for accuracy along X-axis. A model with higher error is derived for Z-axis due to the reasons stated in the previous paragraph. R2-adjusted is advised once insignificant terms are removed from the initial model. Therefore, R2-adjusted is always lower than R2, yet sufficiently high. The removal of insignificant terms is important in order to increase prediction R2 and formulate a model that can reliably predict response that is based on new settings.
Multiple objective optimization
Optimizing all five models simultaneously enables derivation of a global solution, via the desirability method as explained in “Desirability function” section. In particular, according to the analysis software employed, the optimal solution is reached when LT is set to 0.10 mm, FT is set to 1.12 and PS is set to 30.40 mm/s. The goodness of the solution is depicted in overall desirability index D, and in this case, it is calculated at 0.834 according to equation (4). Individual desirability di reveals how close to the target each quality characteristic is expected to be. For dimensional accuracy along Y axis, response is predicted to fall closely on target, with dY = 0.976, see also equation (3). Desirability for Z and H is characterized as satisfactory, dZ = 0.882 and dH = 0.861, whereas accuracy along X axis and on TW feature are compromised at dX = 0.690 and dTW = 0.788.
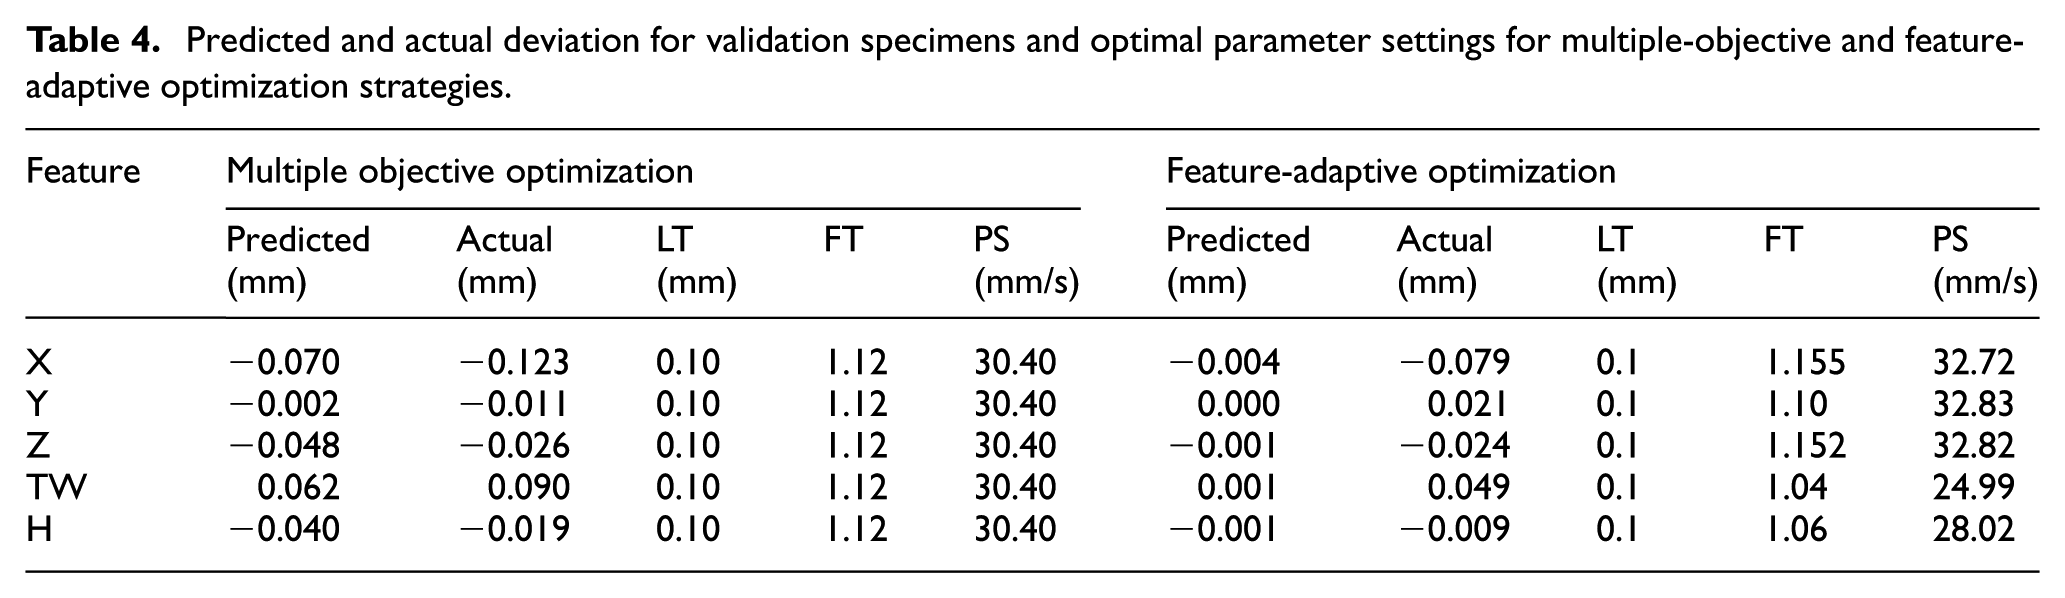
To verify predicted results, two validation specimens are fabricated under optimal settings. The predicted and the actual deviation from nominal dimension, as well as the optimal parameter settings, are listed in Table 4.
Predicted and actual deviation for validation specimens and optimal parameter settings for multiple-objective and feature-adaptive optimization strategies.
Feature-adaptive optimization with varying parameters
The purpose of feature-adaptive optimization is to rectify severely compromised performance characteristics resulting from the multiple-objective optimization strategy. Regarding dimensional accuracy of parts in material extrusion process, it is evident that the same settings influence dimensional accuracy of different part features in a contradicting manner. The rationale is to identify reliable empirical models for each part feature, regarded as a separate performance characteristic, and employ them to directly adjust machine instructions. In the slicing procedure, when LT is modified, the z-coordinate of each G-code motion command denotes the build platform position with respect to the nozzle’s orifice and can be modified accordingly. Furthermore, when PS is modified, G-code feed-rate command, corresponding to linear and circular motions in the horizontal plane, is altered. It should be noted that changes in both LT and PS also impact the G-code command that controls feedstock motor angular velocity, and once FT is modified, the angular velocity is further slightly varied, leaving feed-rate intact, thus adjusting material extrusion rate.
Optimization of a single performance characteristic provides increased flexibility in terms of the determined optimal settings, and therefore, dimensions are predicted to be closer to nominal, in comparison with the optimal settings determined from the desirability method (Table 4).
G-code modification
To prove the feature-adaptive optimization concept, a G-code post-processing script was developed in VBA. Given an initially generated G-code file, corresponding to specimen depicted in Figure 1, the developed script locates the tool-path coordinates in respective motion commands (viz. G01) that are responsible for fabrication of
part’s outer contour along X-axis,
part’s outer contour along Y-axis,
X-Y coordinates defining the layer’s internal structure patterns. Note that due to the layer-wise building strategy, accuracy along Z-axis is strongly influenced by these patterns.
TW region,
holes.
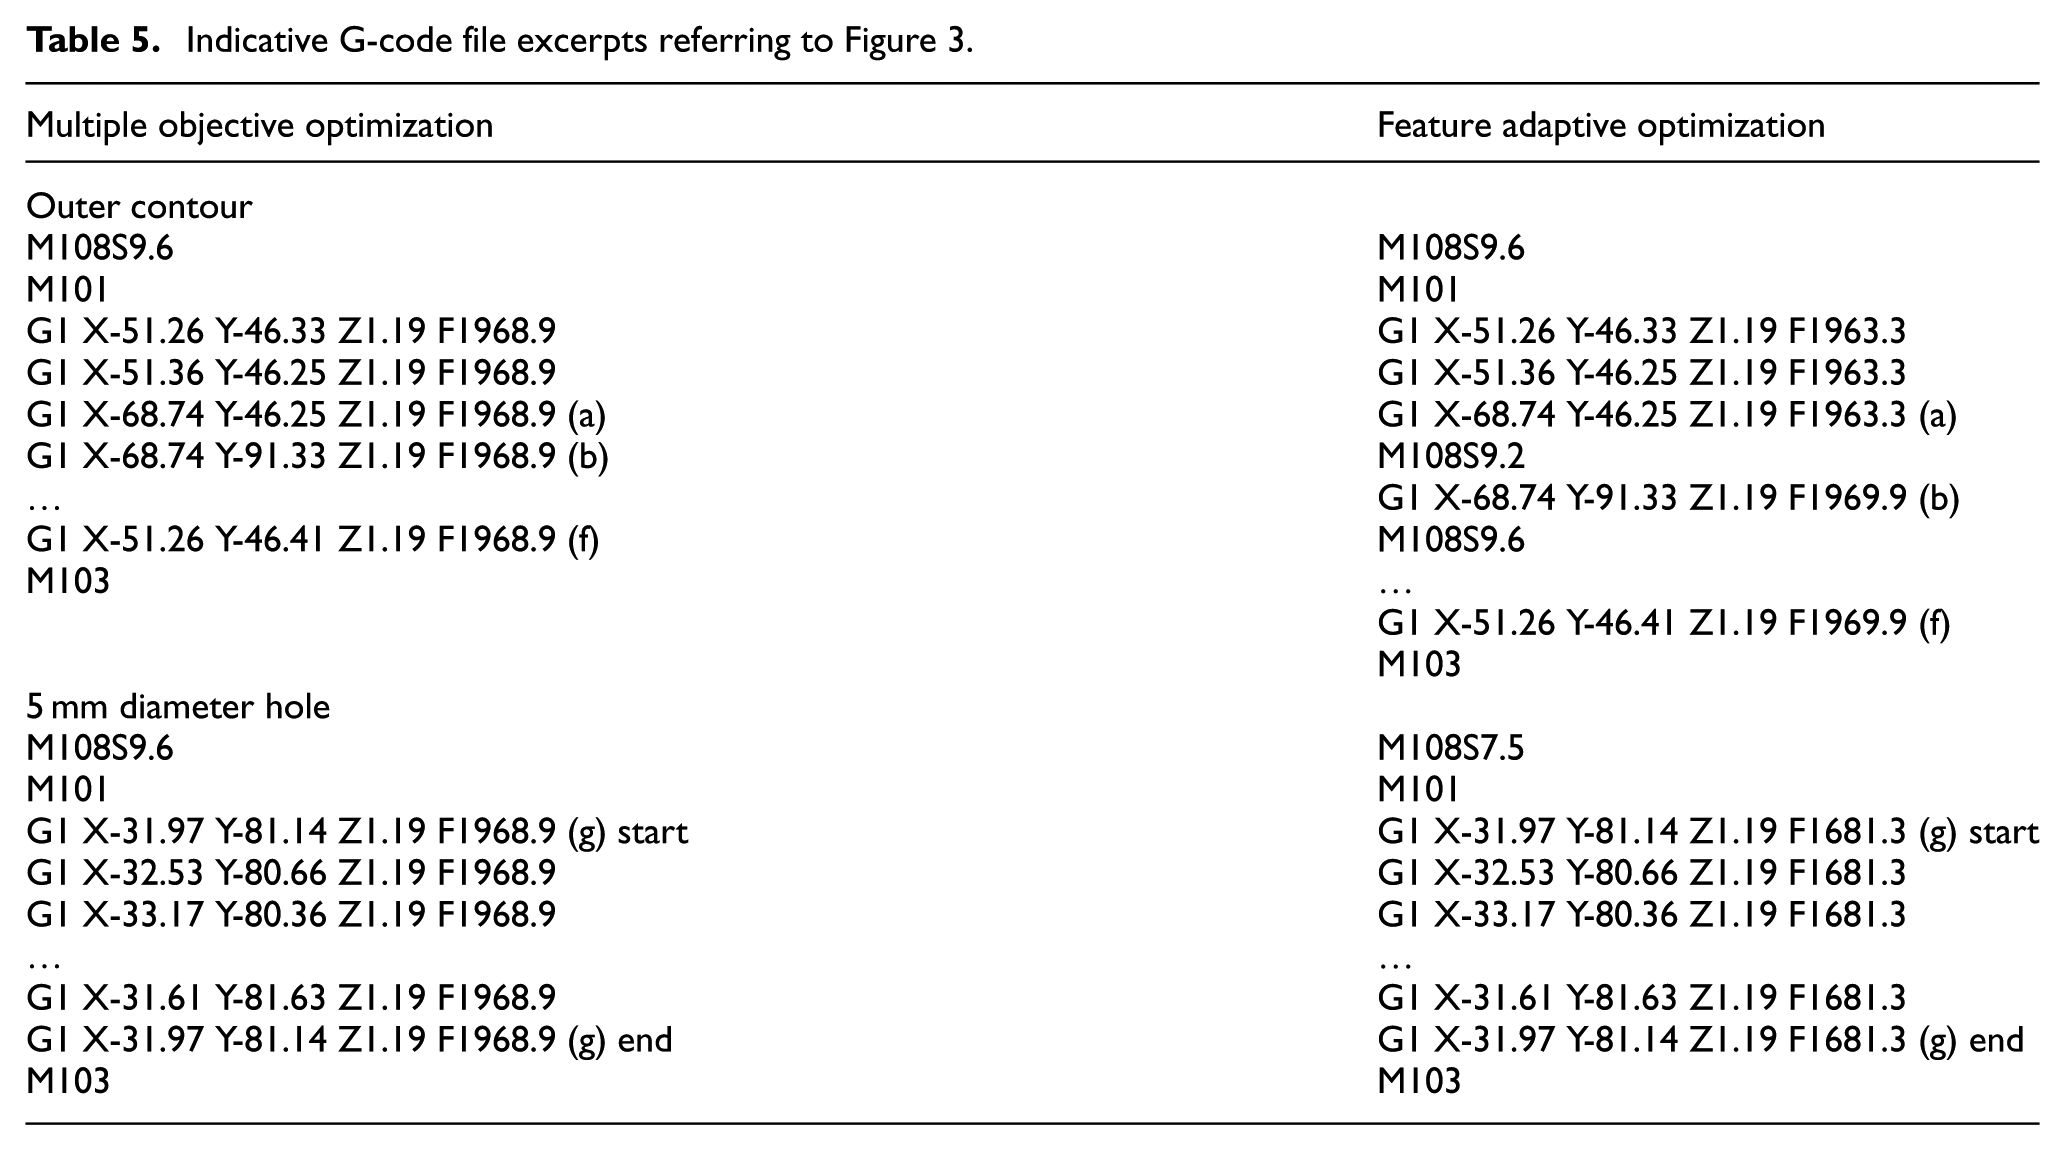
Afterwards, commands that dictate feed-rate and material extrusion rate are accordingly modified, as presented in Table 5 and Figure 3.
Indicative G-code file excerpts referring to Figure 3.
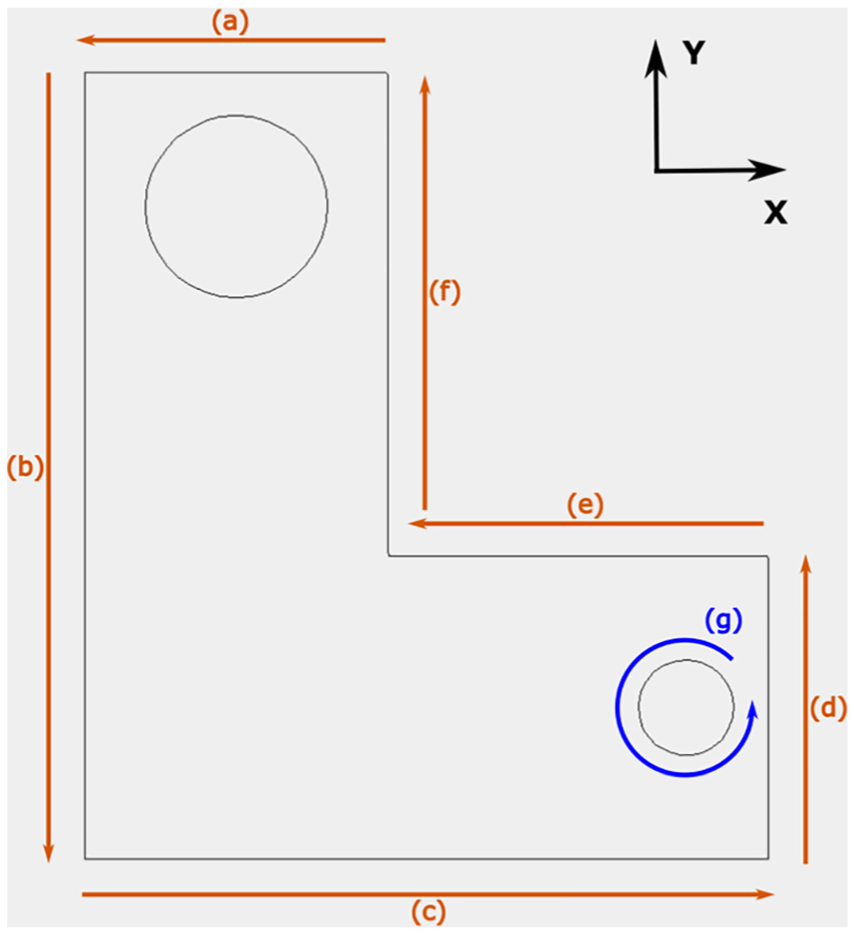
Part with regions (a)–(g) referring to G-code commands in Table 5.
Note that tool-path segments (a)–(f) in Figure 3 refer to the part’s outer contour. G-code commands for material extrusion rate and feed-rate, namely, ‘M108 Sx’ and ‘Fy’, where ‘x’ is feedstock motor angular velocity expressed in RPM*10 and ‘y’ is nozzle velocity on horizontal plane expressed in mm/min, are modified ‘on-the-fly’ during the continuous trajectory of the contour, varying the deposited strand width in an different manner regarding the printing direction (Table 5). Likewise, tool-path segment (g) in Figure 3 is modified in order to fabricate the 5 mm-diameter hole as in Table 5, according to optimized settings derived by the corresponding prediction model. Two validation specimens are manufactured under feature-adaptive settings. The predicted and the actual deviation from nominal dimension as well as the optimal parameter settings are also listed in Table 4.
Discussion
Model validity diagnostics revealed high reliability for Y-axis and H-prediction models, while the performance of the rest is considered satisfactory. Effectiveness of the models is tested in practice upon verification tests as described next.
The main purpose of the study is to demonstrate the concept and implementation of feature-adaptive settings directly translated as machine instructions and also to compare the results achieved with it against the optimal settings obtained by desirability method. Two verification tests were performed for each case. According to Figure 4, dimensional deviations corresponding to each group of measurements, as explained in “Process parameters and equipment” section, are averaged and organized with respect to the five investigated responses. Each group of bars visually represents the difference in dimensional deviation, for the specimen at hand under optimal settings obtained via desirability method (purple bars) and under adaptively optimized settings for each feature (yellow bars). Horizontal line x = 0 indicates zero deviation from nominal dimensions, which is always the target, while individual line segments at each bar reveal the predicted deviation.
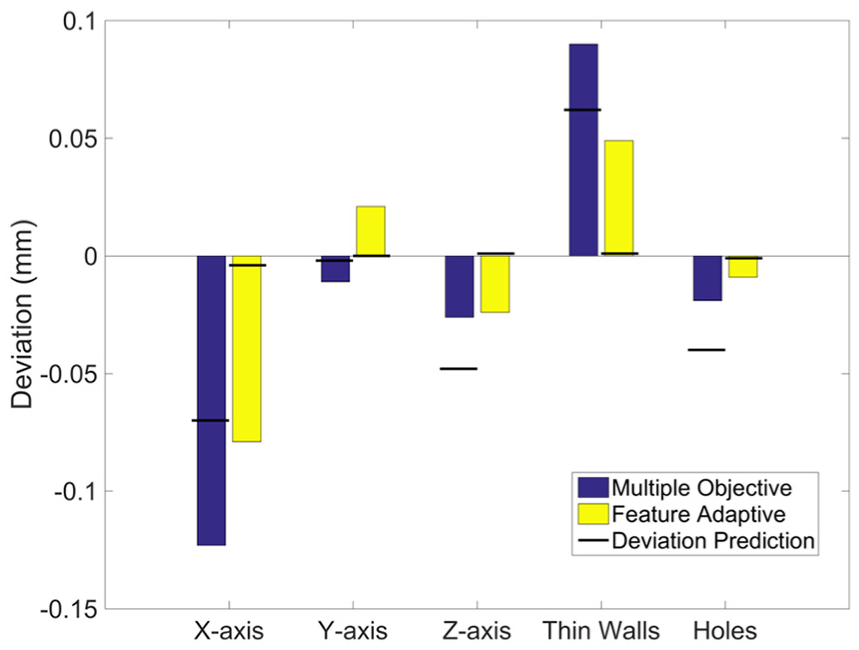
Deviation between actual and nominal dimensions for multiple-objective and feature-adaptive optimization strategy.
It is easily observed that in four out of five responses, the deviation is reduced and is closer to zero, the most drastic improvement being for X axis and TW. Holes are fabricated closer to nominal diameter when feature-adaptive settings are employed. The change in dimensional accuracy along Z-axis is minor and close to zero in both cases. Regarding Y-axis response, it is the only feature that presented larger deviation with feature-adaptive strategy; however, this increase is considered minor dimension still being close to nominal dimension.
Prediction of deviation is denoted by the straight line that is drawn on each bar in Figure 4. As far as prediction accuracy is concerned, the results correctly follow the tendency in terms of dimension change for all cases, and thus, they are highly reliable when employed for this purpose. However, model’s resolution may not suffice to predict dimensional changes in the desired order, due to inherent AM system’s precision capability and secondarily to the models’ prediction ability. Even so, feature-adaptive methodology is still valid and could become even more efficient when equipped with more accurate models or performed on more precise AM systems.
In any case, feature-adaptive strategy succeeded to fabricate specimens with reduced dimensional deviation in general and successfully rectified the issue of severe compromise when multiple responses are attempted to reach a global optimum, as in the case of X-axis and TW.
Adaptive material extrusion settings include ‘on-the-fly’ feed-rate and material flow modification on a continuous tool-path. According to the results, this capability is proven beneficial to dimensional accuracy of the part although it may affect the dynamic response of the AM system, due to additional acceleration–deceleration motion phases. Therefore, special handling is required regarding the rate of permitted modification of settings, in order to minimize system vibrations. The vibrations are easily identified by the characteristic ripples on the outer surface of the part. In Figure 5(a), the ripples are caused by nozzle acceleration after finishing fabrication of thin wall region at a slower feed-rate compared to the optimized feed rate pertaining to accuracy improvement along X-axis, while in Figure 5(b), the entire layer is fabricated under constant parameter settings and hence the outer surface is affected to a lesser extent.
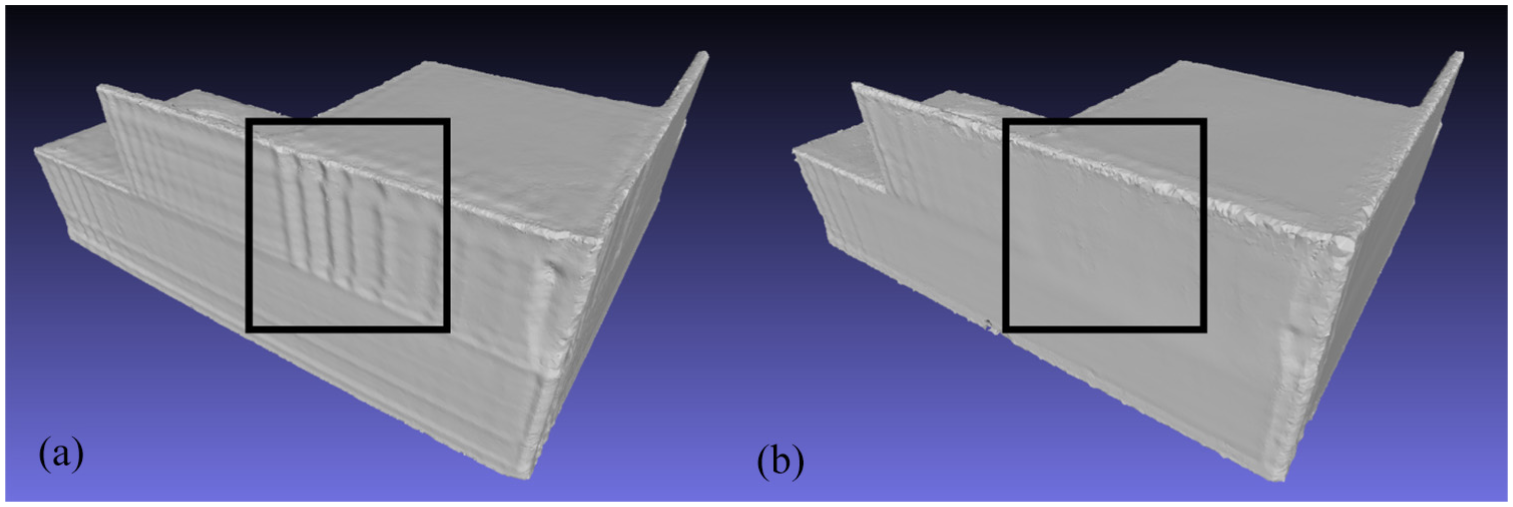
Ripples formation during thin wall manufacturing (a) due to instant change in feed-rate and material flow and (b) with constant settings.
Direct modifications on AM machine instructions are performed by a simple text handling routine accompanied by a G-code viewing tool. Obviously, features where tool-path is repeated, such as holes and bosses, are easily detected and edited at a post-processing stage.
Conclusion
In this study, five feature-specific models were generated following the well-known response surface methodology. Experiments were carefully planned according to a CCD, consisting of 20 experiments. The minimal number of experiments in combination with the powerful attributes of a CCD suggest a solid and efficient DoE.
To the best of the authors’ knowledge, it is the first time that adaptive settings, not only on discrete regions of the same layer but also on continuous material strand, are systematically investigated and compared to the standard multiple-objective optimization approach. The results are very promising, indicating that parts are manufactured closer to nominal dimensions. The ability to parameterize different regions and features may unlock new capabilities on the way parts are fabricated.
The proposed method is directly applicable by any user via post-processing of the machine instruction file. The type of feature as such does not undermine the approach, as long as its accuracy can be mapped to a specific range of printing parameter values. When it comes to more complex features, it is suggested that feature-adaptive models should be integrated with existing slicing software, so that the adaptive settings are generated during slicing procedure, eliminating the need of file post-processing.
Limitations of the feature-adaptive approach, such as the effect of instantaneous feed-rate modification on the AM system dynamics, is pointed out, guiding to future topics of research in order to move feature adaptive optimization from a proof-of-concept towards a truly functional stage.
Footnotes
Declaration of conflicting interests
The author(s) declared no potential conflicts of interest with respect to the research, authorship, and/or publication of this article.
Funding
The author(s) disclosed receipt of the following financial support for the research, authorship, and/or publication of this article: This research is financially supported by the National Technical University of Athens PhD stipends.