
Abstract
The objective of this work is to investigate the influences of three machining factors (burnishing speed V, feed rate f, and depth of penetration a) on the improved rate of arithmetic average roughness ΔRa, improved rate of maximum height roughness ΔRy, and improved rates of surface hardness ΔSH. The internal roller burnishing experiments were conducted with the aid of the computer numerical control machining center and Box–Behnken experimental design. The Kriging models were used to render the highly nonlinear relationships between inputs and outputs. An integrative approach combining a Non-dominated Sorting Genetic Algorithm II and Technique for Order Preference by Similarity to Ideal Solution was adopted to generate a set of feasible optimal solutions and determine the best machining conditions. The scanning electron microscopy images were depicted to investigate the surface morphology at the different conditions. The X-ray diffraction was applied to measure the compressive stresses at the external surface. The results showed that the predicted values of the objectives have good agreement with the experimental ones. High surface quality is characterized by an improved average roughness of 95.80%, an enhancement in the maximum roughness of 91.98%, and an improvement in surface hardness of 45.44%, compared to pre-machined surfaces. The selection of optimum process parameters could help the burnishing operators to save the machining costs and time. The combination of Kriging model, Non-dominated Sorting Genetic Algorithm II, and Technique for Order Preference by Similarity to Ideal Solution is considered as an intelligent approach for modeling and optimization of burnishing processes.
Keywords
Introduction
Roller burnishing is a surface finishing operation of the elastic-plastic or ductile materials, in which the valleys are filled due to the plastic deformation under the working pressure. The tensile stress was transferred into the compressive one in order to improve mechanical properties. This technique possesses various advantages, including lower roughness, improved hardness, high corrosion, fatigue resistance, and high efficiency, compared to other techniques (i.e. grinding, polishing, lapping, and honing). Consequently, the roller burnishing is widely applied in the finishing operation of automotive crankshafts, bearing races, and cylinders.
Surface integrity is defined as metallurgical modifications in the workpiece surface and effected layer caused by manufacturing processes. Characteristics of surface integrity have various major components, including the surface texture, microstructure, hardness, and residual stress. Numerous publications indicated that the quality and lifetime of the dynamically loaded components depends on the properties of the machined surface. 1 Several failures generated by fatigue, creep, cracking, and stress corrosion at the surface of the components could be due to the undesired quality of the surface. 2 Consequently, machined component is first necessary to satisfy the surface integrity requirements.
Generally, different methods were applied to evaluate the surface integrity after machining processes. 3 There are three efficient approaches to characterize the surface texture and the surface geometry, including the electronic-type measurement, optical-type measurement, and scanning probe microscopy methods. The X-ray diffraction (XRD) and electron diffraction were recommended as the robust methods to evaluate the microstructure characterization. The XRD was widely used as a non-destructive method to determine crystalline structure and residual stress from the lattice deformation of a crystal. The electron diffraction (e.g. scanning electron microscopy (SEM)) having electron beam is used to visualize small objects. In addition, the X-ray fluorescence (XRF) and X-ray photoelectron spectroscopy (XPS) were widely applied to analyze the element and chemical composition. Furthermore, transmission electron microscopy (TEM) is an effective technique to investigate the microstructure of materials with very high spatial resolution.
The effects of burnishing parameters on the surface properties have been investigated by many researchers. Burnishing parameters were optimized in an effort to improve the surface quality in terms of the aluminum alloy 6061-T64 and the AISI 1010 steel plate. 5 The influences of new manufacturing methods, including the ultrasonic burnishing and ball vibration assisted on the surface integrities, have been presented.6,7 López de Lacalle et al. 8 investigated the parametric effects on the surface roughness and hardness in the burnishing process of the P20 and Inconel 718 materials. Two different strategies, including the continuation and patch burnishing, were proposed to improve the surface roughness in the five-axis machining process of AISI 1045 and DIN 1.2379 steel. 9 Furthermore, the hydrostatic deep ball-burnishing technique was developed to enhance the surface roughness, micro hardness, and residual stress. 10 Klocke et al. 11 proposed a finite element model to predict the residual stresses for various parameters and materials. John et al. 12 attempted to optimize the process parameters and stock allowances for maintaining bore size and surface finish in the internal burnishing process. In addition, machining factors of external burnishing processes have been considered for improving surface properties.13–15
As a result, the machining parameters considered include the burnishing speed, force, feed rate, number of tool passes, and workpiece characteristics. The common machining responses are the surface roughness, hardness, and residual stresses. 16 Different optimizing techniques, including response surface methodology (RSM),11–13,15 Taguchi,17,18 and fuzzy neural system,19,20 were used to explore the relationships between inputs and outputs. However, the aforementioned publications for improving surface properties still have the following limitations and challenges:
The optimizing approaches applied, such as RSM and fuzzy neural system, do not ensure the comprehensive accuracy for nonlinear responses. In addition, the Taguchi-based methods do not guarantee the global optimal solution due to discrete optimizing space.
Most of the aforementioned publications considered the arithmetical mean roughness Ra as an indicator of machined part quality. Practically, another roughness, such as maximum height roughness Ry, is also necessary to consider as an important machining response.
Machining parameter optimization for solving the trade-off among the surface roughness criteria (i.e. Ra and Ry) and surface hardness of the interior burnishing processes has not been performed.
To fulfill the mentioned research gaps, a multi-objective optimization of process parameters of the internal roller burnishing has been considered in this article for improving the surface properties. The surface improvements, including roughness criteria (i.e. Ra and Ry) and hardness, were considered as important machining responses. The Kriging model was used instead of RSM and Taguchi to render the highly nonlinear relationship between machining parameters and burnishing responses. The Kriging model is an efficient method for nonlinear modeling and saving experimental costs. A hybrid approach using Non-dominated Sorting Genetic Algorithm II (NSGA-II) and Technique for Order Preference by Similarity to Ideal Solution (TOPSIS) was used to generate the feasible design points and identify the best optimal solution.
Materials and methods
Optimization framework
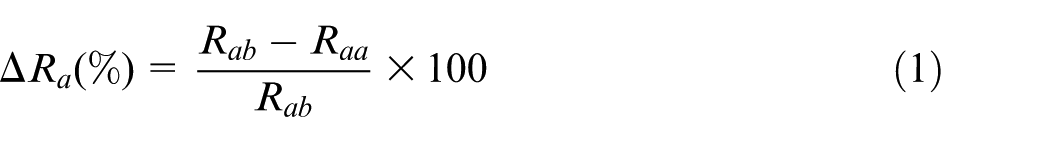
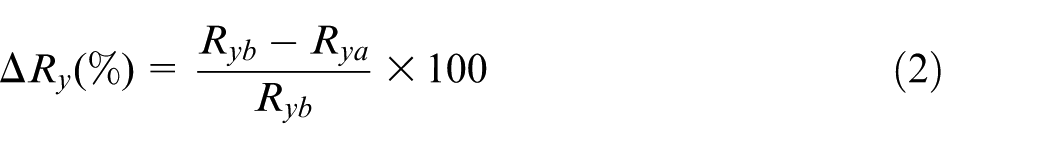
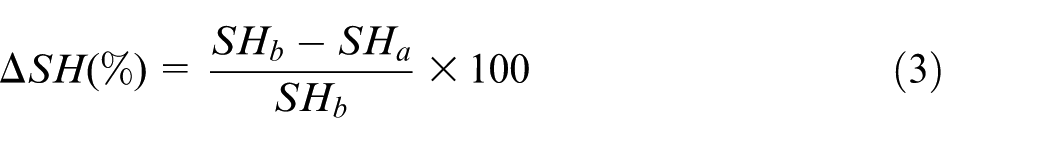
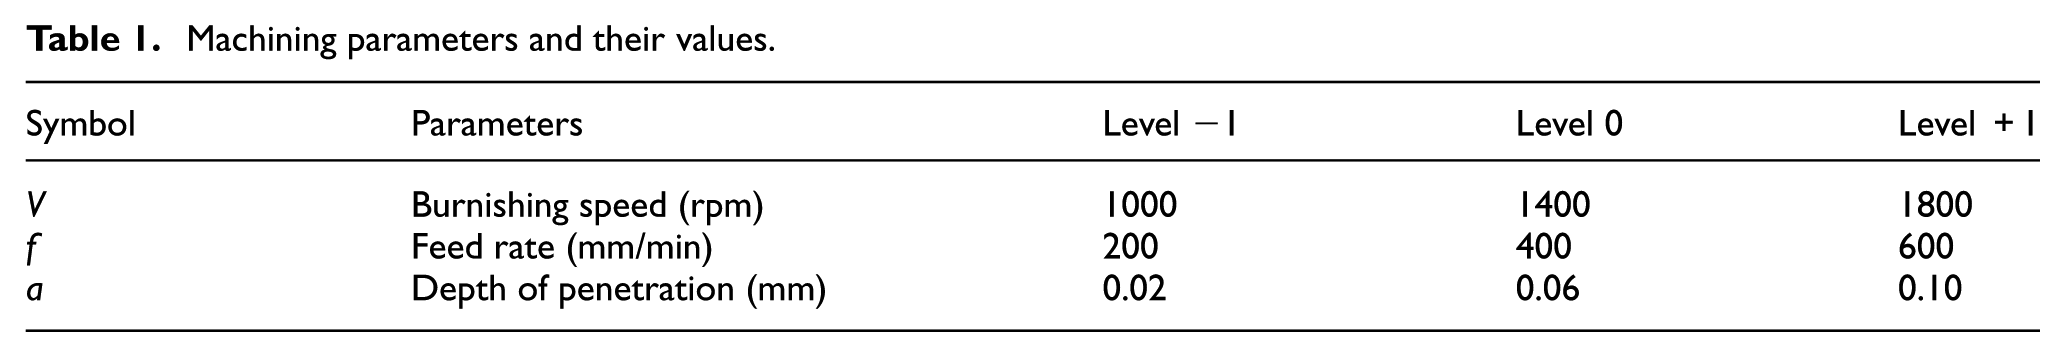
The optimizing procedure was systematically exhibited in Figure 1 in order to develop predictive models and determine optimal values. The experimental matrix was generated using the Box–Behnken method to avoid a costly full-factorial experiment and ensure the modeling accuracy.21,22 Three key parameters, including burnishing speed V, feed rate f, and depth of penetration a, as well as three levels (–1, 0, +1) were shown in Table 1. The predictive models of the improved rate of the arithmetic average roughness ΔRa, the improved rate of maximum height roughness ΔRy, and the improved rate of surface hardness ΔSH were then developed with respect to process parameters using Kriging models. The ΔRa, ΔRy, and ΔSH were calculated as follows
Machining parameters and their values.
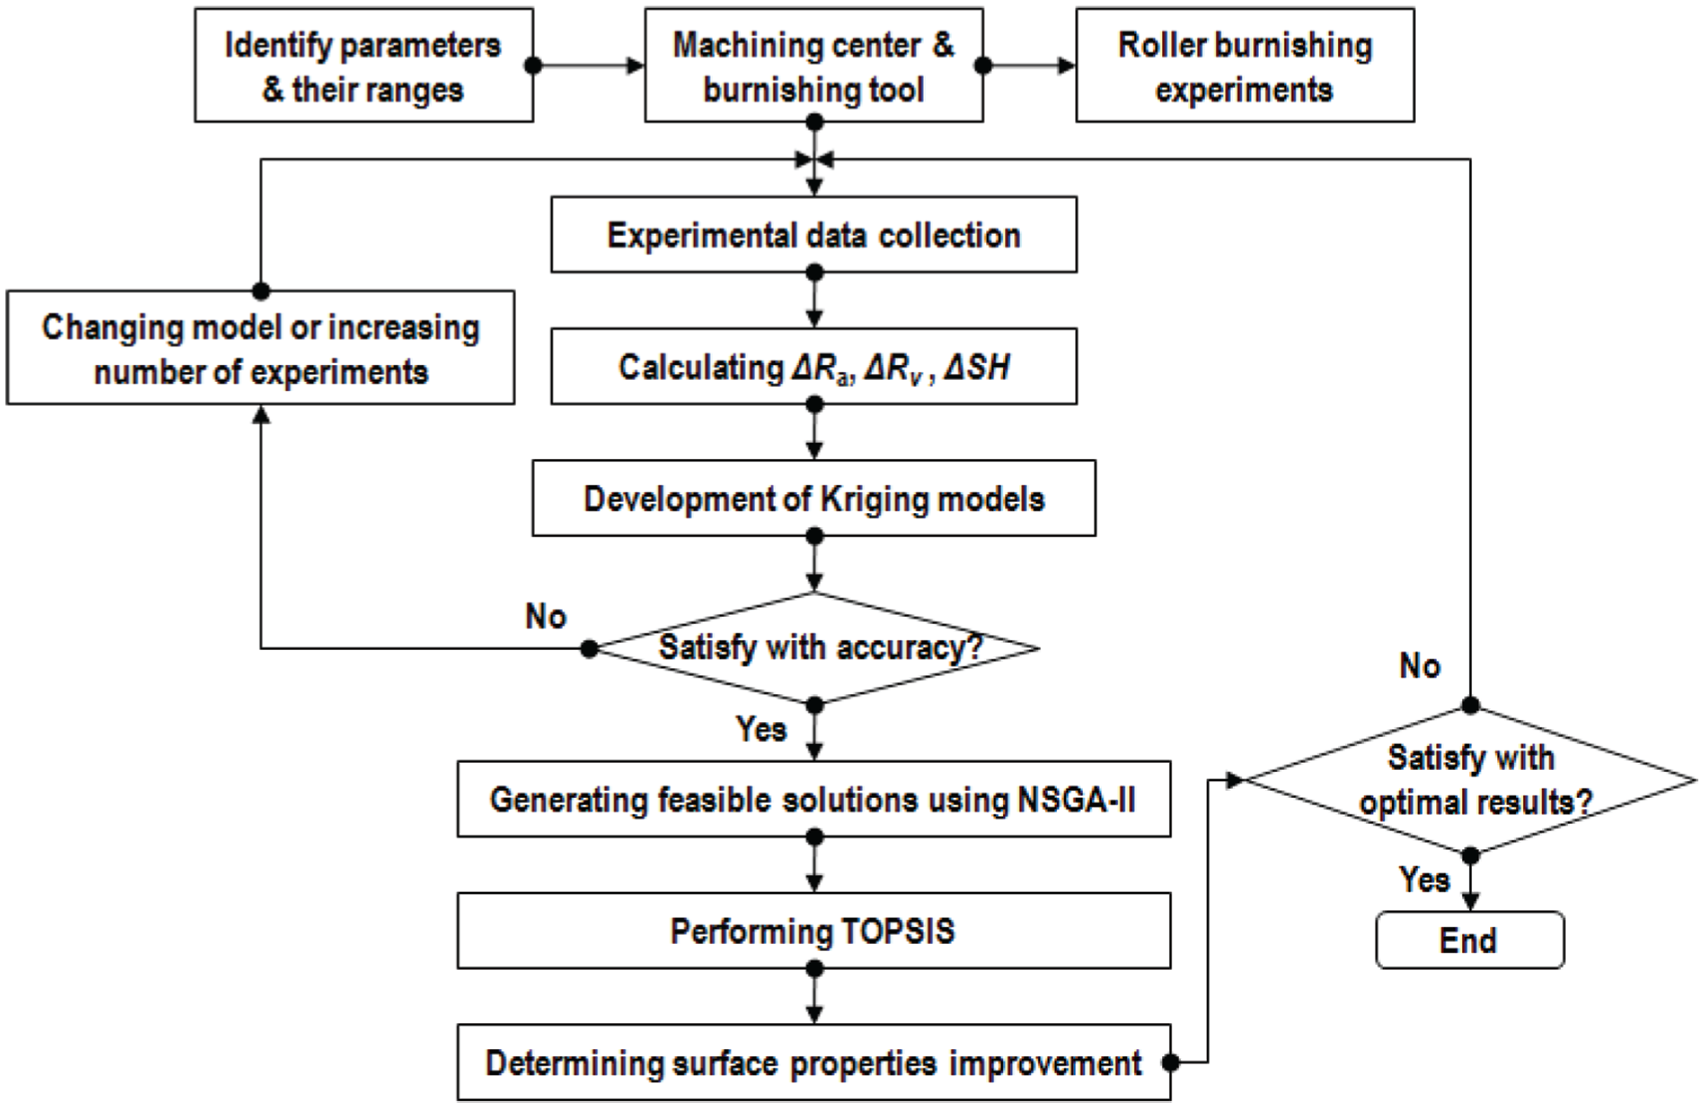
Optimizing procedure.
here Rab and Raa are the arithmetic average roughness before and after burnishing process, respectively. Ryb and Rya are the maximum height roughness before and after burnishing process, respectively. SHb and SHa are the surface hardness before and after burnishing process, respectively.
In this article, NSGA-II was used to find a set of feasible solutions and surface integrity enhancements. NSGA-II is an evolutionary optimizing technique, in which each objective is resolved individually and a set of feasible solutions is observed. The operating mutation and solution are performed by means of the chosen designs. The search history and solution selection are conducted using a myriad of different heuristics. The best values of the responses were determined at the end of the convergent run.23,24 Finally, the TOPSIS was used to determine the best design point.25,26 Basically, this method identifies the best compromised solution, which satisfies the requirements of the objective functions according to the objective weights.
Experiments and measurements
In this article, two methods of heat treating of steel, including the quenching and tempering, were adopted in order to observe the desired hardness. In the quenching processes, the workpiece was rapidly heated to 650 °C in the resistance furnace and kept at the desired temperature in 50 min. The specimen was immersed completely in the oil tanks in order to return to the room temperature. The charcoal was used to prevent the oxidation phenomena and released carbon in the workpiece surface. In the tempering process, the workpiece temperature was decreased to 430 °C and kept at the desired temperature in 70 min. The specimen was then cooled in the normal air to achieve the room temperature.
The pre-machining approaches, including drilling and turning operations, were performed on a computer numerical control (CNC) lathe machine entitled HC-30 N in order to produce the internal holes from raw material. The drilling process was conducted with the aid of a high speed drill tool having a diameter of 14.6 mm. A feed of 0.3 mm/rev, a depth of cut of 7.3 mm, and a spindle speed of 300 rpm were used as the drilling parameters. In addition, the turning tool using chemical vapor deposition (CVD)–coated inserts was adopted in conjunction with a feed of 0.25 mm/rev, a depth of cut of 0.2 mm, and a spindle speed of 500 rpm to produce the final shape of interior holes. The arithmetical average roughness Ra, the maximum height roughness Ry, and the surface hardness SH of the pre-machined holes are 2.26 ± 0.1 µm, 14.10 ± 0.1 µm, and 21.2 ± 0.1 HRC, respectively, as shown in Figures 2 and 3.
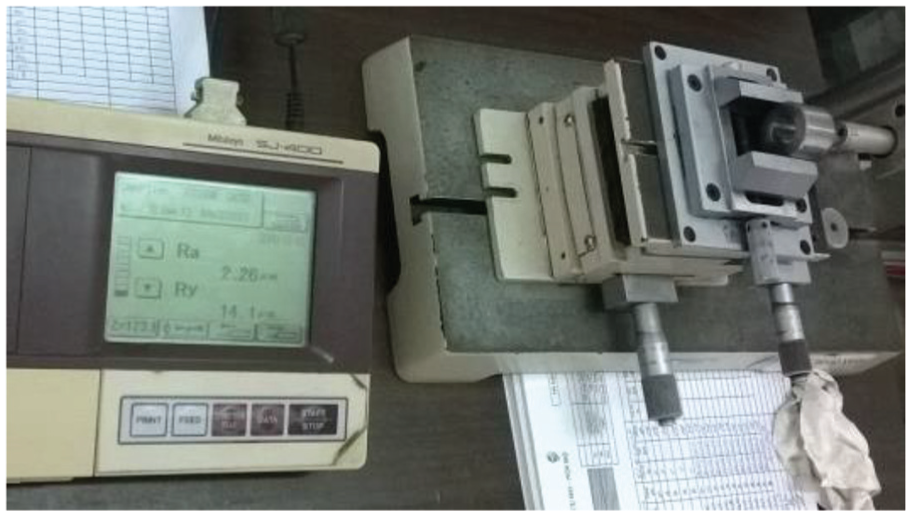
Roughness values of pre-machined surface.
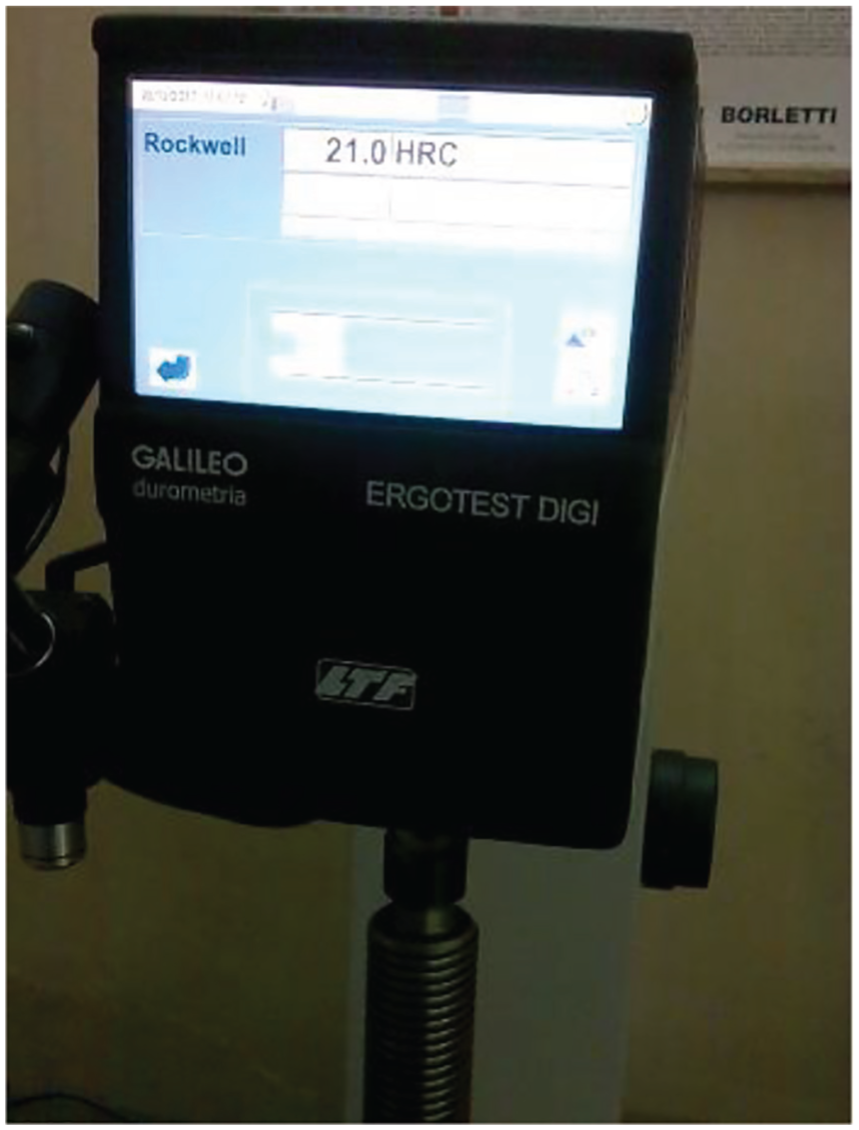
Surface hardness values of pre-machined surface.
The machining specimens with 30 × 15 × 30 mm dimensions were clamped using the precision vise. The material, namely, AISI 1045, was chosen as the workpiece due to wide applications in molding, automotive, aerospace, and marine industry. The vertical machining center ECOCA VL-1000 was adopted in conjunction with the burnishing tool using four hardened rollers to perform burnishing operations, as shown in Figure 4.
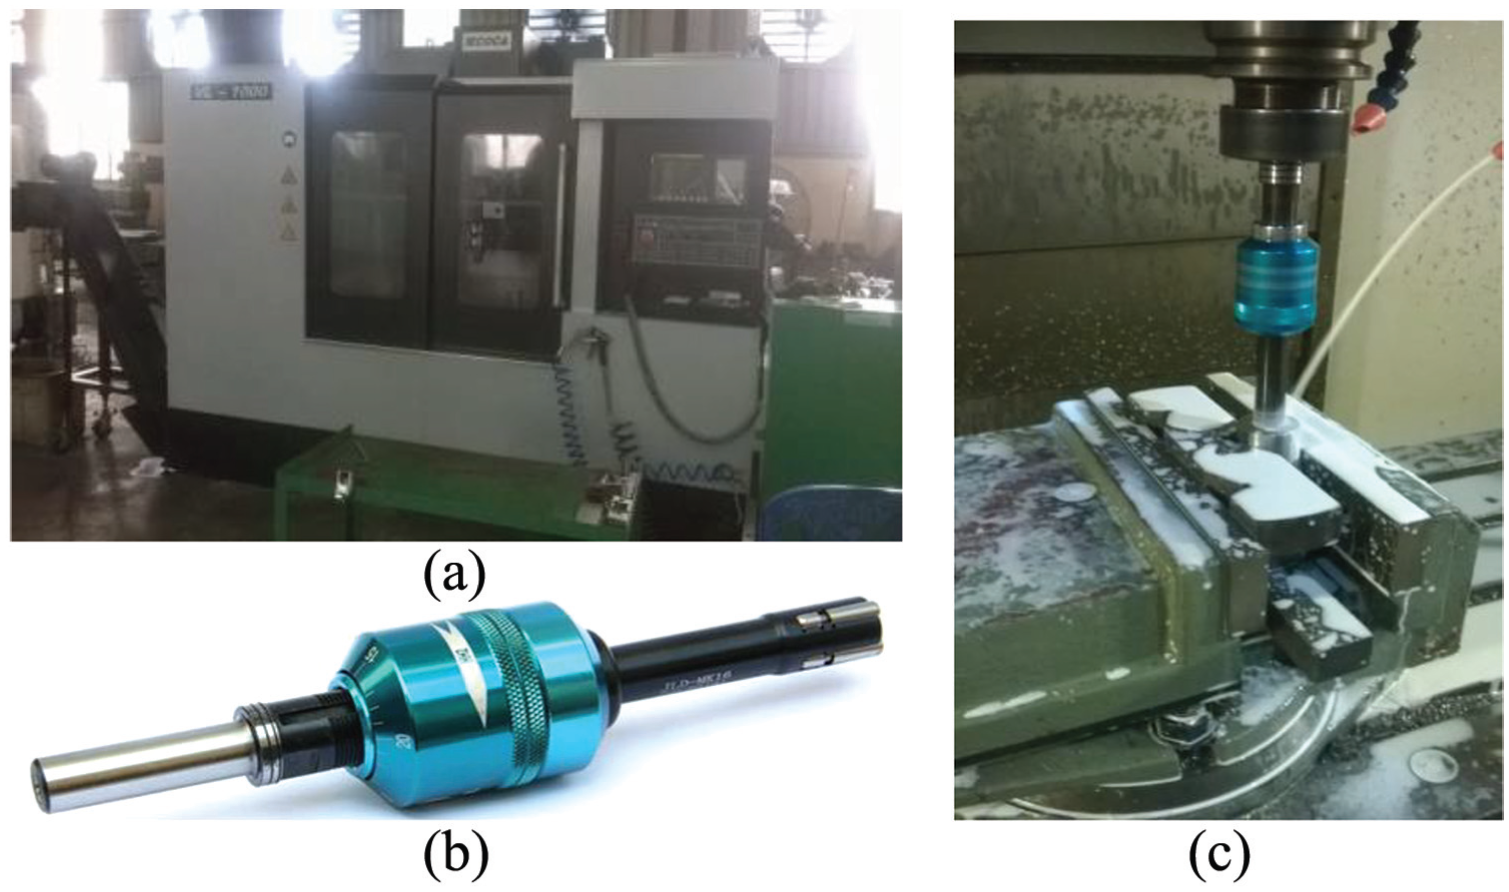
Experimental facilities: (a) vertical machining center, (b) roller burnishing tool, and (c) burnishing operations.
Surface roughness values of pre-machined and burnished surfaces were measured using a tester Mitutoyo SJ-400. In addition, the surface hardness was investigated by a digital automatic hardness tester, namely, ERGOTEST DIGI-25R. The average response values of surface roughness and hardness were observed by repeating five times at different positions. The representative outputs of surface properties, including Ra, Ry, and SH of the burnished surface, were displayed in Figure 5.
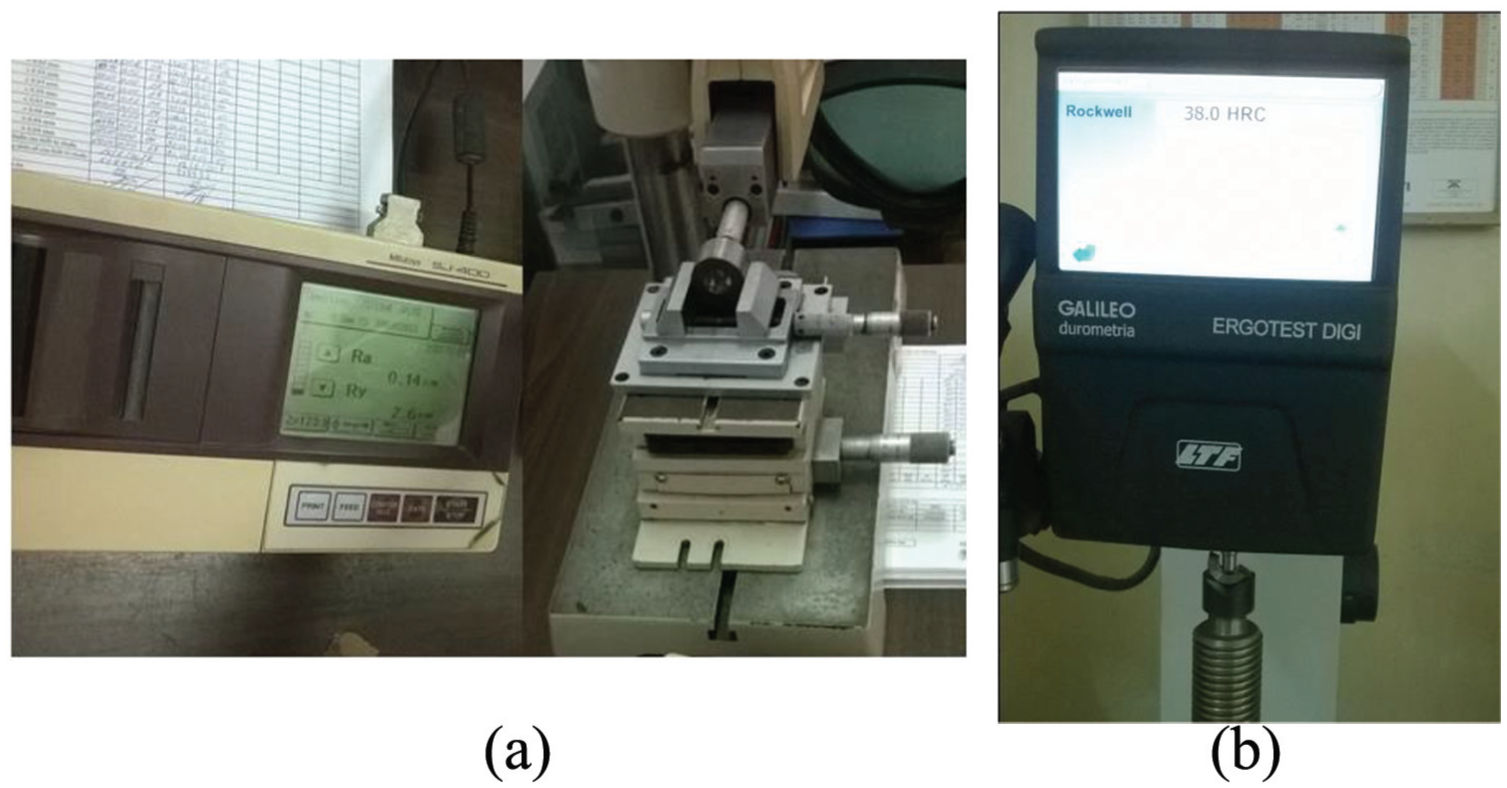
Measurements of the burnished surface: (a) roughness values and (b) surface hardness values.
To illustrate the effectiveness of the roller burnishing method, the comparisons of the R-profile diagrams between the pre-machined and burnished surface at different conditions were shown in Figure 6. As a result, low roughness values were produced in comparison with the pre-treatment levels.
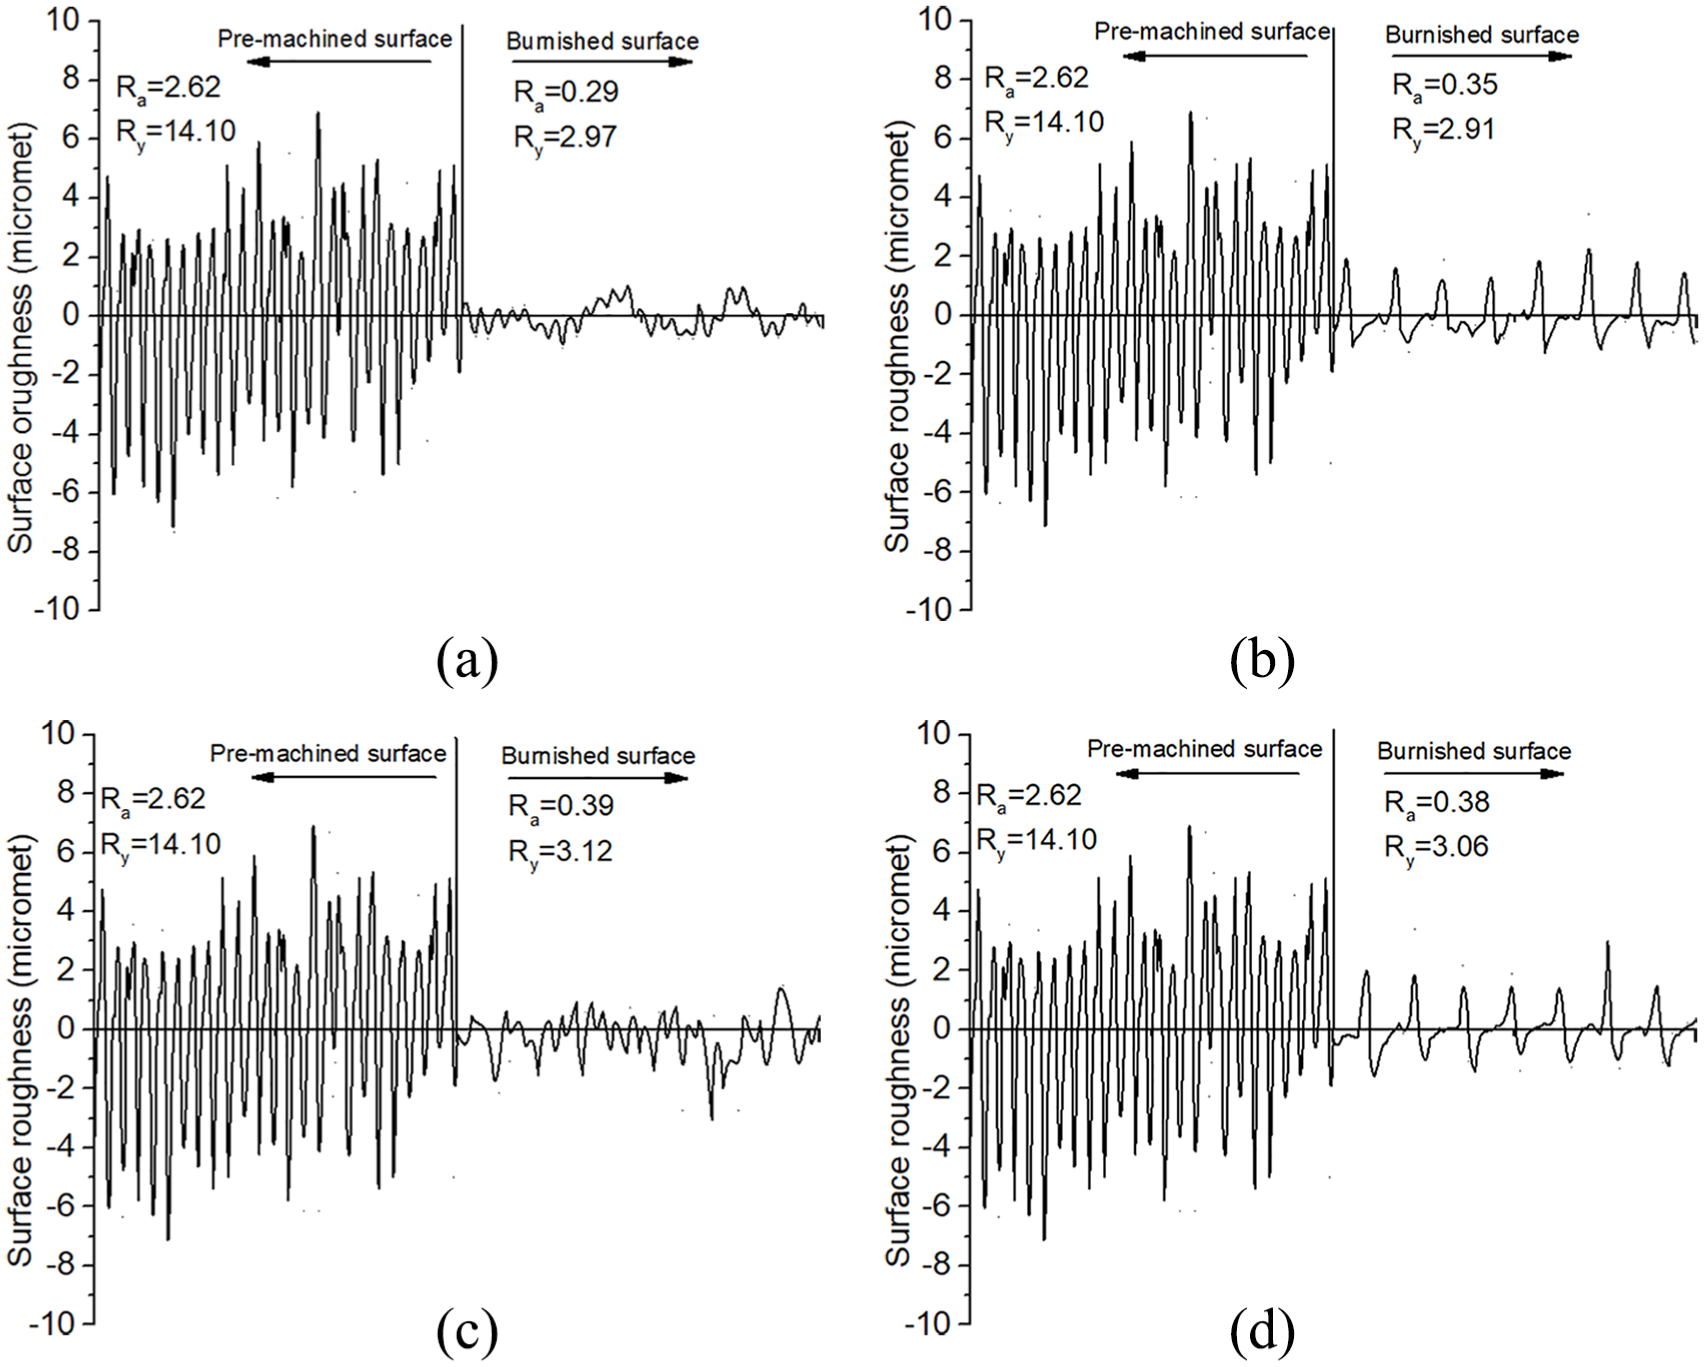
The comparisons of R-profiles at different conditions: (a) the comparisons of R-profiles at the experimental no. 3, (b) the comparisons of R-profiles at the experimental no. 7, (c) the comparisons of R-profiles at the experimental no. 12, and (d) the comparisons of R-profiles at the experimental no. 13.
Kriging model
In this article, the Kriging models of ΔRa, ΔRy, and ΔSH were developed in terms of machining parameters using the experimental data. The Kriging model is an integrative function of a known polynomial function p(x) and local deviations Z(x) 27

The covariance of Z(x) is calculated by

The correlation matrix R(xi, xj) is calculated by
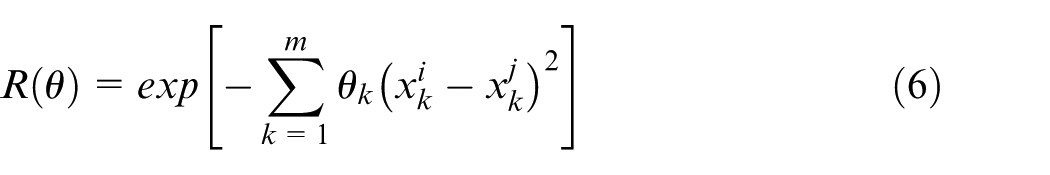
where m and θk are the number of parameters and unknown factors to be determined, respectively. The Kriging predictor is defined as
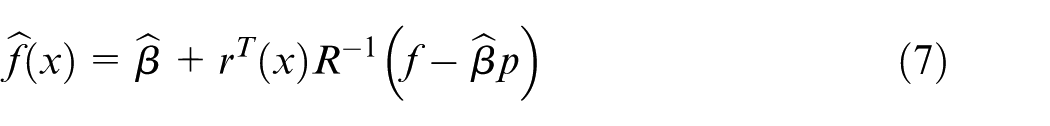
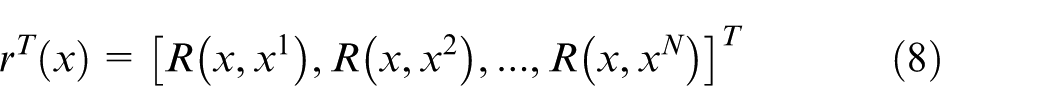
where f is the column vector containing the sample data, p is the filled column vector, and rT(x) is the correlation vector calculated by
The factor
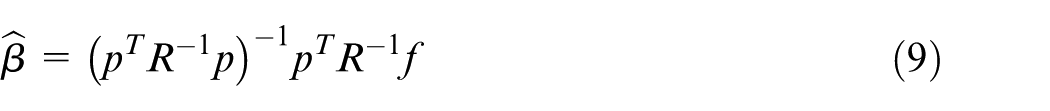
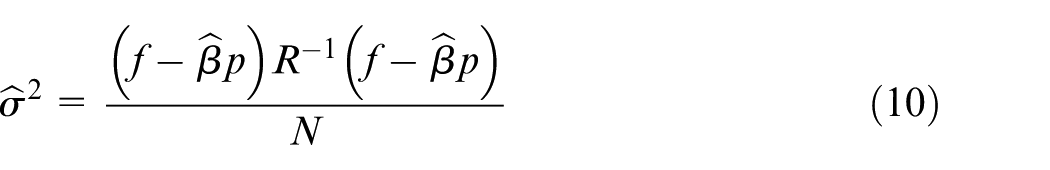
The estimated variance of the proposed model is calculated using the equation (10).
The correlation factor θk is estimated by
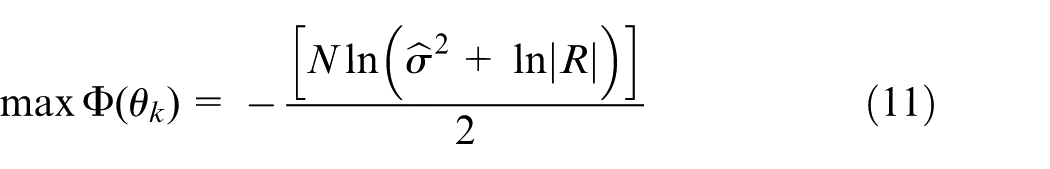
where
Experimental results
Development of Kriging models
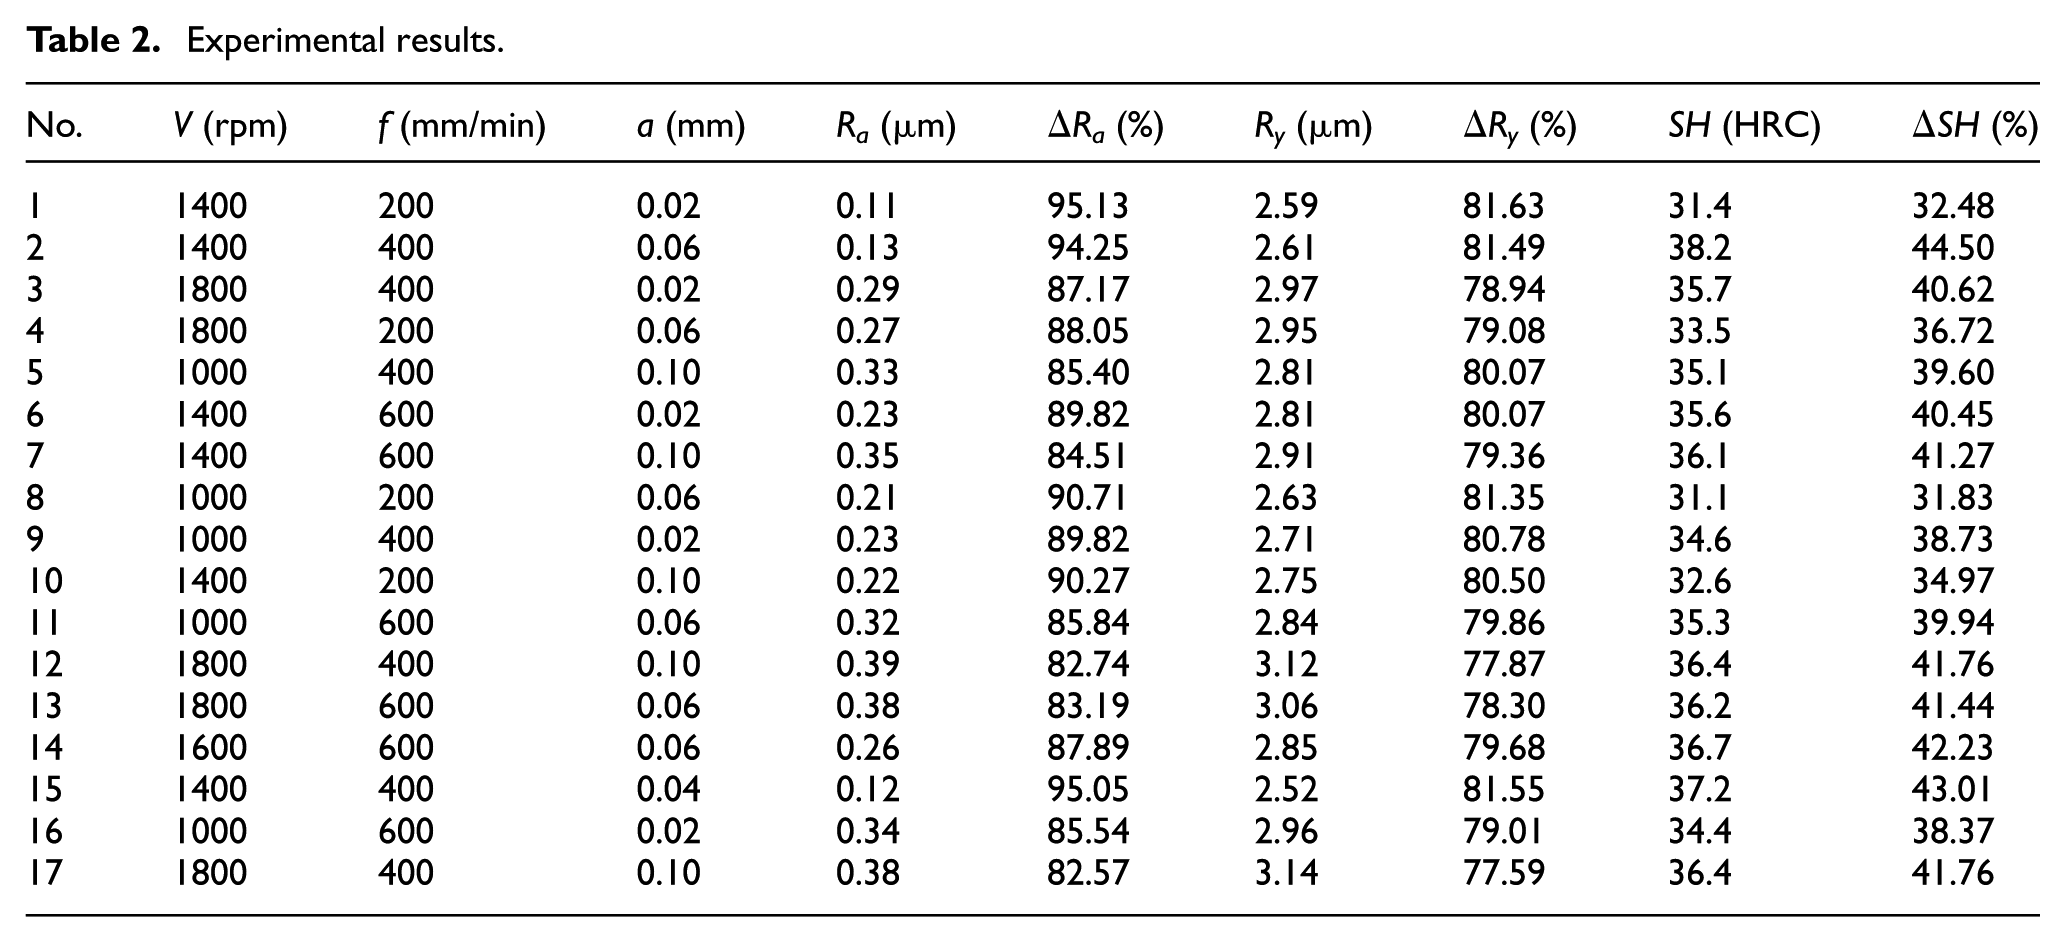
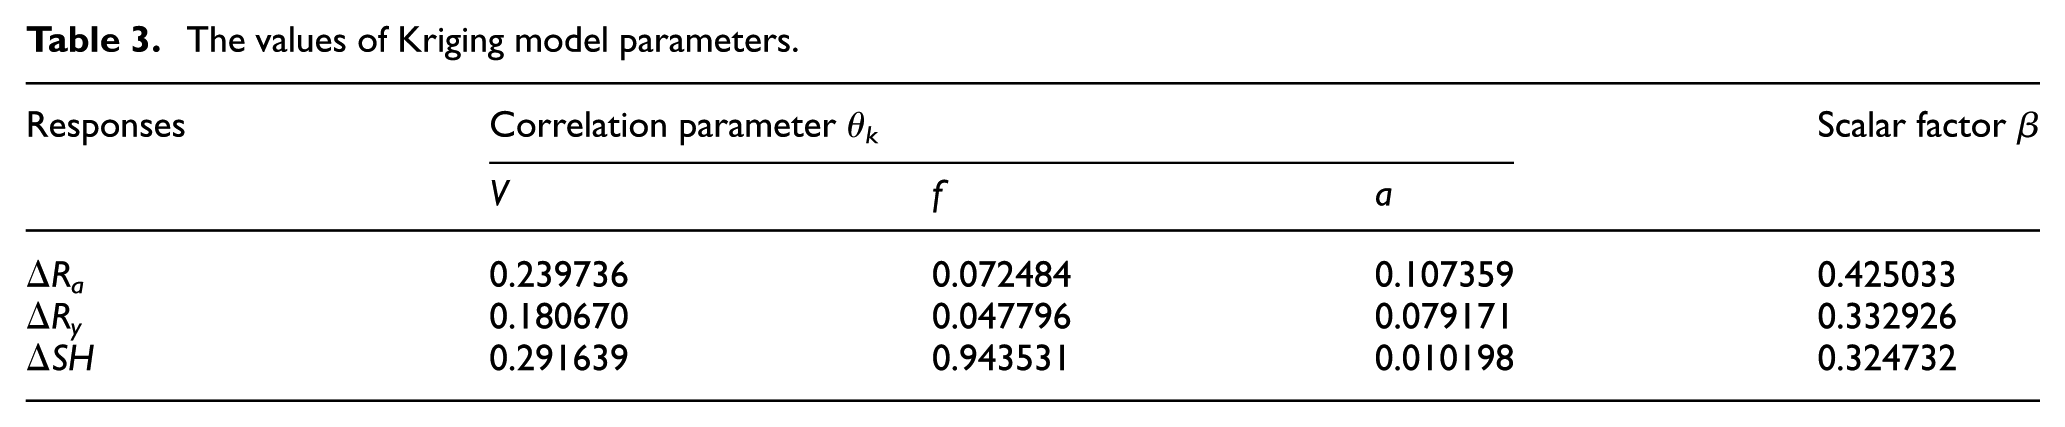
The design of experiments (DOE) matrix and experimental results of the internal burnishing process are given in Table 2. It is necessary to determine the unknown correlation parameter θk and scalar factor β to develop a Kriging surrogate. Table 3 shows the values of the correlation parameter θk and scalar factor β with the aid of the maximum likelihood method.
Experimental results.
The values of Kriging model parameters.
Model fitness
The predictive accuracy of the Kriging models developed is assessed by the R2 values. The R2 values of ΔRa, ΔRy, and ΔSH are 0.9927, 0.9925, and 0.9912, respectively. In addition, the data points are distributed on the straight lines in the same trends, as exhibited in Figure 7. There is a good correlation between predicted and measured values. Therefore, the fidelity of the Kriging models proposed of the burnishing responses is acceptable.
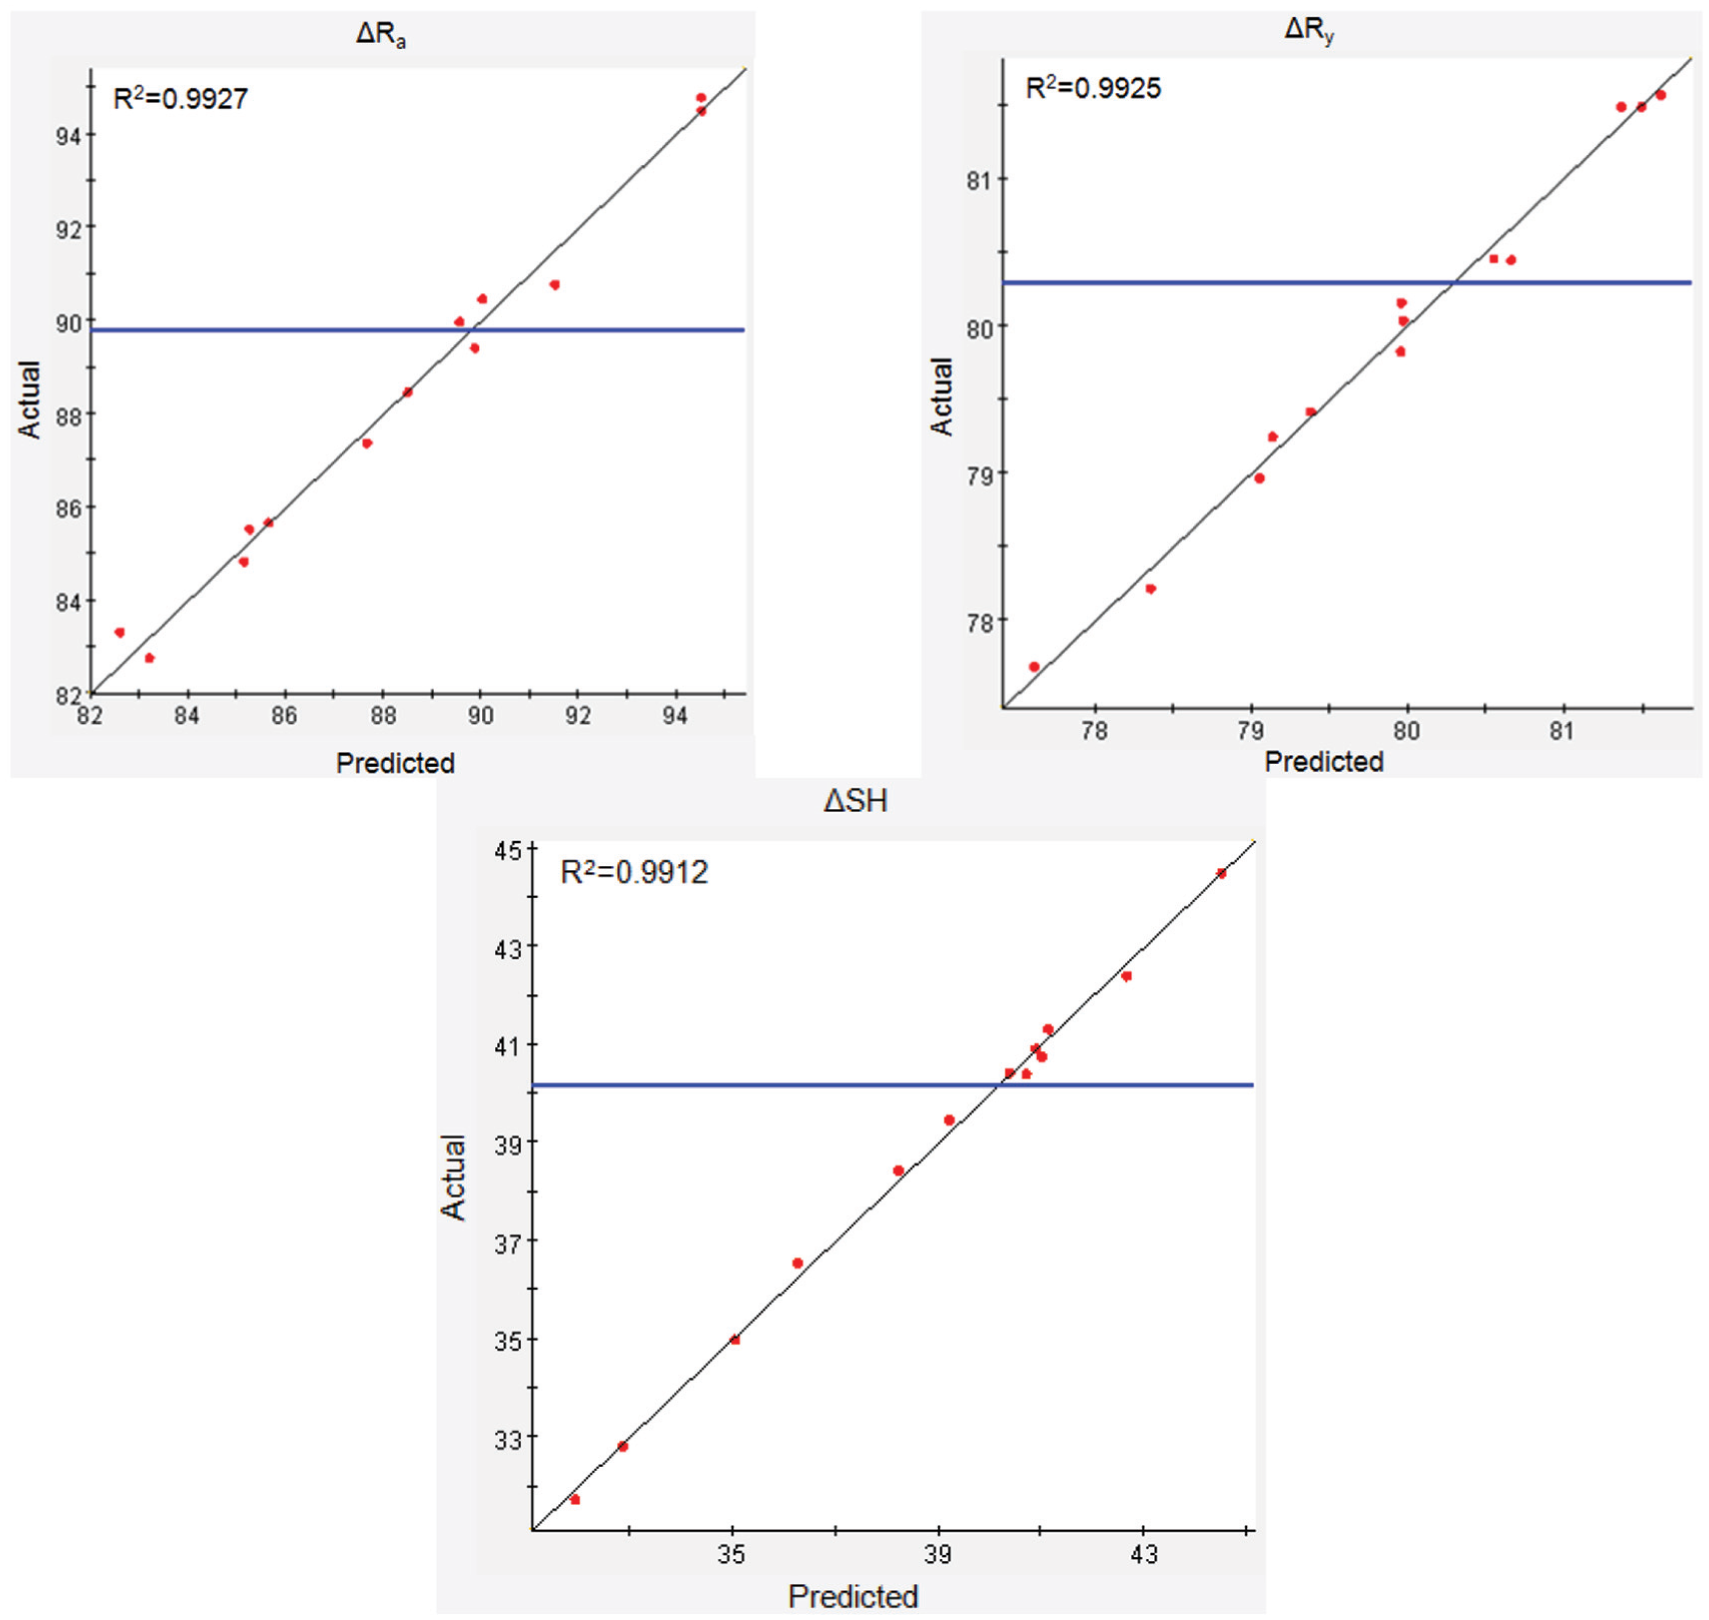
Verification of adequacy of Kriging models.
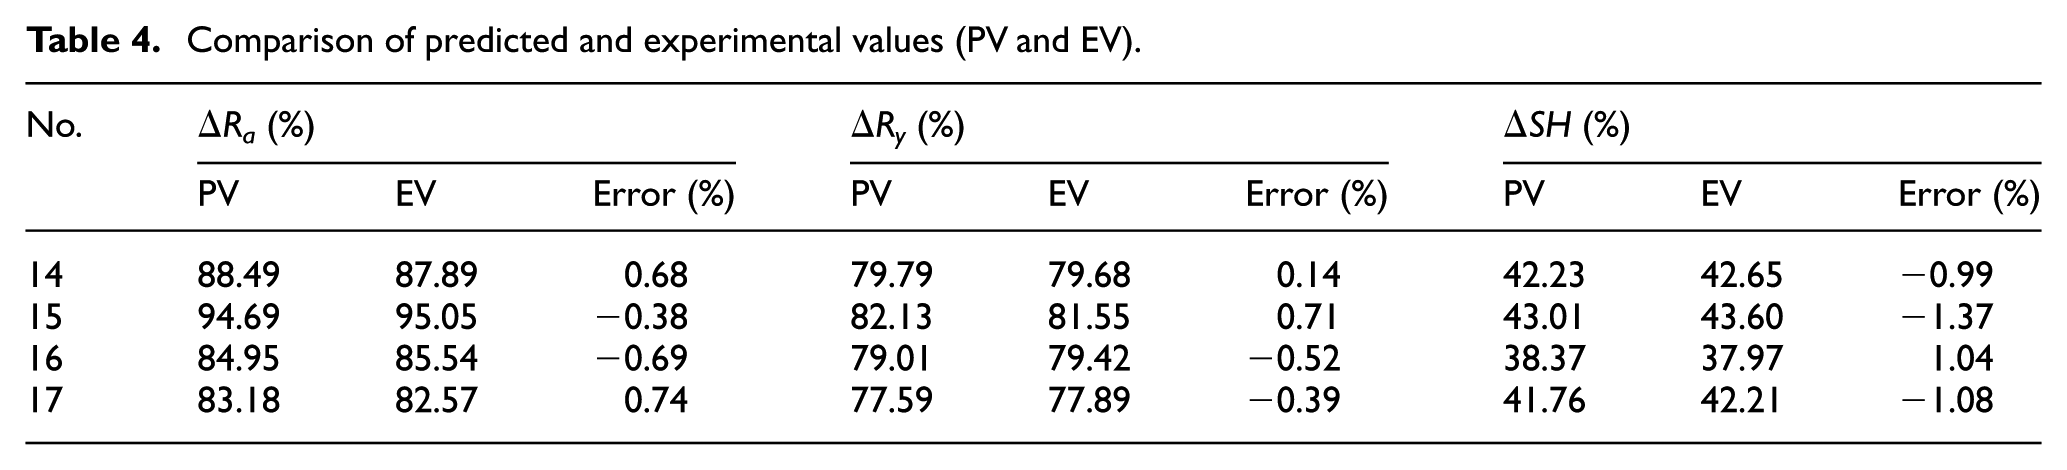
In this article, no. 1–13 were used to develop Kriging models of machining responses and no. 14–17 were adopted for testing the accuracy of the obtained Kriging model. The comparisons between predicted values (PV) and experimental values (EV) of the test points are shown in Table 4. As a result, the percentage deviations for the three responses lie within the ranges of −0.69% to 0.74%, −0.52% to 0.71%, and −1.37% to 1.04%, respectively. The small errors reveal that the adequacy of the predictive models is acceptable. The Kirging surrogates can be used to predict the burnishing responses with high accuracy.
Comparison of predicted and experimental values (PV and EV).
The effects of machining parameters on burnishing responses
The effects of machining parameters on the technological responses were depicted in the Figure 8. Figure 9 showed that the turned marks were removed and the valleys were filled due to the plastic deformation. The smooth surface was observed after the internal burnishing process.
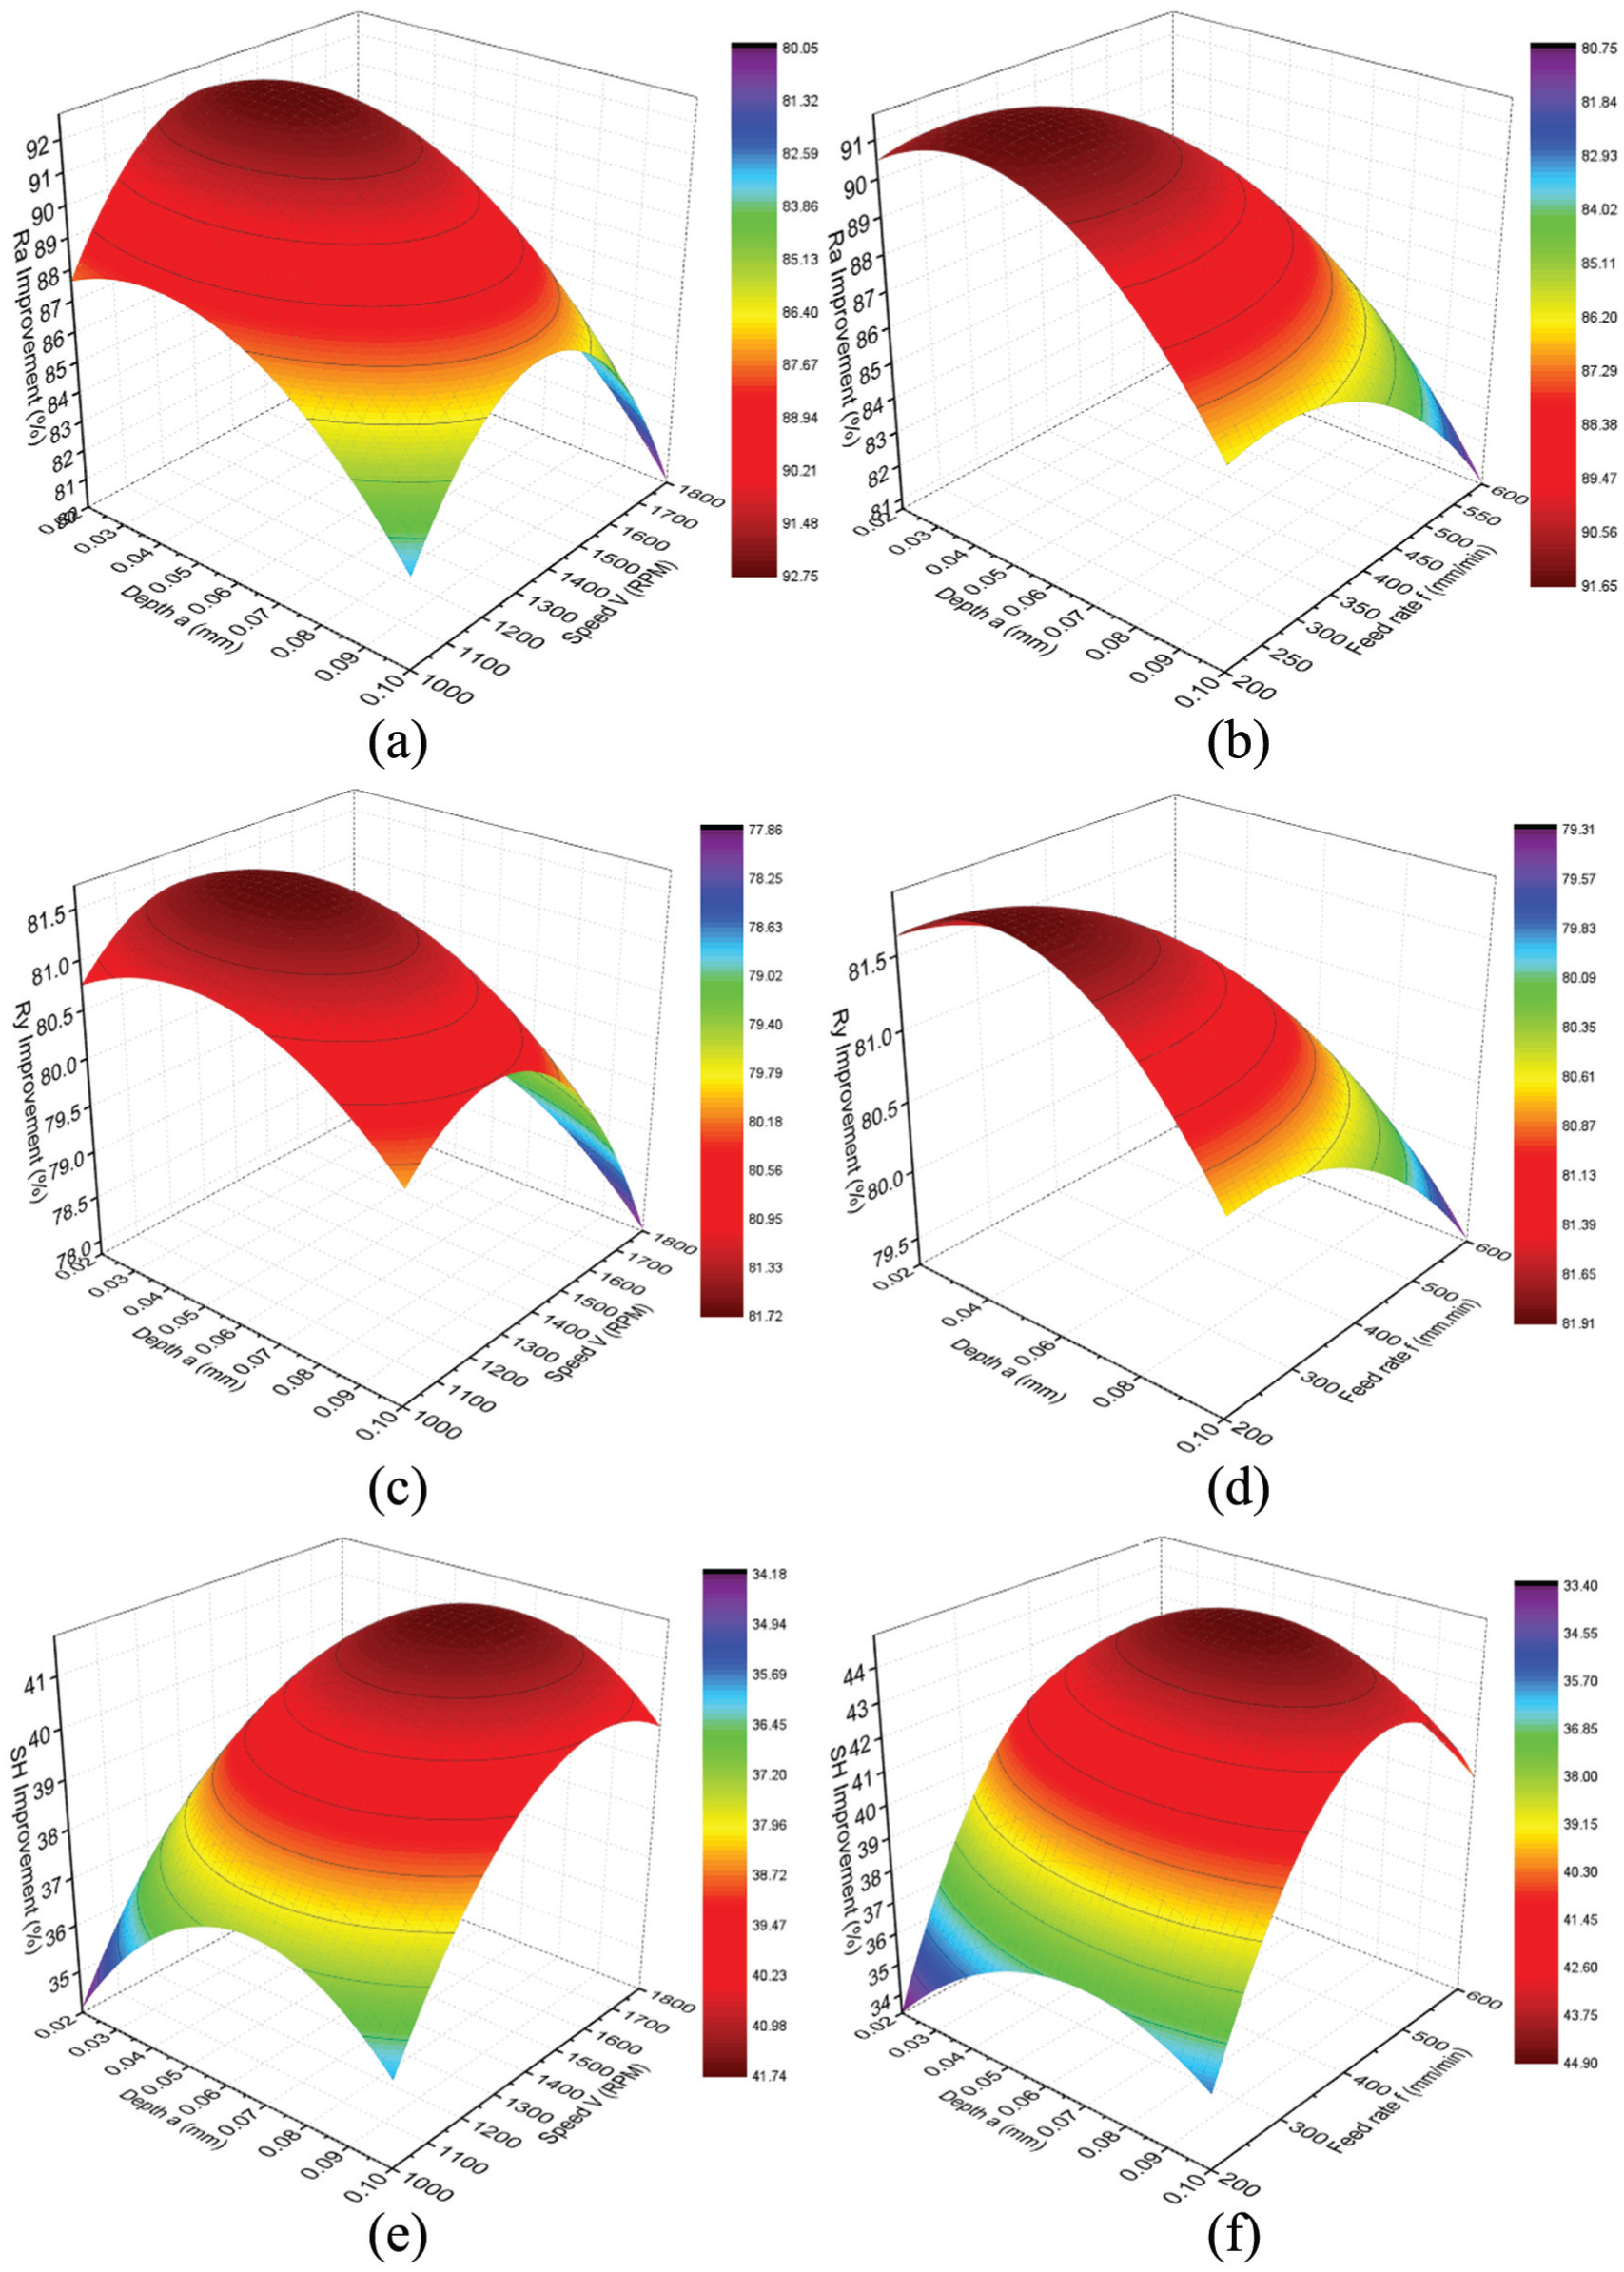
Interaction effects of machining parameters on the objectives: (a) ΔRa versus V and a, (b) ΔRa versus f and a, (c) ΔRy versus V and a, (d) ΔRy versus f and a, (e) ΔSH versus V and a, and (f) ΔSH versus f and a
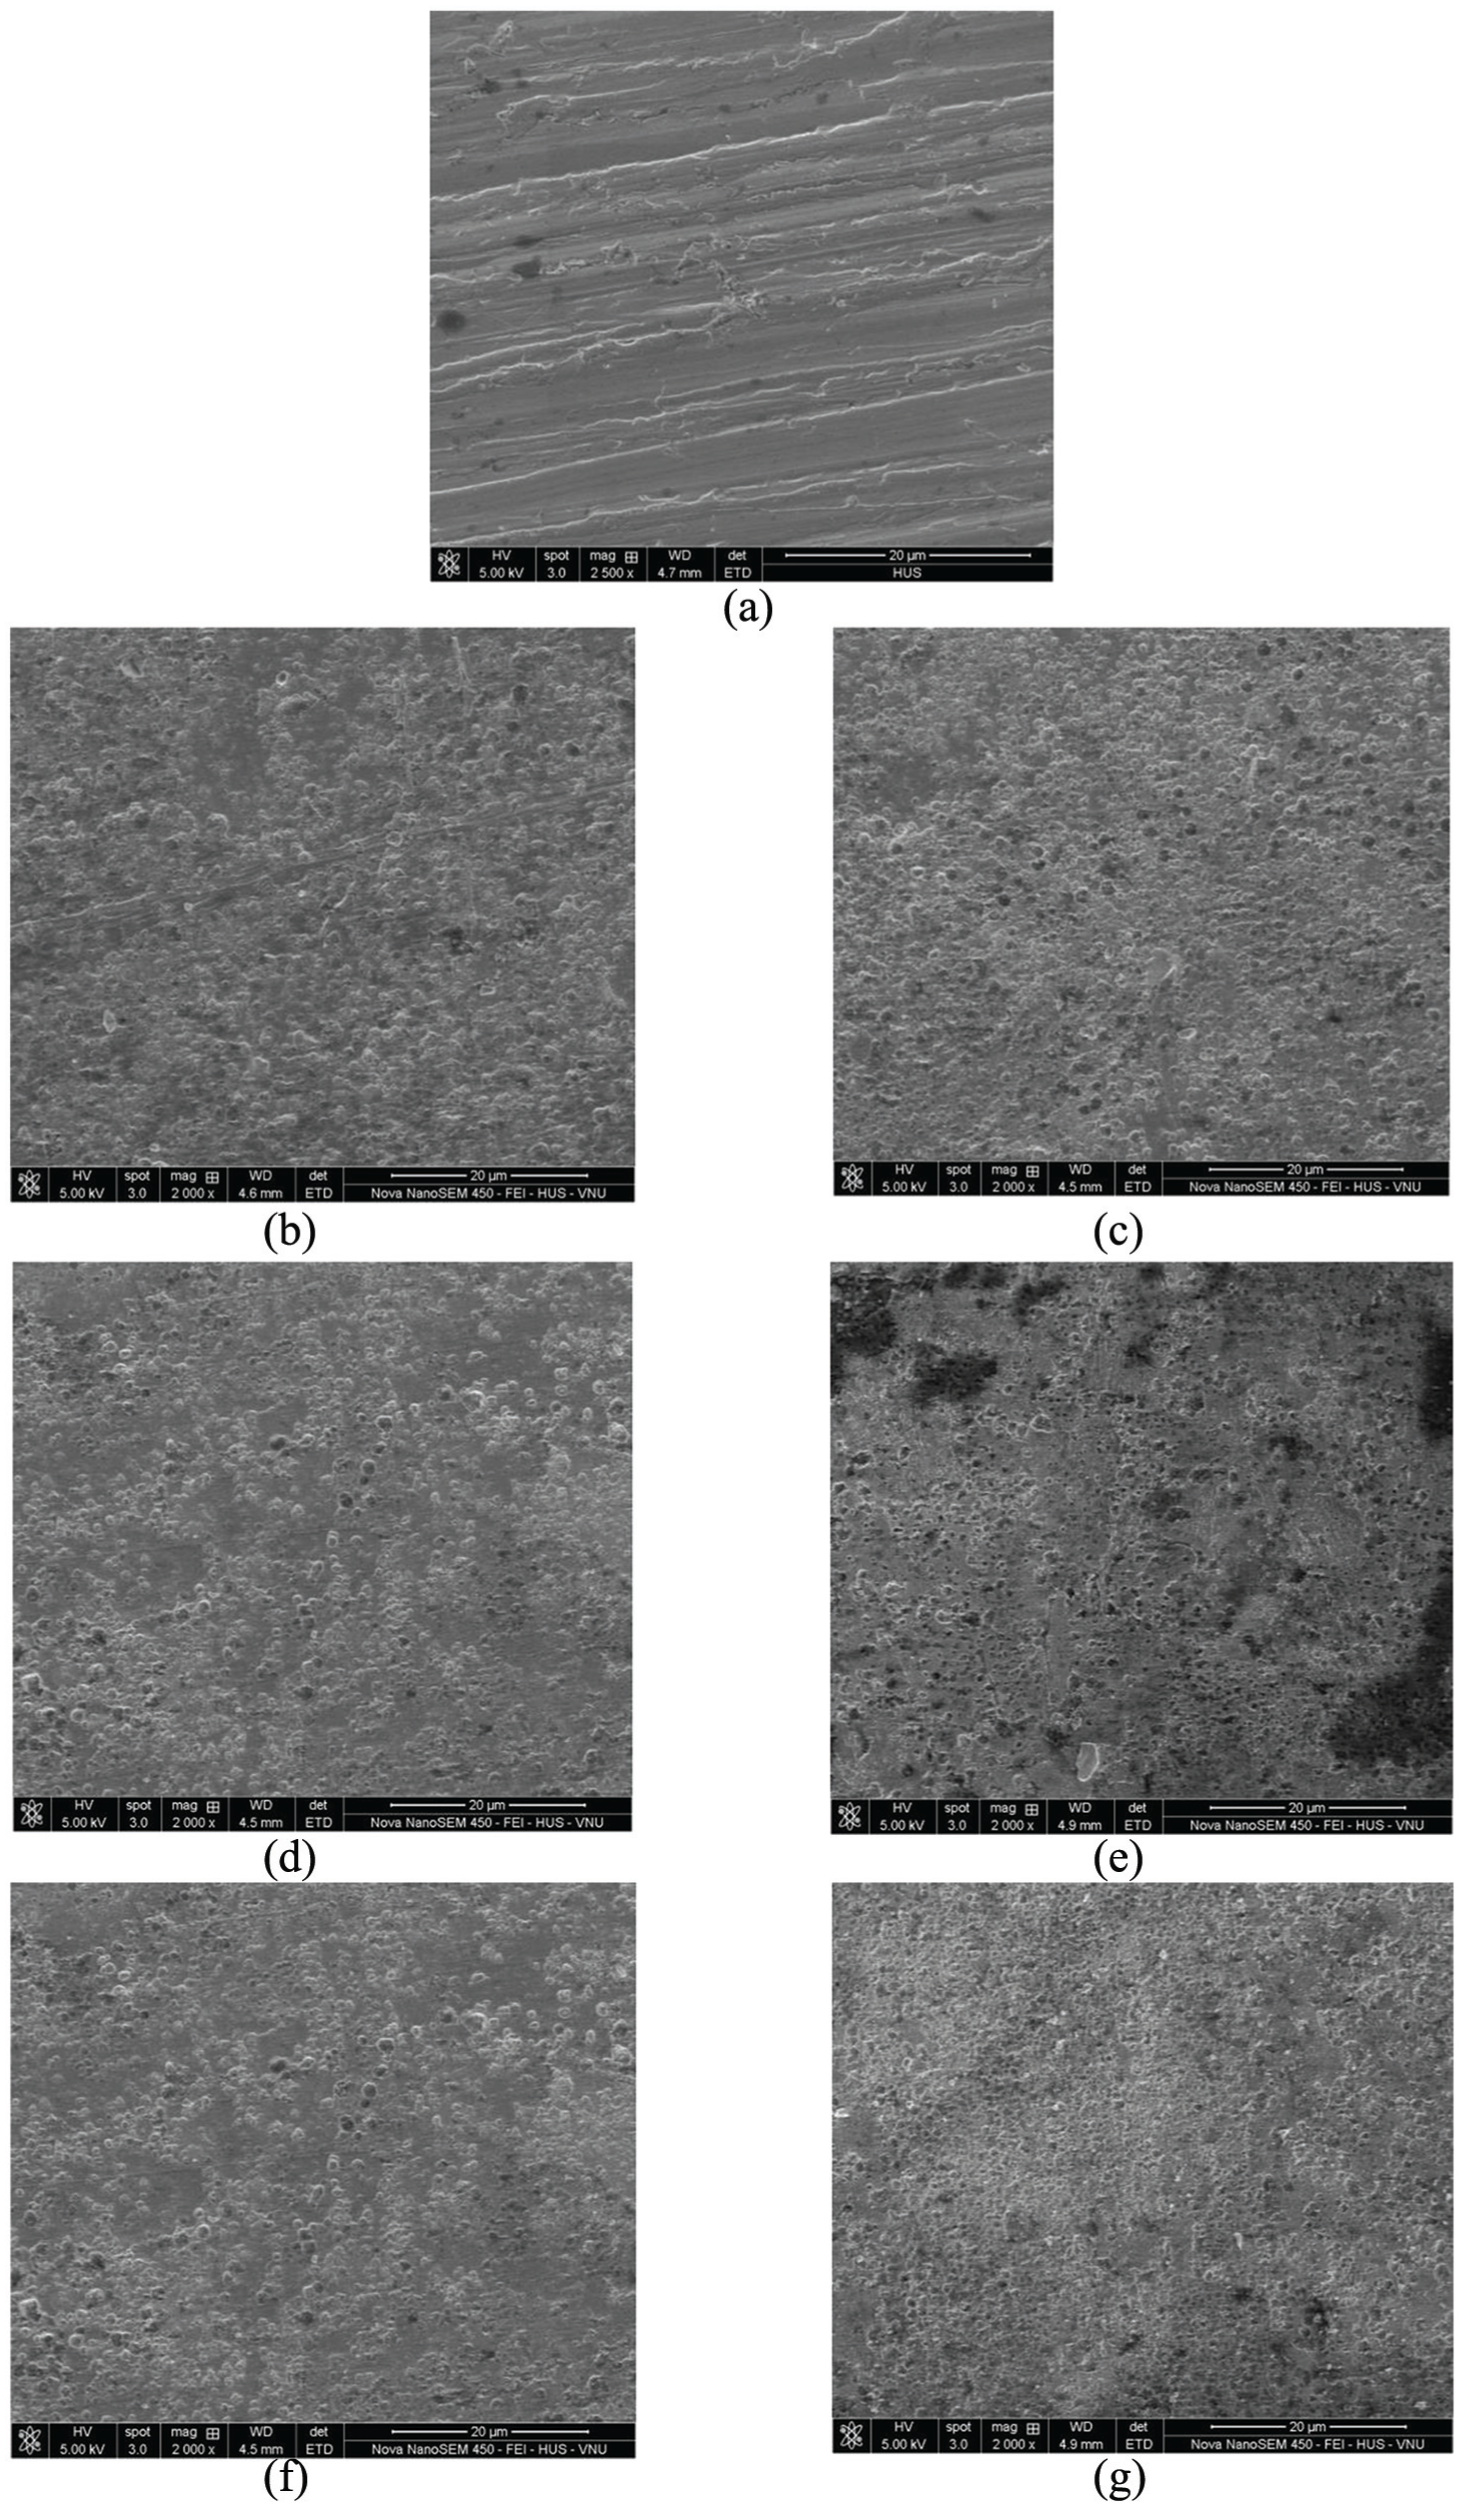
SEM images of the burnished surfaces at the different conditions: (a) turned surface, (b) burnished surface at the experimental no. 10, (c) burnished surface at the experimental no. 5, (d) burnished surface at the experimental no. 11, (e) burnished surface at the experimental no. 7, (f) burnished surface at the experimental no. 12, and (g) burnished surface at the experimental no. 9.
Figure 8(a) showed that an increase in the burnishing speed results in an increased ΔRa or a decreased average roughness, until an optimum value of around 1400 rpm. When the speed is gradually increased, the rolls had more chances to push from the peaks into valleys under the burnishing pressure, leading to a smoother surface, as shown in Figure 9(b). An enhanced temperature of the roller-workpiece interfaces will occur when V increases beyond the limit. In addition, an excessive speed leads to the occurrence of the chatter. Therefore, the decline of ΔRa or higher average roughness was observed when the speed exceeds 1400 rpm (Figure 9(c)). The similar results were also found in the previous literatures.17,28
Figure 8(b) exhibited that the ΔRa was also increased with an increased depth of penetration and then decreased by the continuous increment of a. The plastic deformation caused by the burnishing pressure will occur at a lower depth of penetration. An increase of a leads to the high burnishing pressure on the workpiece surface, resulting in fillings of more voids or valleys, as shown in Figure 9(d). However, an increased depth of penetration will lead to an increase in work-hardening of the subsurface layer. Consequently, the flaking of the metal was produced on the external surface, resulting in an increased roughness, as shown in Figure 9(e).
When the burnishing feed rate increases, the rolls have more chances to smooth out the material under a higher pressure, resulting in a smoother surface, as depicted in Figure 9(f). A further increment of the feed rate leads to an increased distance between burnishing traces. 28 Furthermore, burnishing forces and the chattering usually are induced at high feeds, leading to a higher roughness (Figure 9(g)).
Similarly, the effects of machining parameters on the ΔRy can be found in the Figure 8(c) and (d).
Figure 8(e) shows that the improvement of the surface hardness increased with the increment of the burnishing speed and depth of penetration. This behavior was due to the fact that the plastic deformation and workpiece-hardening phenomena influence on the hardness of the affected layer. However, when the speed and depth increase beyond the limit, the hardness of the subsurface layer was decreased. An excessive burnishing speed or depth of penetration leads to an increased temperature in the roller-workpiece interface, resulting in a decrement of workpiece strength and hardness.
Similarly, Figure 8(f) showed that the surface hardness was improved with a higher feed rate, until the occurrence of the optimal value of around 500 mm/min. An increment of feed rate results in the surface plastic deformation and work-hardening; hence, an improved hardness was observed. However, an excessive feed rate causes a decreased surface hardness. This behavior explains that the overlap between burnishing trenches increases at a high feed rate. The similar behaviors in burnishing processes were founded in El-Taweel and El-Axir 17 and Hassan and Sulieman. 28
The contribution of process parameters was depicted using Pareto charts, as shown in Figure 10. The blue bar indicates that the process parameters have a positive effect on the objectives, while the red bar denotes a negative influence. In Figure 10(a), it can be stated that all factors considered have the negative effect on ΔRa, in which v2 has the largest contribution with respect to quadratic terms (34.94%), followed by a2 (16.37%) and f2 (12.21%). Especially, f is the most effective parameter due to the highest contribution regarding single term (15.17%). The percentages of a and v are 13.38% and 7.93%, respectively. All interaction terms were listed as insignificant factors.
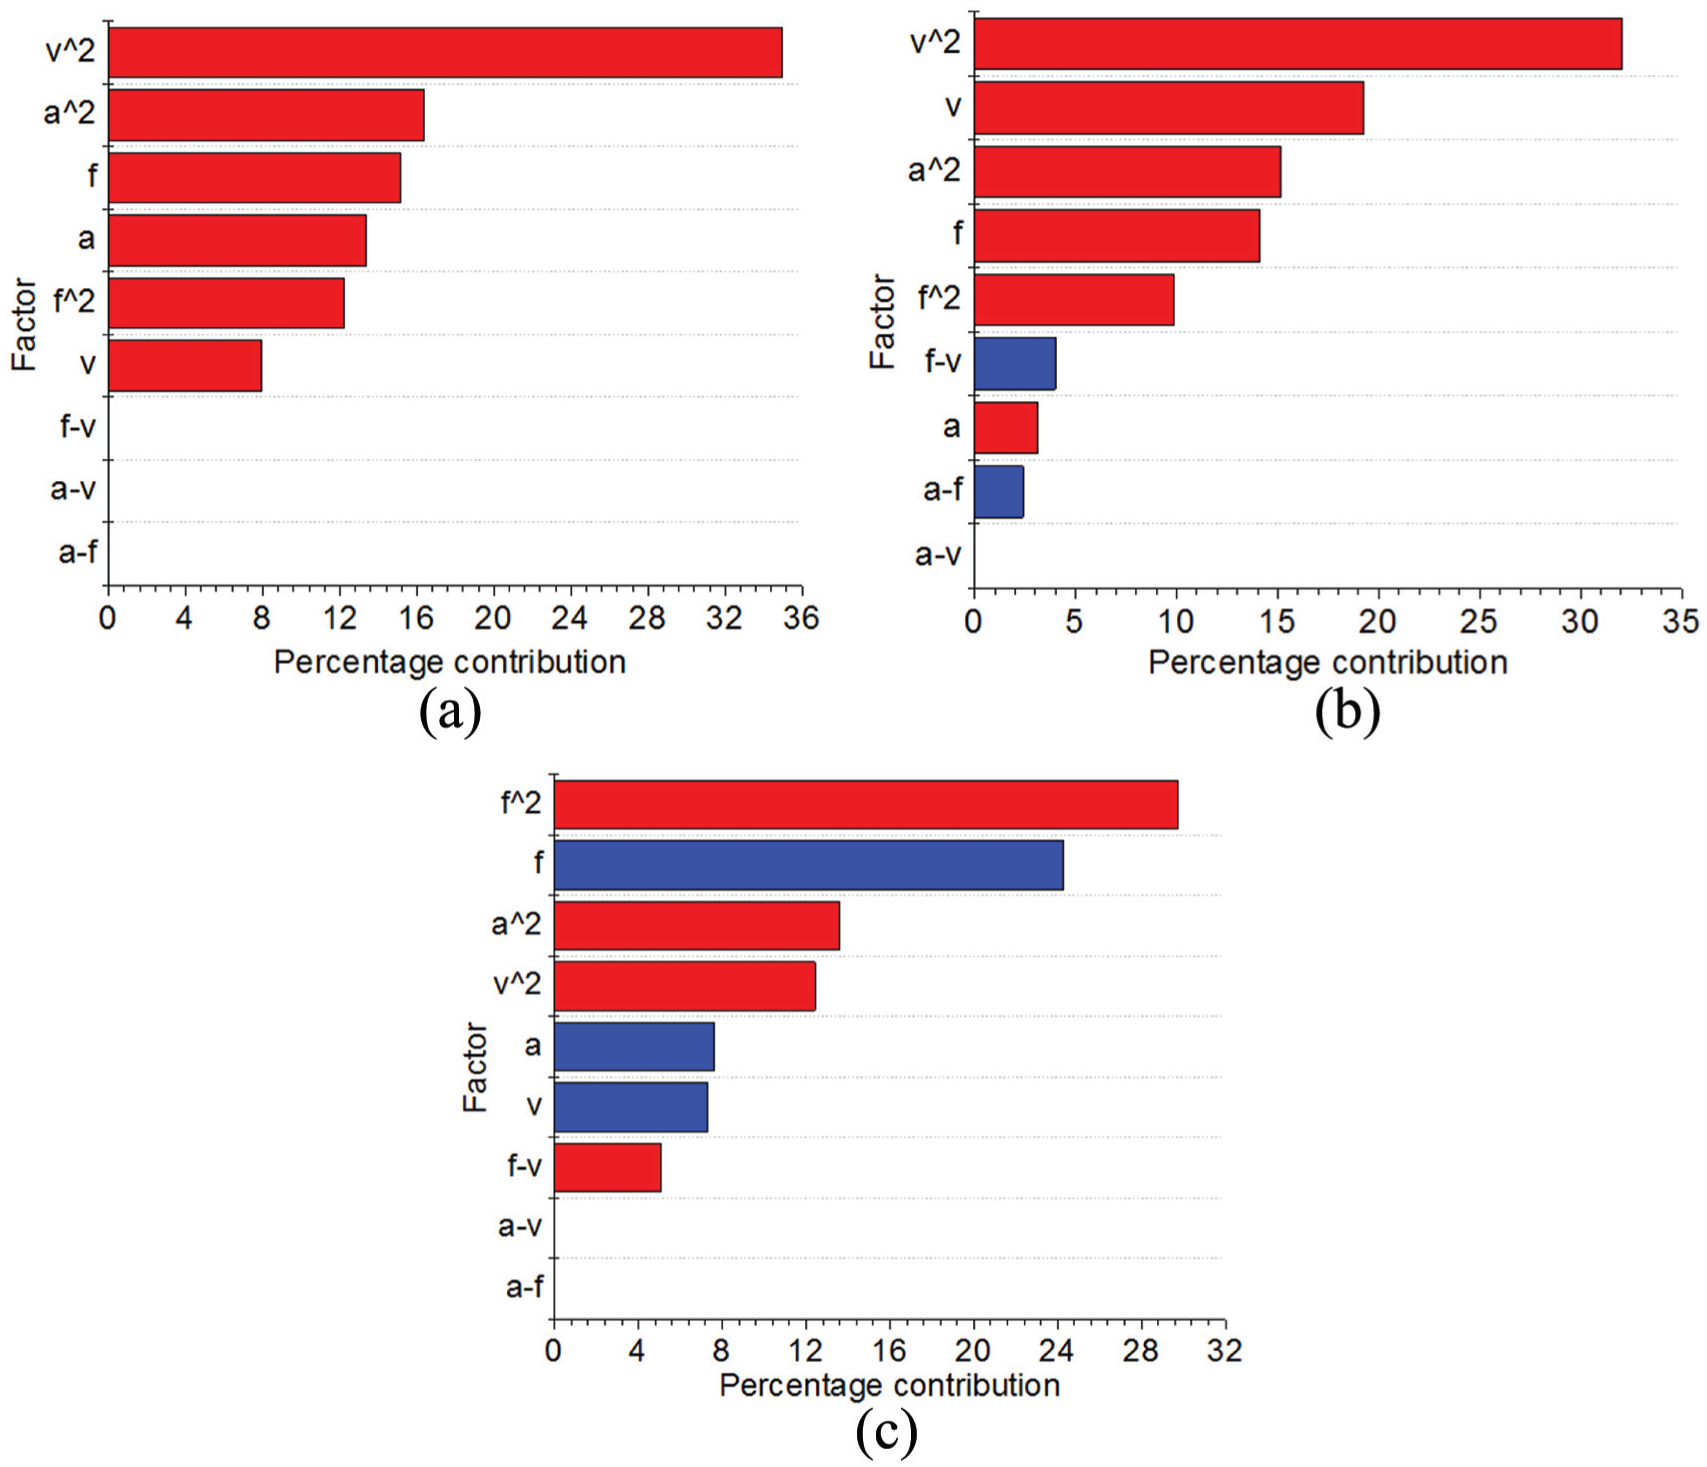
Pareto charts for the responses: (a) Pareto chart for ΔRa, (b) Pareto chart for ΔRy, and (c) Pareto chart for ΔSH
As shown in Figure 10(b), all quadratic terms and single term have the negative influence on the improved rate of maximum height roughness. As a result, v2 is the most affected factor due to the highest contribution (32.07%) with regard to the quadratic term, followed by a2 (15.17%) and f2 (9.84%). The burnishing speed has the largest negative effect on ΔRy with a percentage of 19.28%, followed by f (14.11%) and a (3.13%). The contribution of interaction terms, including fv and af, are 4.00% and 2.39%, respectively, which have the positive effects on the improved rate of maximum height roughness.
Figure 10(c) showed that all quadratic terms have the negative effect on the improved rate of surface hardness. The f2 account for the highest percentage contribution with respect to quadratic terms (29.76%); this is followed by a2 (13.57%) and v2 (12.42%). All single terms have a positive influence on the ΔSH, in which the percentages of f, a, and v are 24.28%, 7.59%, and 7.33%, respectively. The interaction term fv has a negative effect on the improved rate of surface hardness with a percentage of 5.05%.
Investigation of residual stress
In this work, the residual stresses in the burnished specimens were estimated using the sin ψ2 method from XRD. The value of the compressive stress was calculated based on the measured strain and the elasticity theory. The strain was observed from the variation in lattice spacing according to Bragg law in order to depict the change in the diffraction peak position.
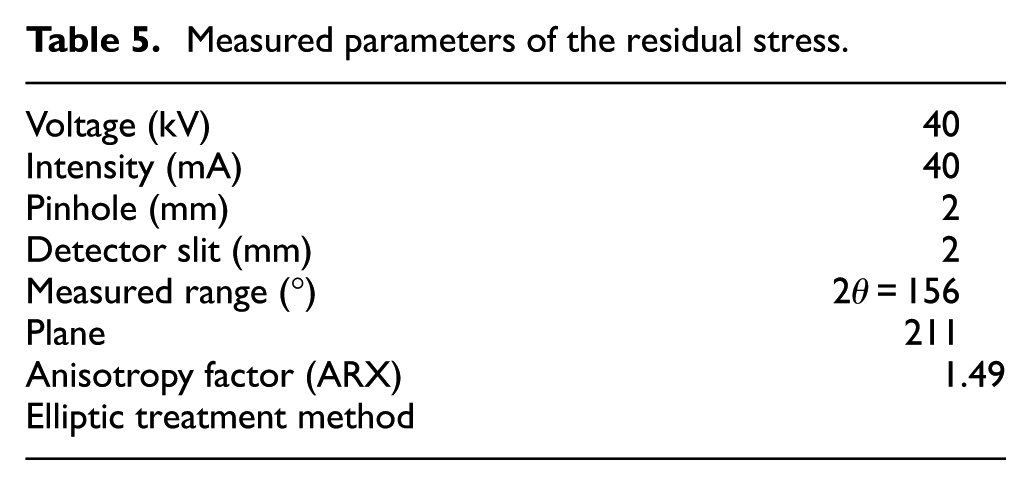
An X-ray diffractometer titled Bruker D8 Advance was used in conjunction with Cr radiation and parallel beam to measure the residual stress. The schematic measurement of the compressive stress was shown in Figure 11. The step of 1 and time per step of 3 s were used to improve the measuring accuracy. The parameters of residual stresses by XRD were shown in Table 5. A sliding gravity method was adopted to estimate the position of the peaks measured at 11 different ψ angles. Absorption, background, and Lorentz-polarization corrections were applied before obtaining peak positions. The measurements were taken in both axial and tangential directions. The values of the residual stress were shown in Table 6. The diagrams of the compressive stresses at the various experiments were shown in Figure 12.
Measured parameters of the residual stress.
The values of the residual stresses.
Schematic measurement of the compressive stress.
The compressive stresses at the various experiments: (a) axial stress and tangential stress at experimental no. 1, (b) axial stress and tangential stress at experimental no. 2, (c) axial stress and tangential stress at experimental no. 3, (d) axial stress and tangential stress at experimental no. 4, (e) axial stress and tangential stress at experimental no. 5, (f) axial stress and tangential stress at experimental no. 6, (g) axial stress and tangential stress at experimental no. 7, (h) axial stress and tangential stress at experimental no. 8, (i) axial stress and tangential stress at experimental no. 9, (j) axial stress and tangential stress at experimental no. 10, (k) axial stress and tangential stress at experimental no. 11, (l) axial stress and tangential stress at experimental no. 12, and (m) axial stress and tangential stress at experimental no. 13.
The effects of burnishing parameters on the compressive stresses were depicted in Figure 13. As a result, an increase in burnishing feed results in a decreased magnitude of the residual stresses in both axial and tangential directions (Figure 13(a)). This behavior was due to the fact that a small feed leads to a short distance between roller traces. The workpiece surface was highly compressed and a greater amount of plastic deformation was observed. Figure 13(b) showed the effects of burnishing depth on the residual stress. It is observed that an increase in the depth of penetration leads to an increase in the amount of plastic deformation, leading to an increase in the compressive stresses of the burnished surface. The effects of the burnishing speed on the compressive stresses were similarly found, as shown in Figure 13(c). The similar effects in the burnishing processes were founded in literature.29–31
The residual stresses versus machining parameters: (a) the effects of the feed rate on the compressive stresses, (b) the effects of the depth of penetration on the compressive stresses, and (c) the effects of burnishing speed on the compressive stresses.
Optimization results
The developed mathematical models for the ΔRa, ΔRy, and ΔSH are optimized using NSGA-II, which is able to determine the feasible solution for a multi objective problem. It is a tough work to determine the optimal process parameters for simultaneously improving three burnishing responses. Moreover, machining parameters, such as burnishing speed, feed rate, and burnishing depth, have complex effects on the evaluation criteria. The optimizing issue can be described as follows:
Find X = [V, f, a]
Maximize ΔRa, ΔRy, and ΔSH.
Constraints:
1000 ≤ V ≤ 1800 (rpm), 200 ≤ f ≤ 600 (mm/min), 0.02 ≤ a ≤ 0.10 (mm).
The operating values of NSGA-II parameters, including the population size, number of generations, crossover probability, crossover distribution index, and mutation distribution index, are 20, 40, 0.9, 10, and 20, respectively. The Pareto front generated by the NSGA-II algorithm was exhibited in Figure 14, in which the blue points are feasible solutions.
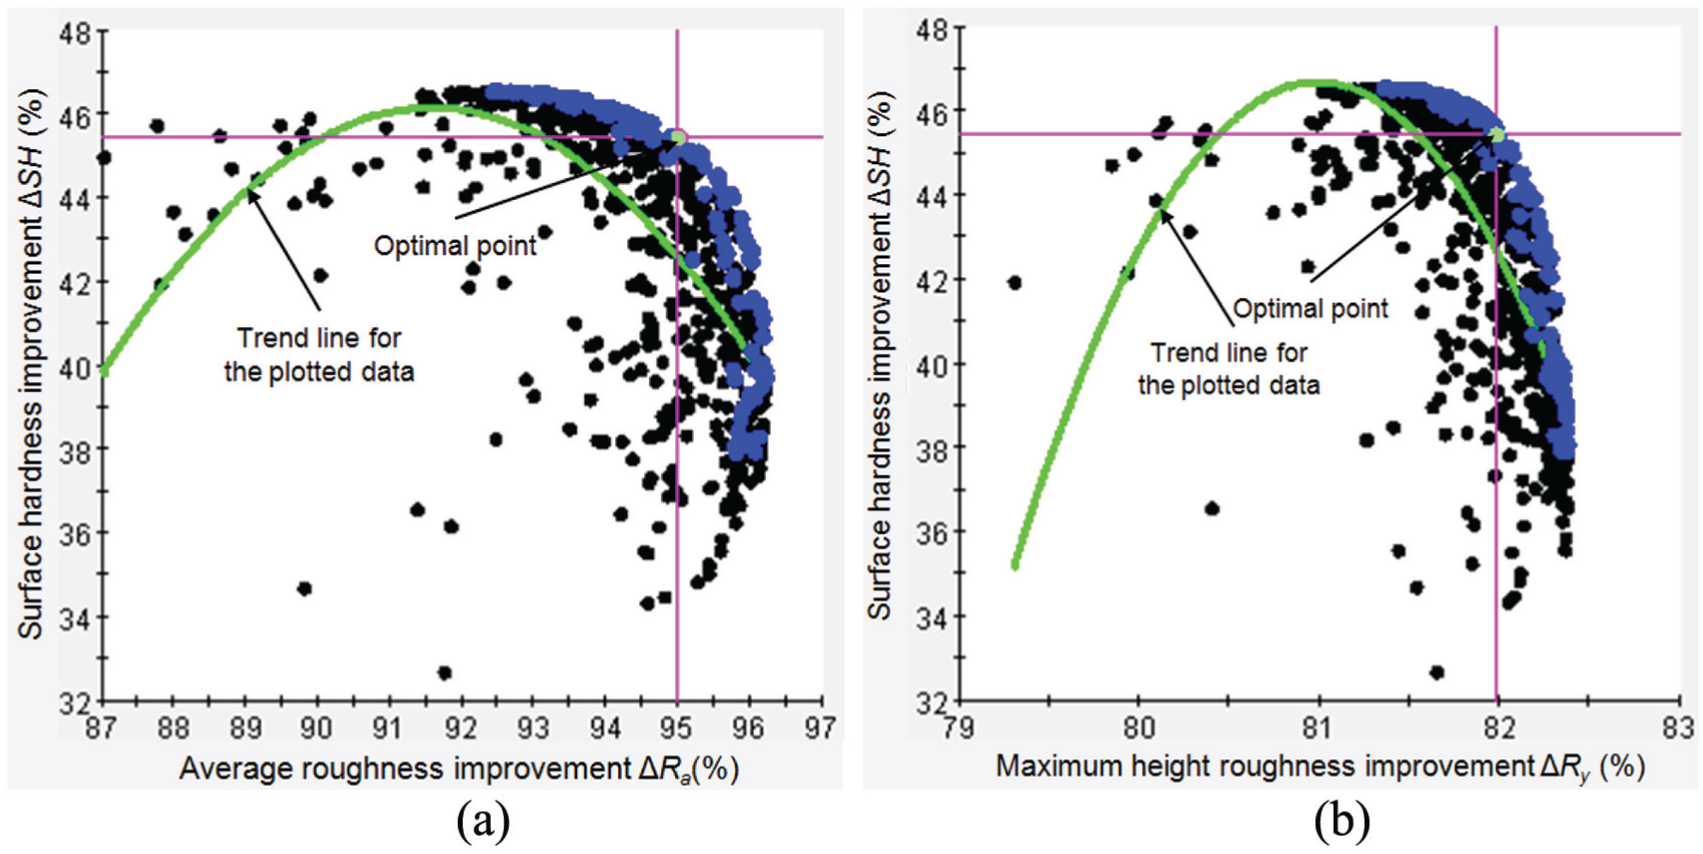
Pareto fronts: (a) ΔRa and ΔSH and (b) ΔRy and ΔSH
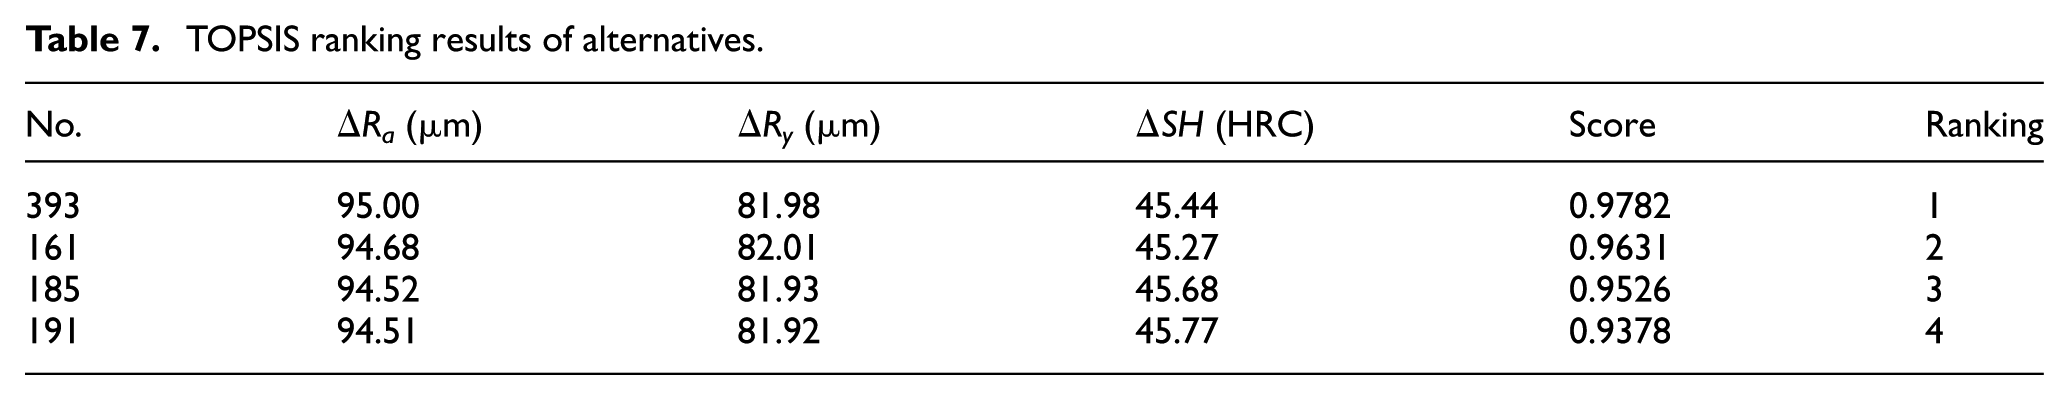
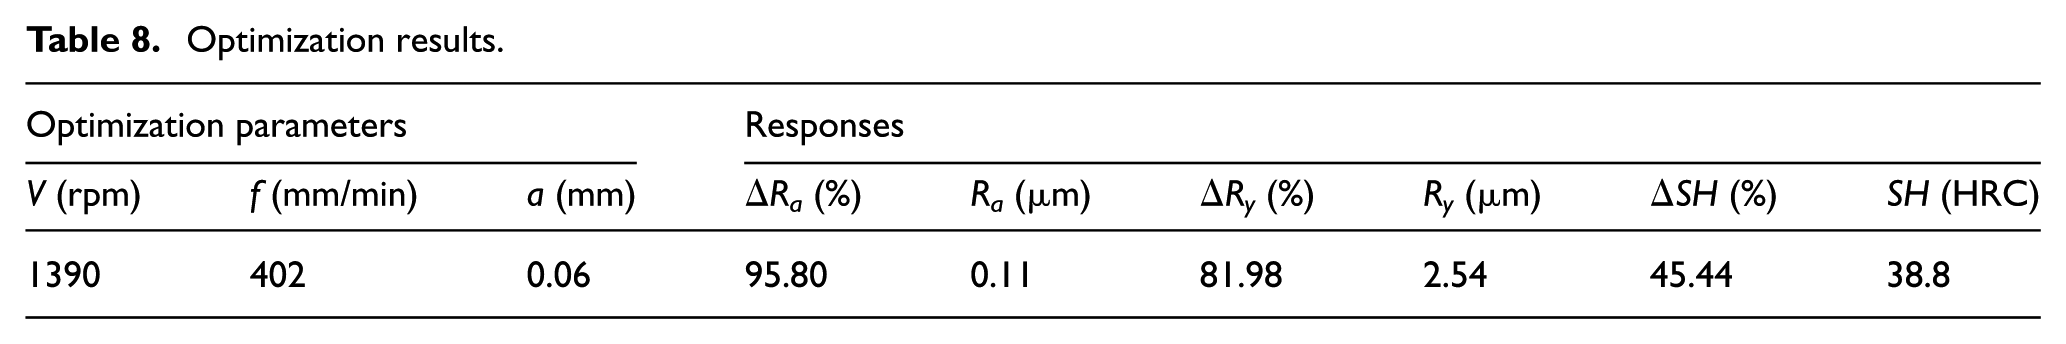
Weight factors calculated for the ΔRa, ΔRy, and ΔSH using the entropy method were 0.34, 0.38, and 0.28, respectively. The first four solutions were observed using TOPSIS with scores, solution numbers, and rankings (Table 7). As a result, solution no. 393 was determined as the best solution, which is shown as a blue point in Figure 14. The optimal values of process parameters ΔRa, ΔRy, ΔSH, Ra, Ry, and SH are presented in Table 8.
TOPSIS ranking results of alternatives.
Optimization results.
Conclusion
This article presented a multi-objective optimization of the internal roller burnishing process in order to improve the surface properties using parameter optimization. The machining responses, including the improved rate of arithmetic average roughness, the improved rate of maximum height roughness, and the improved rate of surface hardness, were developed using Kriging models in terms of processing factors, such as the burnishing speed, feed rate, and depth of penetration. An integrative approach combining NSGA-II and TOPSIS was used to determine surface integrity enhancements. The main conclusions from the research results of this work can be drawn as follows within parameter ranges:
The analysis of variance (ANOVA) revealed that the burnishing feed has a greater influence on the improved rate surface hardness, the improved rate arithmetic average roughness, and the improved rate maximum height roughness with a contribution of 24.28%, 15.17%, and 14.11%, respectively.
Kriging-based models for the improved rate of arithmetic average roughness, the improved rate of maximum height roughness, and the improved rate of surface hardness, having R2 of 0.9927, 0.9925, and 0.9912, respectively, present good correlation with the experimental data. These developed models have an industrial application because they can be used for the prediction of the technological parameters of the internal roller burnishing process.
The optimal setting of burnishing parameters is found to be a burnishing speed of 1390 rpm, feed rate of 402 mm/min, and depth of penetration of 0.06 mm. After optimizing process, the average roughness and the maximum height roughness were reduced around 95.80% and 81.98%, respectively, while the surface hardness was increased approximately 45.44%, compared to the pre-treatment levels.
The surface roughness improvement, including ΔRa and ΔRy, increases with increased process parameters (burnishing speed, feed rate, and/or burnishing depth) until it reaches the optimal value, and then with further factors, the roughness improvement decreases. The surface hardness improvement increases with increased parameters until it reaches the optimal points. Excessive factors lead to a decreased surface hardness.
Higher values of the burnishing speed and depth of penetration increase the plastic deformation around the burnishing roller, leading to the increased residual stresses at the external surface. In contrast, low values of the feed rate result in more regular material flow, and higher values of the residual stress are produced.
Solving multi-objective optimization problem considering the arithmetic average roughness, maximum height roughness, and surface hardness is more practical and realistic in the interior roller burnishing processes, compared to optimizing single or two responses.
Footnotes
Appendix 1
Declaration of conflicting interests
The author(s) declared no potential conflicts of interest with respect to the research, authorship, and/or publication of this article.
Funding
The author(s) disclosed receipt of the following financial support for the research, authorship, and/or publication of this article: This research is funded by Vietnam National Foundation for Science and Technology Development (NAFOSTED) under Grant Number 107.04-2017.06.