
Abstract
Microstructure alteration of machined surface induced by the coupled thermal and mechanical loads in the hard milling process has great influence on surface integrity. Hence, it affects the performances of the workpiece. The hard milling experiments of AISI H13 steel with different cutting speeds and feed rates were carried out and the microstructure evolution of machined surface was investigated by means of some advanced characterization methods. The experimental result indicates that plastically deformed layer was evident with three distinguishable zones, that is, unaffected zone, plastic deformation zone, and white layer zone. X-ray diffraction analysis revealed that no retained austenite is detected in the white layer. Numerous nano-sized equiaxed grains were induced by dynamic recrystallization (DRX), as a result of severe shear plastic deformation on the machined surface. As the cutting speed increases, the grain refinement becomes more obvious. However, the original cementite was greatly refined and well distributed compared with bulk material. A significant improvement in nano-hardness was witnessed in both for machined surface and subsurface. The grain refinement as well as well-dispersed cementite played a vital role in the improvement of nano-hardness. The varied depth of plastic deformation was observed with respect to change of cutting forces. It is the main source of mechanical load inducing plastic deformation with the assistance of material thermal softening. The present work can provide more visibility on the surface integrity along with the quality control of the workpiece.
Keywords
Introduction
AISI H13 hardened steel exhibits marvelous thermo-mechanical properties including high hardness, high temperature strength, good toughness, high resistance to thermal shock, and thermal cracking, which yield it the extensive use of dies and molds manufacturing . 1 On the other hand, H13 hardened steel is also recognized as the hard-to-machine materials due to its unique mechanical properties. 2 As a result of recent progresses in cutting tools and high performance machine tools, hard milling has been acknowledged as a promising manufacturing technology with high throughout, low energy consumption, more flexibility, and eco-friendly. Although the hard milling process has been exhibited many shining points, the machined surface encountered with high intensity of localized thermo-mechanical loads. It further leads to severe plastic deformation on the machined surface and subsurface which altered some aspects of the surface integrities like hardness, microstructure, and grain size as well as phase compositions. The impact deteriorates the mechanical properties of the end product and affects its fatigue life. The formation of white layer in hard tuning on the topmost machined surface was observed, which is a thin, brittle, and featureless layer.3,4 In addition, the microstructure evolution in cutting process has a significant influence on cutting mechanics. 5 In previous research, it has been experimentally confirmed that the initiation of the fatigue cracks is located on the machined surface and then propagates into depth of the manufactured components.6,7 However, the fatigue life of the machined parts is highly dependent on machined surface integrity. Hence, white layer, as a surface microstructure defect induced by hard machining, should be avoided.
The ultrafine-grained or nanocrystalline materials demonstrate excellent mechanical properties such as high resistance to corrosion, high strength and superplasticity, and improved fatigue life. Until now, the formation of ultrafine or nanocrystalline grains within the surface layer or subsurface in plastic deformation processes, including equal channel angular pressing, 8 laser shock processing, 9 high pressure torsion, 10 rolling, 11 surface mechanical attrition treatment, 12 and machining, has attracted much attention from scientific and engineering standpoints. Milling operations are acknowledged as one of the most widely used machining approaches to produce the vast majority of components from originally forged, plate, or cast condition. Specifically, hard milling provides us a unique opportunity to explore the grain refinement mechanism under high strain rate and at elevated temperatures.
Although many researchers have launched various studies to investigate microstructure evolution in hard machining, only a handful of studies have attempted to explicitly explain the microstructure evolution mechanism and its correlation with a variation of mechanical properties in hard milling of steels. As experimentally discussed by Hosseini et al., 13 the mechanically or thermally induced white layer exhibited different characteristics. It was found that dynamic recovery and combined dynamic recovery and dynamic recrystallization are, respectively, responsible for the observed submicron-sized microstructure and equiaxed grains in white layers. Velásquez et al. 14 specified that the affected zone below machined surface of Ti-6Al-4V can be divided into three different zones, and the crystallographic texture and residual stress encountered with significant variation. Swaminathan et al. 15 stated that from elongated subgrain microstructure to an equiaxed nanocrystalline microstructure can be acquired by varying cutting parameters. Wang and Liu 16 proposed a rotation-shear-recombination model to reveal the formation mechanism of plastic deformation induced nano-scale twinning during high speed machining of Ti-6Al-4V. Chen et al. 17 investigated the gradient nanostructures distribution in the milled surface deformation layer of 7055 aluminum and demonstrated that the gradient nanostructure was composed of equiaxed and lamellar nanograins, and ultrafine grains. Many investigations were focused on the effect of cutting parameters on machined surface residual stress, hardness, and microstructure.18–21 In conclusion, an enormous amount of work has been reported with respect to titanium alloy as well as aluminum alloy; the relevant researches regarding steels are scant. Although part of the knowledge in terms of microstructure evolution induced by hard machining has been presented, industrial application of hard milling is still hindered by the lack of experience. Also the mechanism of microstructure alteration and its effect on mechanical property as well as the correlation between plastic deformation and thermo-mechanical loads in the hard milling process still need further investigations.
In this work, hard milling experiments on AISI H13 steel under various cutting conditions (cutting speed and feed rate) were carried out. The microstructural features of the machined surface layer were analyzed using scanning electron microscope (SEM). X-ray diffraction (XRD) was employed to determine the phase composition and verify the phase transformation. The transmission electron microscope (TEM) was utilized to unravel the crystallographic characteristics of the machined surface layers and its evolution mechanism. In addition, the nano-indentation technique was used to measure the nano-hardness in the workpiece from the topmost machined surface to subsurface. The correlation of cutting force, cutting temperature, and depth of plastic deformation was investigated and recorded.
Materials and methods
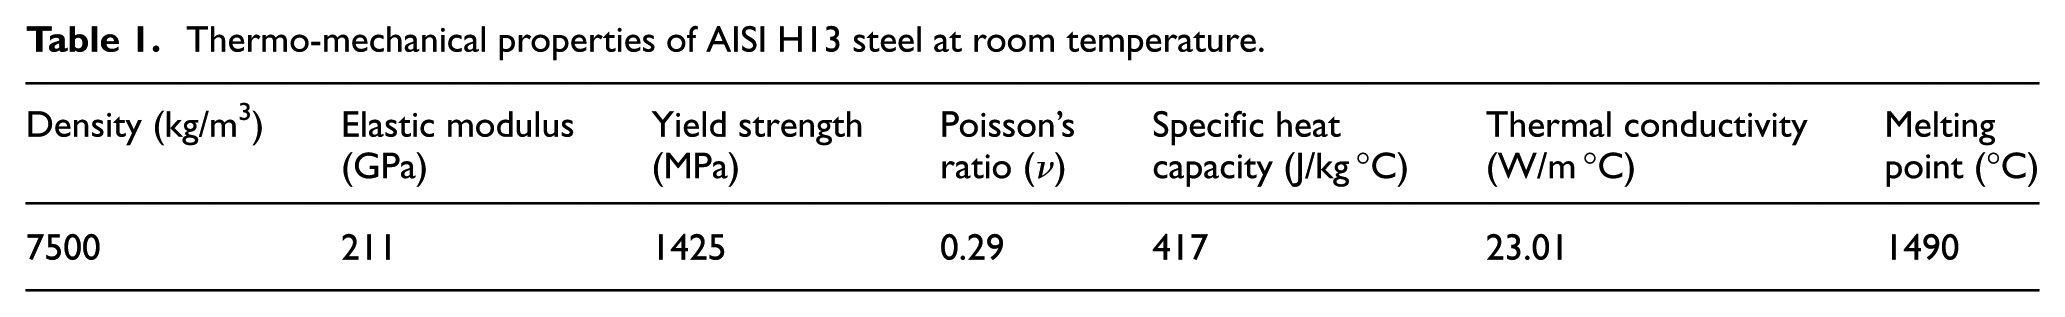
Hardened AISI H13 steel (50 ± 1 HRC) of 100 mm × 100 mm × 25 mm was used in the hard milling experiments. The nominal chemical composition of AISI H13 steel is as follows (wt%): 0.80%–1.25% C, 0.20%–0.60% Si, 4.75%–5.55% Mn, 1.10%–1.75% Cr, 0.80%–1.20% V, 0.30% max Ni, and balance Fe. The primary thermo-mechanical properties of the material at room temperature are listed in Table 1.
Thermo-mechanical properties of AISI H13 steel at room temperature.
The hard milling experiments were carried out on a vertical Computerized Numerical Control (CNC) machine (ACE-500, DAEWOO, Korea) using cemented carbide indexable milling inserts (XOM X090308TR-M08 MP1500, Seco Tools Company, Sweden) with coatings (Ti(N,C)-Al2O3), which was mechanically clamped on a milling cutter (R217.69-2020.0-09-3AN, Seco Tools Company, Sweden) as shown in Figure 1. The rake and clearance angles of the milling insert were maintained at 10° and 15°, respectively. The specific cutting parameters are listed in Table 2. All sets of cutting experiments were conducted in dry conditions without using any cutting fluids. To eliminate the effect of tool wear on plastic deformation and grain refinement, a new milling insert was reinstalled after completing each cutting test. For each cutting condition, at least six times were repeated.
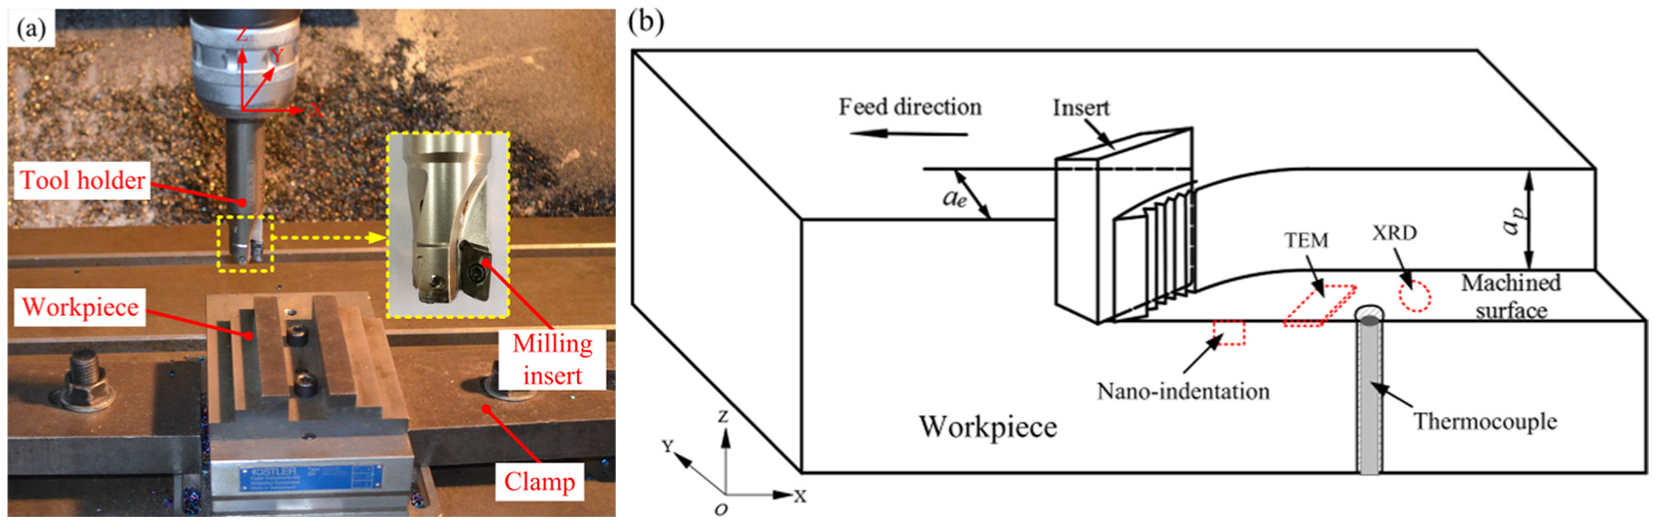
Experimental procedures: (a) machining setup and (b) test areas.
Cutting condition for hard milling process.
After the hard milling, the workpiece sample was mounted with Bakelite, polished, and then etched with 5 mL HNO3 and 95 mL ethanol solution to reveal the microstructure. Optical microscope, SEM, and XRD were used to analyze the microstructure evolution as well as phase compositions of the machined surface. For further understanding of microstructure alteration, TEM (JEM-2100) analysis was used. Hardness measurement was performed on a nano-hardness tester (NanoTest Vantage, MML Company, Britain). The indenter penetration depth was set at 500 nm with a load of 50 mN. Five indentations starting from the machined surface to the bulk material with spacing of 3 µm labeled as “1” to “5” were indexed to estimate the variation of hardness.
Results and discussion
As-received material
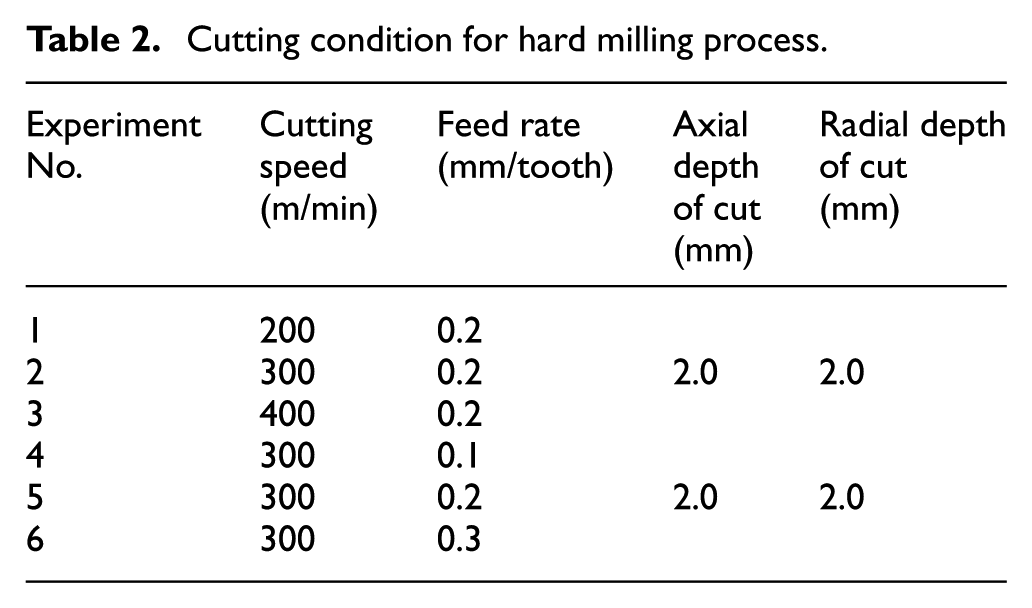
The microstructure of base material AISI H13 steel, as-received, is shown in Figure 2(a). The metallographic image was dealt with Image-Pro-Plus (IPP) software to acquire grain diameter, which is shown in Figure 2(b). The average grain size and corresponding grain quantity were depicted in Figure 2(c); it is evident that the mean diameter of the statistical grains is approximately 23 µm. Figure 2(d) shows that only tempered martensite phase was detected in initial specimen according to XRD pattern.
Analysis of initial microstructure: (a) metallographic image, (b) image processing for grains, (c) histogram of grain size diameter, and (d) initial XRD pattern.
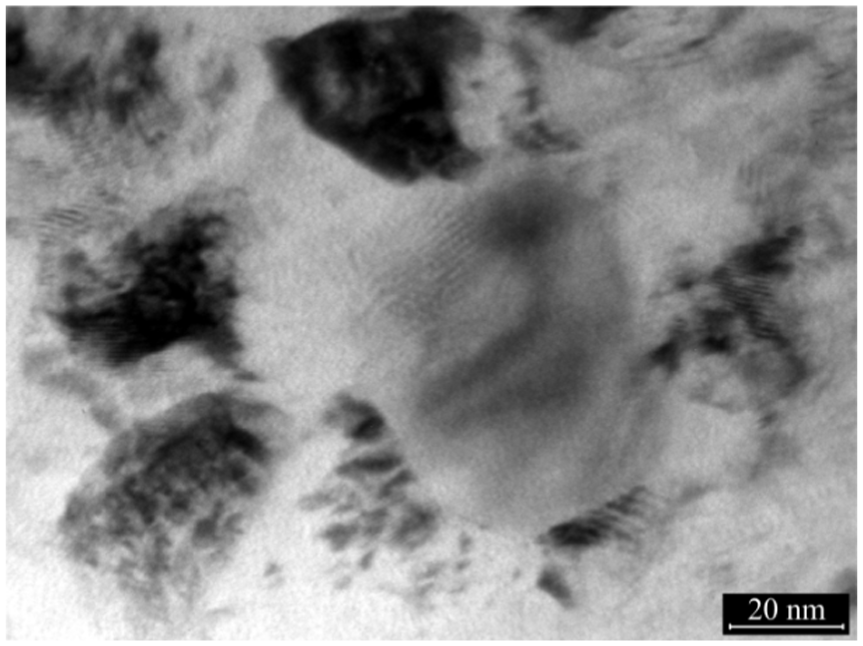
Bright-field TEM micrograph and the selected area electron diffraction (SAED) patterns of the corresponding area of the tempered martensite are demonstrated in Figure 3. The initial microstructure is characterized by the coexistence of lath martensite and coarse cementite. As illustrated in Figure 3(b), the diffraction pattern shows macroscopically as ring as well which is composed of discrete spots, indicating the coarse grains of the initial microstructure.
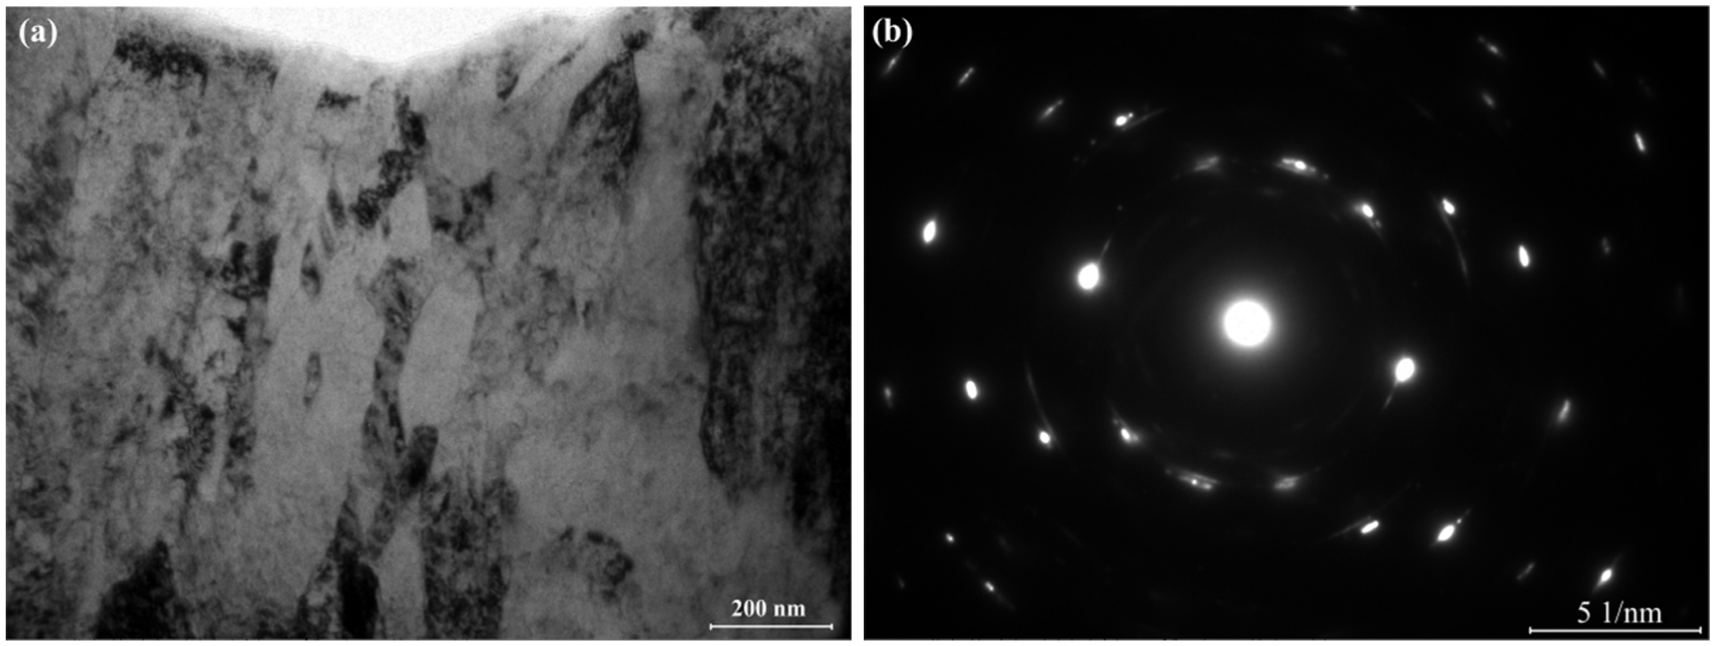
TEM micrographs of initial microstructure: (a) bright-field micrograph of martensite and (b) SAED pattern.
Plastic deformation of machined surface
Figure 4 illustrates SEM images at different cutting speeds. By carefully examining the micro-feature of the microstructure which starts from the topmost machined surface deep into the workpiece, the material was divided into three areas and labeled as A1, A2, and A3. The A1 area corresponds to the matrix material, where the initial microstructure visually keeps unaffected during the hard milling process. As in the A2 area, the microstructure is apparently affected and evolved during hard milling with recognizable deformed grain boundaries. Furthermore, along the cutting direction, the grains rotate to a certain degree as a result of high intensity of shear plastic deformation, which led to distortion and elongation of the grains. In addition, some asymptotes delineated in yellow color are used to describe the degree of plastic deformation. The A3 area is just below the topmost machined surface with the depth varying in the range of 500 to 700 nm depending on cutting speeds. Quite different from A1 and A2 areas, the micro-feature in this area is visually characterized by amorphous microstructure with no obvious shape and boundary. Compared with the white layer, which is frequently observed on the machined surface in hard machining of difficult-to-machine materials,22–25 the characteristics presented by A1 area are obviously consistent with the features of the white layer.
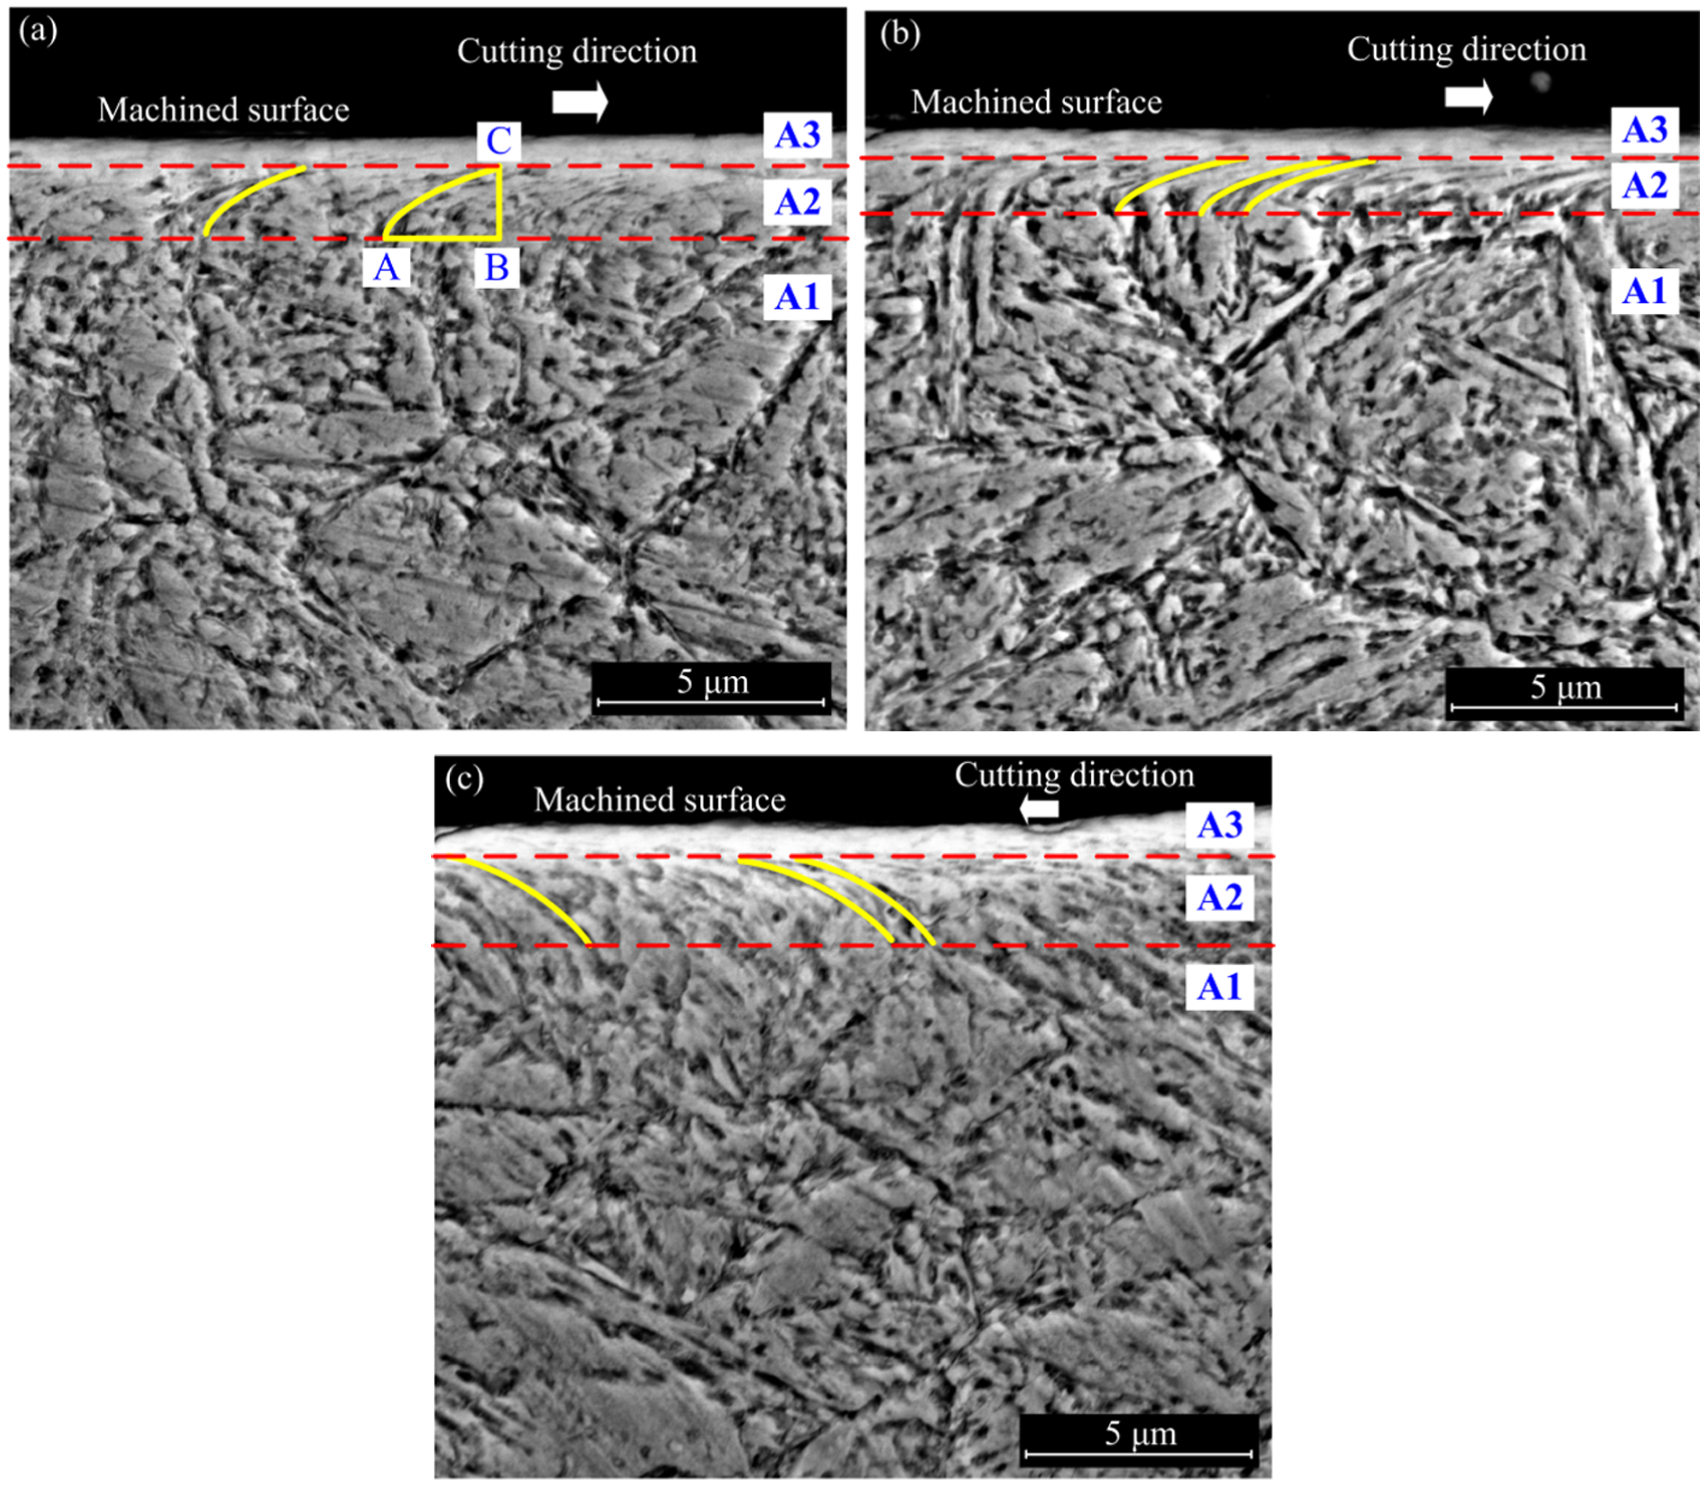
Microstructure of machined surface layer: (a) 200 m/min, (b) 300 m/min, and (c) 400 m/min (feed rate: 0.2 mm/tooth).
Similar to the images shown in Figure 4, the obtained results by varying feed rates are presented in Figure 5. When the feed rates are, respectively, 0.2 and 0.3 mm/tooth, the materials dissociated into three regions (Figure 5(b) and (c)) with the formation of white layers on the machined surface. However, only two areas A1 and A2 were emerged with feed rate of 0.1 mm/tooth (Figure 5(a)) based on the morphology of the microstructure. In addition, both the depth and the degree of plastic deformation are relatively lower and insignificant, respectively. The results indicate that the plastic deformation induced by hard milling is difficult to capture with small feed rate.
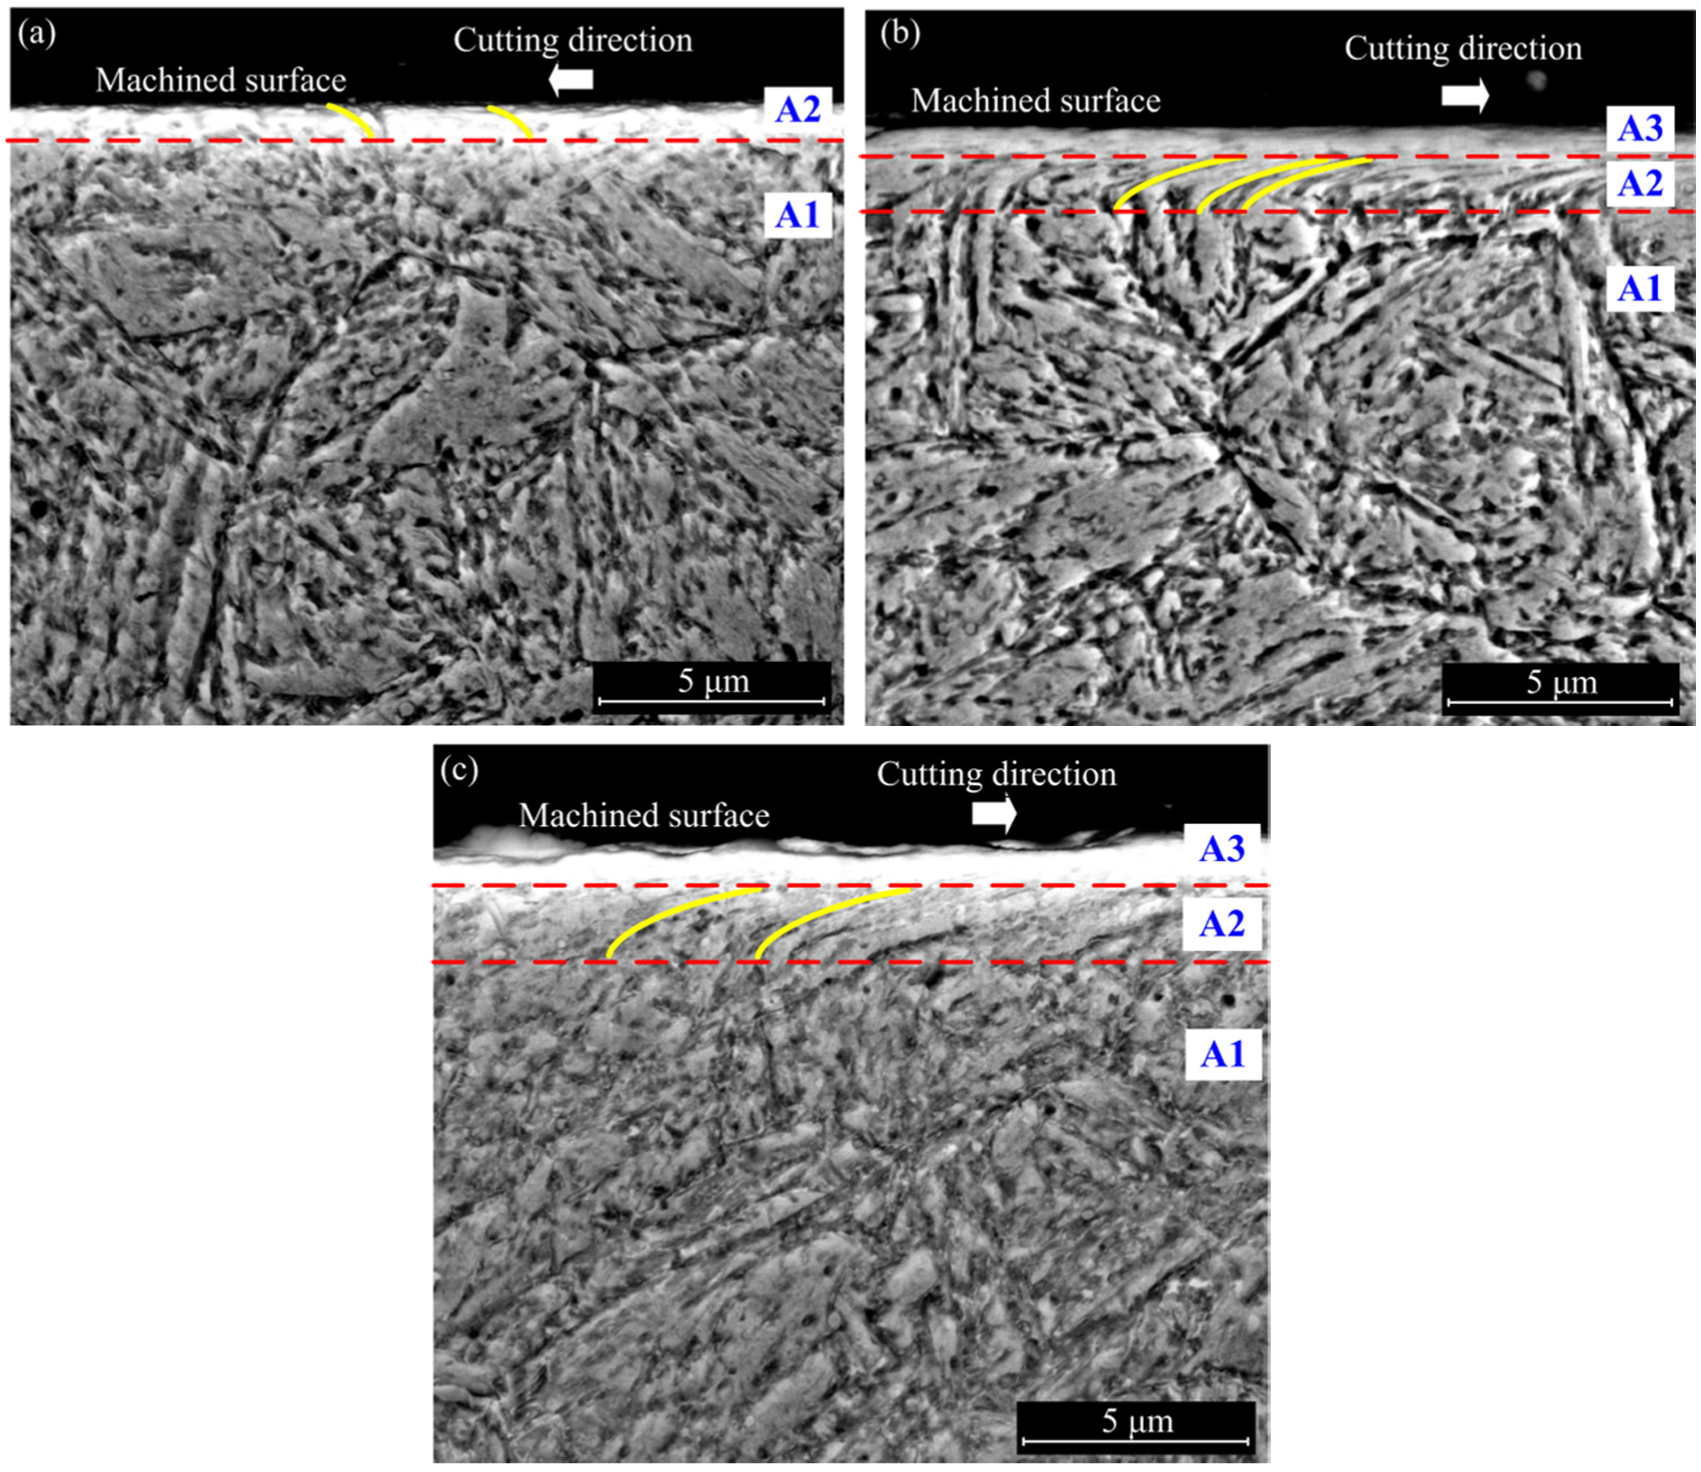
Microstructure of machined surface layer: (a) 0.1 mm/tooth, (b) 0.2 mm/tooth, and (c) 0.3 mm/tooth (cutting speed: 300 m/min).
As demonstrated in Figure 6(a), when the cutting speed increases from 200 to 400 m/min, the depth of plastic deformation (A1 + A2) reduces first and subsequently increases as well. The measured lowest depth of plastic deformation was corresponding to the cutting speed of 300 m/min. Based on the previous researches, 26 cutting temperature increases with the cutting speed while the depth of heat-affected zone decreases. As the cutting speed increased from 200 to 300 m/min, elevated cutting temperature in tertiary deformation zone and reduced contact time at tool-machined surface contributed to the comparatively shallow plastic deformation. However, the opposite of increasing cutting speed to a higher level deteriorates the friction between tool flank and machined surface, which facilitates the depth of plastic deformation in machined surface layer. 27 The depth of plastic deformation was significantly influenced by feed rate, as the deformation continues to rise with increase in feed rate. It should be highlighted that higher feed rate requires more mechanical work during cutting process and hence generates comparatively higher cutting temperature on machined surface as a result of shear plastic deformation. 28 Thus, the depth of heat-affected zone increases as well due to heat conduction.
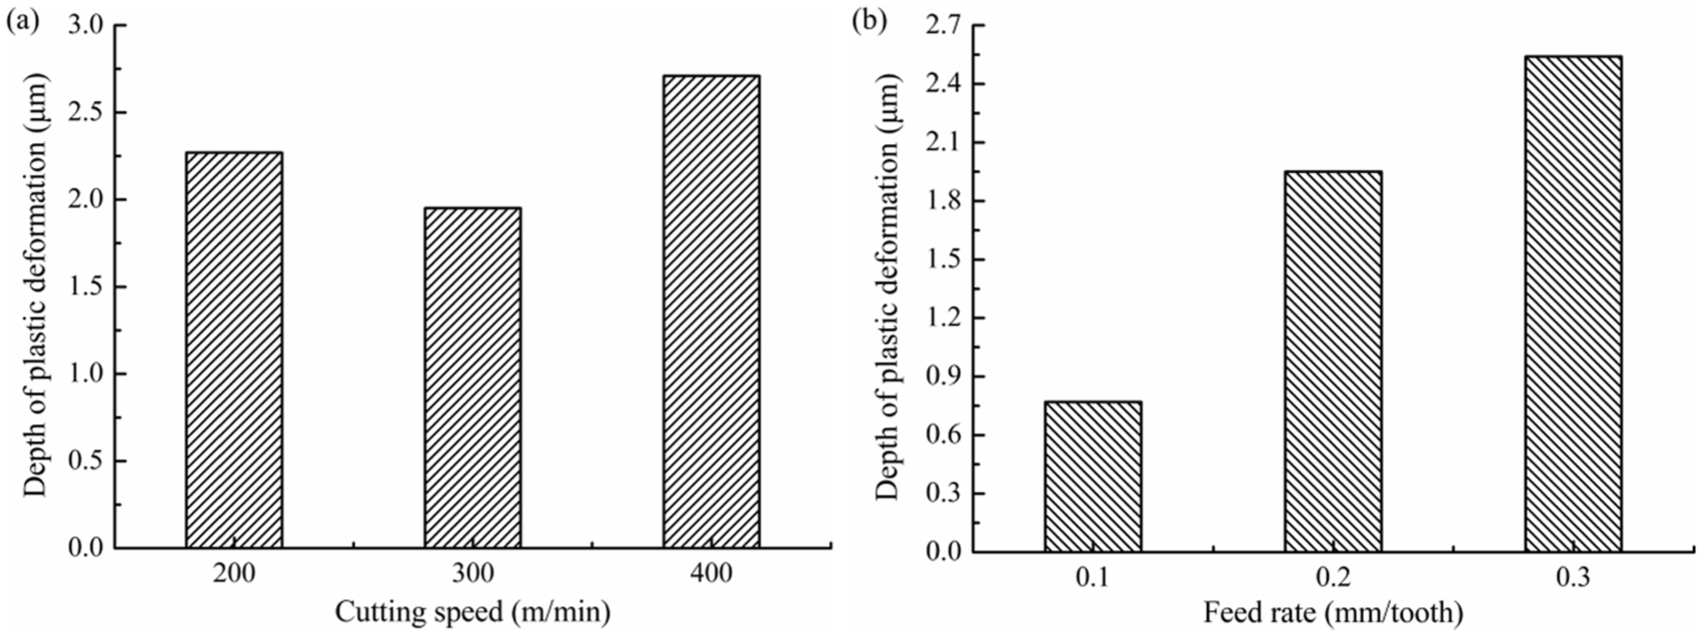
Depth of plastic deformation: (a) cutting speed and (b) feed rate.
According to Du and Liu, 27 the surface plastic strain can be estimated by equation (1)
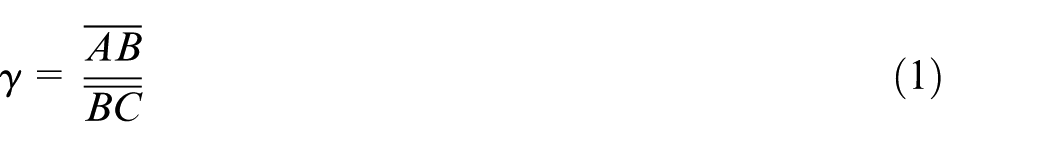
Here, as shown in Figure 4(a),
Figure 7 shows variation of plastic strain with cutting speed and feed rate. It is noted that the degree of plastic deformation at speed 300 m/min is higher compared to other two cutting conditions. When cutting speed was lower, the strain hardening was dominated over thermal softening which exhibited higher resistance to deformation. Reversely, the material has less time to involve in deformation with higher cutting speed. As the feed rate increases, the plastic strain gradually increases as well.
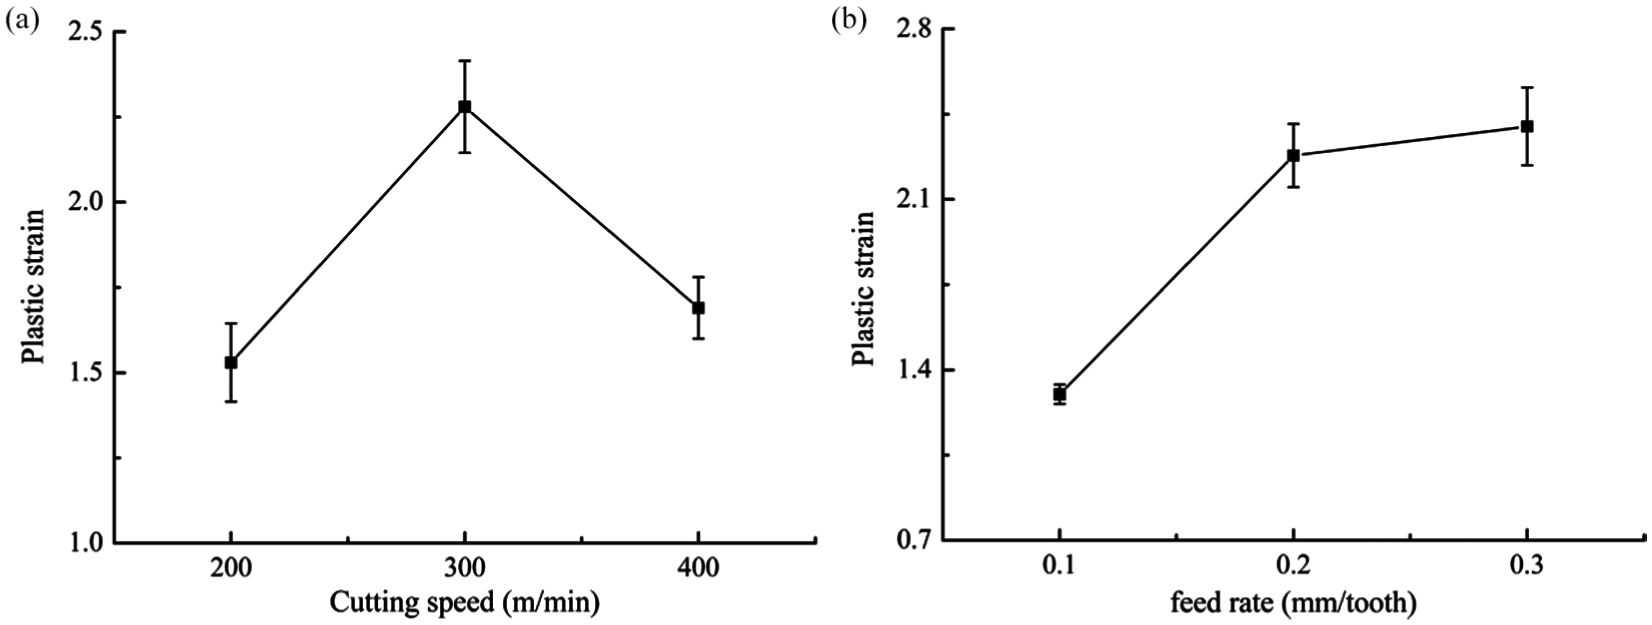
Variation of plastic strain: (a) cutting speed and (b) feed rate.
Phase composition analysis of machined surface
XRD technique was employed to determine further phase transformations in this research. As shown in Figure 8, the increase in cutting speed and feed rate resulted with only martensite according to the diffraction peaks, which indicates the non-occurrence of the phase transformation (limited to the resolution of XRD instrument) compared with diffraction pattern of the bulk material. Although the excessive increase in cutting temperature is the major problem associated with hard milling without using cutting fluids, no retained austenite was detected within the white layer. It can be attributed to the following aspect: In hard machining process, the heating rate is sufficiently high up to 104 °C/s29,30 and the incubation time is extremely short for austenite to transform fully due to the discontinuity of milling operation. Under this circumstance, even a small fraction of formed austenite in heat stage would transform back to martensite in cooling stage. Consequently, phase transformation cannot be used for the explanation of white layer formation encountered in hard milling process.
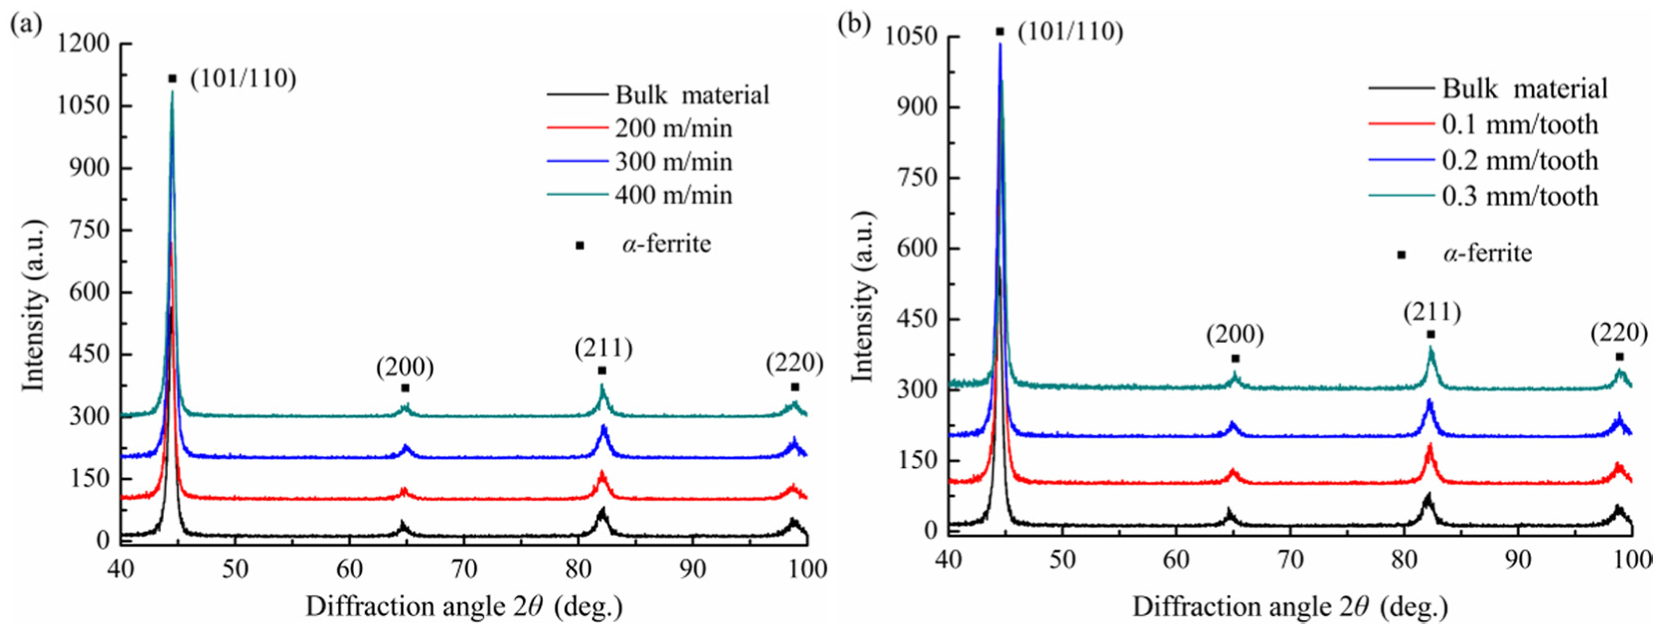
XRD diffraction pattern: (a) cutting speed and (b) feed rate.
Grain refinement analysis of machined surface
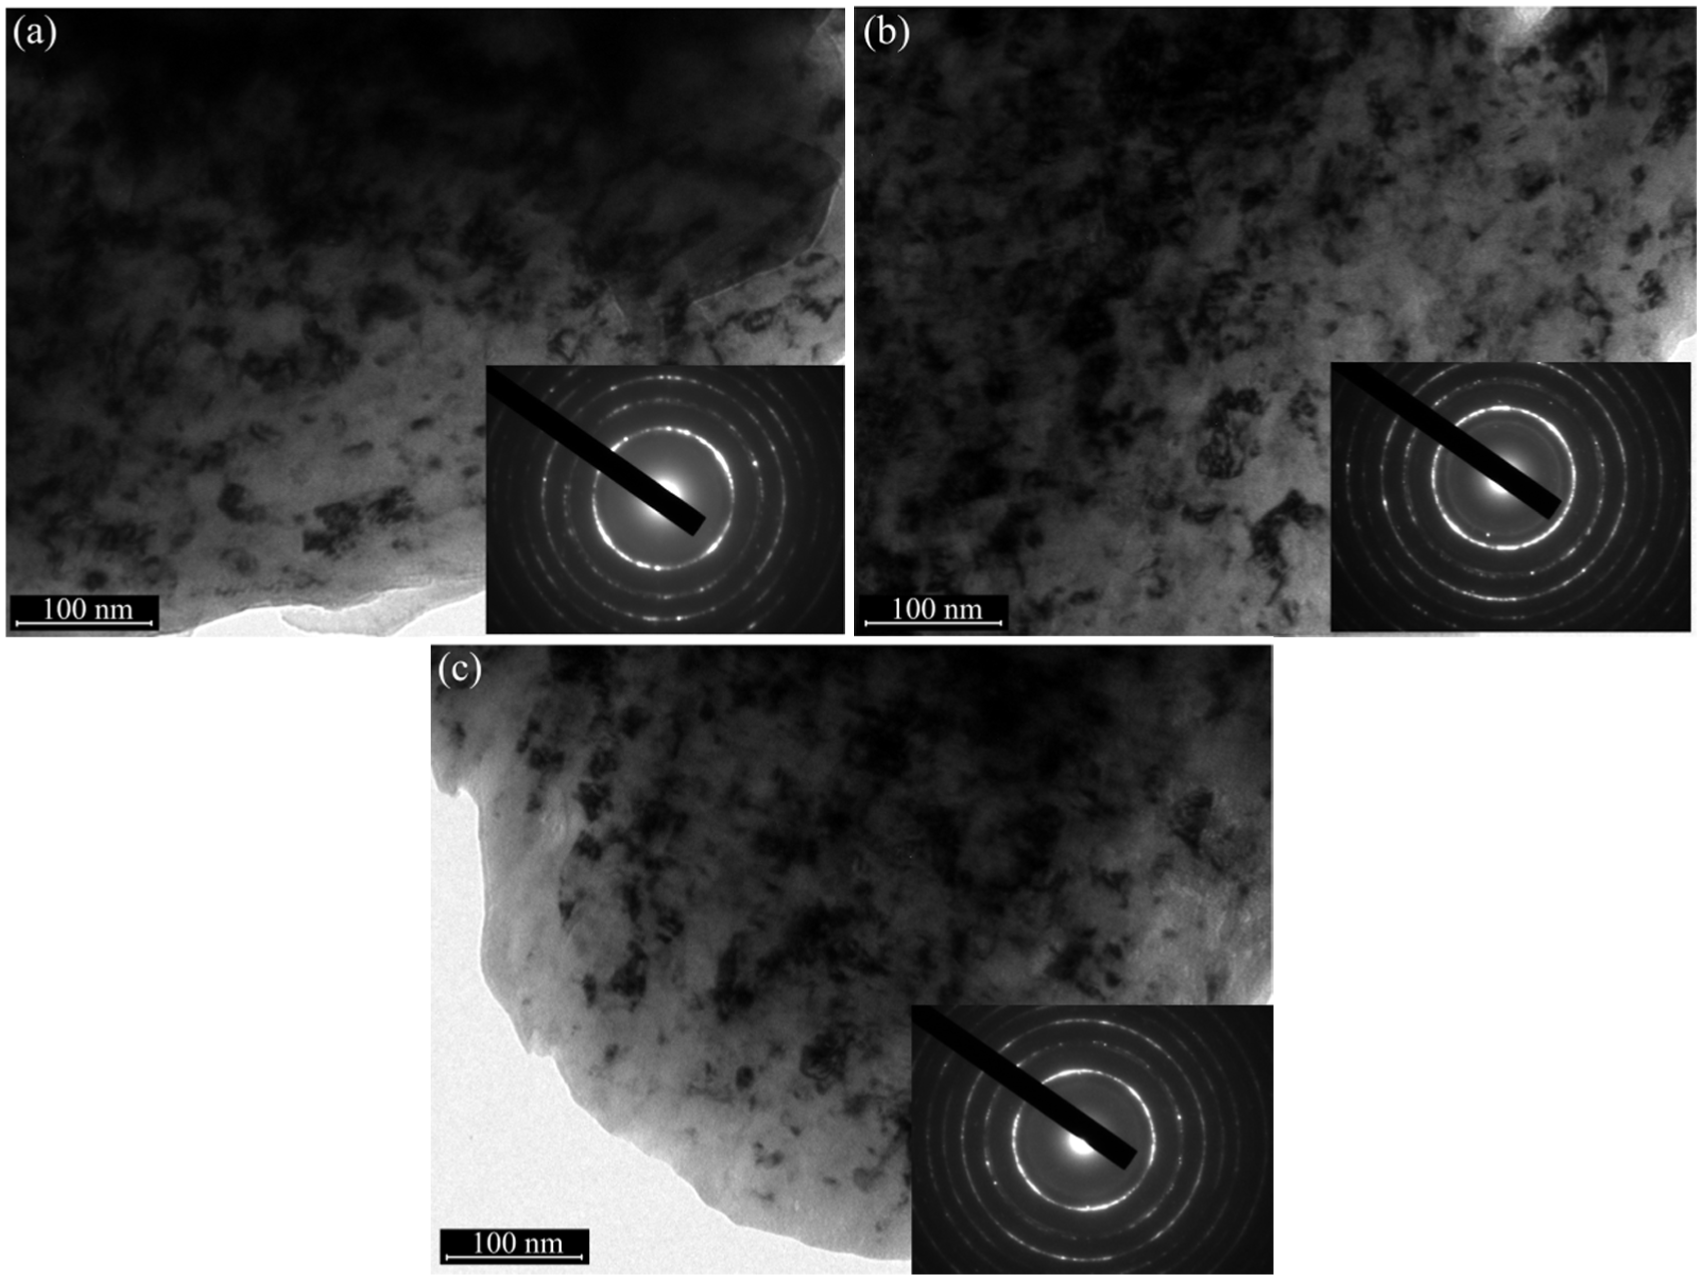
Figure 9 shows the bright-field transmission micrographs of white layers and corresponding SAED patterns with varied cutting speeds. As observed, the average grain size is in the order of several tens of nanometers, even though the grains’ size is approximately 100 nm in diameter at cutting speed of 200 m/min. The diffraction patterns of continuous rings also indicated the presence of polycrystalline structure. As the cutting speed increases, the ring diffraction patterns change from semi-continuous to continuous, which unravel the progressively refined nano-sized grains in the white layers. Furthermore, one interesting phenomenon evidently observed that the cementite is refined and dispersed discretely in a high degree in the microstructure at higher cutting speed. During hard milling, the machined surface was subjected to high intensity of coupled thermal–mechanical stress. Zhou et al. 31 found that plastic deformation could induce the refinement of the cementite in steel. The SEM images shown in Figure 4 confirm that the machined surfaces suffer severe plastic deformation. Some researchers proved that plastic deformation as a driving force could promote the occurrence of the dynamic recrystallization.32,33 It is known that plastic deformation in macro level is the result of accumulated dislocation and its mobility in micro level. Under the external mechanical and thermal loads, dislocations tangled and dislocation cells were formed with more intensified plastic deformation. Eventually, the original grains were segmented into the substructure in sub-sized or nano-sized scale by the dislocation cell walls. At last, the formed dislocation cells are segmented into sub-sized or nano-sized grains by rearranged cell wall. From the perspective of cutting temperature, it has been confirmed that higher cutting speed causes elevated cutting temperature during machining. 26 According to the analytical model proposed by Zhang and Guo, 34 the temperature of the formed serrated chip during hard milling of AISI H13 steel could exceed 1010 °C. It is inferred that the machined surface could also suffer a comparatively higher temperature. Once the machined surface temperature exceeds dynamic recrystallization (DRX) temperature (∼0.4Tm, Tm is the melting point), submicron- or nano-sized grains induced by dynamic recrystallization will appear. Under the interaction of combined mechanism, the refined equiaxed grains resulted from DRX are illustrated in Figure 10. Owing to the extreme short cutting time, the refined grains of DRX are not possible to grow.
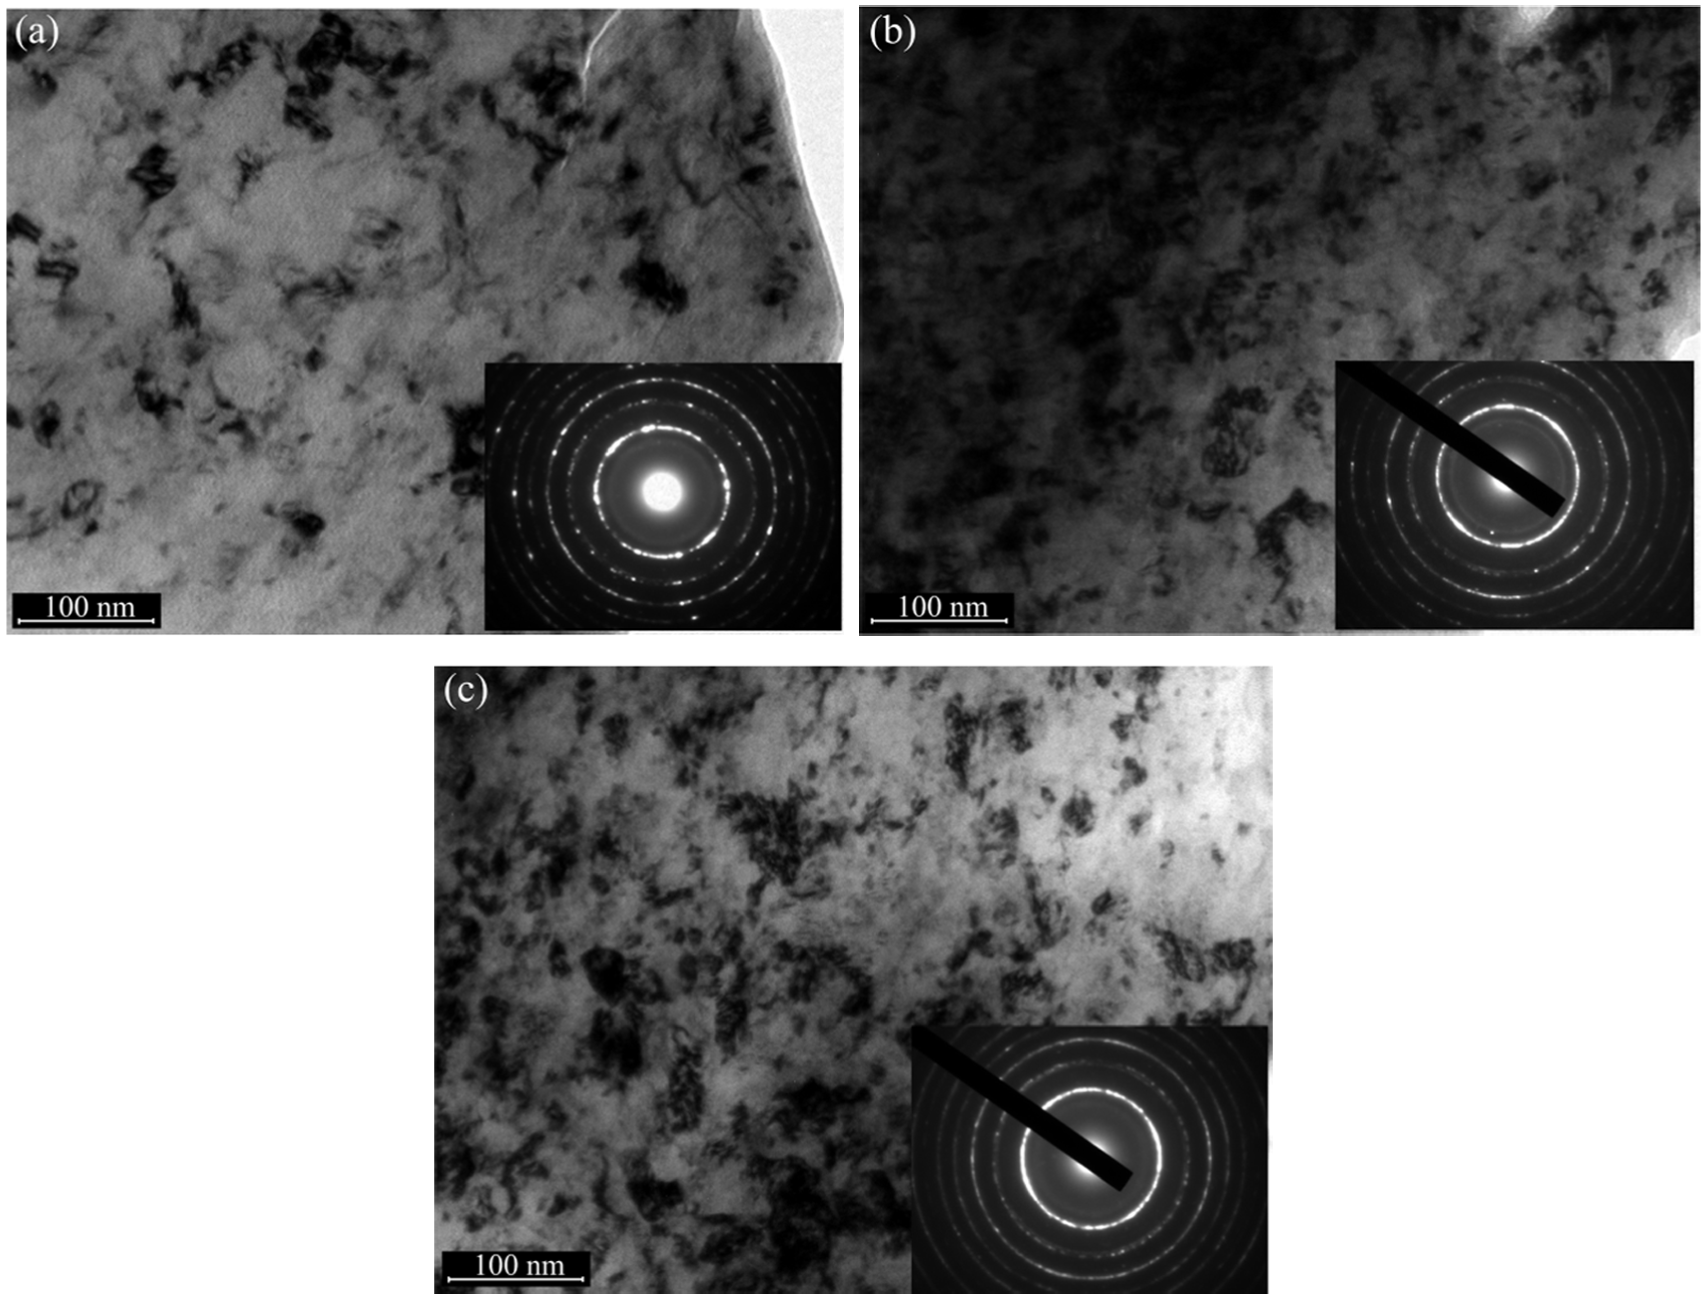
TEM micrographs and corresponding SAED of machined surface: (a) 200 m/min, (b) 300 m/min, and (c) 400 m/min.
TEM micrographs with fine equiaxed grains (v = 200 m/min, fz = 0.2 mm/tooth).
Figure 11 shows the TEM bright-field micrographs and corresponding SAED patterns at various feed rates. It is noted that the microstructure of the machined surfaces presents similar characteristics regarding both the grain sizes and the segmented cementite as the feed rate increases. The refined and segmented cementite is distributed randomly without distinct variation visually. On the other side, the ring diffraction patterns give direct clues that polycrystalline microstructure was formed on the machined surface. However, the variation of the feed rate has insignificant impact on microstructure changes (grain size and refined cementite) of the machined surface in the limited thickness of detection layer (less than 50 nm), in contrast to cutting speed.
TEM micrographs and corresponding SAED of machined surface: (a) 0.1 mm/tooth, (b) 0.2 mm/tooth, and (c) 0.3 mm/tooth.
Comparing the SAED patterns shown in Figure 12, the body centered cubic (BCC) martensite α is indexed in all of the white layers. No trace of the face centered cubic (FCC) reflections observed in any of the diffraction patterns obtained, suggesting the absence of the retained austenite γ. It is in a better consistency between SAED patterns and XRD results. However, some scholars23,24 experimentally discovered that white layer was formed on machined surfaces and also retained austenite was detected in hard turning, despite the lower level of cutting parameter in contrast to current milling experiments. In addition, cementite θ is also detected in all the machined surfaces. Different from the diffraction patterns of the as-received material corresponding to cementite θ, the cementite reflection in all white layers emerged as faint continuous rings, indicating the distributed and dispersed greatly refined cementite in grains. Similarly, as the feed rate increases, no sign of retained austenite is appeared based on the diffraction patterns apart from the refined grain sizes and cementite.
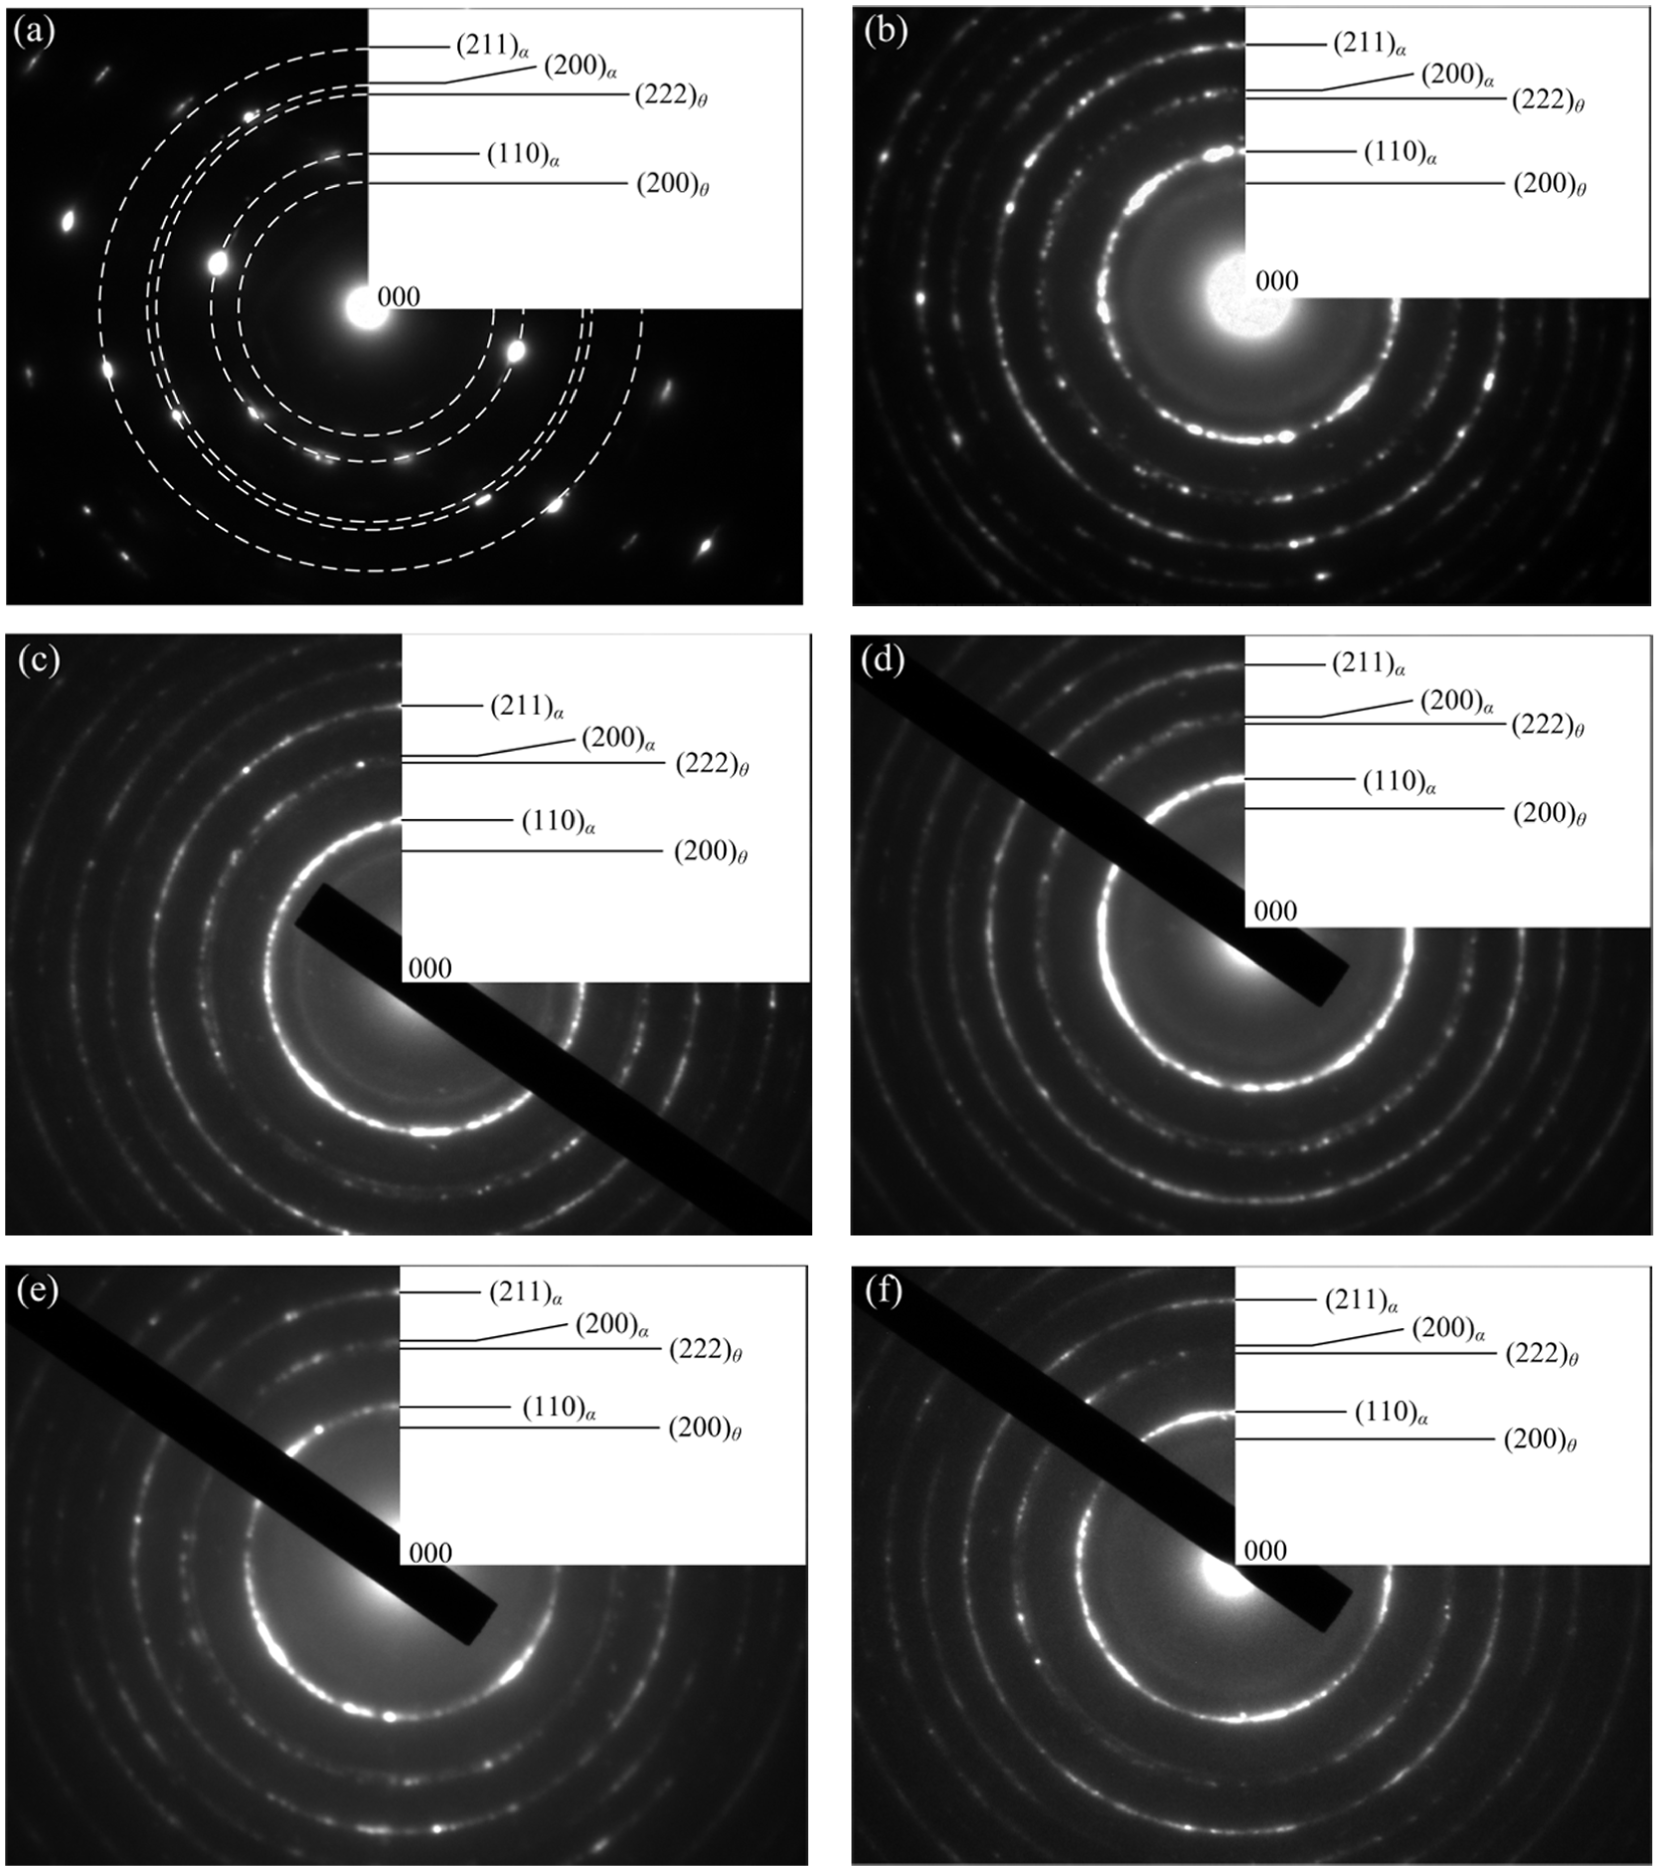
SAED patterns from machined surface layers at different cutting speeds: (a) initial SAED pattern, (b) 200 m/min,(c) 300 m/min, (d) 400 m/min, (e) 0.1 mm/tooth, and (f) 0.3 mm/tooth ((a–c) fz = 0.2 mm/tooth, (e–f) v = 300 m/min).
Cutting forces and cutting temperature
Highly coupled thermo-mechanical loads have significant impact on plastic deformation of the machined surface layer. Figure 13 depicts the measured cutting forces in three directions under various cutting parameters. When the cutting speed increases from 200 to 400 m/min, the measured lowest cutting force Fx was obtained at 300 m/min. Meanwhile, the highest cutting force Fx was recorded corresponding to the cutting speed of 400 m/min. Nonetheless, seen from Figure 14, the cutting temperature at 400 m/min is the highest among the cutting parameters. High temperature can soften the material around the tool tip and thus reduces the cutting forces. Contrary to the thermal softening, higher cutting force at the highest cutting speed may be attributed to the following factors: First, due to the accelerated milling speed, strain hardening and strain rate hardening induced by severe plastic deformation dominate over the thermal softening phenomenon. Second, higher cutting speed causes the tool flank wear more serious, which, conversely, lead to the rise of cutting forces. In addition, when the cutting speed is 200 m/min, lowest cutting temperature corresponds to a relatively higher cutting force; this also confirms that there is a reciprocal relationship between strain hardening and thermal softening. As the feed rate continues to increase, the cutting force Fx increases synchronously as illustrated in Figure 13(b). As shown in Figure 14(a), the instantaneous cutting temperature rises sharply from room temperature and then cools down at a relatively slow rate. In Figure 14(b), the estimated temperature of the machined surface goes up gradually both with the increment of cutting speed and feed rate. The measured temperatures vary in the range of 350 °C and 470 °C, which are lower than DRX temperature 596 °C of AISI H13 steel. In this respect, the observed nano-sized equiaxed grains induced by DRX with the way of nucleation at elevated temperature are excluded. However, it is believed that DRX can occur if a critical strain, which is a function of temperature and strain rate, is reached.35–37 The equiaxed grains in nano-size are mainly attributed to the severe shear plastic deformation induced by mechanical stresses. As for the measured cutting temperature, previous researches38,39 found the machined surface temperature was underestimated compared to the true machined surface temperature. Consequently, the elevated temperature during the hard milling process as second driving force promotes the occurrence of DRX on the machined surfaces.
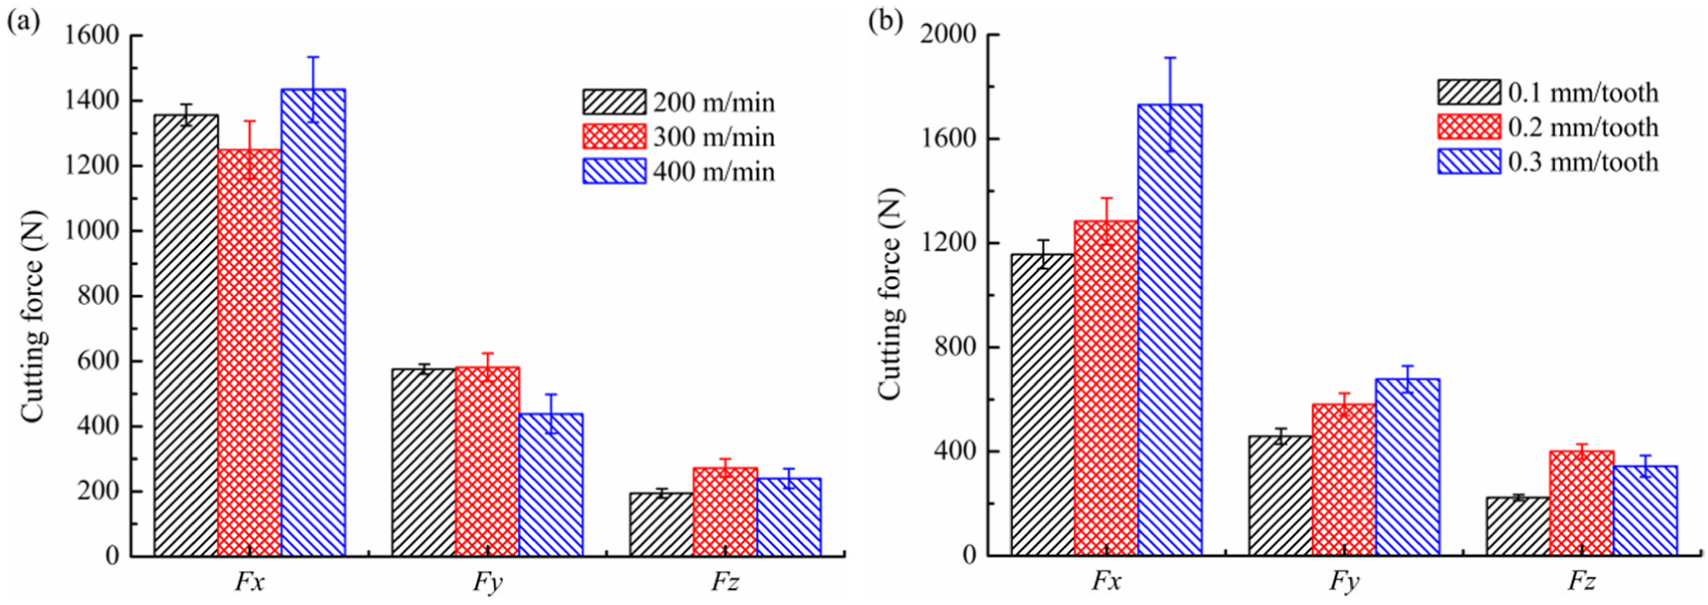
Comparison of cutting forces: (a) cutting speeds and (b) feed rate.
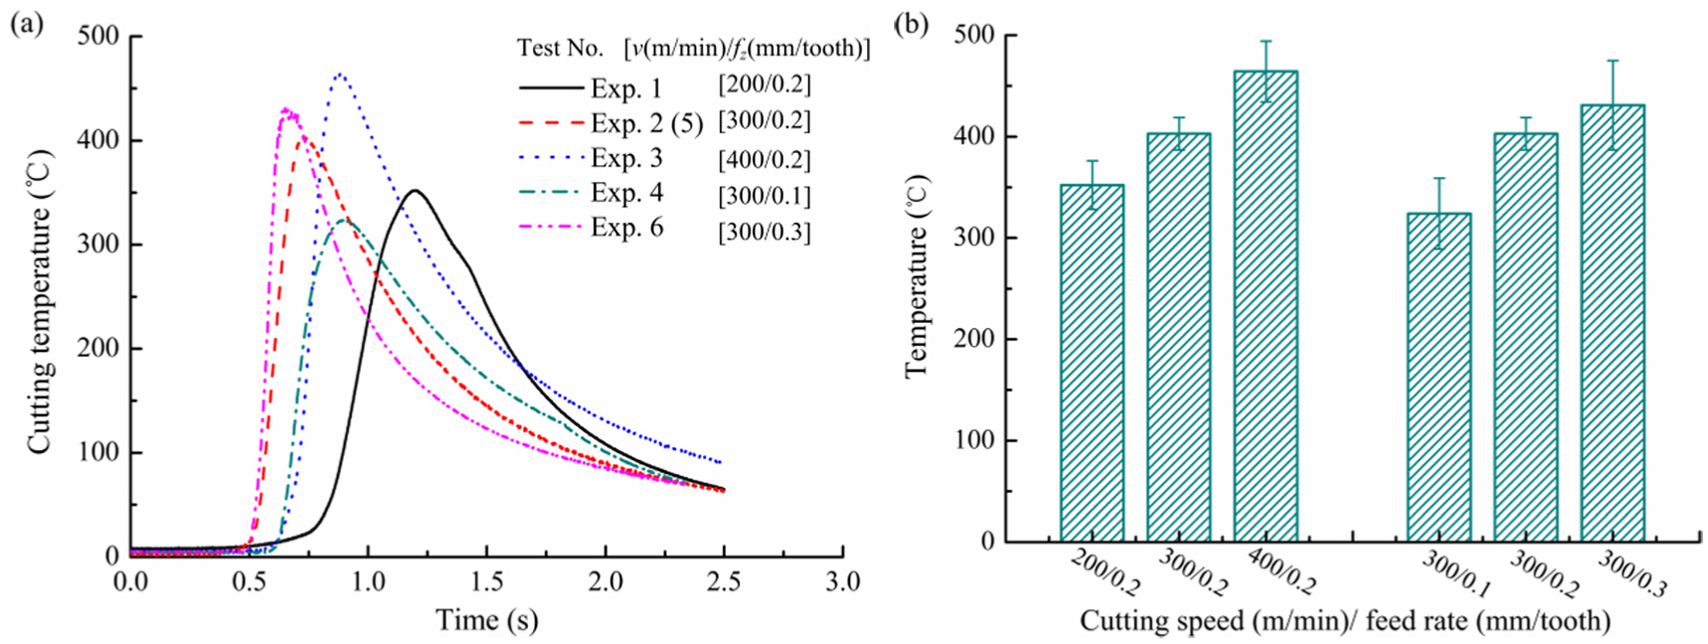
Comparison of measured cutting temperature of the machined surface: (a) instantaneous cutting temperature and (b) temperature comparison at varying cutting speeds and feed rates.
Hardness of plastic deformation layer
Considering the scale of the depth of plastic deformation induced by hard milling process, the nano-indentation technique was applied to measure the variation of hardness. Figure 15(a) plots the load–depth curves under nano-indentation for AISI H13 steel. It is noted that the penetration depth gradually increases under the identical load with increasing of depth below the topmost machined surface. Figure 15(b) shows the measured average nano-hardness of the topmost machined surface. After finishing the hard milling, the hardness of all machined surfaces is highly improved and increased with cutting speed, in contrast to the value 5.35 GPa of the as-received material. When the cutting speed is 400 m/min, the mean nano-hardness reached the largest value 8.12 GPa. The degree of work hardening at this speed reaches approximately 51.8%. With the gradual increase of feed rate, the measured nano-hardness shows slight variation among the cutting conditions. Based on the TEM results, quite similar microstructure (grain size and well-distributed cementite) of the machined surface should account for the small changes of nano-hardness. Here, two aspects are assumed to be involved in the improvement of milled surface hardness. In one respect, greatly refined grains are directly related to the hardness based on the Hall–Petch formula. 40 In another respect, the distributed and dispersed cementite also facilitates the increment of the milled surface hardness. Seen from Figure 16, the nano-hardness gradually declines with the depth increases from the topmost machined surface to the bulk material. When the cutting speed or feed rate is lower, the measured nano-hardness reached the nano-hardness value of the as-received material at the depth of approximately 13 µm. On the contrary, the nano-hardness still remains a higher value at the same depth. It is apparently found that there is a better consistency between nano-hardness distribution and plastic deformation with gradient reduction shown in Figures 4 and 5. However, the visually observed depth of plastic deformation has a lower value compared with the nano-hardness distribution. It is speculated that the interaction of thermal and mechanical load in micro level may be responsible for it.
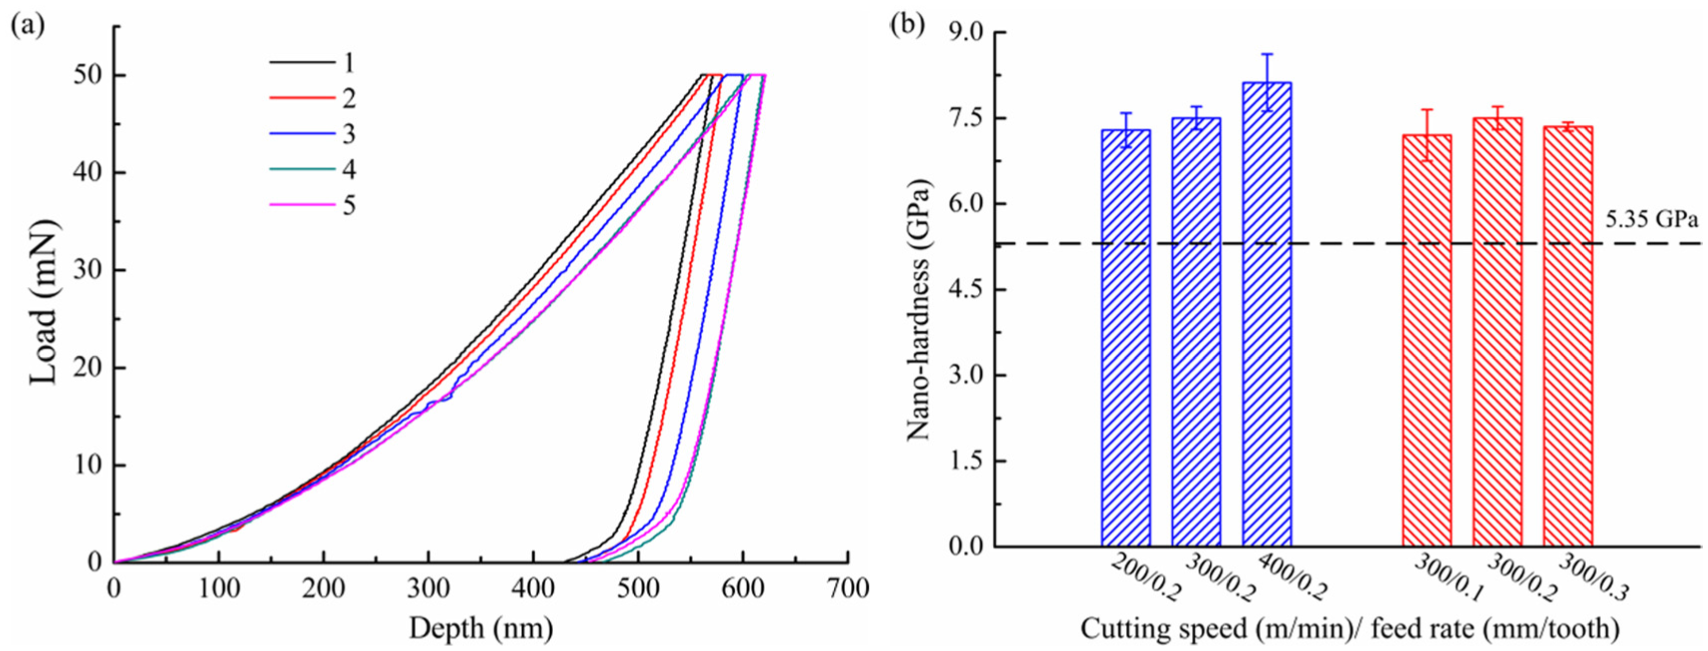
Hardness measurement: (a) load–depth curve (v = 300 m/min, fz = 0.2 mm/tooth) and (b) comparison of hardness.
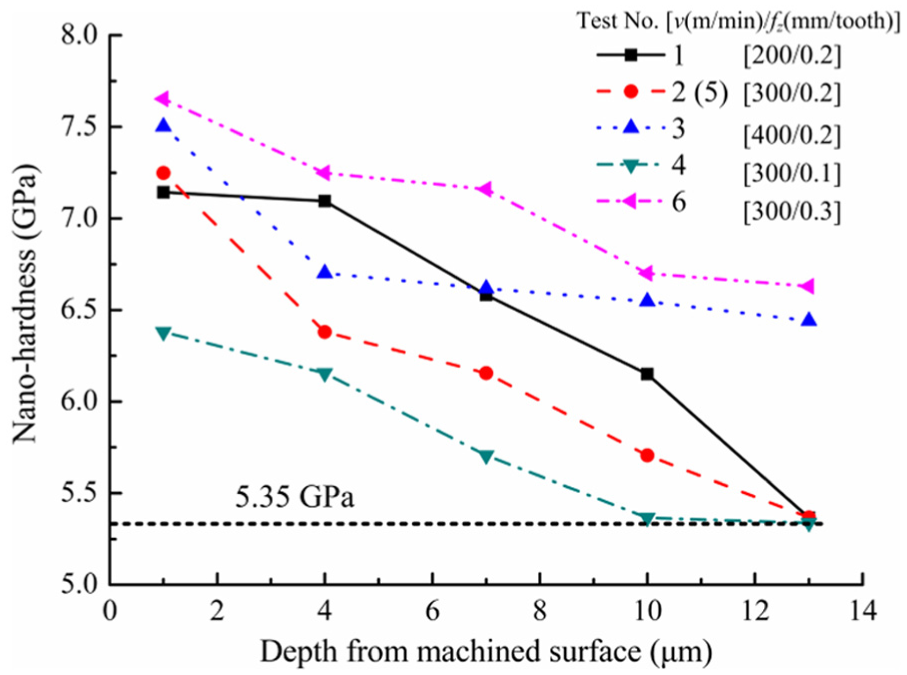
Variation of nano-hardness below machined surface.
Correlation of cutting forces, cutting temperature, and plastic deformation
Figure 17 describes the correlation of cutting force, cutting temperature, and depth of plastic deformation. The experimental results show that there is a satisfactory consistency between the depth of plastic deformation and the cutting force. The variation of the plastic deformation corresponds to the increase or decrease of the cutting force. With regard to the cutting temperature, an approximately linear relation of cutting temperature and cutting speed or feed rate was obtained. It is well known that the cutting temperature is critical to DRX. Therefore, DRX is limited to an extremely shallow layer of the machined surface. However, Yang and Liu 41 found that plastic stain has the highest value on the topmost surface and reduces rapidly deep into the bulk material, obeying the first-order exponential distribution. Consequently, the depth of plastic deformation is in agreement with the cutting force, by which introduces mechanical load on the machined surface. The thermal softening of the material resulted from high temperature facilitates the plastic deformation with varying degrees along the direction of perpendicular to the machined surface.
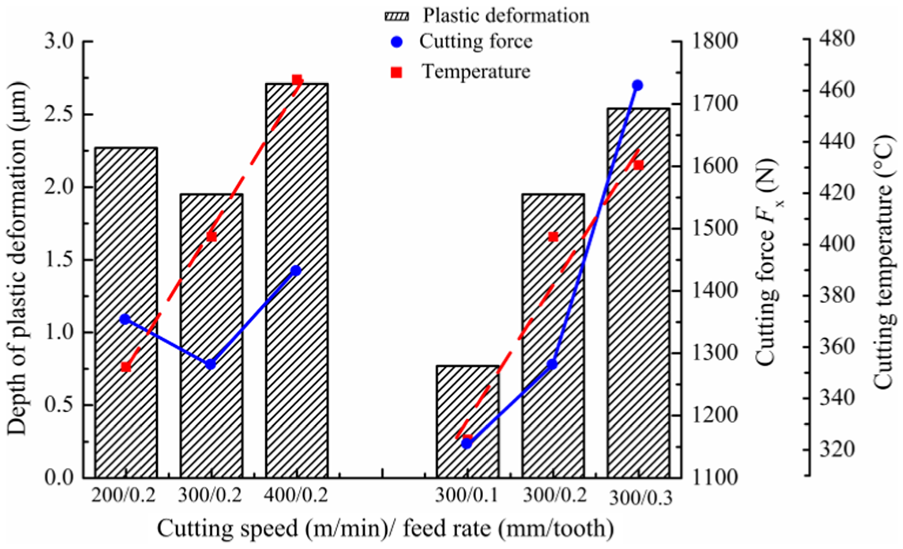
Relationships among the cutting force, cutting temperature, and depth of plastic deformation.
Conclusion
In this research, the microstructure alteration mechanism below the topmost machined surface and its effect on surface hardness variation as well as the correlation between cutting force, cutting temperature, and depth of plastic deformation have been investigated in the hard milling of AISI H13 steel. The main conclusions are summarized as follows:
Plastically affected zone below the topmost machined surface under different cutting parameters as observed demonstrates three visually distinguishable characteristics, that is, unaffected zone, plastically deformed zone, and white layer zone. An extremely shallow white layer in the range of 500 to 700 nm is observed on the machined surface layer.
XRD phase analysis and SAED patterns indicated that no retained austenite was formed in the white layer. Based on the machined surface temperature, it can be inferred that phase transformation from martensite to austenite was not occurring on the machined surface.
The improved hardness of the machined surface is mainly attributed to grain refinement and dispersed refined cementite.
The mechanical load plays a predominant role in the formation of submicron- or nano-sized equiaxed grains as a consequence of DRX in the machined surface layer with the assistance of thermal softening induced by elevated temperature in hard milling.
As an extension of this work, although the mechanism of formed submicron- or nano-sized grains on the machined surface was unraveled, a comprehensive study should be performed in the future with respect to cutting parameters varying from low level to high level in order to obtain satisfactory results and develop accurate prediction model of depth of plastic deformation .
Footnotes
Acknowledgements
The views expressed in the submitted article are our own and not an official position of the institution or funder.
Declaration of conflicting interests
The author(s) declared no potential conflicts of interest with respect to the research, authorship, and/or publication of this article.
Funding
The author(s) disclosed receipt of the following financial support for the research, authorship, and/or publication of this article: This work was supported by the National Natural Science Foundation of China (Grant No. 51575321 and Grant No. 51175309) and Taishan Scholars Program of Shandong Province.