
Abstract
In this work, surface layer properties of AA7075 aluminum alloys’ ultrasonic impact peened at different treatment times are investigated. Three different layers were found on the ultrasonic impact–treated surface of AA7075 aluminum alloys. The thicknesses of the layers increase with an increase in the treatment time or deformation amount. X-ray diffraction patterns indicate that the treated surfaces have no different phases from base material and are in the face-centered cubic phase. The highest hardness values of all treated AA7075 aluminum alloys were determined in nanocrystallization layer, which is the top layer of the surface because of the grain refinement and work hardening. A sharp increase at the residual stresses occurs, increasing the deformation time and amount because of the surface enlargement.
Introduction
Aluminum alloys, which are one of the lightest engineering metals, have a higher strength-to-weight ratio than steel. Aluminum alloys have a wide range of application areas such as automotive, aerospace, and transport. It is necessary to improve the mechanical properties of aluminum alloys, in order to expand their application areas. To improve the strength of the aluminum, alloying and age-hardening were used as the main strengthening mechanisms.1,2 In recent years, severe plastic deformation (SPD) processes such as equal channel angular pressing (ECAP)3,4 and accumulative roll-bonding (ARB) 5 are used for improving the mechanical and functional properties of aluminum alloys.6,7 In these processes, ultra-large plastic strain is introduced into a bulk metal in order to create ultra-fine grained metals. The principles of SPD have been used to develop surface treatments that create a nanocrystalline layer on the material surface. 8 All peening methods, such as ultrasonic impact treatment (UIT), high-frequency mechanical impact treatment, and hammer peening, are all cold mechanical treatment methods in which a dense, compressed layer of material is produced on the component surface. 9 Surface structure of the materials is a great concern, because most failures occur on the surface (fatigue, fretting corrosion, corrosion, wear, etc.). As a result, improving the surface properties enhances the overall behavior of materials.10–12 In this study, UIT was used for a surface treatment method.
UIT is especially used as a post-welding process of joints made of various steels and alloys for improving fatigue strength by reducing the welding stresses.13–18 UIT is also called as ultrasonic treatment (UT), needle peening, ultrasonic peening (UP), and ultrasonic impact peening (UIP). In the process, ultrasonic waves produced by an ultrasonic transducer are transferred to the material surface as peening impacts by steel pins.19,20 The ultrasonic transducer can be either magnetostrictive or piezoelectric. Piezoelectric type of UP tools commonly have the working frequencies of 20–55 kHz,9,21,22 vibration amplitudes of 20–50 µm,23,24 and powers of 300 W–4 kW depending on the aim of the treatment.24,25 A typical piezoelectric type of UP tool is illustrated in Figure 1.
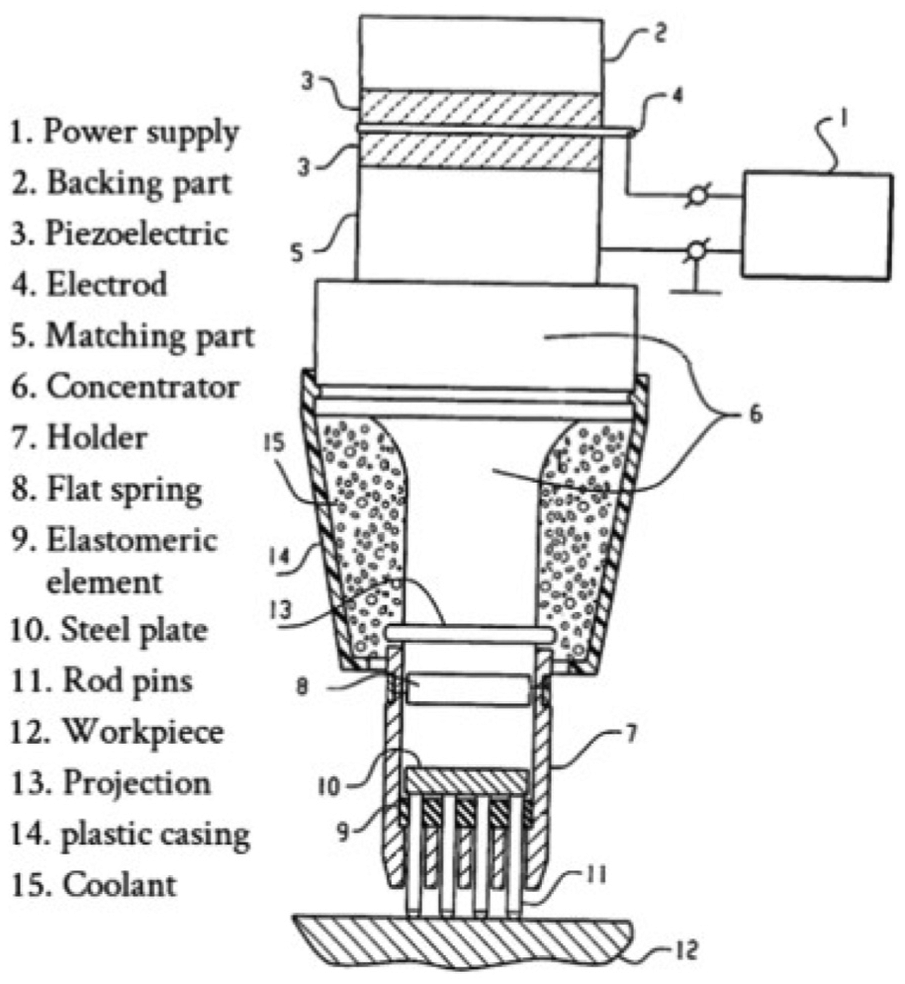
Mechanism of the UIT process. 25
During the UT, pins oscillate with high frequency between the ultrasonic transducer and material surface, impacting the treated area. This high-frequency impacts cause plastic deformation of the material surface. At the same time, these impacts create beneficial compressive stresses in the material surface. Due to the compressive stress, UIT is especially used to increase the fatigue resistance of welded joints. For fatigue life improvement, it is enough to treat the weld toe zone which is the transition from base metal to the weld material. UIT is mainly attributed to the improved weld toe geometry and beneficial compressive residual stresses.17,26
Although many studies have investigated the effects of the fatigue strength of welded joints, the effects of the UIT on the material surface properties have not been studied except a few studies. The number of studies carried out on aluminum materials is even less. According to Mordyuk et al., 27 UIT increases the surface hardness remarkably and leads to only slight increase in the surface roughness at the AlMg6 material. In the study by Li et al., 28 UIT leads to grain refinement on the surface layer of the 2A12 aluminum alloy welded joints. They found that the average work-hardening value of UP-treated specimens was improved by about 45% compared to untreated specimens. In the study by Liao et al., 29 on the naturally exfoliated aluminum alloy, the UIT had a potential to extend the fatigue lives of the specimens. An et al. performed a series of UIT experiments. Their results revealed that the UIT can effectively refine the surface coarse grains into equiaxed nanocrystalline grains (grain size: 8.0–10.0 nm) and elongated microbands (15–20 nm wide). 30 Pollack et al. report on the application of the UIT on spokes of cast aluminum (AlSi11Mg) wheel. They indicated that the mechanical impacts of the UIT effected a significant change in the microstructure, porosity and hardness. Hence, the fatigue strength increased significantly compared to the untreated spokes under constant and variable amplitude bending–loading. 31
In order to clarify the effect of treatment times on the surface layer properties, AA7075 samples were peened at different treatment times by UIT in this study. Treated surfaces of AA7075 were investigated and characterized by means of optical microscopy, atomic force microscopy (AFM), X-ray diffraction (XRD) and hardness tests.
Experimental details
Commercial Al-7075 alloy plate (6 mm × 50 mm × 100 mm in size) with chemical composition (mass, %) of 5.7 Zn, 2.65 Mg, 1.5 Cu, 0.21 Cr, and balanced Al was subjected to UIT in this study. Single pin with a diameter of 5 mm was attached at the end of the transducer. SUNBOW HJ-III model UIT equipment was used in this work. The UIT process of AA7075 was performed under different treatment times (3, 7, and 15 min). All experiments were performed with an ultrasonic horn frequency of 17.5 kHz and amplitude output of 25.6 µm. A schematic diagram of the UIT is shown in Figure 1. The UIT equipment consists of an ultrasonic generator, a transducer, an amplitude transformer horn and an impact head installed on the horn tip. A detailed description of the technique is given elsewhere. 32
After UIT, the samples were cut in the plate and then mechanically polished with sandpapers of different grain sizes and finally to a mirror finish with diamond paste down to 1 µm for the metallographic examination and the hardness test. After mirroring, the samples were etched for 20 s at 0 °C in 150 mL water, 3 mL nitric acid, and 1 mL hydrofluoric acid solution for microstructural examinations.
Microstructural examinations were made using optical microscope (Epiphot 200; Nikon) and AFM technique (ezAFM; Nanomagnetics) with a scanned area of 2 × 2 µm 2 . In order to define the formation of phases and measure the residual stresses, an XRD diffractometer (D/Max-2200/PC; Rigaku) was used. The X-ray analysis was operated at 30 kV, 30 mA with CuKα radiation. XRD measurements of thin layers using conventional θ/2θ scanning methods produce a week signal from the layer and an intense signal from the substrate.
The hardness measurements of the samples were conducted using a microhardness tester (DUH-W201S; Shimadzu). A Vickers indentation experiment was carried out, and the applied load was 25 mN.
Results and discussions
The XRD patterns of treated samples are shown in Figure 2. These XRD patterns indicate that the treated surfaces have no different phases from base material and are in the face-centered cubic (fcc) phase (Figure 2). Peak broadening at the treated samples rises prominently because of increasing the internal stress and grain refinement. This phenomenon is common in many surface nanocrystallization materials.27,33,34 UIT causes the non-uniformities because of the plastic deformation such as lattice defects, dislocation tangles, and microstrain at the grain boundary. These non-uniformities and grain refinement create the compressive residual stresses at the material’s surface.
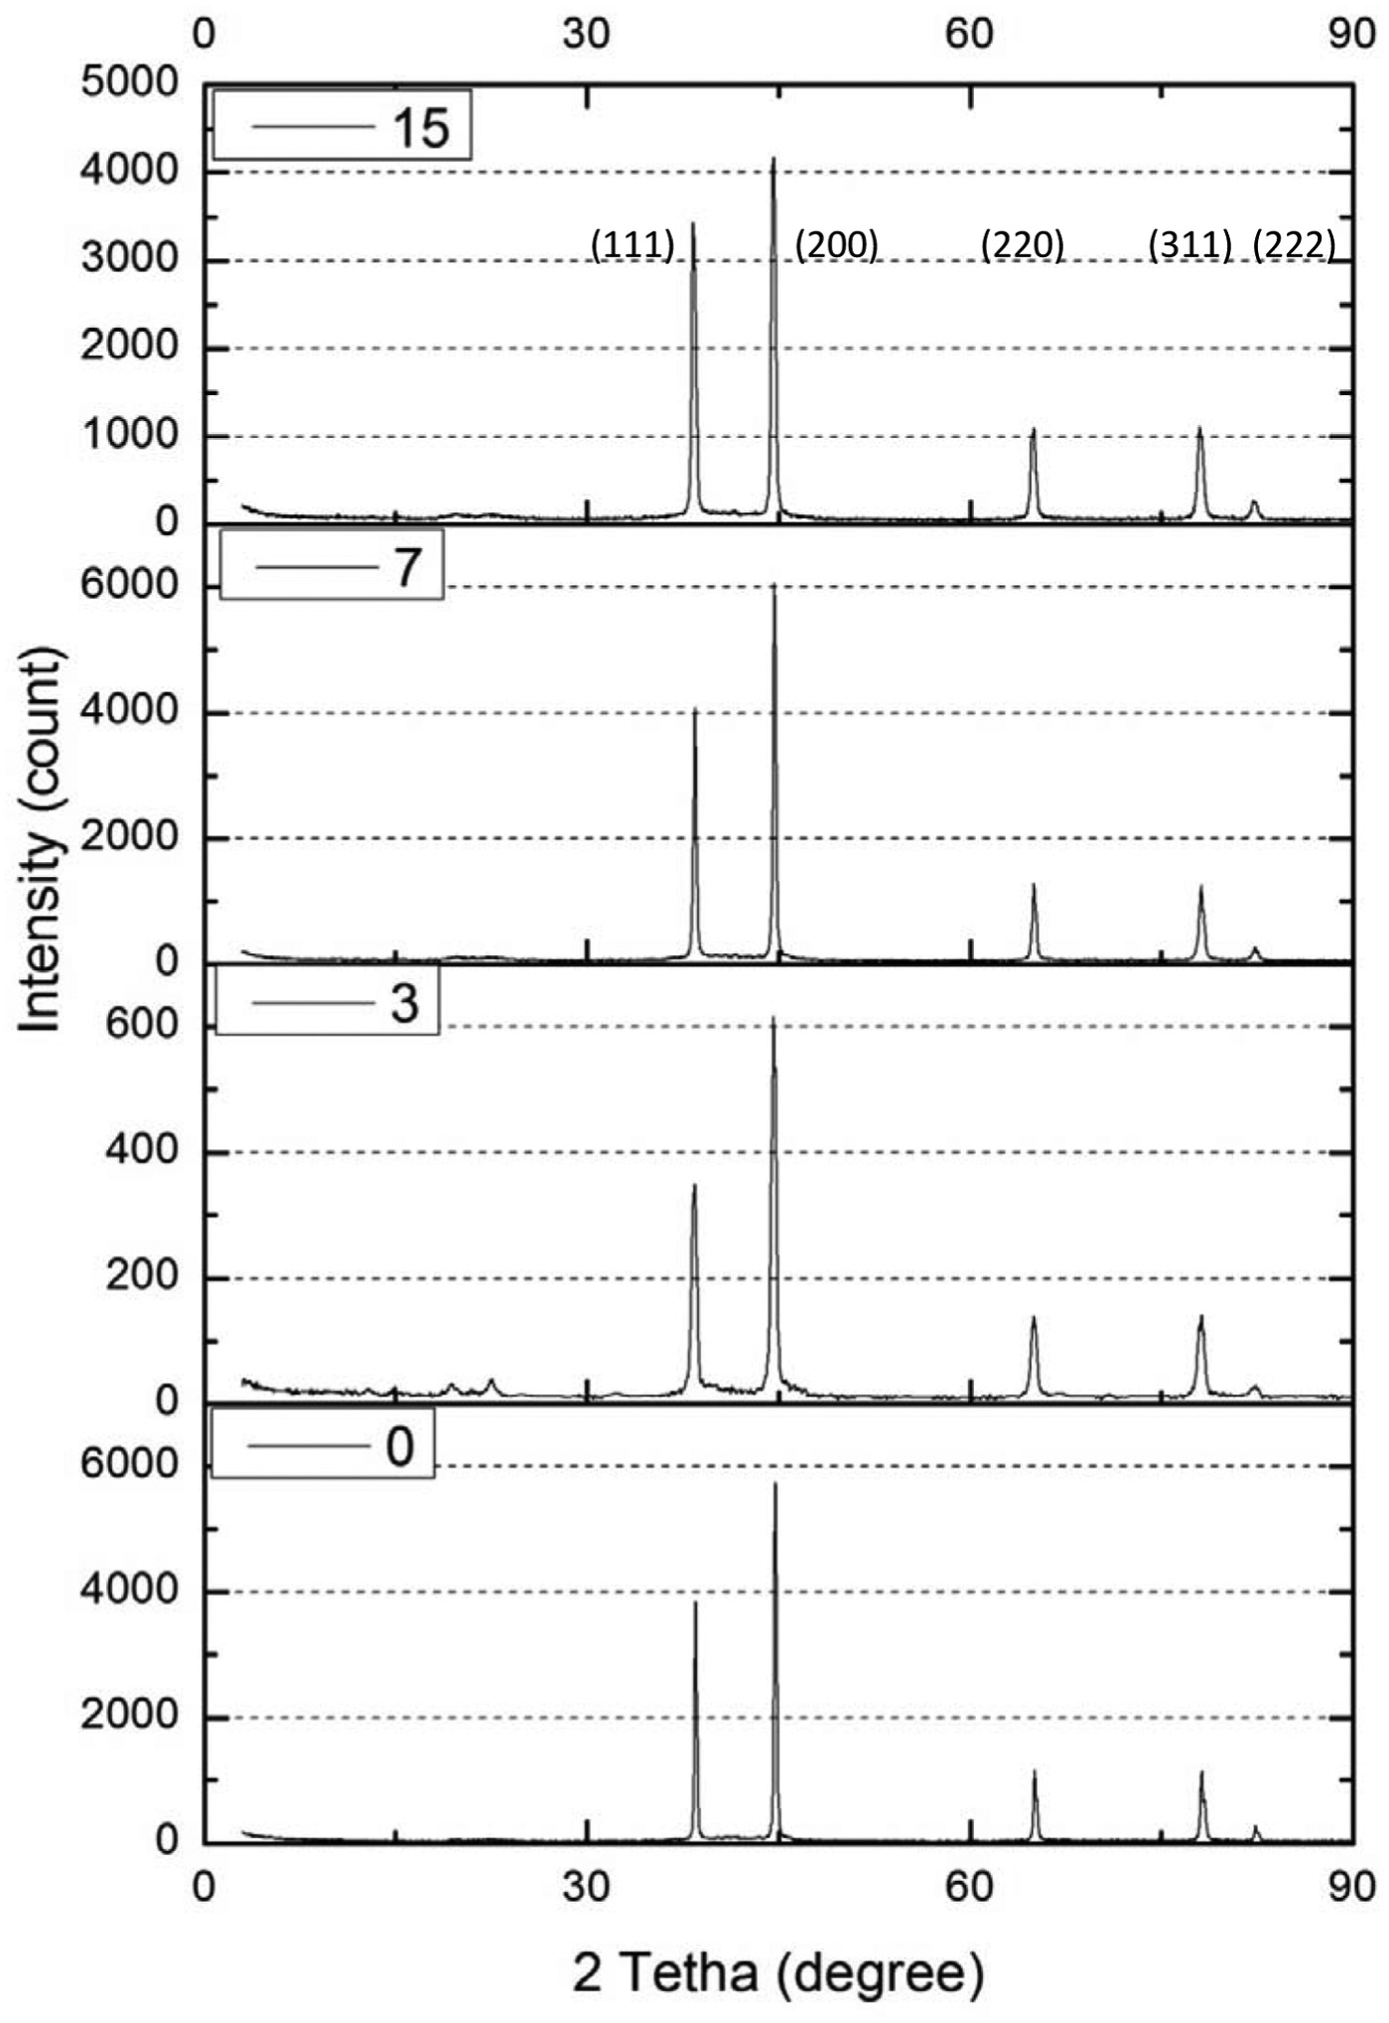
X-ray diffraction pattern from the treated surfaces produced at different treatment times.
It is observed that the results of the residual stress analysis have an increasing tendency similar to the XRD results. The residual stress for treatment times 3, 7, and 15 min was measured as +8, +37, and +237 MPa, respectively, while the base material was −25 MPa.
A sharp increase in the residual stresses (especially sample treated for 15 min) is remarkable (Figure 3). Depending on the deformation time and amount, this sharp increase in the residual stresses can be explained by surface enlargement. At low workpiece hardness, the plastic stretching of regions directly at the surface is dominating, and the compressive residual stresses show their maximum directly at the surface. 35 As can be seen in Figure 4, material surface is enlarged and an amount of material overflows on the material surface because of the severe deformation. The material overflow leads to an additional compressive stresses. For this reason, depending on the treatment time increase, compressive stresses also increase.
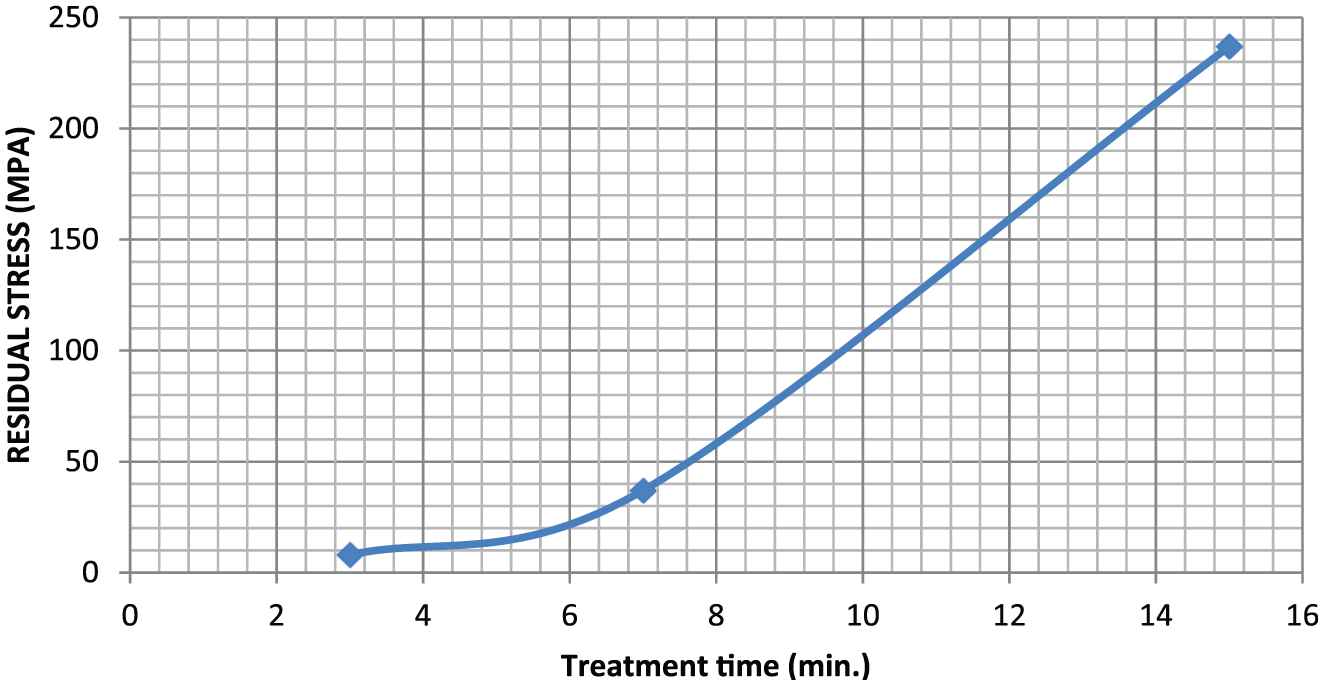
Residual stresses of treated material surface at different treatment times.
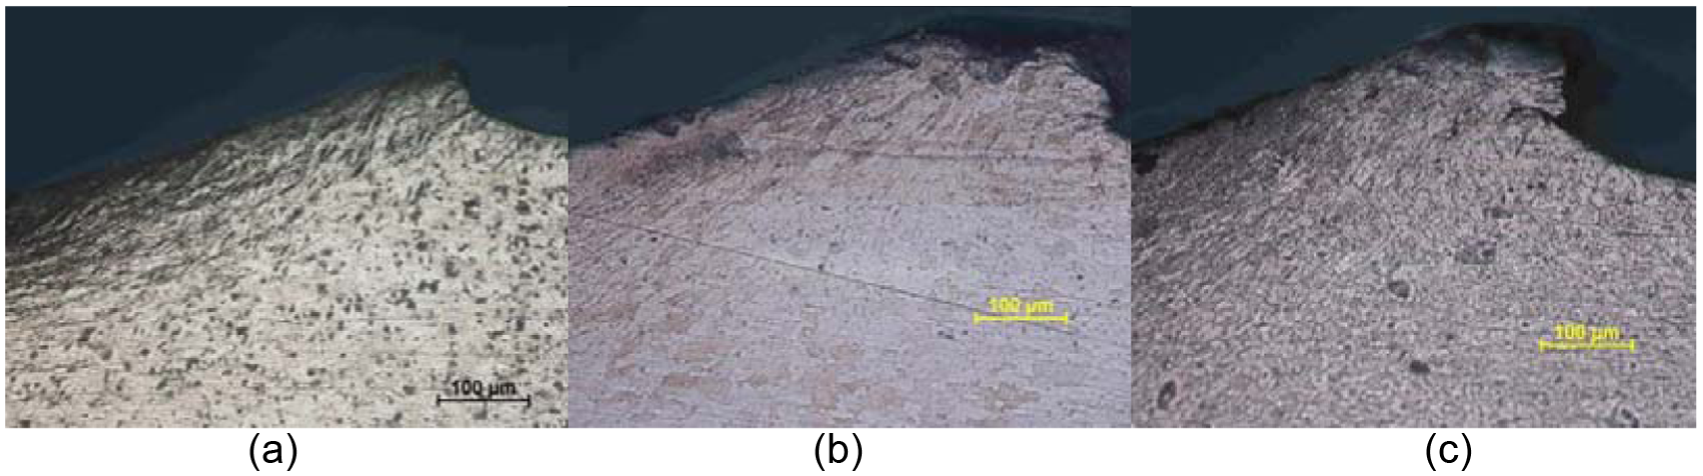
Material overflow on the surface after treatment times (a) 3 min, (b) 7 min, and (c) 15 min.
It is well known that the hardness is a resistance to the plastic deformation, and it is closely related to residual stresses. In this reason, the hardness values in the treated zone depends on the residual stresses induced by UIT. Hardness values decrease from the surface to the base material due to the residual stresses.
Figure 5 shows a cross-sectional optical microscope examination of the treated samples after UIT for a treatment time of 15 min. From the optical microscope examination, all treated samples have the same morphology and are quite different from the non-treated surface.
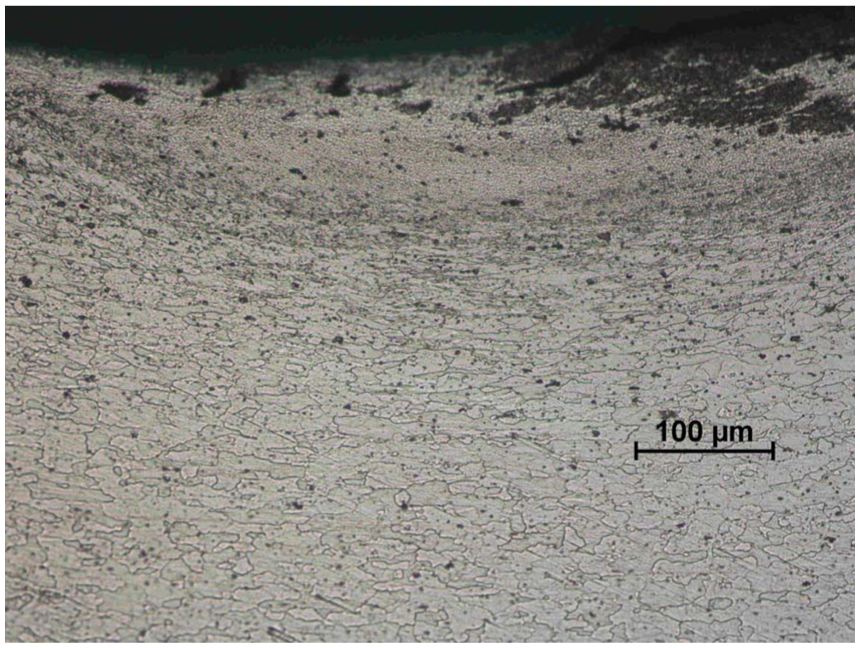
Microstructure of surface layers of the sample after UIT treatment for 15 min.
There are three different layers on the ultrasonic impact–treated surface of AA7075 alloy: nanocrystallization, plastic deformation, and residual stress layer.
Nanocrystallization layer is at the top surface of the treated material and grain boundaries cannot be clearly seen in optic microscope as shown in Figure 5. AFM images of the nanocrystallization layer–treated samples are given in Figure 6. Grain morphology of the nanocrystallization layer has two types: elongated and equiaxed (Figure 6(a)–(c)). There are more elongated grains in the nanocrystallization layer of the 3-min treated samples. Due to increased treatment time and deformation, number of equiaxed grains increases and grain size decreases. Equiaxed grains are formed mostly in the nanocrystallization layer of 15-min treated samples. The average grain size in nanocrystallization layer on the depth of about 15 µm for the treatment times 3, 7, and 15 min was measured about 181, 152, and 59 nm, respectively. Moreover, AFM has shown that nanoscale voids formed at grain boundaries in the nanocrystallization layer during the intensive plastic deformation. It is also clearly seen the dislocation motions as a fine step during impact treatments in the AFM three-dimensional (3D) images.
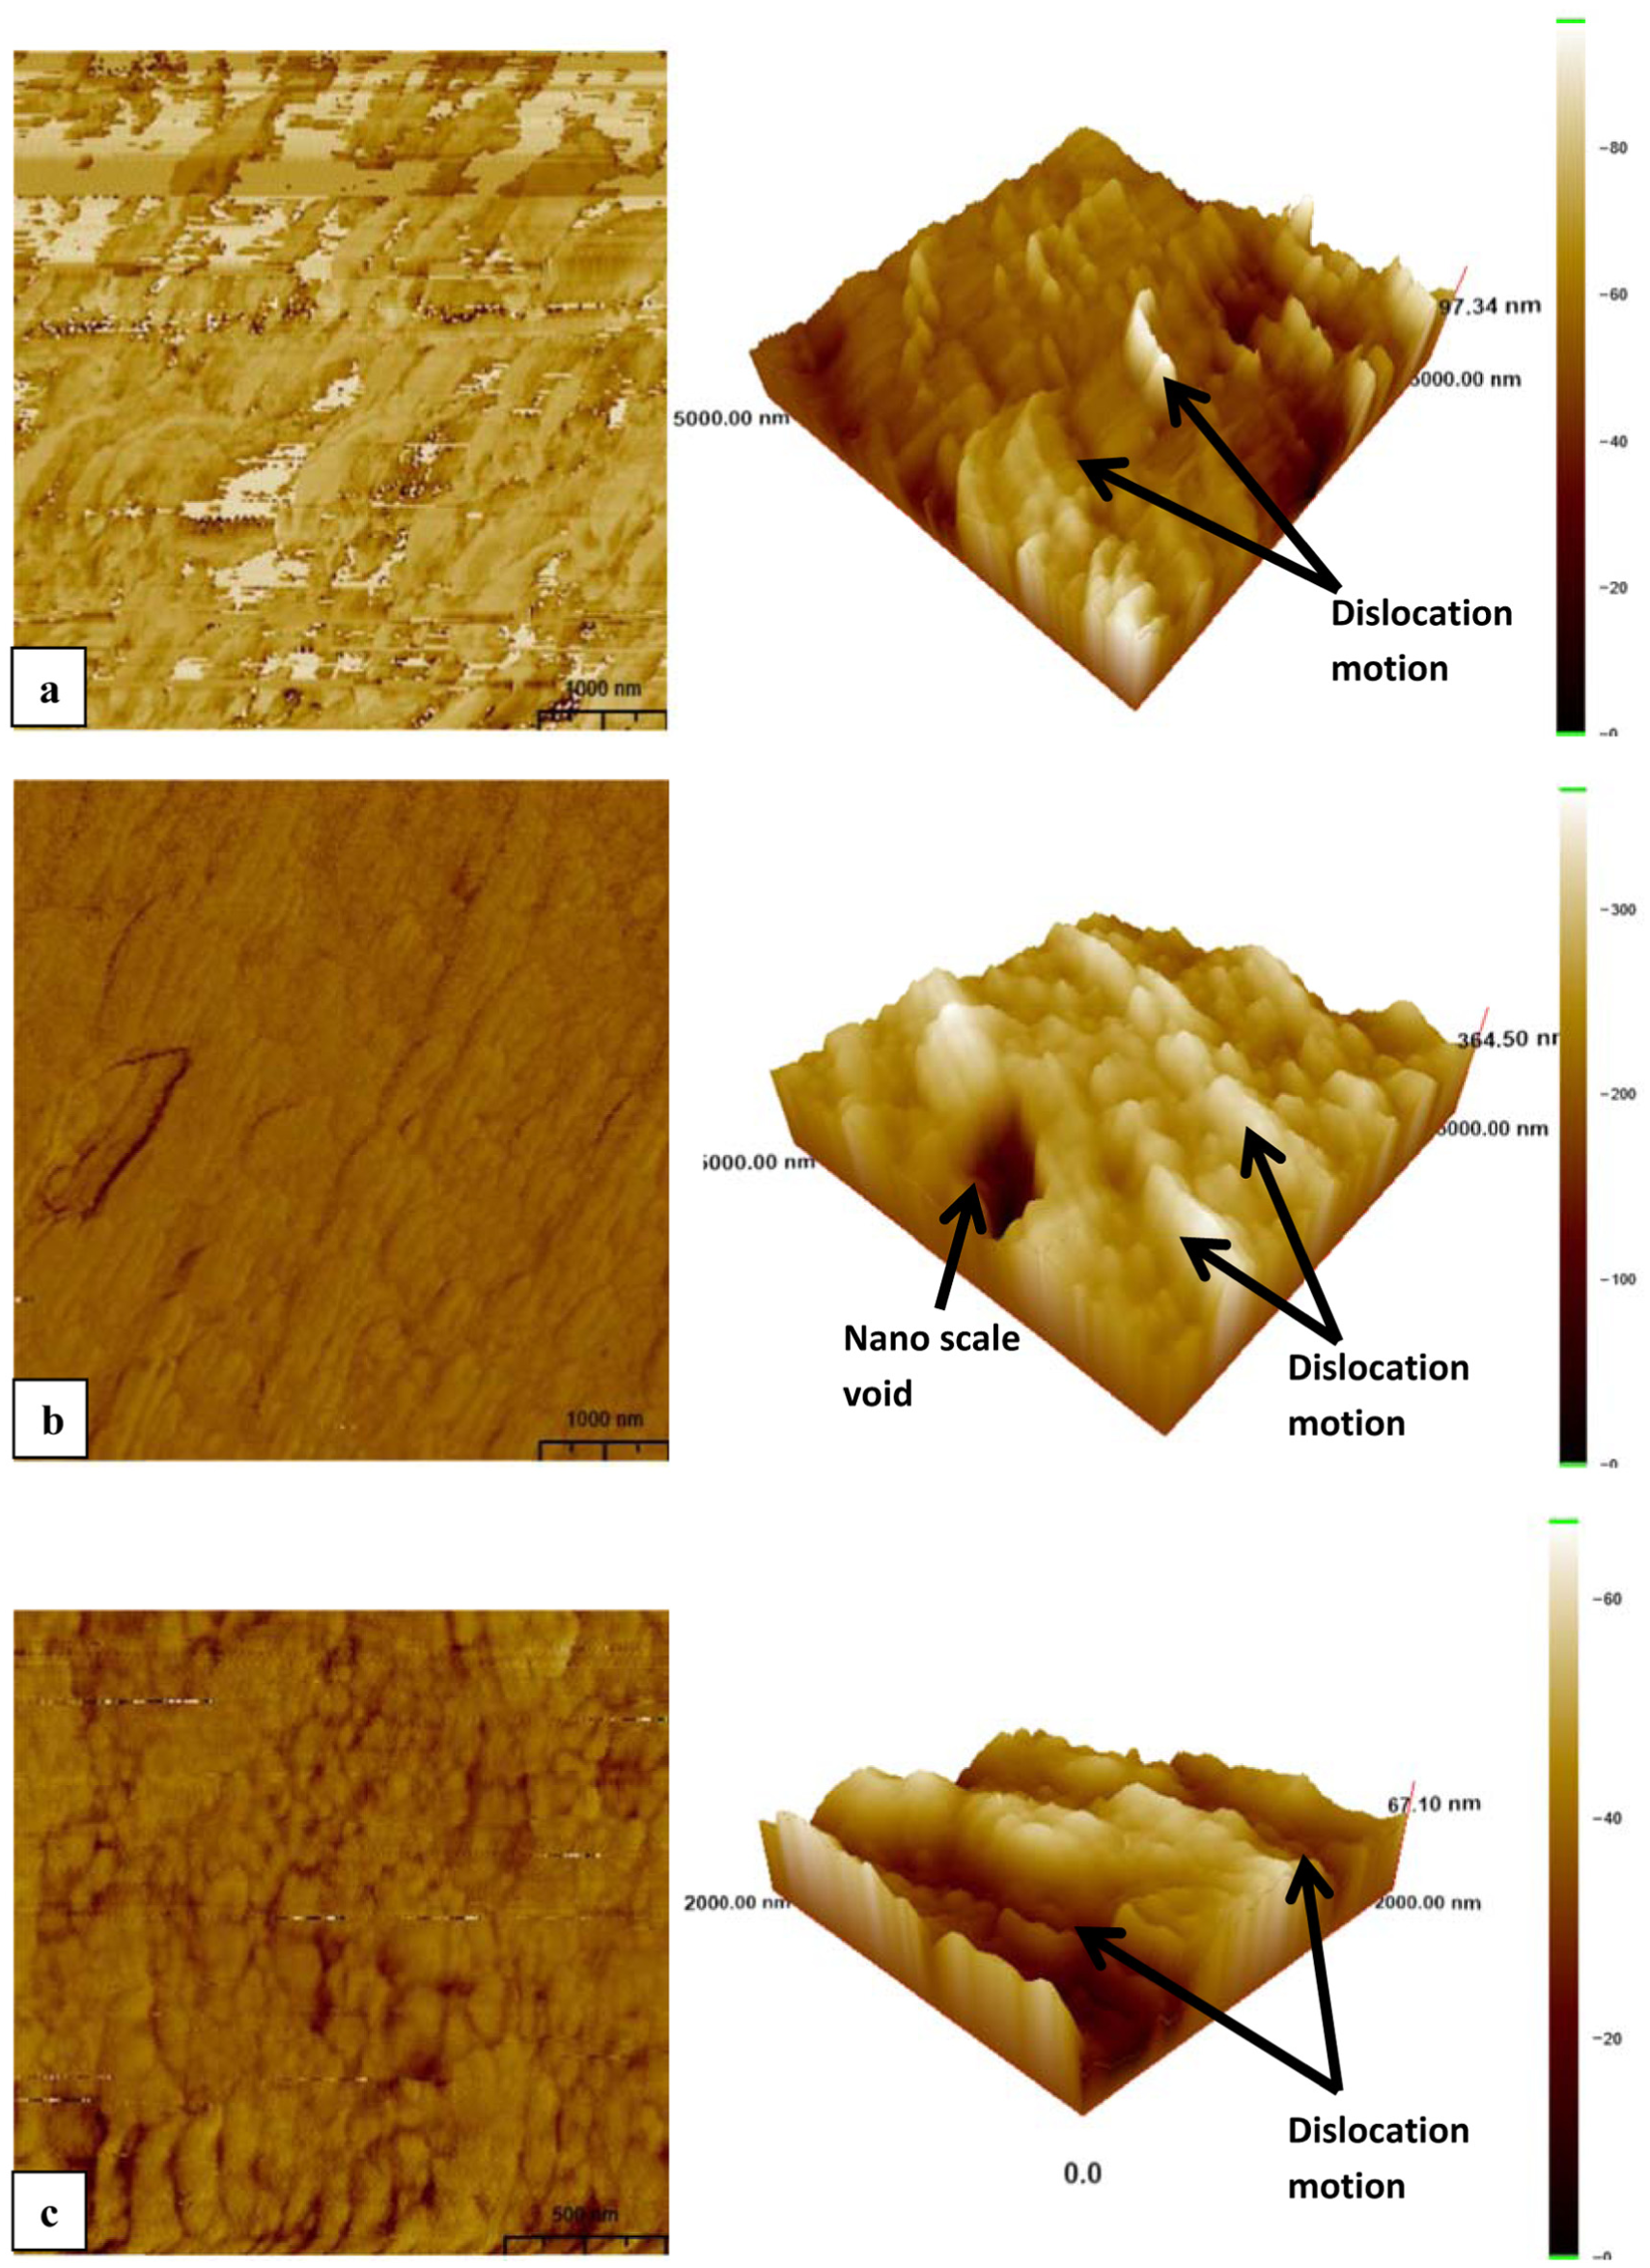
AFM images of the nanocrystallization layer on the depth of about 15 µm for (a) 3 min, (c) 7 min, and (e) 15 min.
Depending on the deformation amount, fine particles at the nanocrystallization layer are a little coarsening from the surface into the core. In addition, thickness of the nanocrystallization layer increases with an increase in the treatment time. The thicknesses of the nanocrystallization layer for 3, 7, and 15 min treatment times are 65, 120, and 140 µm, respectively.
Under the nanocrystallization layer, the plastic deformation layer is located. In this layer, the grains are oriented perpendicular to the direction of the plastic deformation. The crystallographic reorientation of the grains is an unavoidable result of plastic deformation which takes place by means of a set of micromechanisms, especially slip and twinning. 36 It is clearly seen as a layered structure due to the orientation shown in Figure 5. The thickness of this layer is not uniform and increases with an increase in the deformation amount. The thicknesses of the plastic deformation layer for 3, 7, and 15 min treatment time are 100, 150, and 160 µm, respectively.
The residual stress layer is induced by the plastic deformation. In the layer, the amount of the deformation is not enough to cause significant structural changes, but it is sufficient to form residual stresses. These high stress values cause the higher hardness values at this layer compared to the base material.
In all the treated samples, significant surface hardening has been observed as shown in Figure 7. Hardness values increase from the base material to the surface, and maximum hardness values are obtained in the nanostructured layer at the surface (214 HV) while the untreated material hardness is 175 HV. The reasons for these high hardness values are the work hardening and the grain refinement. The amount of work hardening and grain refinement increases depends on the increase in the amount of deformation. Therefore, the highest hardness values are obtained at the nanostructured layer because of the highest deformation amount at the material’s surface. In addition, one of the important effects of the grain refinement is an improvement in the mechanical properties that is explained by Hall–Petch relationship. The hardness behavior of fine-grain structures is also described: the tightening as a result of the sub-grain formation by Hall–Petch. 37
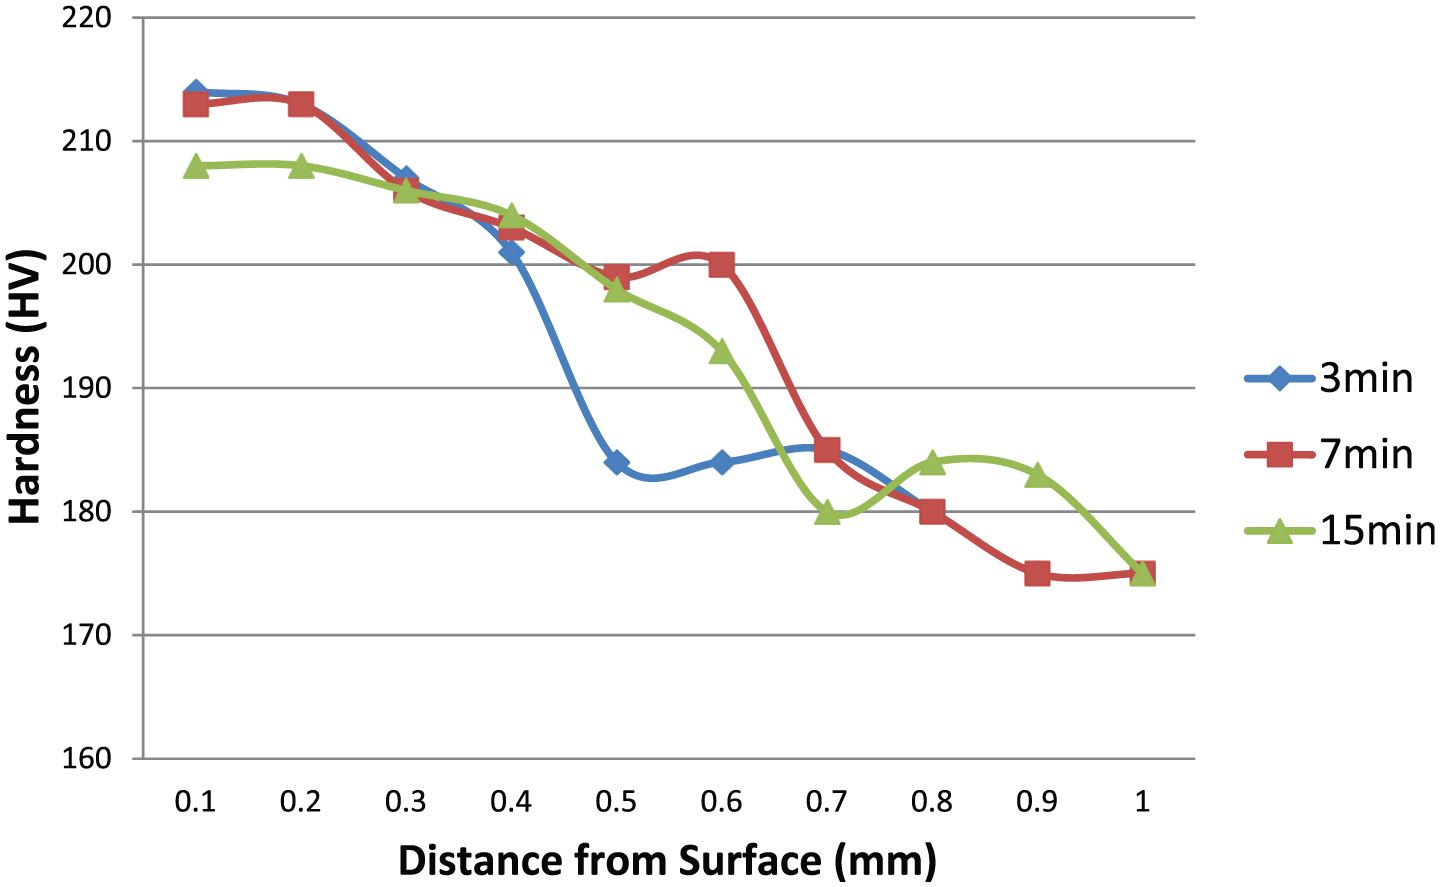
Microhardness profiles for different treatment times of UIT samples.
Conclusion
AA7075 alloy has been treated under the 17.5-kHz constant high frequency and 3, 7, and 15 h treatment time by the UIT process. The effect of process time (is also deformation amount) on the microstructure evolution and hardness behavior is investigated. The conclusions can be drawn from the present investigation as follows:
There are three different layers in the ultrasonic impact–treated surface of AA7075 alloys. These are nanocrystallization, plastic deformation, and structure unchanged (non-structural changes) layers from the surface. The thicknesses of the layers increase with an increase in the treatment time or deformation amount.
XRD patterns indicate that the treated surfaces have no different phases from base material and are in the fcc phase. It is observed that the results of the residual stress analysis have an increasing tendency similar to the XRD results. A sharp increase in the residual stresses occurs, increasing the deformation time and amount, because of the surface enlargement, especially long treatment times.
The highest hardness values of all treated AA7075 aluminum alloys were determined in the nanocrystallization layer which is the top layer of the surface. Hardness values decrease from the surface toward the core. Grain refinement and work hardening cause an increase in the hardness of the nanocrystallization layer.
Grain morphology in the nanocrystallization layer has two types: elongated and equiaxed. Due to increased treatment time and deformation, the number of equiaxed grains increases and grain size decreases.
Footnotes
Declaration of conflicting interests
The author(s) declared no potential conflicts of interest with respect to the research, authorship, and/or publication of this article.
Funding
The author(s) received no financial support for the research, authorship, and/or publication of this article.