
Abstract
Dual laser-beam bilateral synchronous welding technique is considered to replace riveting in terms of skin–stringer joints. The 2.0-mm thick Al-Li alloy T-joint, which is welded by dual laser-beam bilateral synchronous welding between 2099-T83 stringer and 2060-T8 skin, is investigated in the current study. Under the tailored process conditions, the examinations and analyses of microstructures, microhardness distribution, hoop tensile mechanical properties, and fractographies of the T-joint are conducted. Experimental results show that the maximum tensile strength of the weld seam is up to 85% of the tensile strength of the skin material. In order to explore the special fracture characteristics of dual laser-beam bilateral synchronous welding joints after tensile test, a three-dimensional finite element model is established and the residual stress of the weldment is analyzed. Considering the scanning electron microscopy results and simulation results comprehensively, stress concentration is the main reason for the weldment failure in tensile test.
Keywords
Introduction
The skin–stringer joints of aluminum alloy have a major application in the aviation industries where high strength, concurrent low weight, and cost reduction are desirable.1,2 Riveting, the dominant joining technology for aerospace structure since decades, however, takes a great deal of time and costs.3,4 To fulfill the local needs of aircraft industries, the dual laser-beam bilateral synchronous welding (DLBSW) technology is first proposed by Airbus company to partly substitute the riveting technology in the fuselage structures.5–7 The attractive welding method has demonstrated several advantages over the other connection process. As stated in Figure 1, the assembly speed of the process is dozens of times higher than that of the riveting.4,5 Furthermore, the DLBSW technology ensures the air tightness of the skin–stringer structure. Compared with the single-sided welding double-sided forming (SWDF) process, which is illustrated in Figure 2, the DLBSW provides the integrated outer skin surface and thus has received extensive attention in the application of structures where high aerodynamic shape integrity is asked.6,7 The DLBSW process requires the two laser beams to focus symmetrically on two opposite positions along the stringer for achieving a common molten pool and to move forward synchronously. Therefore, the strict control of the robot system and precise seam tracking system are necessary for the good joint quality.5,6 Up to the present day, the DLBSW technology has only been successfully applied to the lower fuselage areas of several types of aircraft produced by Airbus, such as Airbus A318, Airbus A340, Airbus 380, and so on, and proved to be a promising technology in terms of weight saving and efficiency improvement.8,9
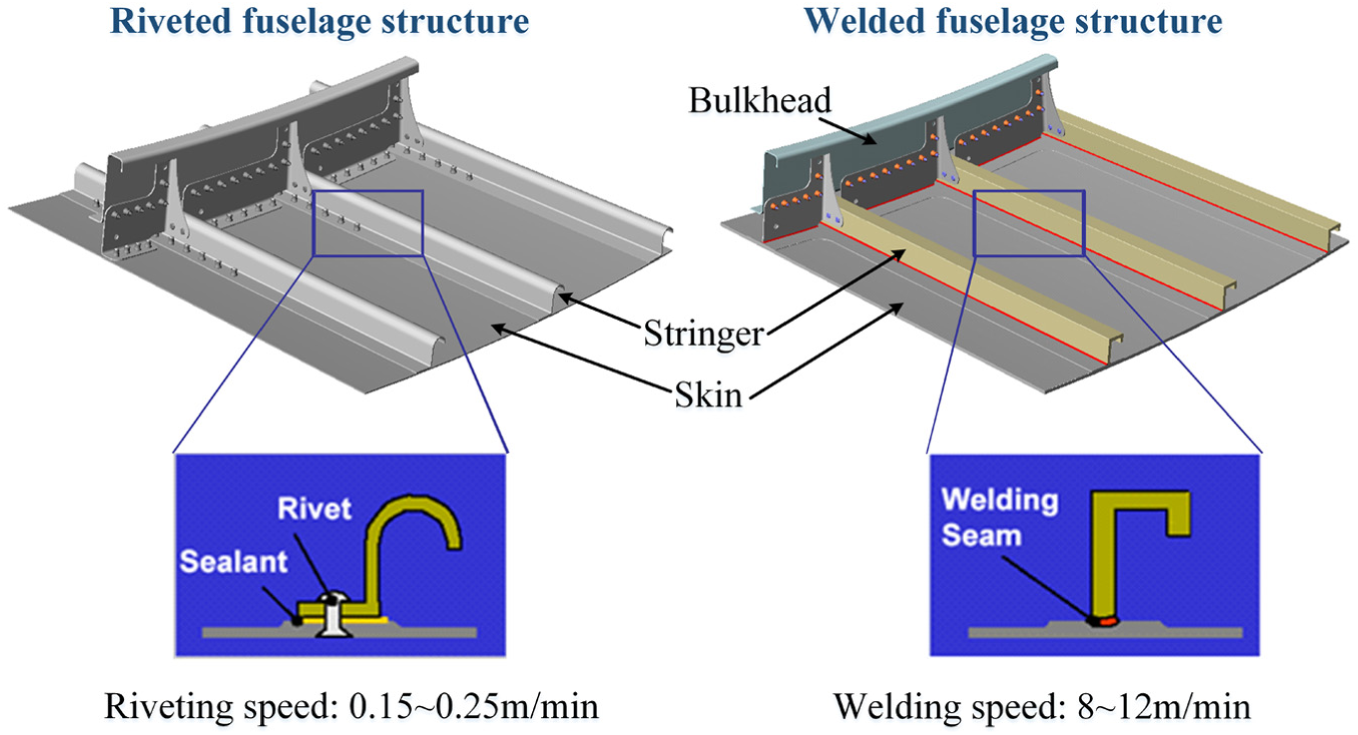
Comparison between riveted process and DLBSW process.
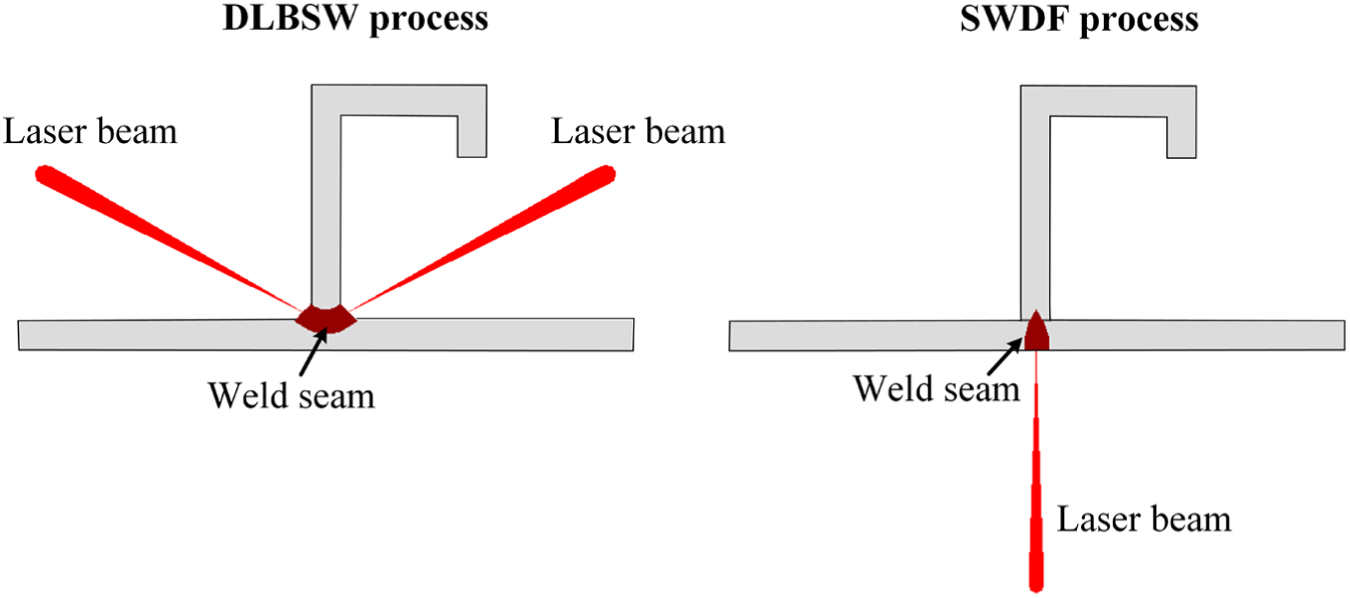
Comparison between DLBSW process and SWDF process.
In addition, due to its remarkable advantages such as low density, wonderful thermal stability, perfect corrosion resistance, high-specific strength, and specific stiffness, the Al-Li alloy is of significant interest for replacing traditional 2xxx and 7xxx series high-strength aluminum alloys in manufacturing of lightweight aerospace structure.10–12 Nevertheless, the reliability of the skin–stringer structure is recognized as a challenge owing to the unique characteristics of the welded Al-Li alloy, the control of DLBSW process, and the requirements of the civil aircraft industries.13–16 All the DLBSW research works of Al-Li alloy indicate that the welding defects, such as pore, crack, and joint softening, are inevitable and seriously compromising the mechanical properties of the joint. It is recognized that the joint quality and its mechanical tensile performance are dominated by the welding conditions. Squillace and Prisco 17 discussed the influence of different filler wires on the microstructure, the tensile, and the failure behaviors of the AA7475/PA765T-joint. The experimental results demonstrated that the two different joints exhibited the similar tensile strength and elongation at break in the hoop testing, while AA4047 joints showed more strength than AA5356 joints upon T-pull testing. Yang et al. 18 studied on the effects of incident beam position, incident beam angle, and beam separation distance on the weld properties of 1.8 mm thick AA6156-T6/AA6056-T4 aluminum alloys and obtained the optimal process parameters. He et al. 19 evaluated the microstructure, distribution of microhardness, and tensile strength of the Al-Li alloy T-joints under optimized parameters. Han et al. 20 investigated the effect of different filler wires on T-joint quality of 2060-2099 Al-Li alloy. It was found that the use of filler wire CW3, compared with using conventional wire AA4047, resulted in considerable improvements especially on intergranular strength, hot cracking susceptibility, and hoop tensile properties. Although a lot of research work has been done on the mechanical properties of Al-Li alloy T-joint, the fracture mechanism of the T-joint after tensile test is rarely investigated.
In the present work, the 2-mm thick 2060-2099 Al-Li alloy T-joint welded by DLBSW is studied. The weld quality is investigated through mechanical examinations as well as analyses of macro- and microstructures. What is more, a three-dimensional (3D) finite element (FE) model is built and the residual stress is simulated to clarify the stress state of the weldment and explain the tensile test result.
Experimental details
The 2.0-mm thick 2060-T8 Al-Li alloy laminated panel with the dimension of 500 mm × 125 mm and the 2.0-mm thick 2099-T83 Al-Li alloy extruded profile with the dimension of 650 mm × 28 mm are adopted for the skin and stringer component, respectively. The geometry structure of the T-joint is sketched in Figure 3(b). The filler wire used in the current study is ER4047 with the diameter of 1.2 mm, which contains high level of silicon and can effectively inhibit the crack defects. 21 The chemical compositions of the base metals (BMs) and filler wire are listed in Tables 1 and 2, respectively.
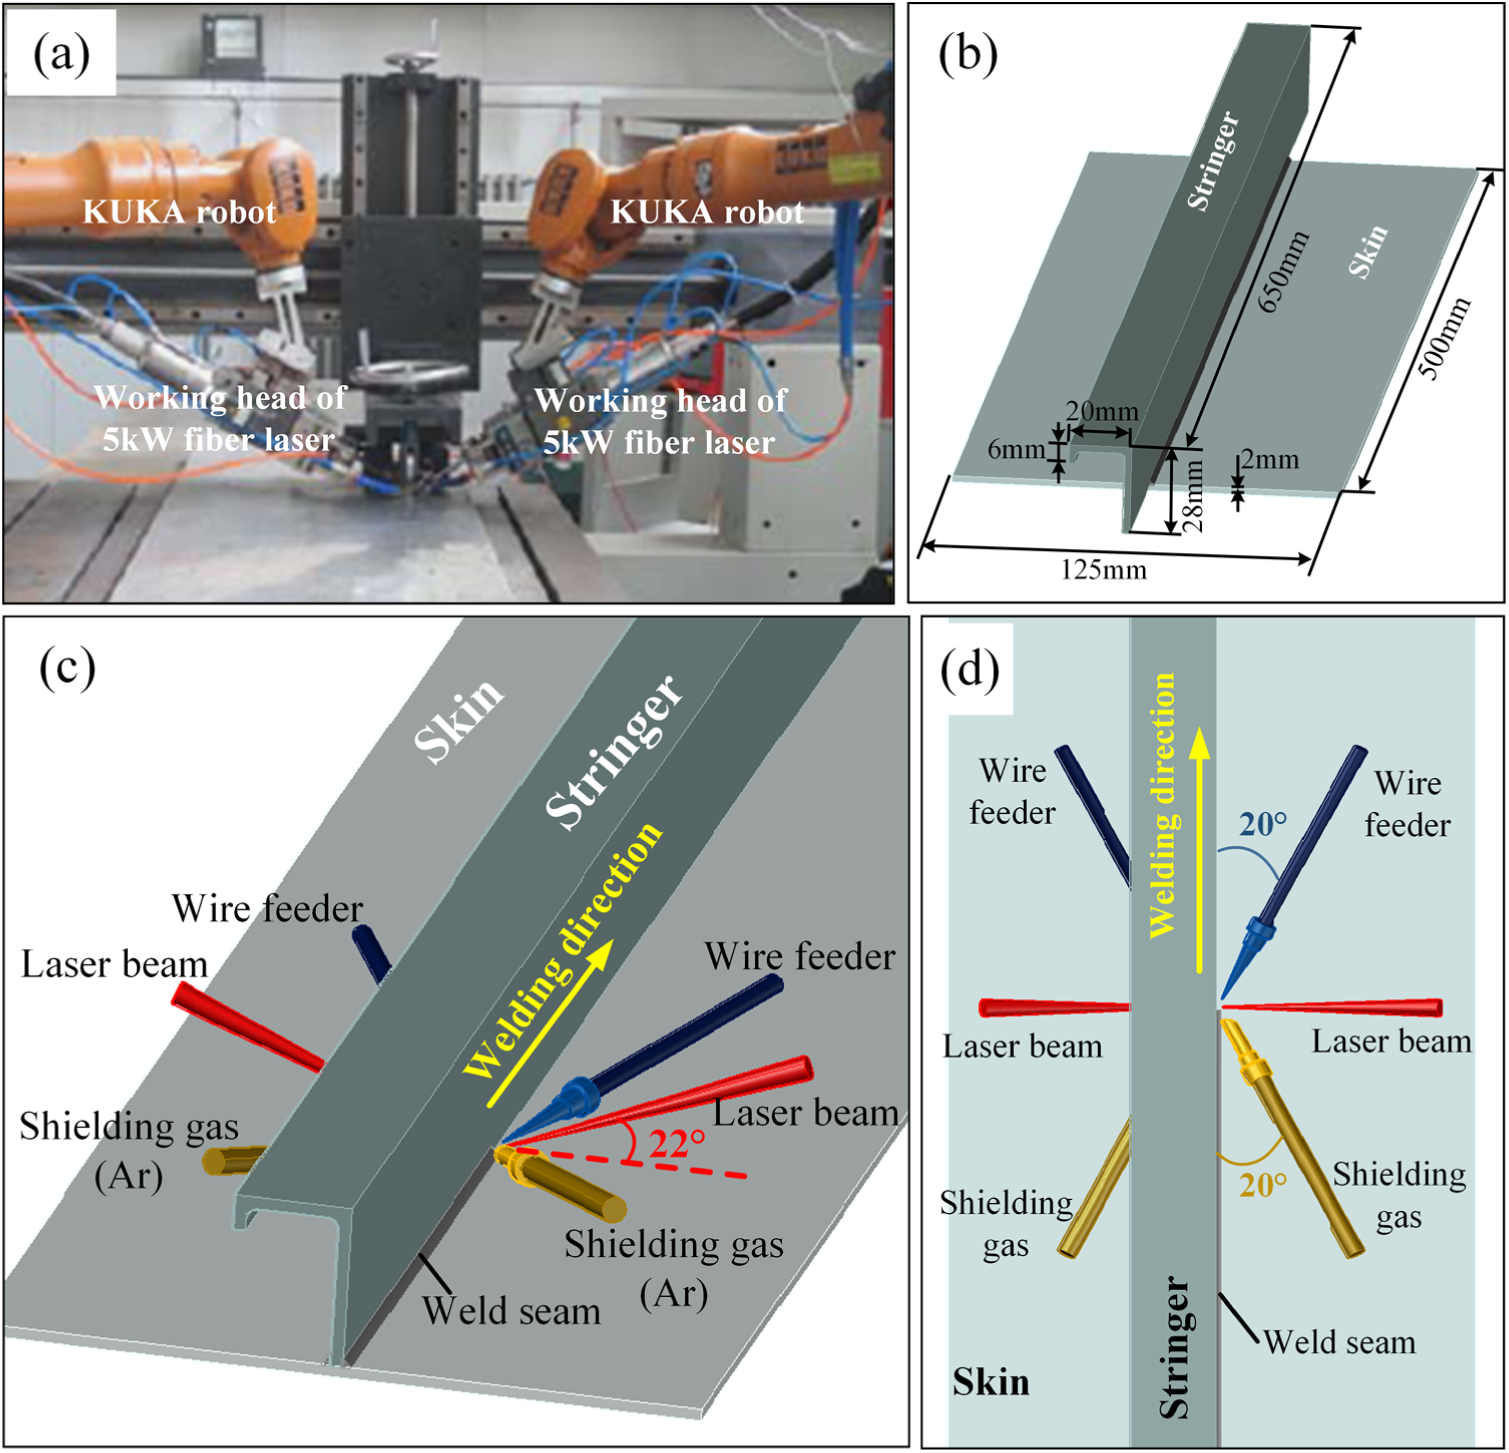
(a) Experimental equipment; (b) Geometry structure of T-joint; Schematic diagram of DLBSW: (c) axonometric view,(d) top view.
Chemical compositions of BMs (wt%).
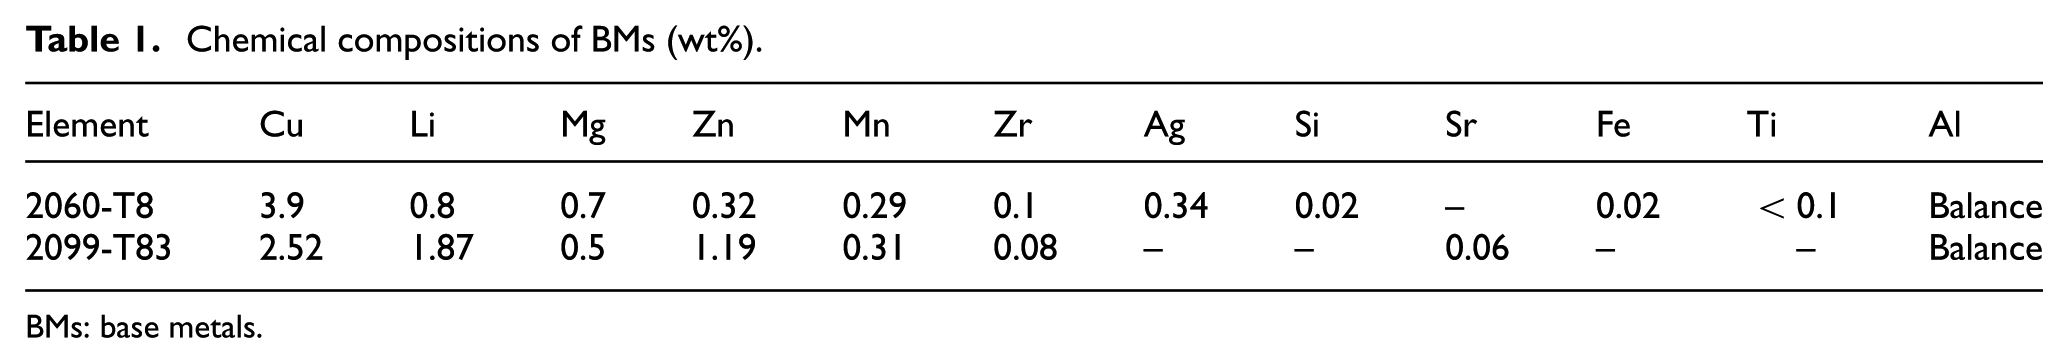
BMs: base metals.
Chemical compositions of filler wire (wt%).

The experiment is performed using a combiner of two fiber laser powers which have the rated power of 5 kW and have the type of YLS-5000. The two working heads for laser welding are clamped by the KUKA (Keller und Knappich Augsburg) robots, while adjusted their position depend on the six-axis linkage system of the robots. Two wire feeders with the type of KD-4010 are set on both sides of the stringer. And the argon gas with the flow rate of 15 L/min is used to protect the weld seam. During the welding process, the whole welding system is relatively static. The physical diagram of experimental equipment and schematic diagram of welding process are illustrated in Figure 3.
The process parameters, including laser power of 2.3 kW, welding velocity of 6.0 m/min, and wire feeding rate of 4.0 m/min, are employed for the welding experiment. The welded panel is machined into specimens for the metallographic observation and mechanical property test. The exact sampling locations and related dimensions are stated in Figure 4. Cross-sections from the welded joint, that is, specimen A1 and A2, are prepared for optical microscopy examination using standard metallographic procedures. As indicated in Figure 4(e), universal testing machine with the type of UTM5504GD is adopted for the mechanical property test of tensile specimens, that is, specimen B1–B3. The fractographic feature is observed using a scanning electron microscopy (SEM), while the elemental composition of the strengthening phase in dimples is characterized by energy dispersive X-ray spectroscopy (EDS).
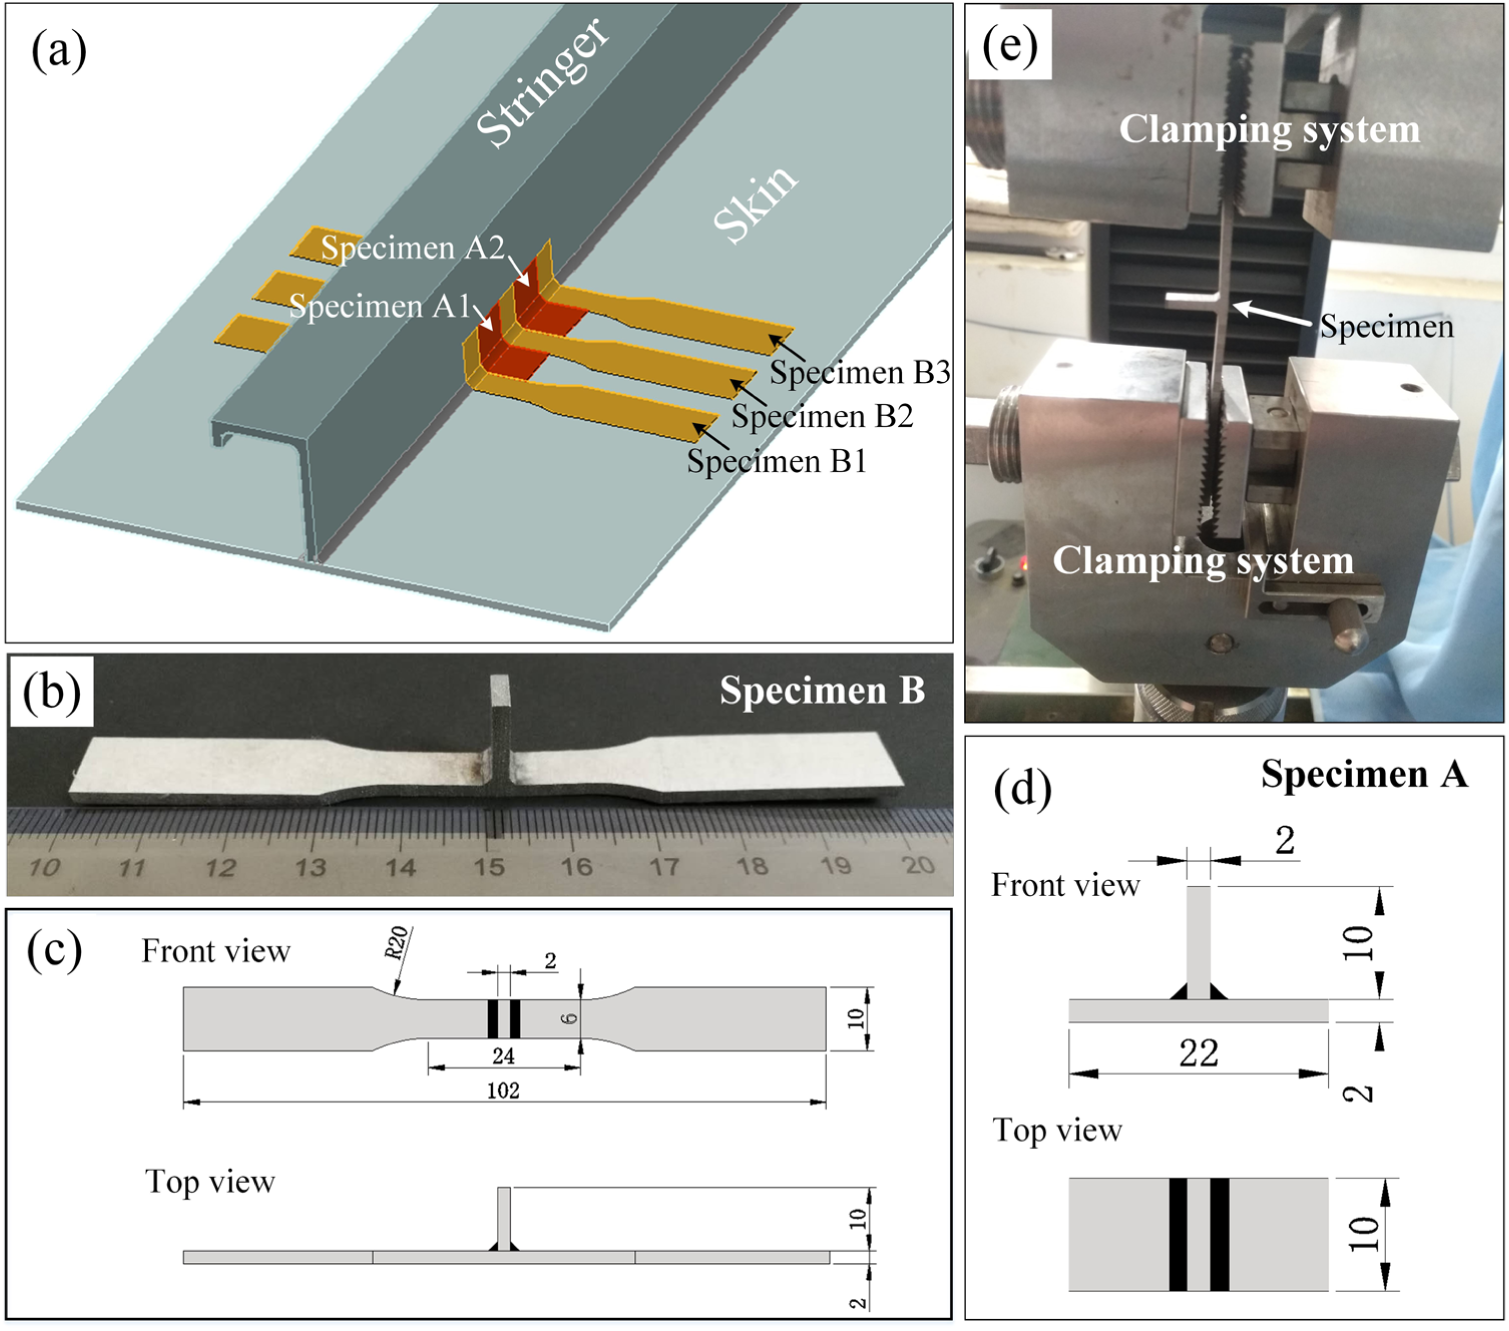
(a) Sampling locations of specimens, (b) physical diagram of specimen B, (c) dimensions of specimen B, (d) dimensions of specimen A, and (e) equipment of tensile test.
Model theory
The simulation results are greatly affected by the accuracy of the model. The 3D model in this study is built by software Pro E, while the DLBSW process is performed by a commercial FE software MSC Marc.
Mesh division of FEs
Accurate calculation result as well as high computational efficiency depend on the appropriate mesh division. The finer the mesh, the higher the calculation accuracy. However, if the calculation accuracy is over-considered, for the simulation of large components, the existing computer manufacturing technology may not be able to meet the calculation requirements. On the other hand, if the calculation efficiency is considered excessively, the element size of the weld seam must inevitably increase, which will lead to mesh distortion or simulation failure and then seriously affect the calculation results. Therefore, how to coordinate the simulation accuracy and efficiency to achieve the calculation requirements is the difficulty of meshing.
To obtain an accurate result as well as improve the simulation efficiency, FE mesh with spacing transition is adopted. The mesh details of the component are indicated in Figure 5. Hexahedral element which has small difference error is employed. The element size of weld seam is 0.45 mm × 0.45 mm × 1 mm, while the element size of the BM is 7.29 mm × 0.9 mm × 8.9 mm. The component is meshed into 51,520 solid elements and has 62,837 nodes.
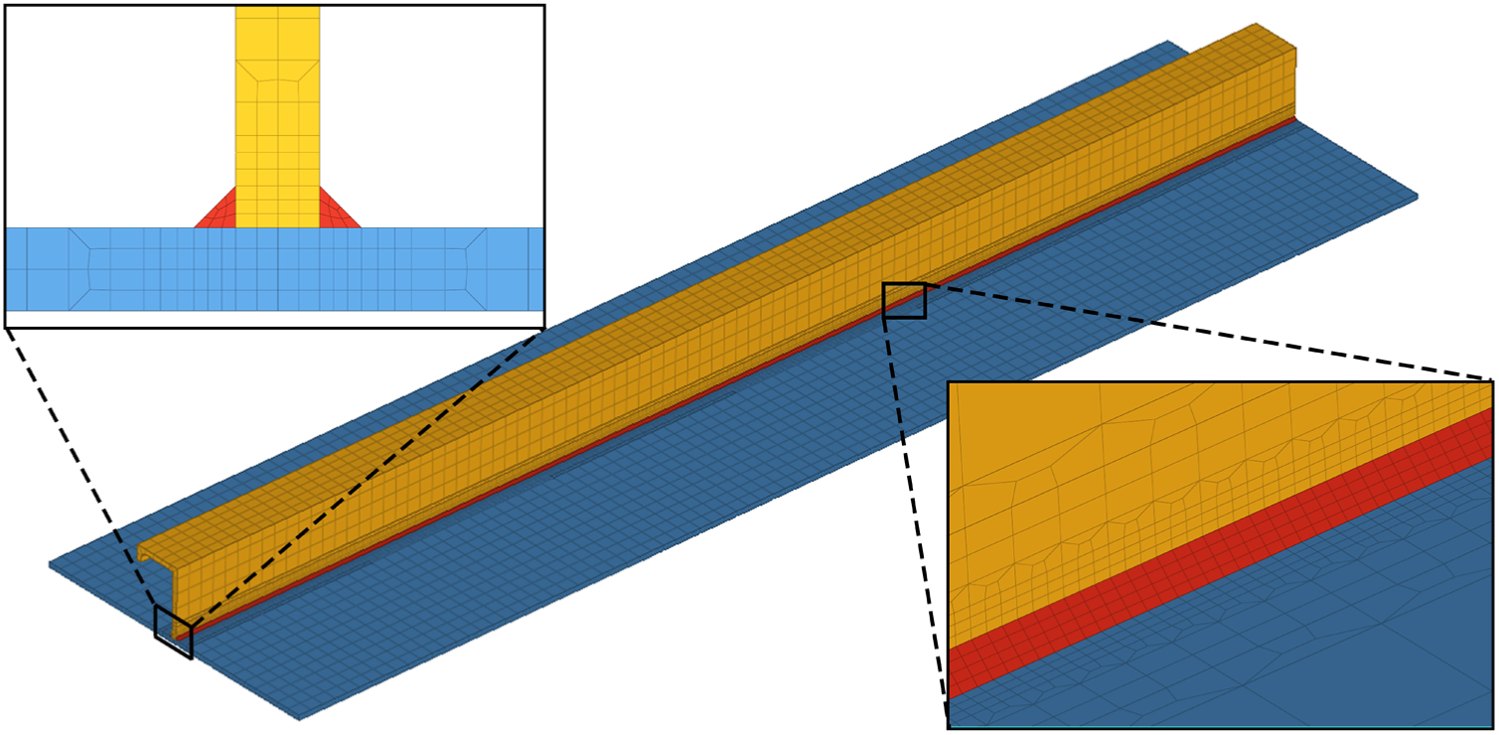
Mesh details of the component.
Material properties
The physical properties of Al-Li alloy 2060 and 2099 vary with temperature during the welding process. For the purpose of an accurate simulation result, material properties including Young’s modulus, yield strength, thermal expansion coefficient, and thermal conductivity of the two base materials at different temperatures, as illustrated in Figure 6, are simulated by the JMatPro software. As for the aluminum alloy welded structure, however, the mechanical behavior of the weld metal is always worse than that of the base material. Therefore, in order to improve the accuracy of the calculation, it is assumed that the material properties of the filler metal possess the same value as that of the 2060 BM, whose mechanical properties are relatively poor.
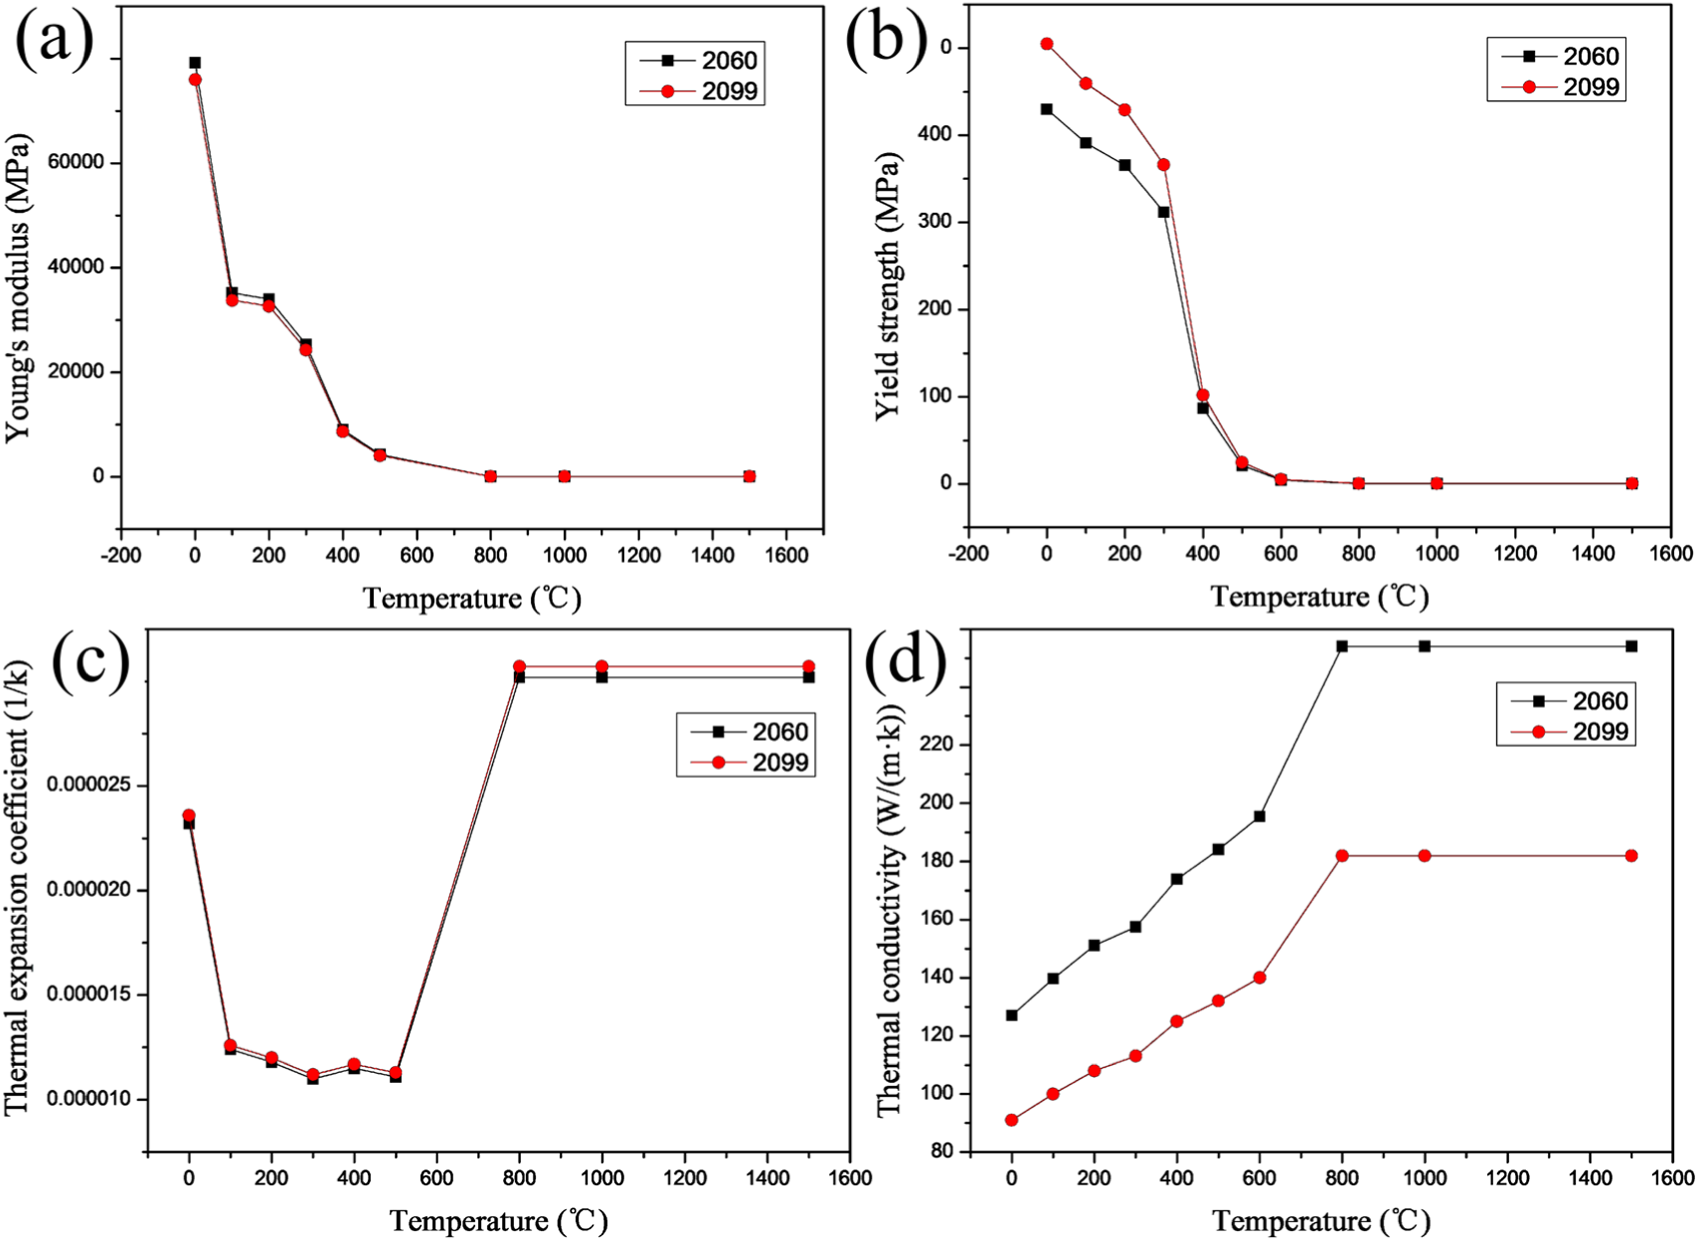
Physical properties of Al-Li alloy 2060 and 2099: (a) Young’s modulus, (b) yield strength, (c) thermal expansion coefficient, and (d) thermal conductivity.
Boundary condition
Numerical simulations of the welding process focus on the analysis of transient changes. 22 During the laser welding process, dramatic physical and chemical reactions occur between the molten pool, laser, and air. Accordingly, it is necessary to simplify the welding conditions in the FE analysis, and those factors that have weak influence on the welding process should be weakened or even ignored. The initial temperature is assumed to be 25 °C, which is similar to the ambient temperature. The boundary heat radiation is ignored, for the purpose of simplifying the calculation, and only the thermal convection condition is considered. The thermal boundary conditions are shown as follows
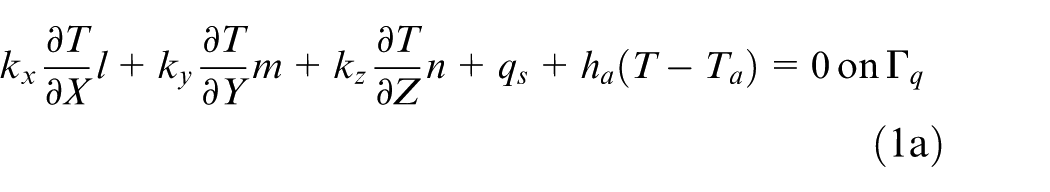

where l, m, and n are direction cosines; ha is the heat transfer coefficient; T a is the ambient temperature; and q is the boundary heat flux. The initial condition for welding is T = T a at t = 0.0.
Heat source model
Combined heat source model, consisting of a Gaussian surface heat source and a Gaussian rotating body heat source, is adopted in this study.23,24 The heat source model is exhibited in Figure 7 and can be expressed as equation (2)
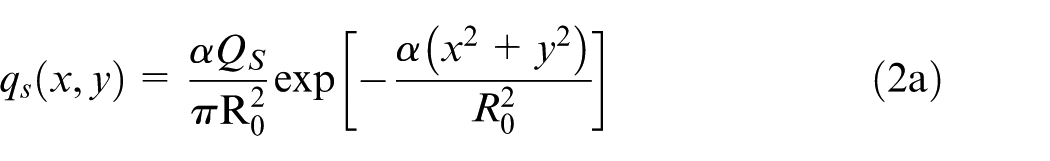
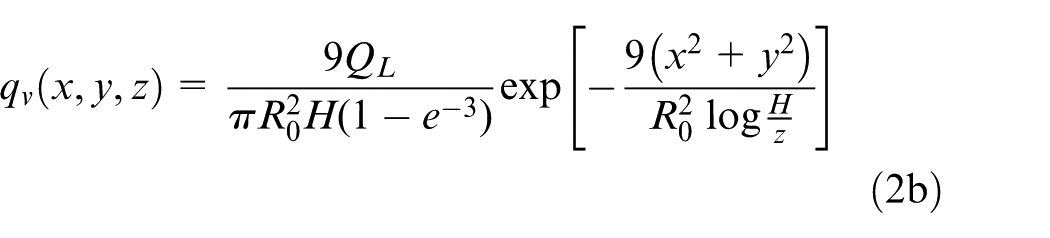

where qs and qv are the heat flux distribution of Gaussian surface heat source and Gaussian body heat source, respectively. Qs and Qv are the effective powers of Gaussian surface heat source and Gaussian body heat source, respectively. QL is the power of the laser beam, α is the concentration coefficient of the surface heat source, R0 is the effective radius of the heat source, H is the depth of the heat source, and η is the effective absorption coefficient of the heat source.
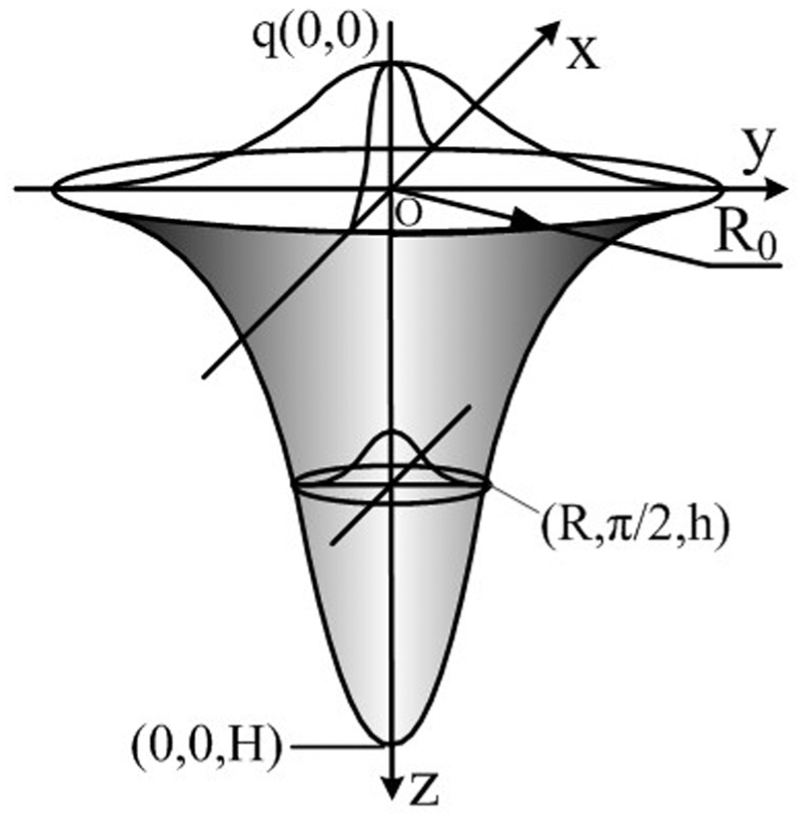
Combined heat source model.
Thermo-elastoplastic model
The transient heat transfer during DLBSW process is expressed as follows25,26
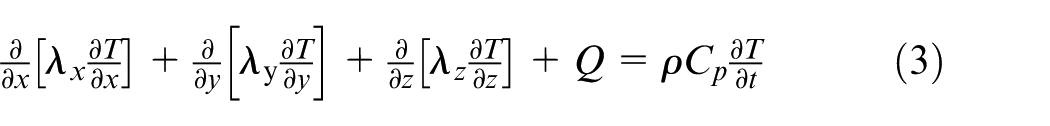
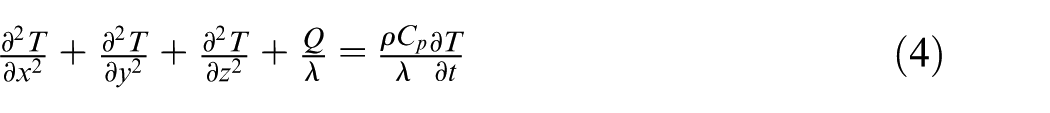
where λi (i = x, y, z) is the thermal conductivity along the x, y, and z directions, respectively. Q is the heat generated during the welding process, ρ is the density of the material, and Cρ is the specific heat.
Assuming the BMs are isotropic, the thermal conductivity in all directions is approximately equal; equation (3) can be simplified to equation (4)
The stress–strain relationship of the material in the elastic or plastic state is given by equation (5)

where
The equilibrium equation, as shown in equation (6), is obeyed by all elements in the component

where
where [B] is the matrix connecting the strain in element and nodal displacement vector.
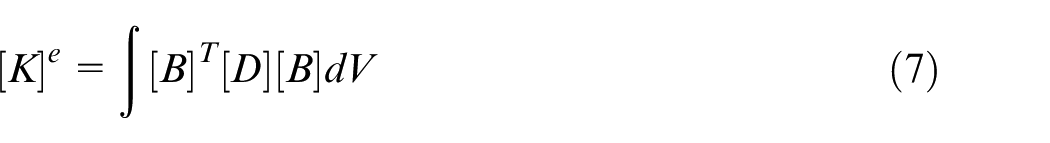
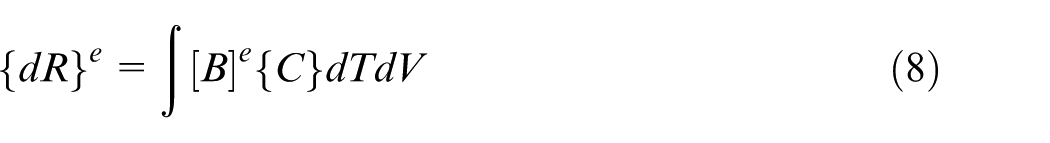
According to the element in the elastic or plastic zone, [D] e and {C} e are used instead of [D] and {C} in the above formula, respectively, to obtain the element stiffness matrix and the equivalent node load. Then integrate the total stiffness matrix [K] with the total load vector {C}, obtaining the equilibrium equations for the entire component

where
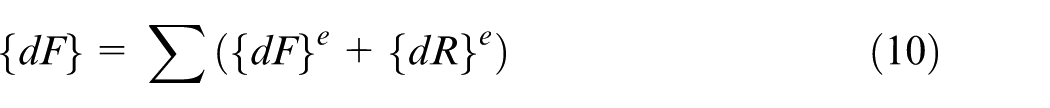
Considering that no external force acted in the welding system during the welding process, the corresponding nodal forces around each node are in the self-balancing force systems, that is,
In order to solve the thermal elastic–plastic FE model, the component is first divided into a finite number of units. Then the temperature increment is gradually added on them. The unique increment of each node

According to the stress–strain relation of equation (5), the increment of stress in each element can be obtained. So the dynamic stress–strain evolution, the final residual stress, and deformation state during the welding process can be understood.
Experimental results
Macro- and microstructure of the welded joint
Explanatorily, the macroscopic morphology and cross section of the weld seam are shown in the Fig. 8. On the macroscopic scale, the welded joint reveals good formability containing neither obvious crack nor undercut under the tailored process conditions, as could be seen in Fig.8 (c)(d). From Fig. 8 (b), The common molten pool is achieved. The weld width and weld penetration depth, measured by electronic Vernier caliper, are 4.4 and 0.88 mm, respectively. The measurement of the seam angle θ is 44°.
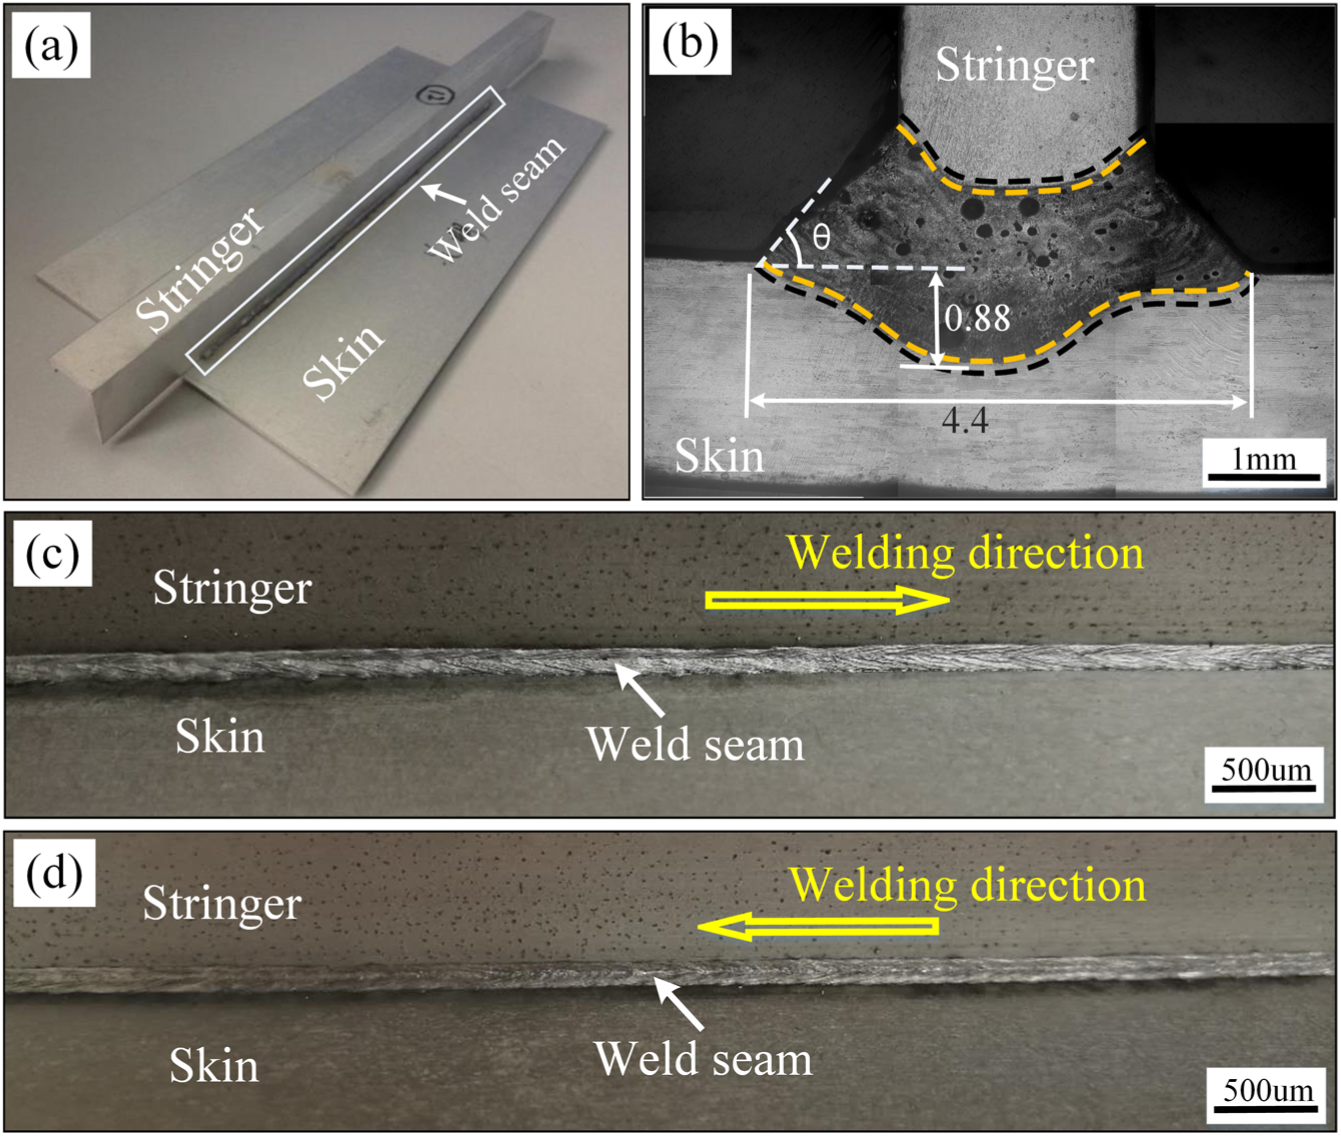
(a) Physical map of the weldment; (b) Macroscopic morphology of weld cross-section; Macroscopic morphology of weld seam: (c) right side of welding direction; (d) left side of welding direction.
The typical microstructure of T-joint fabricated by DLBSW is indicated in Figure 9. It can be seen from Fig. 9 (d) that three distinct regions are observed in the welded joint, that is, BM, heat-affected zone (HAZ), and fusion zone (FZ). As stated in Fig. 9(c), the skin BM is composed of laminated grains with obvious rolling characteristics. Adjacent to the BM is the HAZ, whose width is directly related to the energy density of the heat input. Because of the extremely high energy density of the laser beam during welding process, the HAZ is narrow and can even be considered as none. As shown in Fig. 9 (d)-(h), grain morphologies of FZ from the fusion line to the weld center are fine equiaxed grain zone (EQZ), columnar dendrites, and equiaxed dendrites in turn. The EQZ, which exists between the zone of columnar dendrites and the HAZ, is the unique microstructure of Al-Li alloy welds. Lippold and colleagues27,28 had suggested that the formation of EQZ was due to the heterogeneous nucleation of Al3Zr and Al3 (Li x , Zr1–x) particles from BM.
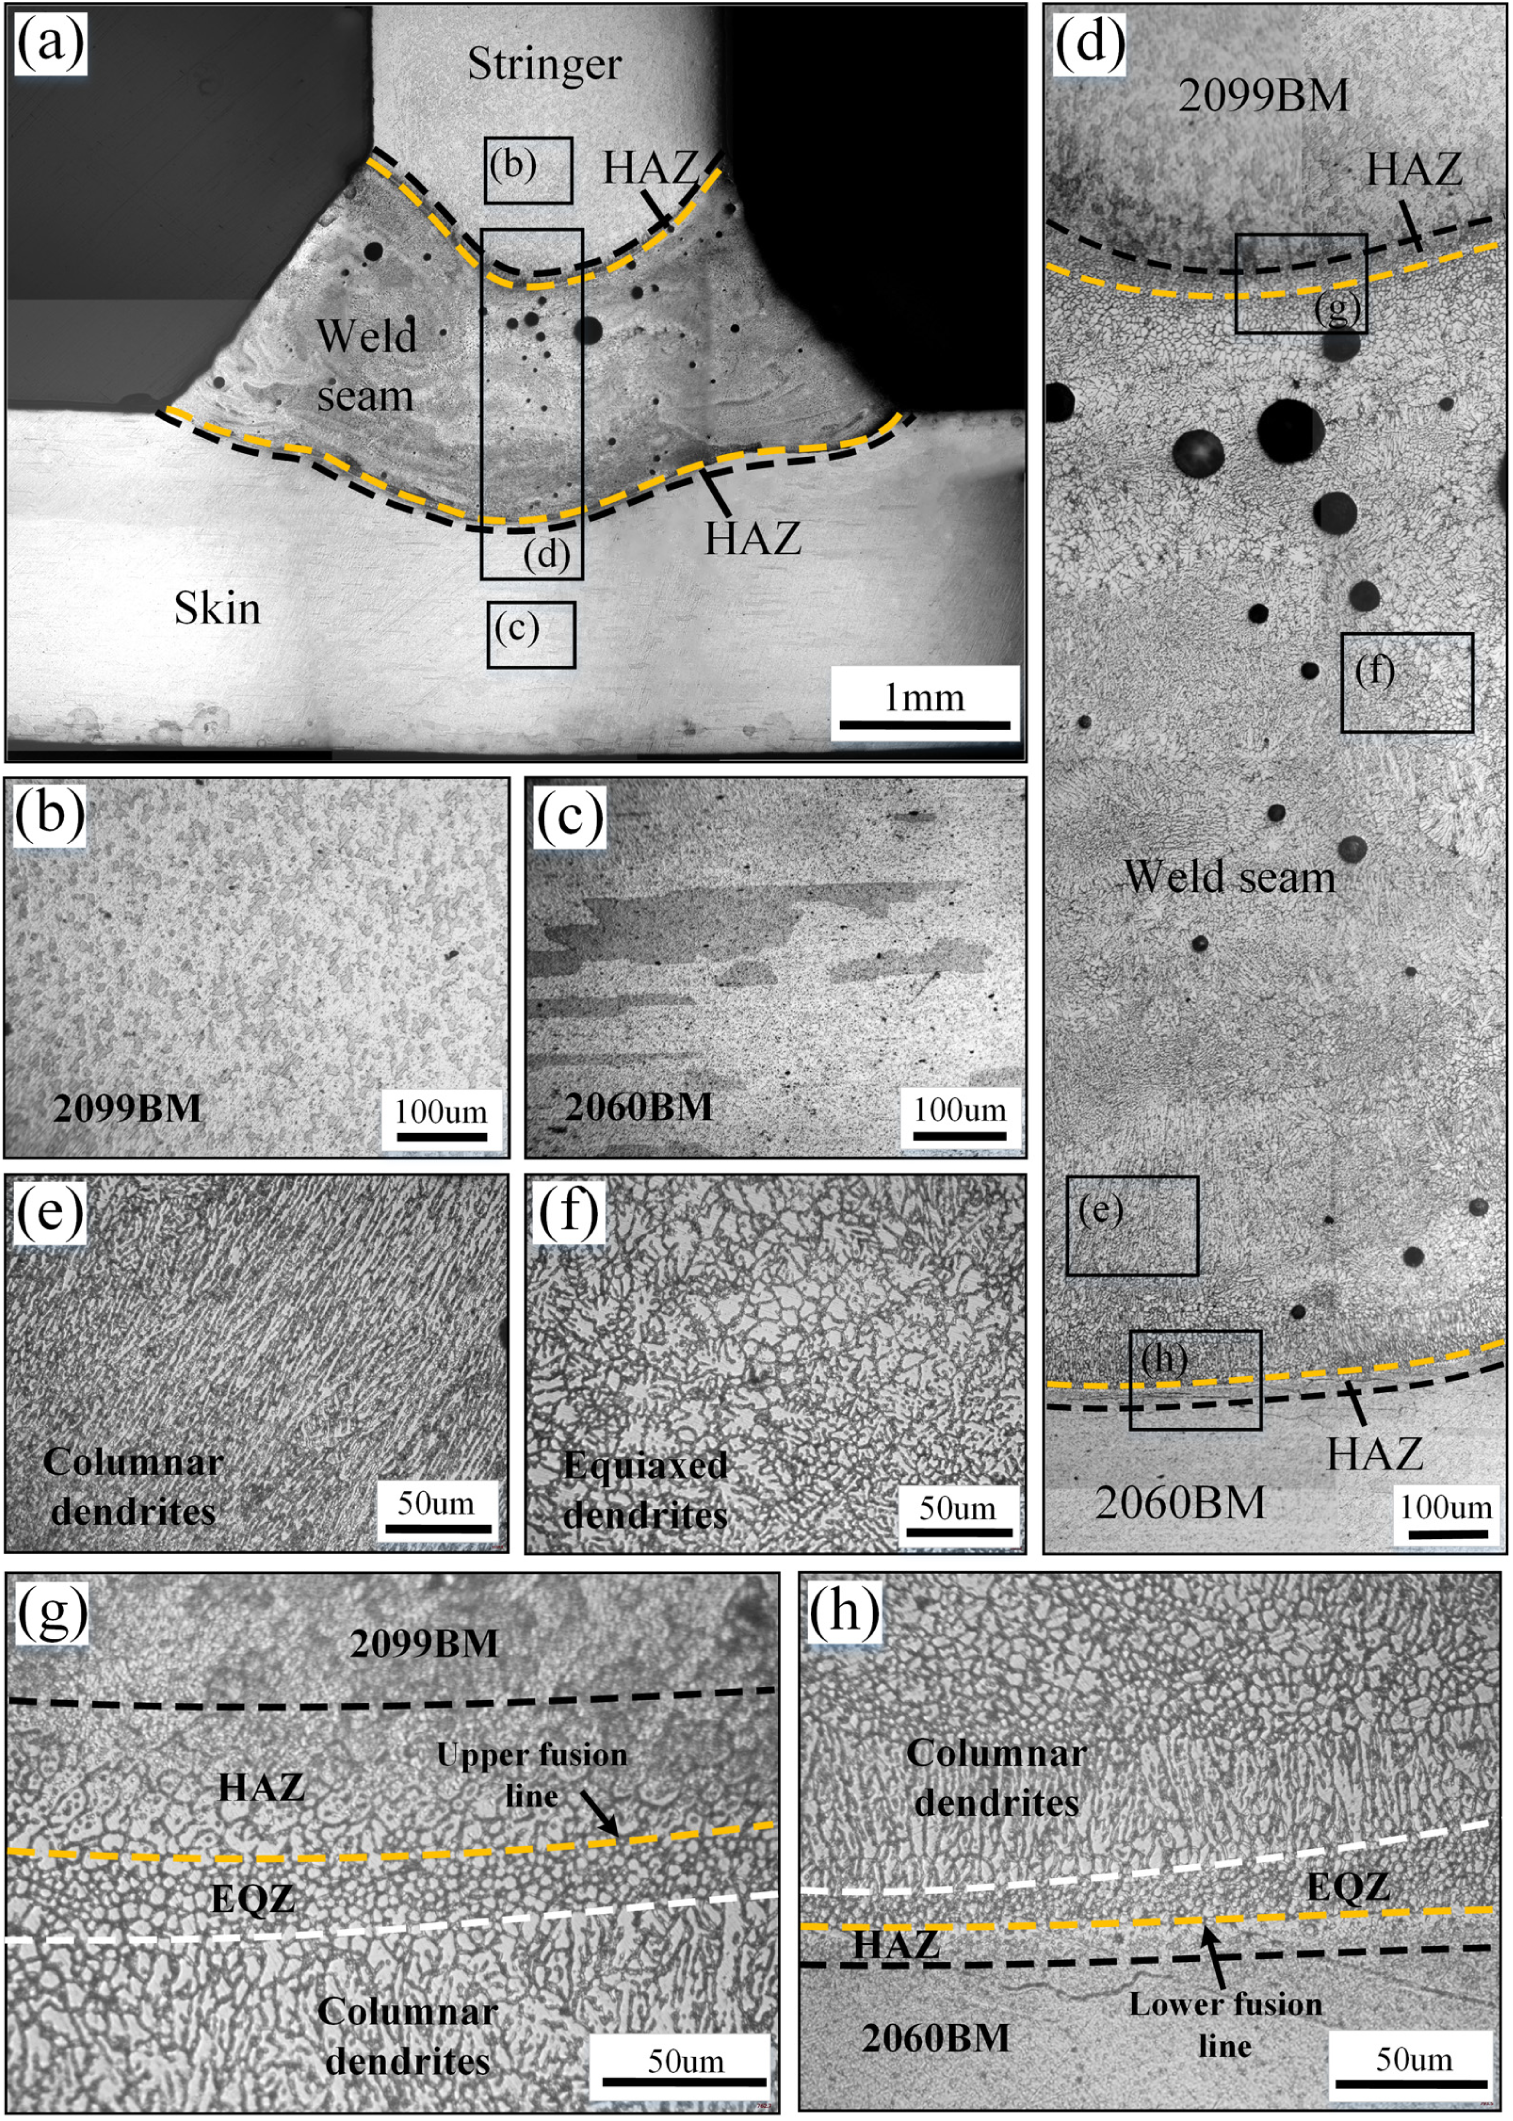
Typical microstructure of Al-Li alloy T-joint produced by DLBSW: (a) weld cross-section; (b) 2099 Al-Li alloy base metal; (c) 2060 Al-Li alloy base metal; (d) local microstructure of welded joint; (e) columnar dendrites; (f) equiaxed dendrites; (g) microstructure near the upper fusion line; (h) microstructure near the lower fusion line.
It is attributed to the characteristic of the alloy and laser welding process that defects such as pores and cracks are inevitable to produce in the Al-Li alloy welds. These defects lead to stress concentration during the loading of weldment and reduce the fatigue life of welded structure. Figure 10 displays several kinds of defects observed in the weld seam. It is evident that the most significant welding defects in Al-Li alloy T-joint are pore defects, especially the hydrogen pores.
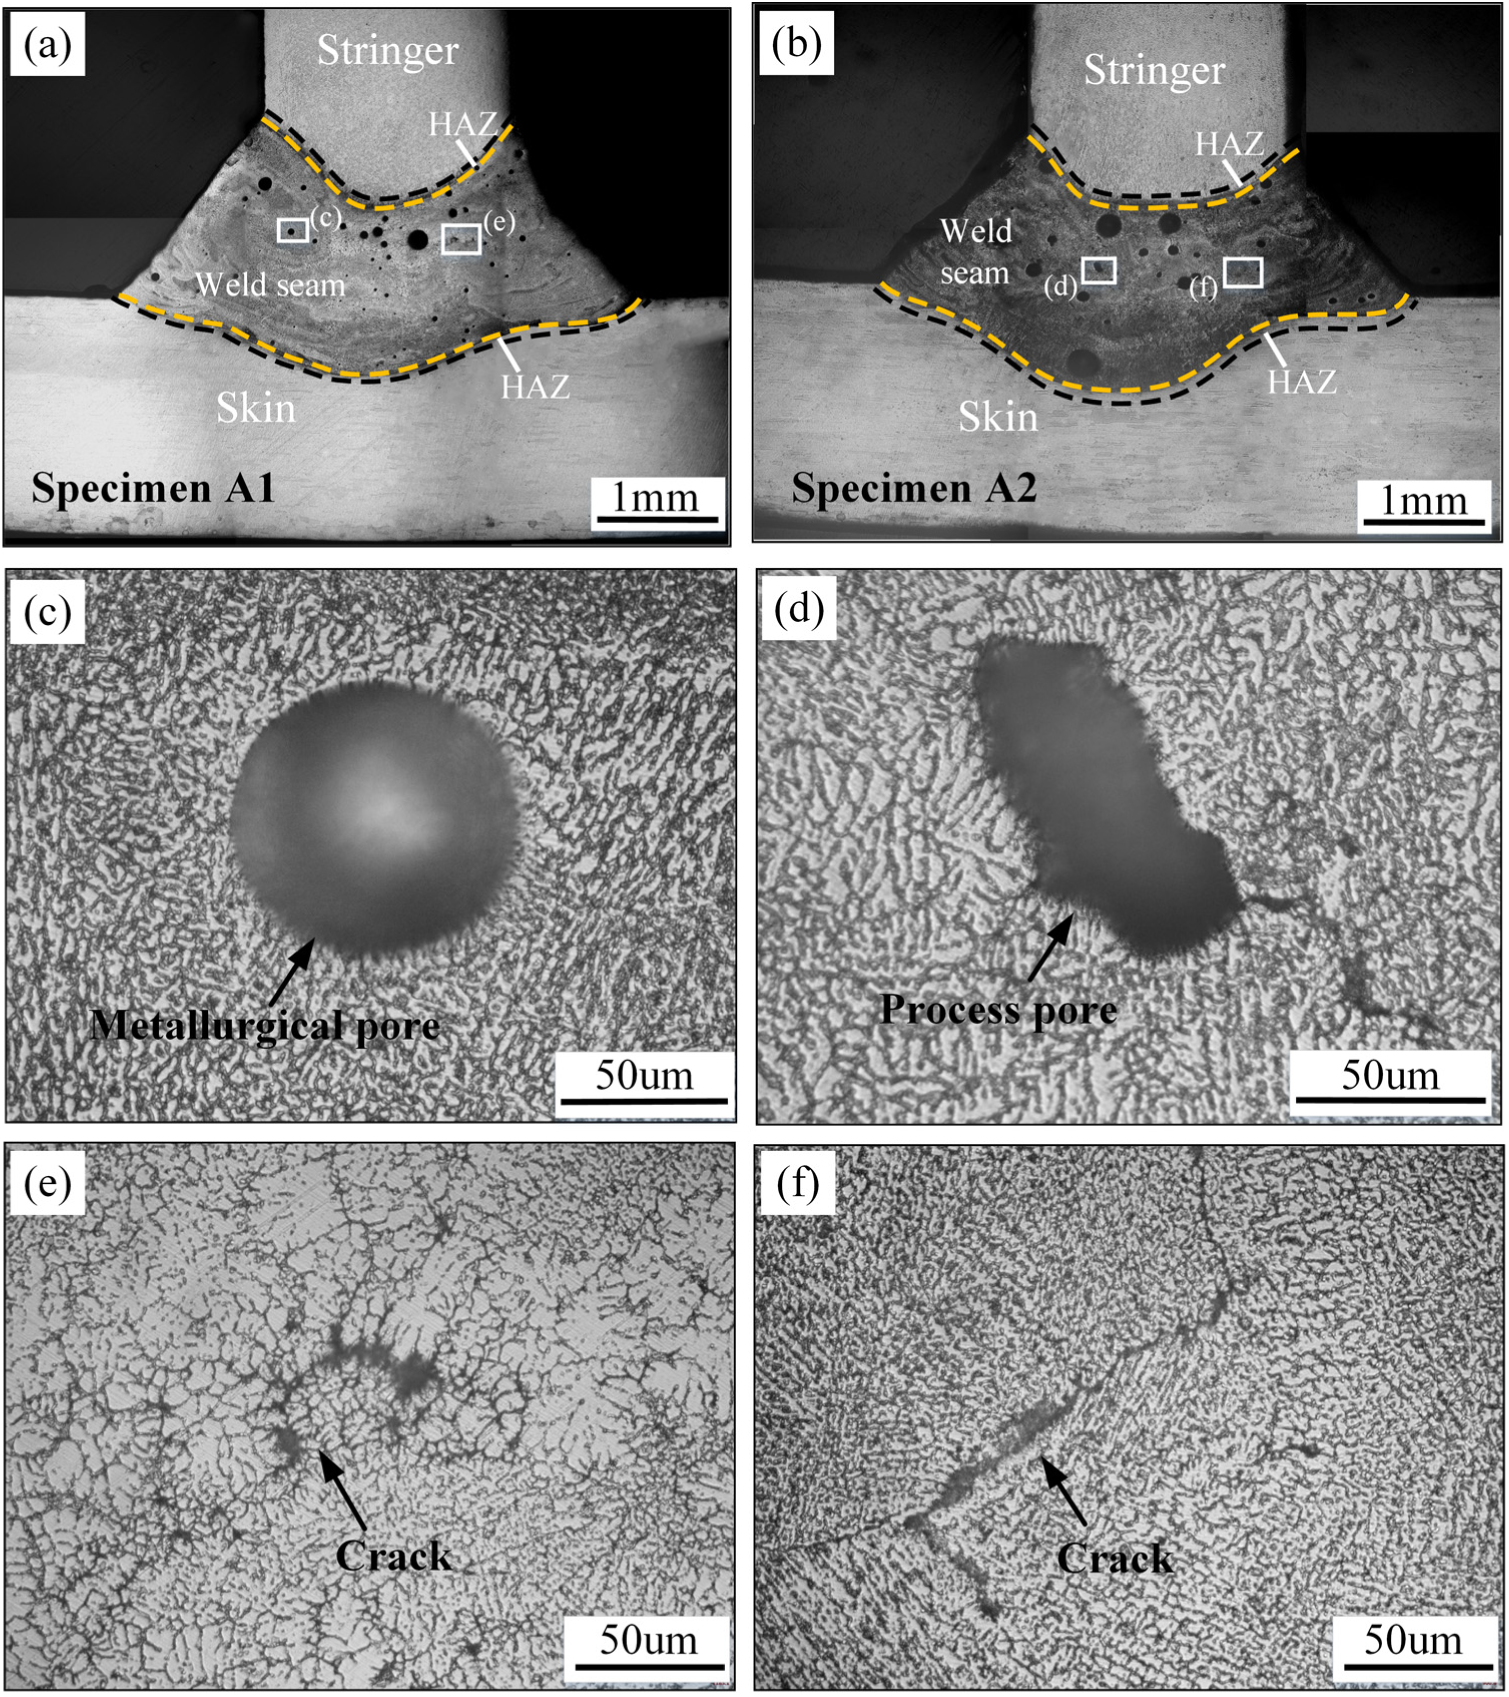
Macroscopic morphology of weld cross-section: (a) specimen A; (b) specimen B; Defects in Al-Li alloy T-joint produced by DLBSW: (c) metallurgical pore; (d) process pore; (e) (f) solidification crack.
Welding pores are generally divided into two types, that is, metallurgical pores and process pores. The metallurgical pore is shown in Figure 10(c), whose formation is related to the hydrogen. Surface active element such as Li and Mg is enriched on the surface of the Al-Li alloy, forming a thick oxide film which adsorbs moisture in the surrounding environment easily. During the welding process, hydrogen existed in oxide film enters the molten pool. The absorbed hydrogen nucleates and grows to form bubbles during the cooling process because of the sharp decrease in solubility of hydrogen. Some bubbles do not have enough time to escape and then entrap in the weld seam to become the metallurgical pore. Figure 10(d) reveals a process pore, the formation of which is due to the collapse of keyhole. The keyhole is at an angle to the aluminum alloy sheet during the DLBSW process, resulting in the production of process pores more common in T-joint.
Furthermore, Al-Li alloy is the typical eutectic alloy. The addition of Li increases the solidification temperature range and linear expansion coefficient of the alloy, making cracks problem even more prominent. Fig. 10 (e) and (f) exhibit the typical solidification crack defects in the weld center. In practice, the laser welding process is a process of rapid heating and cooling. At the end of molten pool solidification, the crystals form a dendritic framework, the existence of which prevents the free flow of interdendritic residual liquid and causes initiation of tiny cracks under tensile stress. This situation is particularly prominent in the region of coarse equiaxed dendrites.
Mechanical properties
For this part, the Vickers microhardness, tensile strength, and the fracture morphology of the resultant 2060-2099 Al-Li alloy T-joint are measured and analyzed. Figure 11 shows the microhardness distribution across the weld seam. The applied load selected for the microhardness measurement is 100 g while the dwell time is 15 s. The spacing between measuring points is 0.1 mm. Almost the same microhardness value exists in the skin and stringer base materials. It is evident that the microhardness of the weld seam and HAZ are lower than that of the BMs. The average microhardness of weld seam is calculated to be 90 HV. Besides, the lowest microhardness is found in the upper part of the weld seam, since the welding defects are concentrated there.
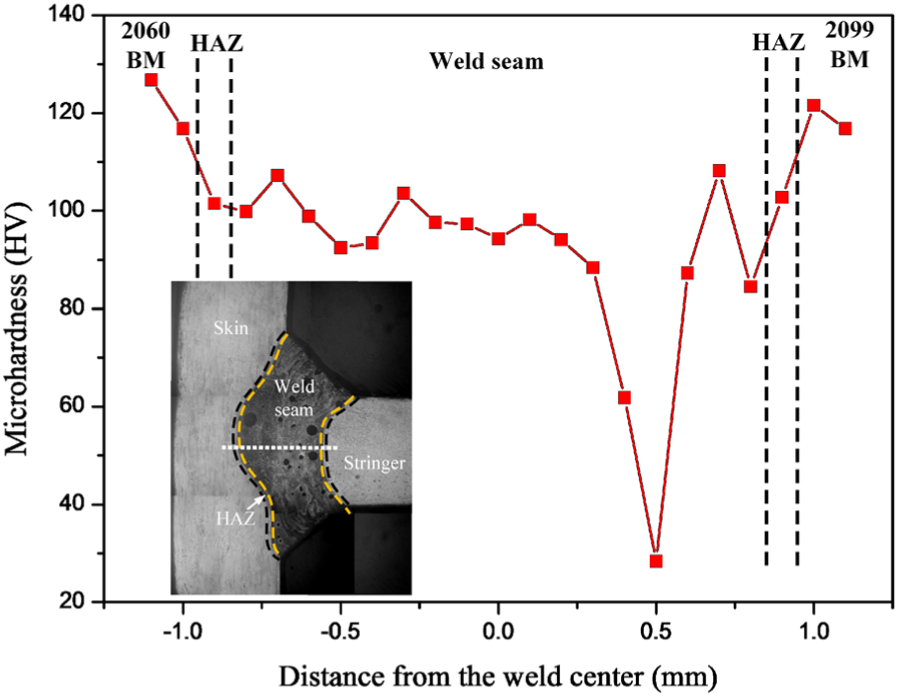
Microhardness distribution across the weld seam of T-joint.
The aircraft panels are loaded in all directions during the flight. Therefore, it is necessary to investigate the tensile properties of T-joint. Fractured specimens from the hoop tensile test are illustrated in Figure 12. All the specimens fractured along the fusion line up to the deepest point of weld seam and then cracked through the BM.
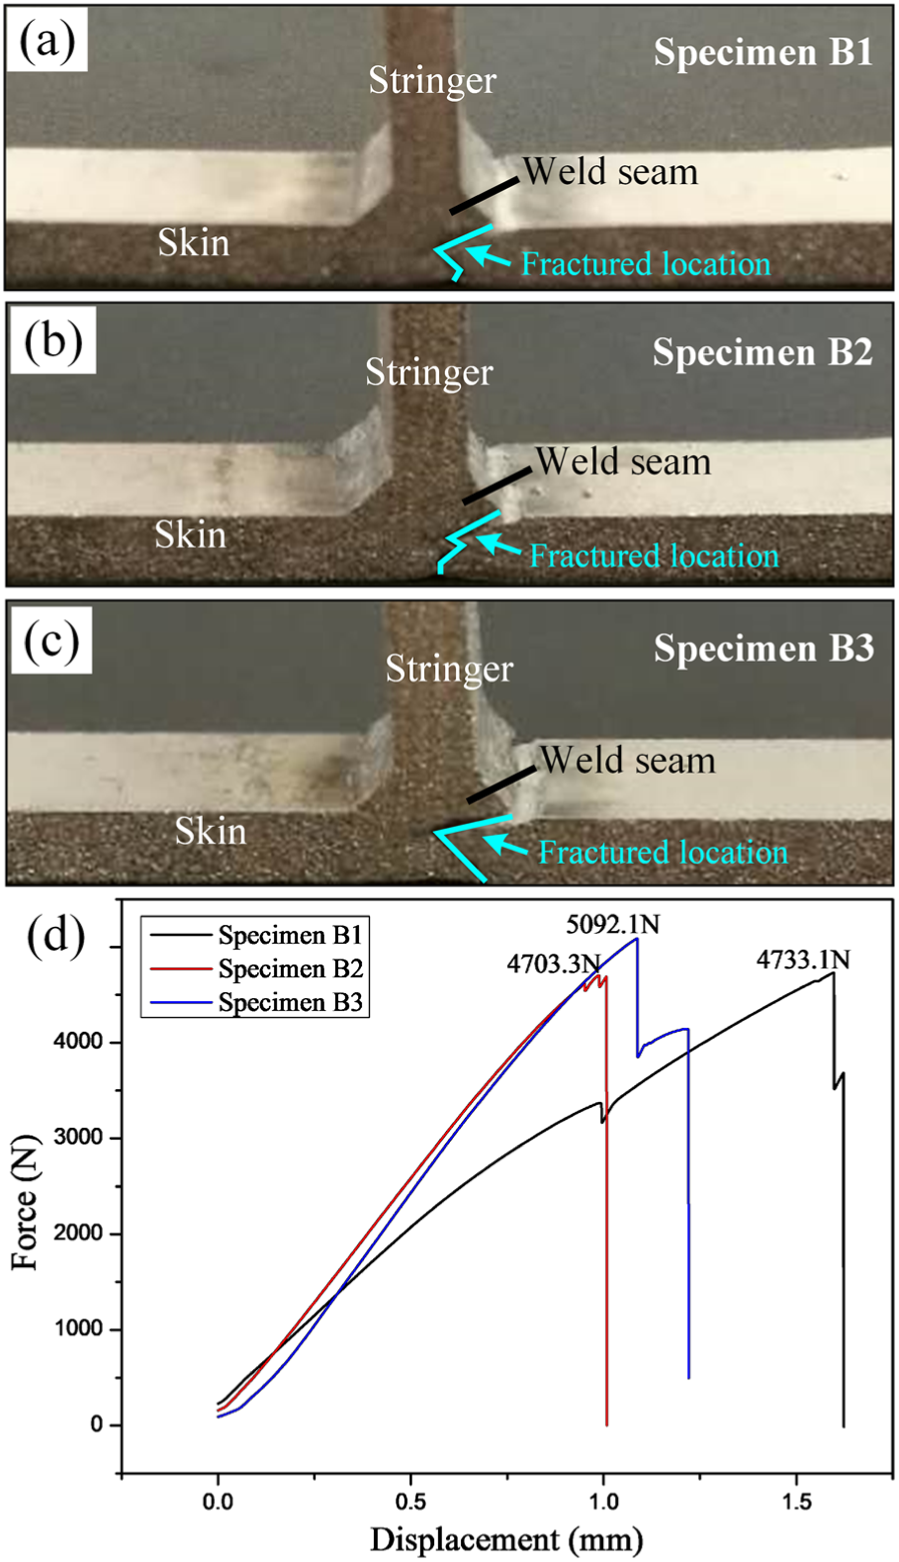
(a)–(c) Fractured samples from hoop tensile test and (d) force–displacement curves.
It can be concluded from the force–displacement curves that the tensile strength for the three specimens are 394.425, 391.942, and 424.342 MPa, respectively. Compared with the average tensile strength (501.4 MPa) of skin material, properties of T-joints are decreased. As could be seen, the joint tensile strength can reach up to 85% of the skin material strength.
Analysis and discussion
In order to validate the established heat source model, the simulated temperature field is compared with the experimental result. The comparison result is presented in Figure 13. The area with temperature higher than 650 °C is assumed to be the molten pool and set to gray. It can be seen that the simulated result is in good agreement with the experimental result. Accordingly, the characteristic of the molten pool produced by DLBSW is exactly simulated by the model built in this study.
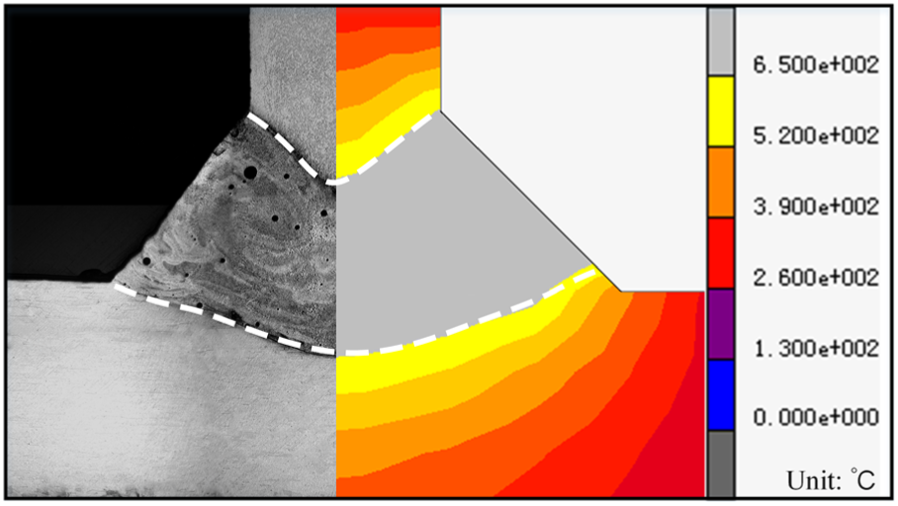
Comparison between simulated temperature field and experimental result.
Furthermore, considerable residual stress, due to the highly concentrated instantaneous heat input, exists in the welded structure after welding process and does harm to the welding quality. The analysis on weldment residual stress is conductive to the understanding of joint mechanical properties. Based on the FE model and validated heat source model, the stress–strain field model is built and the simulation result is shown in Figure 14(a) and (b).
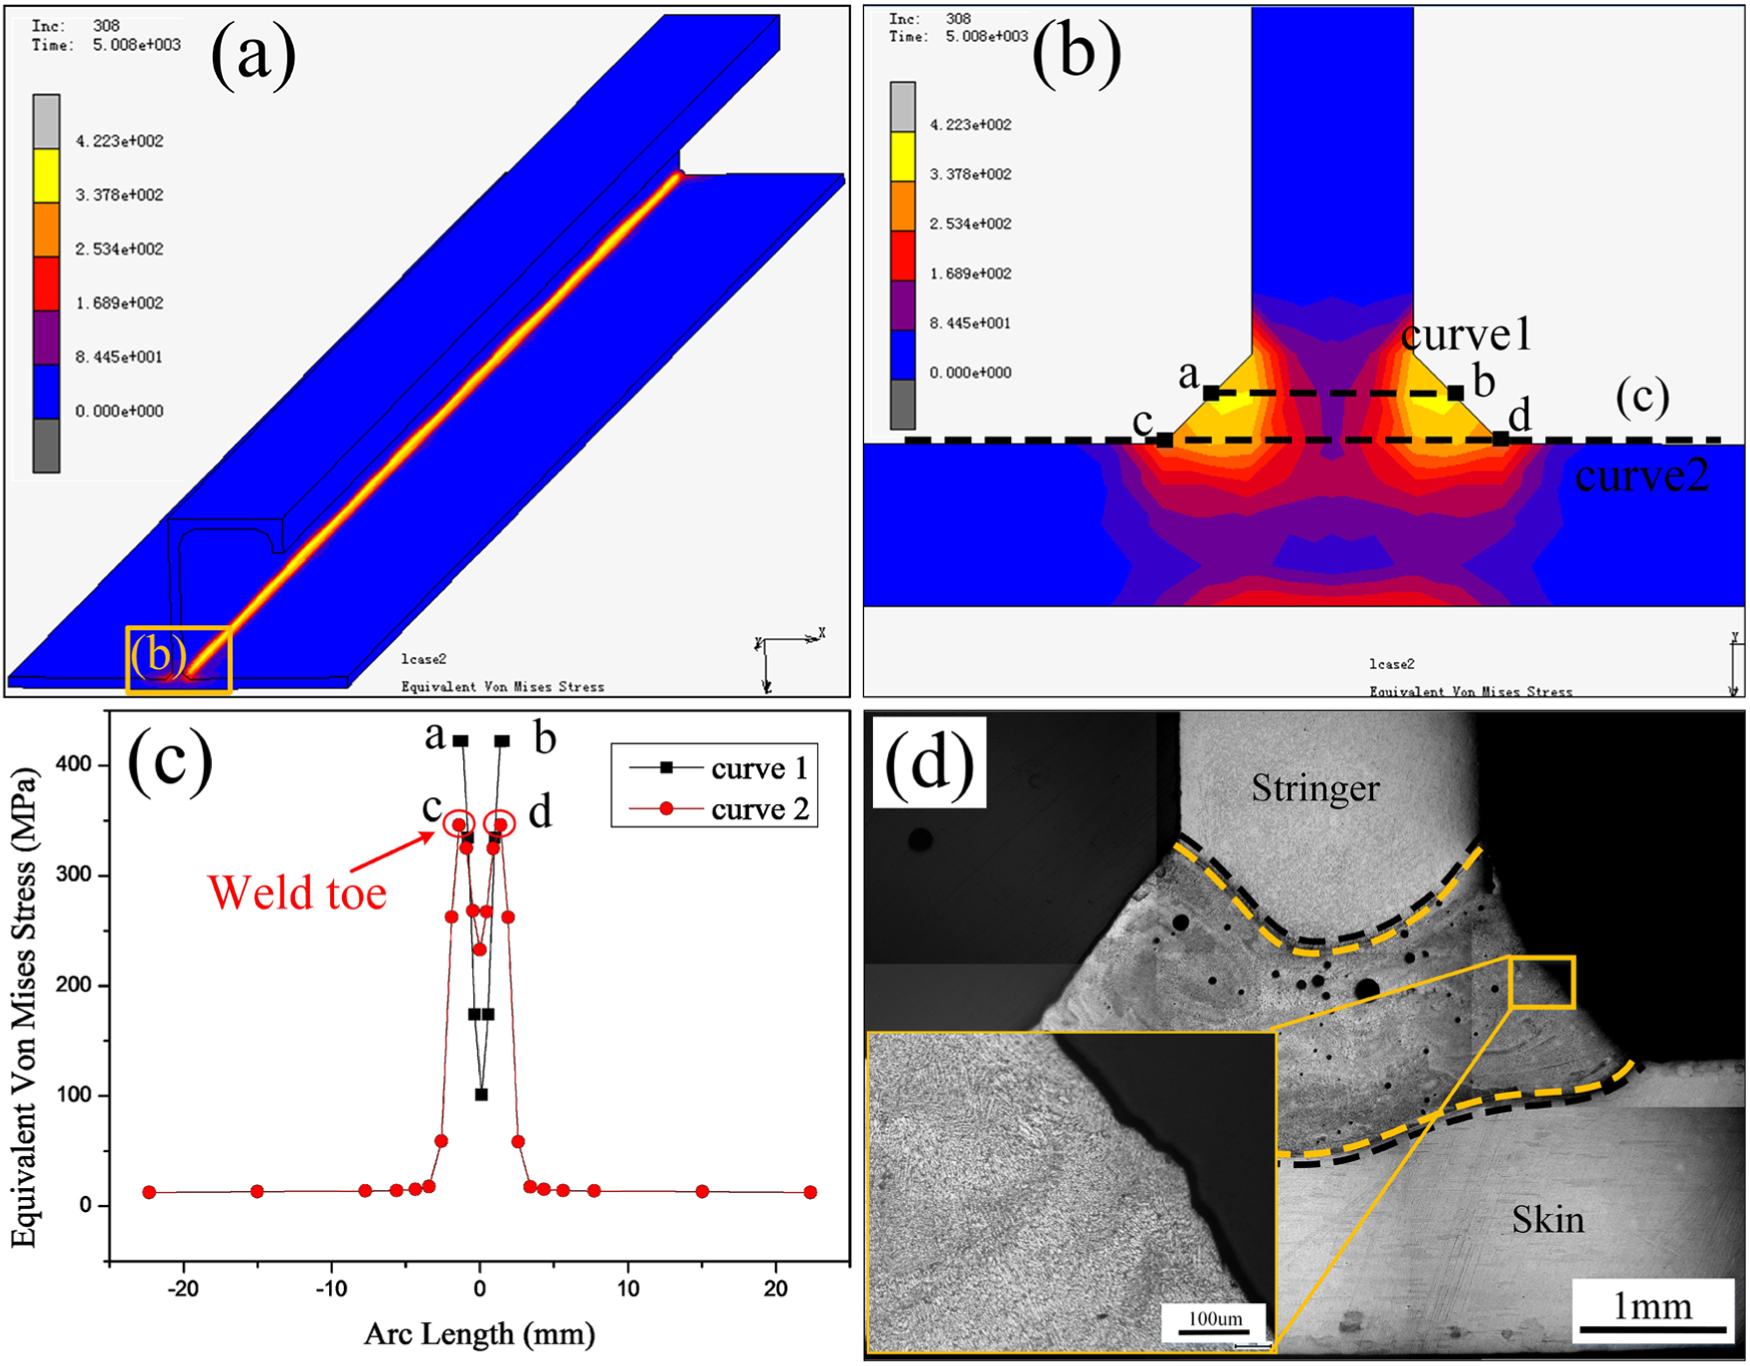
(a) and (b) Simulation result of stress–strain field, (c) equivalent von Mises stress distribution, and (d) microstructure of welded joint.
The residual stress of the welded structure is mainly concentrated in the weld seam and symmetrical along the stringer. As illustrated in Figure 14(b), the maximum residual stress is located in the middle of the weld seam edge but not the weld toe where the failure of tensile test begins. In order to have a more intuitive understanding on the residual stress distribution of the weldment, the residual stress in the weld seam center (curve 1) and on the skin surface (curve 2) perpendicular to the welding direction is extracted. From the stress distribution curves, which are shown in Figure 14(c), it can be found that the stress concentration is produced at the weld toe because of sharp change in structure. Although the middle of the weld edge has the highest residual stress, no stress concentration produced there and external force does not directly acted on it during the tensile test. Furthermore, the weld edge is characterized by the fine grains with no obvious defects, as shown in Figure 14(d). On the contrary, the area near the fusion line is the weakest part of the welded joint. Grains in HAZ are coarse, where liquefaction cracks are prone to initiate under the effect of welding thermal cycles. While the EQZ is a site prone to cracks owing to the existence of interdendritic eutectic constituents with low melting point. Stress concentration makes these weak areas more susceptible to initiate cracks. The cracks expand and grow under the effect of static loading until the failure of welded panel during the hoop tensile test.
To clarify the failure behavior of the joint from microcosmic perspective, the fractographs of specimen B3 are analyzed by SEM. The SEM results on both sides of joint fracture are illustrated in Figures 15 and 16. As could be seen from Fig. 15 (a)(b) and Fig. 16 (a)(b), the tensile fracture surface macroscopically exhibits the brittle fracture mode.
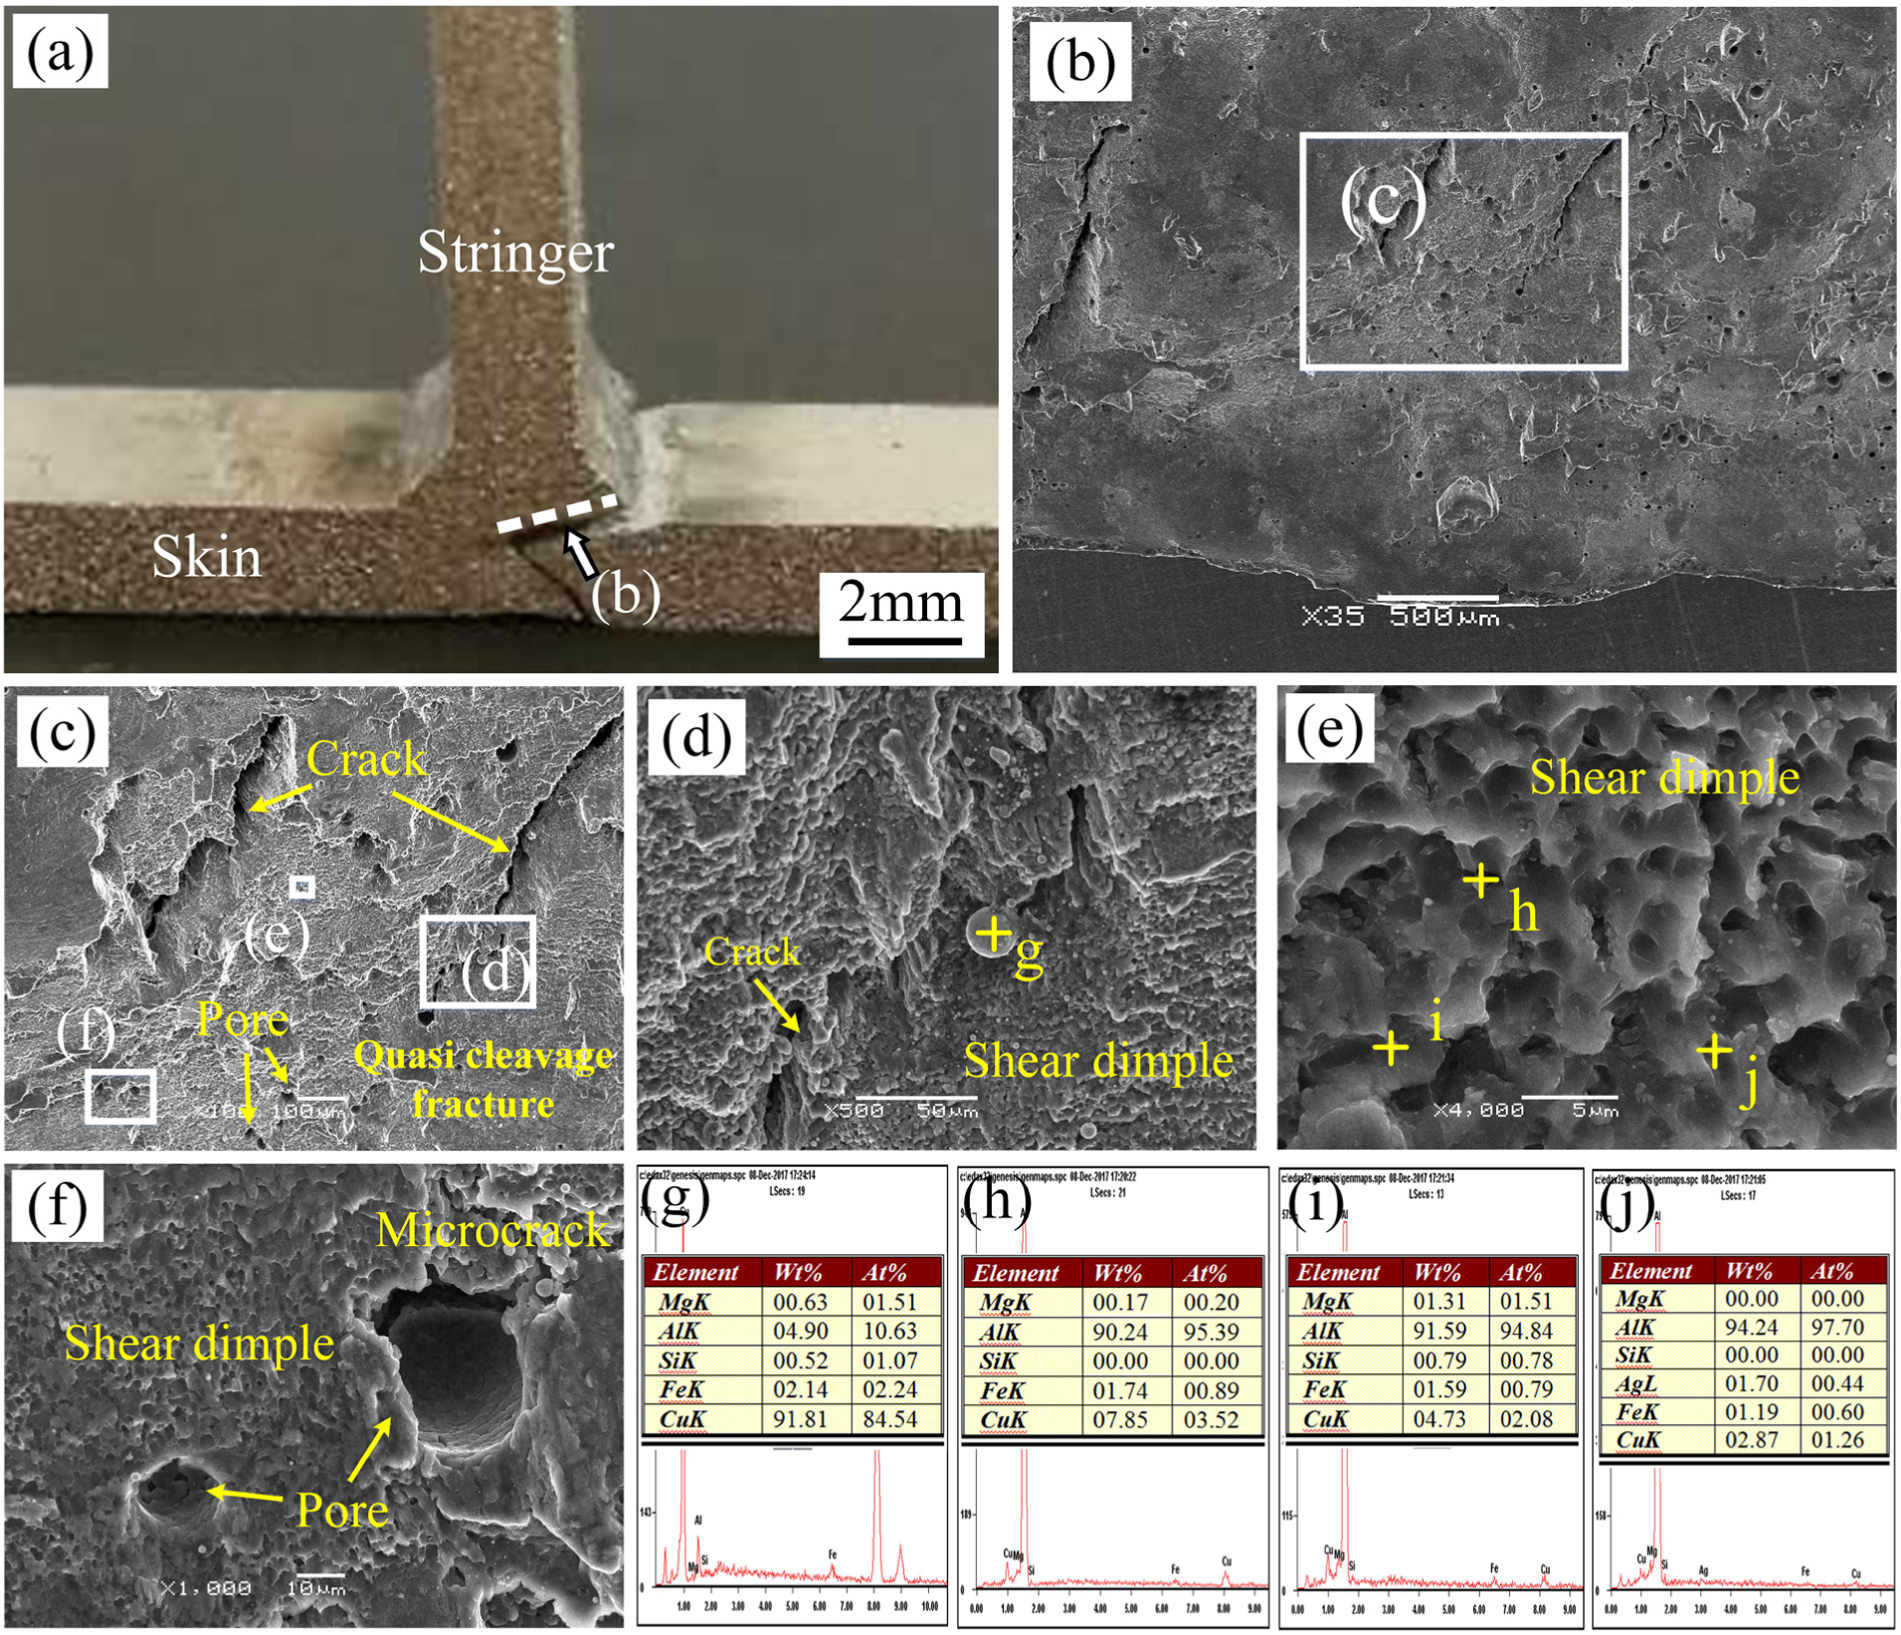
(a) Physical map of specimen B3 after tensile test; Fractograph of specimen B3 (weld seam side): (b) Macroscopic morphology; (c) (d) (e) (f) local morphology; (g) EDS results at point g; (h) EDS results at point h; (i) EDS results at point i; (j) EDS results at point j.
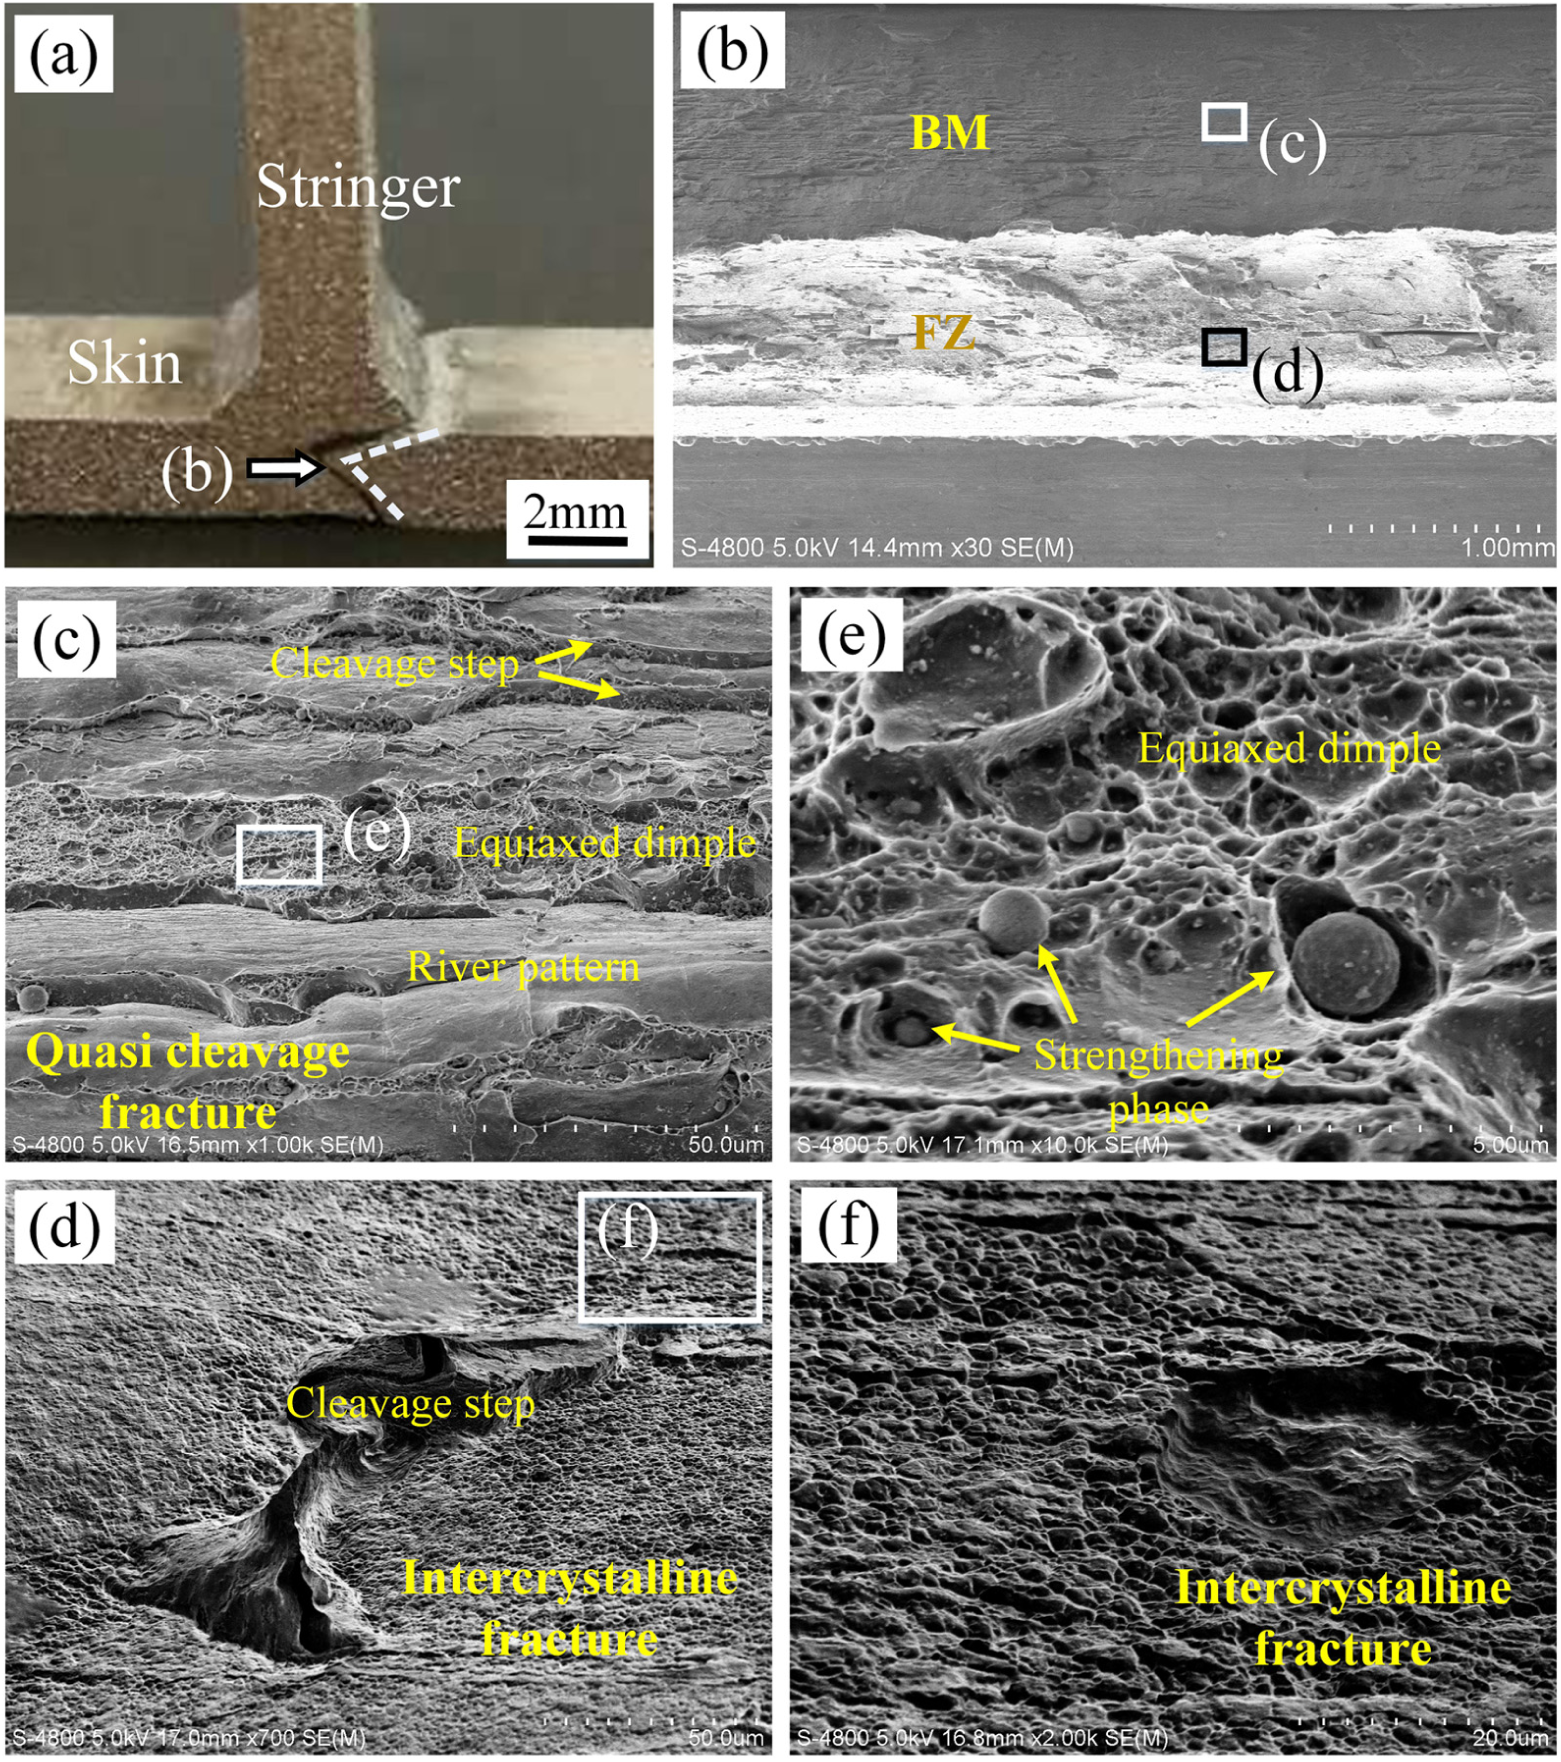
(a) Physical map of specimen B3 after tensile test; Fractograph of specimen B3 (skin side): (b) Macroscopic morphology; (c) (e) local morphology of BM side; (d) (f) local morphology of FZ side.
The SEM results of fracture surface at the weld seam side and EDS results about compositions of strengthening phase at the bottom of dimples are illustrated in Figure 15. A large number of cracks and micropores can be observed in the fracture surface. These defects, which lead to the stress concentration, are the main reason for fracturing during the tensile test. As indicated in Figure 15(c), the fracture mechanism of fracture surface at the weld seam side is quasi-cleavage fracture. Shear dimples are observed in the local area of the fracture surface. Figure 15(d) displays a spherical strengthening phase, whose chemical composition is exhibited in Figure 15(g). A high level of copper is contained in it; thus, the strengthening phase is inferred to be the Guinier Preston (GP) zone, that is, agglomeration zone of copper atomic. In addition, a lot of granular and strip strengthening phases are found in the bottom of the dimples in Fig. 15 (e), the chemical compositions of which are shown in Figure 15(h)–(j). The copper content at point h, magnesium content at point i, and silver content at point j are much higher than that of BM. Copper is the main strengthening element in Al-Li alloy 2060 and 2099, which improves the strength of the alloy by solid solution strengthening and aging strengthening. While magnesium and silver promote uniform precipitation of T1 phase, θ′ phase, and S′ phase, thereby enhancing the properties of the alloy.
The SEM fractograph shown in Figure 16 illustrates that the fracture morphology exhibits different characteristics at the FZ and BM. The fracture mechanism of BM in Figure 16(c) is quasi-cleavage fracture. Large amount of cleavage steps and river pattern are observed, and microvoid accumulation fracture happens partially. In the 10K times SEM photo (Fig. 16(e)), spherical strengthening phases are existed in the equiaxed dimple. While the fracture mechanism of FZ in Figure 16(d) is intercrystalline brittle fracture, no obvious plastic deformation of grains and no trace of deformation fracture are generated. The profile of grain is clearly seen in Figure 16(f), which exhibits the typical rock candy block. This type of rupture occurs because of the existence of eutectic layer at this area, whose strength is lower than the intragranular strength.
In general, it can be concluded that the specimen fracture position in the tensile test is the HAZ or the EQZ. The fracture mechanism of the HAZ is quasi-cleavage fracture. The fracture failure is attributed to the stress concentration caused by the welding defects and the strengthening phases in the dimples. While the fracture mechanism of the EQZ is intercrystalline brittle fracture, the presence of intercrystalline eutectic phases with low melting point plays a key role in the fracture at EQZ.
Conclusion
In the present work, the experiment as well as numerical simulation of DLBSW under the tailored process conditions are conducted for the 2-mm thick 2060-2099 Al-Li alloy T-structure. The following conclusions can be proposed:
Weld width and weld penetration of the weld seam are 4.4 and 0.88 mm, respectively, while the seam angle θ is 44°.
Three distinct regions, that is, BM, HAZ, and FZ, can be observed in the welded joint. Grain morphologies of FZ from the fusion line to the weld center are EQZ, columnar dendrites, and equiaxed dendrites in turn. What is more, large amount of pores and cracks are found in the weld seam.
Skin and stringer base materials have almost the same value of microhardness. The microhardness of the weld seam and HAZ are lower than that of the BMs. Moreover, the average microhardness in the weld seam is tested to be 90 HV.
According to the hoop tensile test, all the samples fractured along the fusion line up to the deepest point of weld seam and then cracked through the BM. The maximum tensile strength of the weld seam is up to 85% of the tensile strength of the skin material.
The residual stress of the weldment is mainly concentrated in the weld seam area and symmetrical along the stringer. Stress concentration produced at the weld toe and weak performance of the region near fusion line are considered to be the main reason for the weldment failure of tensile test.
Footnotes
Appendix 1
Declaration of conflicting interests
The author(s) declared no potential conflicts of interest with respect to the research, authorship, and/or publication of this article.
Funding
The author(s) disclosed receipt of the following financial support for the research, authorship, and/or publication of this article: The authors gratefully acknowledge the financial support of the project from the National key research and development plan “Intelligent Robot” key item (2017YFB1301600) and National Natural Science Foundation of China (U1637103).