
Abstract
The masking of aircraft engine parts, such as turbine blades, is a major bottleneck for the aerospace industry. The process is often carried out manually in multiple stages of coating and curing, which requires extensive time and introduces variations in the masking quality. This article investigates the automation of the masking process utilising the well-established time–pressure dispensing process for controlled maskant dispensing and a robotic manipulator for accurate part handling. A mathematical model for the time–pressure dispensing process was derived, extending previous models from the literature by incorporating the robot velocity for controlled masking line width. An experiment was designed, based on the theoretical analysis of the dispensing process, to derive an empirical model from the generated data that incorporate the losses that are otherwise difficult to model mathematically. The model was validated under new input conditions to demonstrate the feasibility of the proposed approach and the masking accuracy using the derived model.
Introduction
Many high-performance engineering components require localised surface treatments to improve their heat resistance, surface hardness, friction, and other mechanical properties. 1 Most of these processes are difficult to apply locally and require those areas which do not need to be treated to be protected. Therefore, different masking processes are needed to ensure that the surface treatment is only applied to the desired areas. The application of the maskant, commonly in liquid form, is often a labour-intensive process which requires skilled workers who use their experience and senses to manually mask each part within the specified tolerances. 2 This process typically requires several cycles, where in each cycle, a layer of maskant is applied and cured until a required thickness has been achieved. Although skilled operators can mask the parts within the defined tolerances, the manual process is tedious and time-consuming due to the repetitive cycles of coating and curing. 3 In addition, valuable time and money are spent on training the operators to acquire the relevant skills for accurate masking. 4
Moreover, the automation of other processes involving dispensing of viscous liquids similar to the masking process has been previously investigated such as: robotic sealing of aerospace parts, 5 robotic coating for space solar modules, 6 robotic spray painting for automotive parts,7,8 and robotic workstations for small-volume liquid dispensing and handling in laboratories. 9 In addition, automation of different processes in the aircraft manufacturing and assembly is being increasingly sought after.10,11 However, limited attention has been directed towards automating the manual masking operations, despite being a significant bottleneck for repetitive production processes involving components with complex geometries, such as the case for turbine blades in aircraft engines. 12 Manual masking introduces variations in both the resulting mask quality as well as the curing time. 3 This highlights the need to make the masking process faster and more consistent, which can be achieved through automation. However, this involves a number of challenges that need to be considered including: (1) the modelling and control of the masking process, (2) adaptability in masking according to the areas to be masked, (3) automated path planning, and (4) ensuring acceptable masking quality.
This article investigates an automated masking system, in which the target object is handled using a robotic arm, while the maskant material is dispensed using the well-established time–pressure (T/P) dispensing system. At present, several models exist for the fluid dispensing using T/P systems that could be associated with masking operations. However, since the T/P dispensing system typically involves a stationary target object, the influence of the robotic manipulator used in the proposed system here needs to be incorporated into the model to control the masking process. Thus, the main contribution of this article is in deriving a model that is used to control the automatic application of the maskant material on different target areas, by tuning the velocity of the robot holding the target object according to the input process parameters. The emphasis of this research has been on the ability to automatically mask a specific area of a planar part with a homogeneous maskant layer in a single attempt, without the need for repetitive stages of coating and curing. This has the potential of not only reducing the duration of the masking process but also helping in achieving consistent masking quality.
The article is organised as follows: section ‘Previous work’ presents a review of the previous work in modelling of dispensing systems that can be utilised for the masking process. Section ‘Modelling of automated masking’ presents the mathematical modelling of the T/P dispensing process, starting from a dynamic model and simplifying this to a steady-state model under a given assumption. This is then followed by the empirical modelling of the system through design of experiments, based on the outcomes of the theoretical modelling. The proposed masking system using the developed empirical model is then tested, and the results are reported in section ‘Surface masking test’. Finally, the article concludes with considering the initial feasibility of the proposed system and discussion of future research work.
Previous work
An inspiration for automated masking comes from the additive manufacturing processes and robotic painting or spraying. However, additive manufacturing of parts that are printed from scratch is not suitable to adopt for automated masking, since dispensing does not occur on top of an existing component, and the materials used are much simpler in their flow behaviour than masking materials.13–15 Yet, the more advanced robotic additive manufacturing, where additive manufacturing is performed over free-form surfaces and complex geometries, is more relevant. 16 However, the material properties and flow are significantly different from the case of masking, as the dispensed material takes the required form almost immediately. On the other hand, masking is mostly performed using vicious liquid materials that require long curing times. Moreover, several approaches are currently being used for masking of aerospace, automotive, and electronic components, such as dipping, spraying, and dispensing. Dipping and spraying approaches are mostly used for parts with simple geometric features and are difficult to employ for masking specific areas on parts with complex geometries. 17 The dispensing approach, however, can be used for masking complex shapes and is widely used in industries for applications such as advanced integrated circuits encapsulation (AICE) and surface mount technology (SMT). 18 In general, dispensing mechanisms can be classified into contact-based and non-contact-based mechanisms, such as volumetric dispensing and jetting, respectively. 18 One of the most commonly used dispensing mechanisms is the T/P dispensing due to its simplicity, low cost, and ease of operation and maintenance. 19
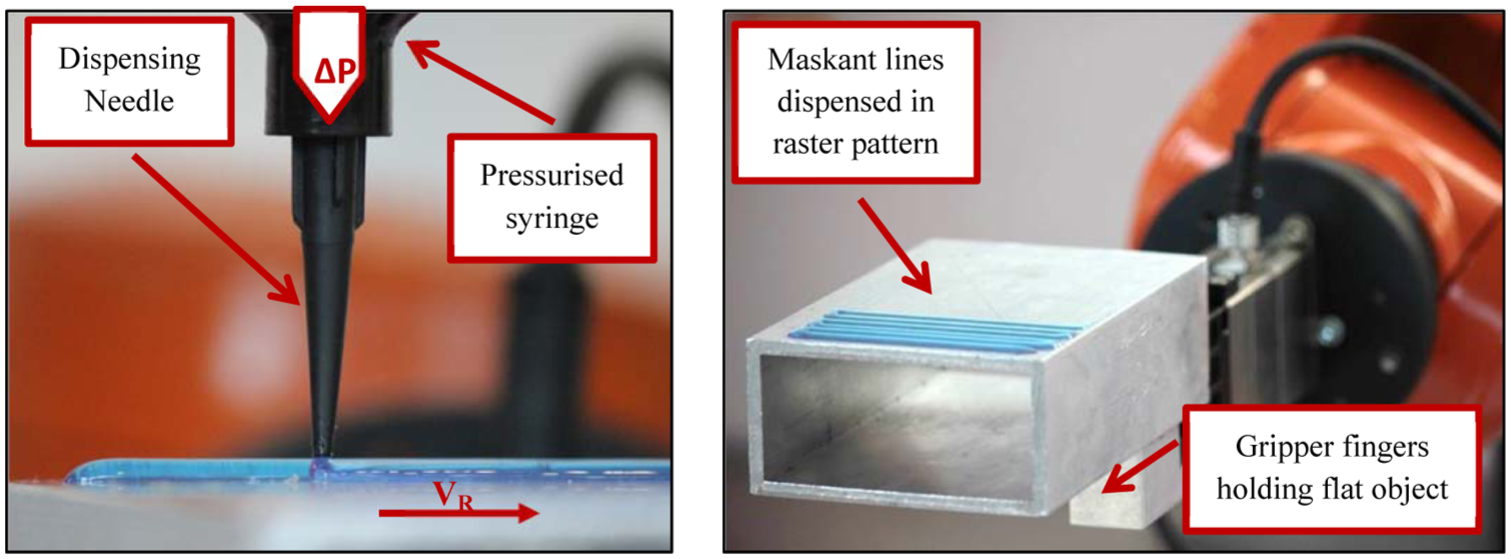
In T/P dispensing, an electrical solenoid controls the pressurised air in the syringe for pushing the fluid out of the needle onto the workpiece as illustrated in Figure 1. Controlling the T/P dispensing requires knowledge about several variables that govern the process such as; pressure in the syringe, needle diameter, distance from the part, and fluid properties. 20 Different mathematical models have been previously proposed for covering various aspects of the T/P dispensing process.20–22 The behaviour of T/P process can be modelled as a dynamic system or as a steady-state system. The dynamic behaviour models of a T/P system under both Newtonian (constant viscosity) and non-Newtonian fluids (varying viscosity) have been presented in literature.23–26 Although a simplified dynamic model based on simple physical relations was presented and experimentally verified, 18 dynamic models still involve a large number of variables which can be difficult to control. For this reason, many researchers have modelled the T/P system as a steady-state system to simplify the model with acceptable accuracy. 27 These models assume that the dispensed fluid has a constant viscosity and that the inconsistency in the flow at the start and the end of the masking process is negligible. 18 Models of the T/P dispensing system currently do not incorporate the relative movement between the dispensing system and a robotic manipulator handling the target part. In addition, these models have been developed explicitly for point and line dispensing applications only. However, many automotive and aircraft components require masking over an area, which so far has not been investigated in detail by the research community using T/P dispensing. In this context, there is a need to explore the effect of the robot’s velocity on the T/P dispensing process and resulting area coverage. This article investigates a model of the masking process for area coverage using T/P dispensing that incorporates the relative velocity between a manipulator and the dispenser. The principal objective is to better control the area coverage in automated masking applications.
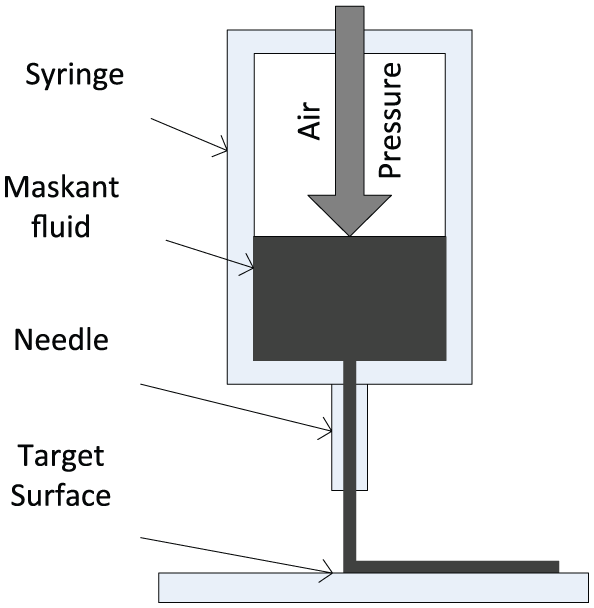
Schematic diagram of a typical T/P dispensing process.
Modelling of automated masking
Figure 2 shows the schematics for the masking process using a T/P dispensing system that is automated using a robotic manipulator controlling the movement of the target object under the needle of the dispensing system. The model for the robotic masking system was developed in two main stages. In the first stage, a mathematical model for the system was developed, which extends the dispensing model form 28 by incorporating the velocity of the robotic manipulator. This allowed identifying the key variables that should be included when designing an experiment for deriving an empirical model for the automated masking process. In the second stage, the empirical model was derived, based on the identified key parameters, using experimental data generated from running a series of robotic masking operations. Finally, the derived model was deployed to the robot controller to control the masking process and validate the overall approach.
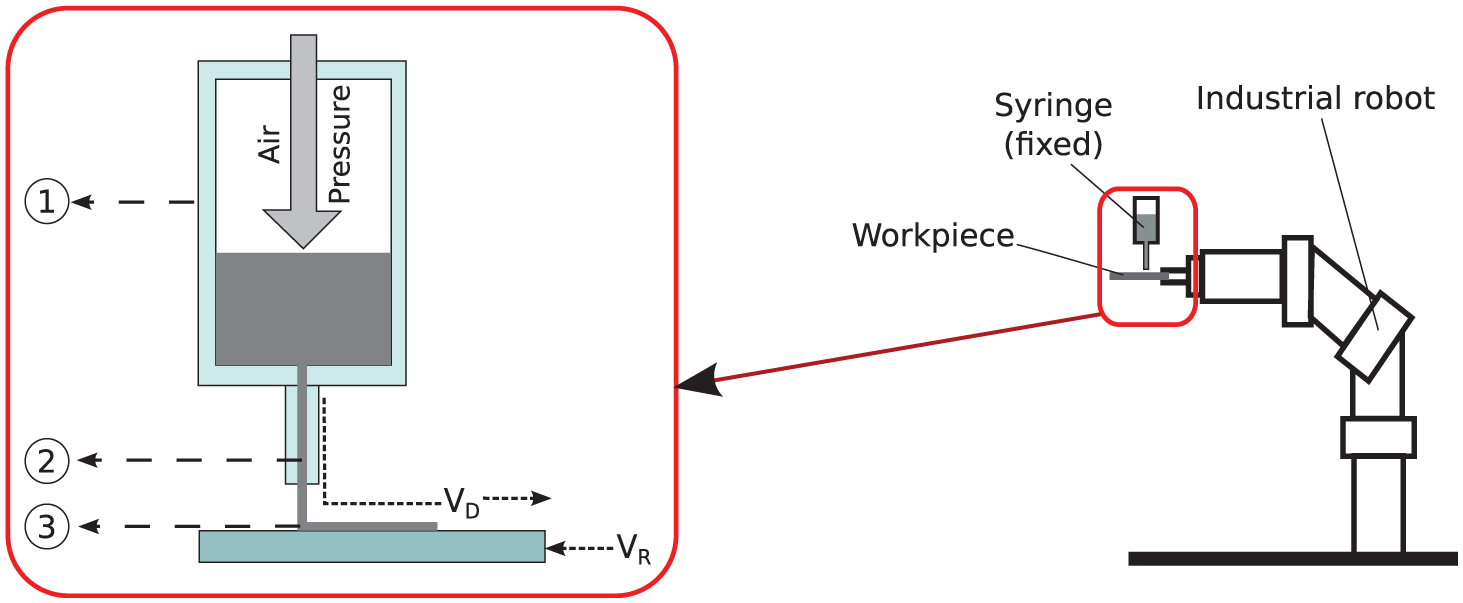
Schematic diagrams of the time–pressure dispensing process as part of an automated dispensing setup.
Mathematical modelling
There are many variables which affect the T/P dispensing system, most of which can be controlled depending on the hardware setup. Nevertheless, there are some variables which are highly dynamic especially when dispensing a large amount during a masking process. The most significant dynamic variables that affect the consistency of the dispensed fluid include the chamber volume, the dispensing fluid volume, and the air pressure in the syringe chamber. Most dynamic models focus on representing only the most influential variables to contain the complexity of the model. For the model used in this article, it is assumed that the fluid properties such as its compressibility and viscosity are constant over time and that there is dry friction between the syringe and the fluid. In addition, the delay that could be caused by the pneumatic lines was ignored. Hence, the simplified dynamic model proposed by Chen et al.
28
for these specific assumptions was adopted. This model is presented in equation (1), where S is the Laplace operator, K is the viscosity coefficient, ‘
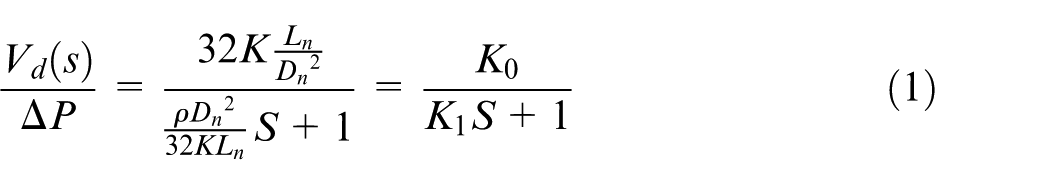
The relative velocity between the dispensed fluid and the robot end effector (Figure 2) can be defined as in equation (2). Hence, substituting equation (1) into (2) results in equation (3), which defines the relative velocity ‘

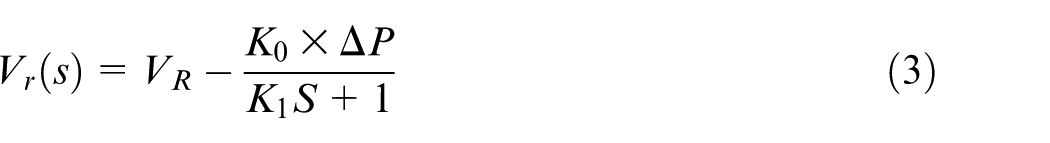
In general, the T/P system has a time delay of around
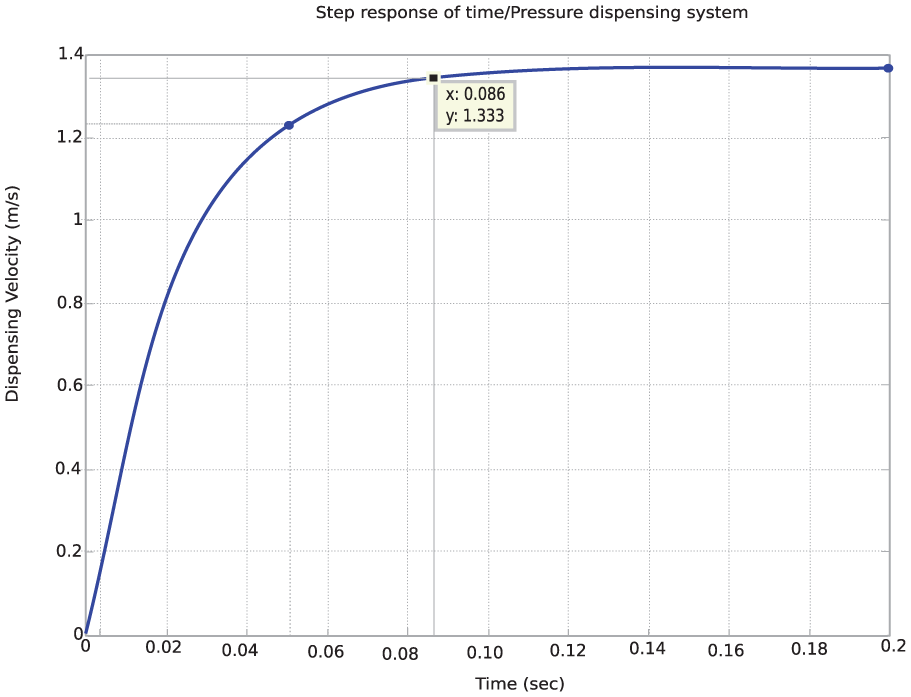
Time/pressure step response of the dynamic system defined in equation (3).
To overcome the delay problem, a time-delay function can be used at the start and end points of the dispensing process to eliminate missing and excessive maskant at the beginning and end of the process, respectively. A waiting function is a simple solution which is particularly suitable for short to medium dispensing periods, since the variation in the syringe chamber pressure can be neglected. However, for long dispensing runs where the pressure in the syringe changes significantly, more sophisticated solutions will be required. For continuous short run dispensing applications considered here, the transition delay at the start and end points, as well as the variation of the dispensing parameter during operating time can be neglected. Therefore, the system behaviour can be modelled as a steady-state model, which simplifies equation (3) as follows

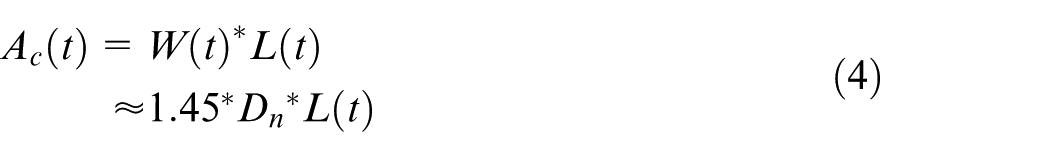
By considering the cross-sectional geometry of a single dispensed line, the covered area can be determined using the empirical approximation in equation (4), relating the width ‘W’ and length ‘L’ of the dispensed maskant line
By substituting equation (4) into equation (3) and applying the continuity equation, a relation will result between the dispensed line width (output) and the robot speed (input) as shown in equation (5)
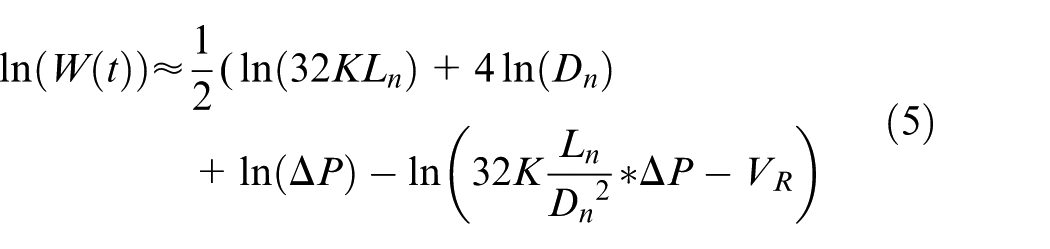
Equation (5) shows the mathematical relation that maps the robot velocity to the dispensed line width. It neglects the time delay caused by the dynamical elements in the system. As a result, the dispensing problem can now be viewed as a steady-state fluid-flow problem. In this case, equation (6) for the dispensing fluid velocity ‘
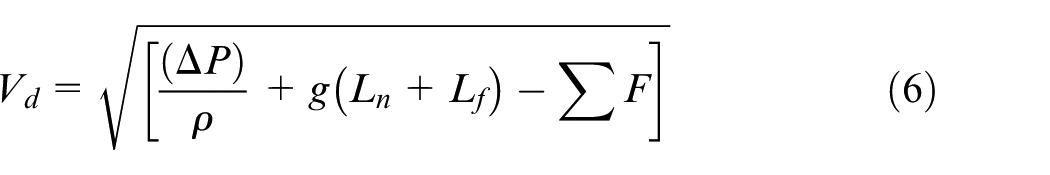
The speed of the target object held by the robot is controlled by the robot Cartesian speed ‘VR’. Hence, by programming the planar movement of the robot underneath the needle, lines of the masking material can be dispensed on the object with a cross-sectional area ‘ALine’. According to the continuity theory, the fluid-flow rate leaving a needle of diameter ‘
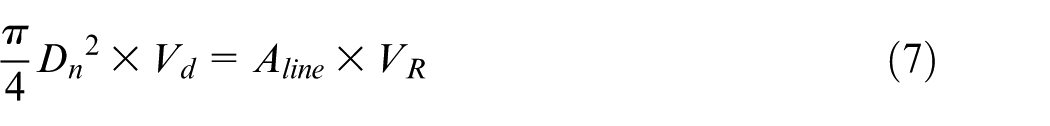
By substituting equation (6) for the fluid dispensing velocity into equation (7), the cross-sectional area of the dispensed maskant line on the plate can be defined as
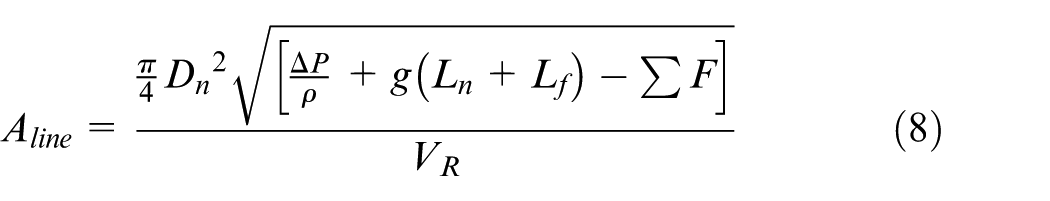
Applying a natural log function to linearise the equation results in the following final equation describing the cross-sectional area of a dispensed maskant line that accommodates the robot velocity, where ‘F’ is a coefficient representing the combined frictional loses
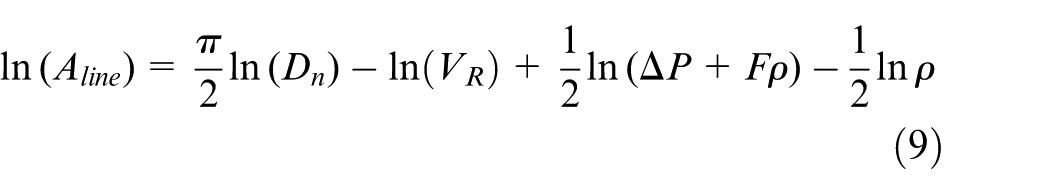
This mathematical model provides an understanding of the main parameters controlling the outcome of the T/P dispensing process. This can be used as a good starting point to guide the development of a simple empirical model that captures the unknown losses in the system that are difficult to accurately model mathematically and is influenced by the hardware used in the system. The model thus shows that the cross-sectional area of the maskant lines dispensed from a stationary needle on a moving target object is a function of three primary variables, which are (1) the needle diameter
Empirical modelling
Following the identification of the key process variables, a set of experiments were conducted to derive an empirical model that predicts the dimensions of the dispensed masking lines resulting from the T/P dispensing process while incorporating the unknown frictional losses that are otherwise difficult to model mathematically. Through systematic experimentation, the unknown model coefficients can be empirically approximated from experimental data captured from the actual masking process and fed to a statistical analysis software to conduct an analysis of variance and regression. The resulting empirical model can then be easily integrated within the robot controller for the offline control of the masking process.
The geometric variables defining the typical geometry and cross-sectional area of maskant lines dispensed in a raster pattern on a flat surface are illustrated in Figure 4. The main parameter of interest here is the width ‘W’ of the dispensed maskant lines, since being able to predict its value can be used to determine the required spacing between the maskant lines that would result in a homogenously masked area with no gaps or excessive overlaps. The length of the maskant lines is directly controllable through the programmed movement of the robotic manipulator holding the target object and hence does not need to be studied in the experiment. While the height of the maskant lines can be mathematically estimated based on the wetting coefficient and surface tension, 28 it is generally not a significantly critical factor for many masking applications as long as the target area is well covered. Therefore, the output parameter that needs to be investigated in the designed experiment is only the width of maskant lines, which can be measured via two-dimensional (2D) image processing. On the other hand, the input process parameters of interested are the ones identified in the mathematical model. Hence, the aim of the experiment is to derive an empirical relation between the VR, ΔP, and Dn process parameters and the process response W, assuming any other nuisance factors can be either held constant or have a negligible effect on the studied response.
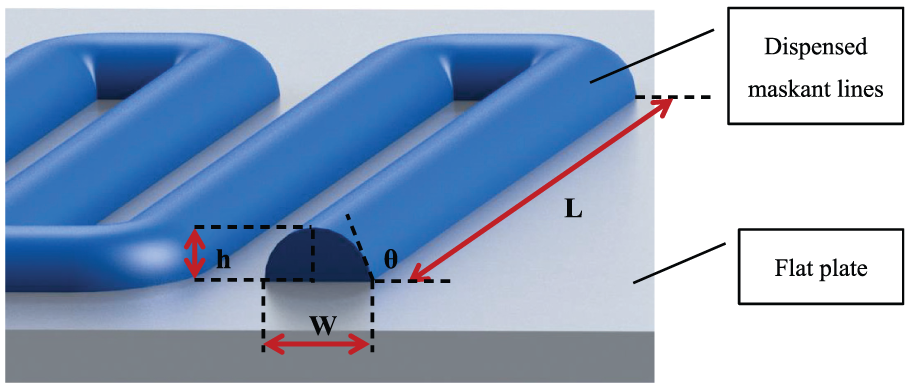
Illustration showing the geometry and dimensions of maskant lines dispensed on a flat surface.
The experimental setup is shown in Figure 5, featuring an ABB IRB120 robotic arm with a two-fingered gripper grasping a flat object from a fixed reference, as well as a controlled pressure-dispensing unit (Fisnar JB1113N) pressurising the syringe containing the maskant material that flows through an ultraviolet (UV)-shielded needle. In order to ensure that the initial assumptions made during the mathematically modelling of the process as a steady-state system are justified, a number of practical considerations were implemented. First, a long needle length of 12 mm was used to guarantee a fully developed fluid flow as it reaches the tip of the needle. Second, a large syringe-to-needle diameter ratio was used to ensure that the fluid velocity inside the syringe was relatively small. Third, the masking material (DYM 728-G) was used which can be treated as an incompressible Newtonian fluid, as confirmed by the constant viscosity given by the material specification (https://www.dymax.com/images/pdf/pds/728-g.pdf).
Components of the automated masking setup.
The robot was programmed to move the object with the desired velocity beneath the stationary dispensing needle, so as to create a raster pattern of five equally spaced lines. A spacing distance of 5 mm was maintained to ensure that there will always be a clear gap between the lines, to enable a 2D image-processing programme to recognise each line and measure its width separately. This was achieved by imaging the masked samples at the end of each run using a fixed camera setup and feeding those images to the developed image processing on MATLAB. The programme uses standard thresholding and segmentation algorithms to isolate the blobs representing the dispensed lines from the background and makes the required width measurements after calibration, as shown in Figure 6. This provides a reliable non-contact measurement technique with consistent accuracy, which was evaluated by measuring the spacing distance between the lines for each run and comparing this to its known value of 5 mm. The spacing measurements throughout the experiment were found to have an average error of only 0.02 mm and a standard deviation of 0.048, confirming the measurement accuracy for this imaging technique.
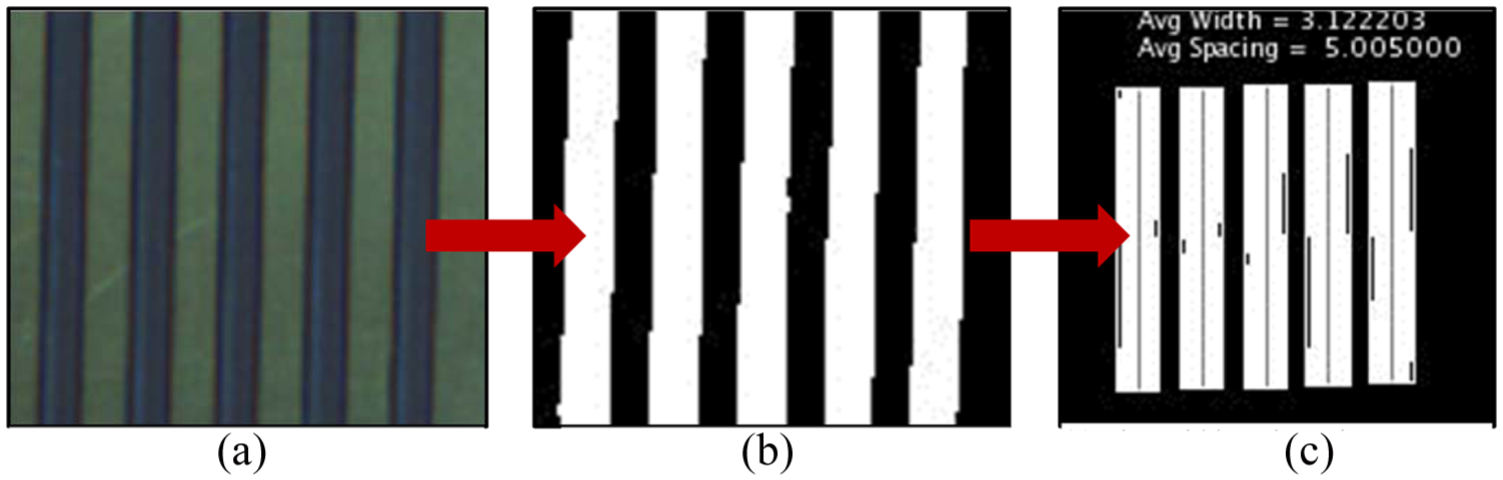
Vision system identifying the dispensed lines and measuring their average width: (a) image of the masking lines on a flat plate; actual line width = 3.10 mm and actual spacing = 5 mm, (b) segmented binary image identifying the maskant lines (broken lines are due to default display resolution), and (c) line width and spacing measured through the vision system; mean width = 3.12 mm and mean spacing = 5.005 mm.
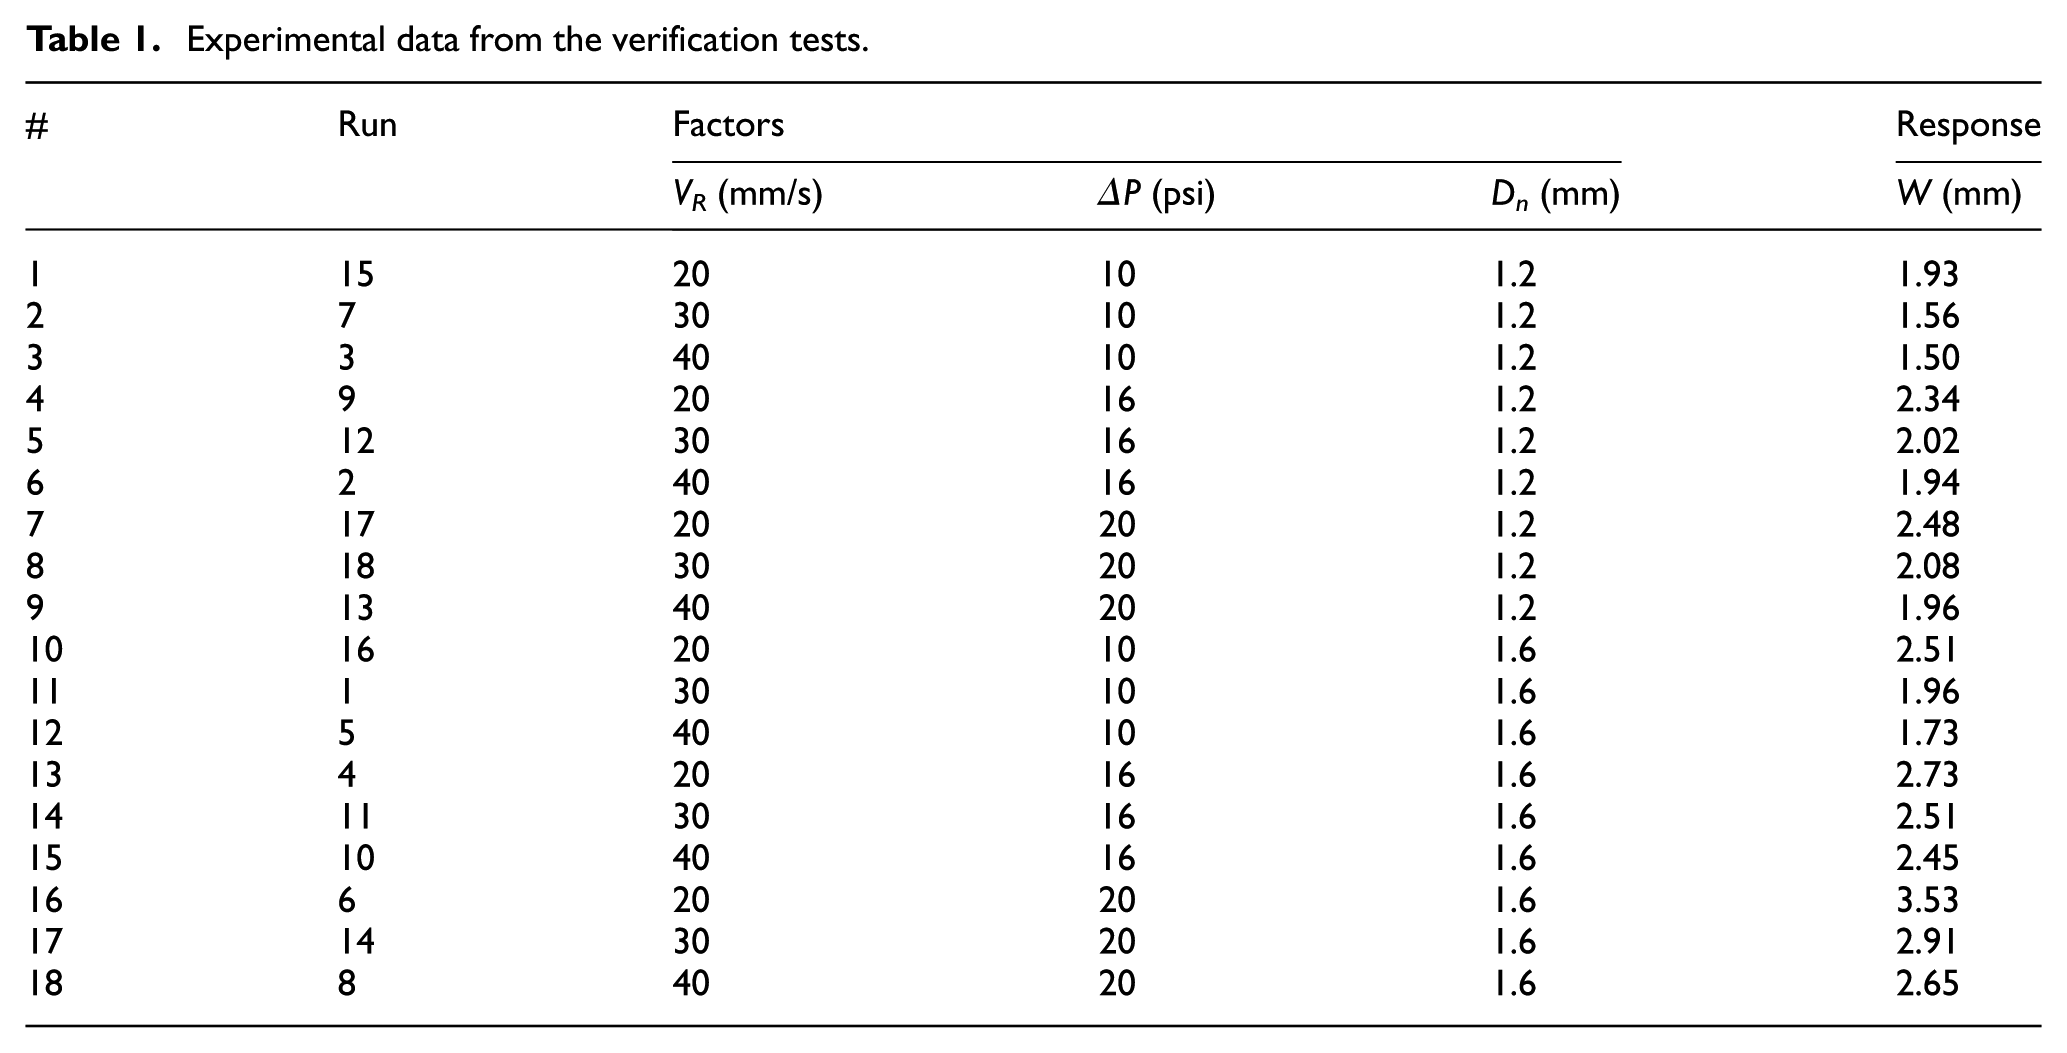
A multi-level factorial design model was used in designing the experiment by studying the three-input parameters at different levels, against the measured response W. The values of the levels for each parameter were chosen to cover the expected operating range so that the model can effectively capture the variance in the process. The VR parameter was tested at values of 20, 30, and 40 mm, which is directly set using the robot controller. While ΔP was tested at values of 10, 16, and 20 psi, which is set using the analogue gauge of a pressure-controlled dispensing unit. As for the Dn parameter, two needle sizes of 1.2 and 1.6 mm were tested in this experiment. Table 1 summarises the implemented experimental runs that covered all the combinations between the different factor levels. For each run, the recorded width value is the average width of the dispensed five lines.
Experimental data from the verification tests.
Results and discussion
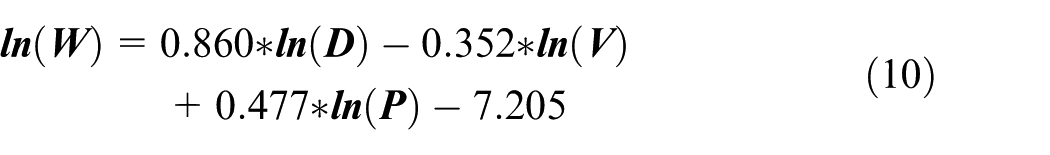
Afterwards, the resulting set of experimental data was fed into a statistical analysis software (Design Expert) to evaluate the data using analysis of variance and derive the empirical model using regression analysis. Applying a natural log transformation to the experimental data was found to linearise the data and result in an improved model fit. The resulting empirical model relating the studied process parameters to the measured response is presented in equation (10). It can be noticed that the equation follows the same structure as the mathematical model derived earlier in equation (9). This confirms the conceptual validity of the derived model. Yet, for the empirical model, the unknown coefficients and losses that were difficult to calculate mathematically can be approximated and implicitly captured within the model based on data from actual runs
The values of widths predicted by the empirical model were plotted against the actual widths from the conducted experiments (Figure 7) to evaluate the accuracy of the model. It can be observed that the points follow an almost linear relationship with an R2 value of 0.947, mean error of 0.098 mm, and a standard deviation of 0.115. This shows that the empirical model derived from the designed experiment was able to capture the behaviour of the dispensing process under the different levels of the studied parameters.
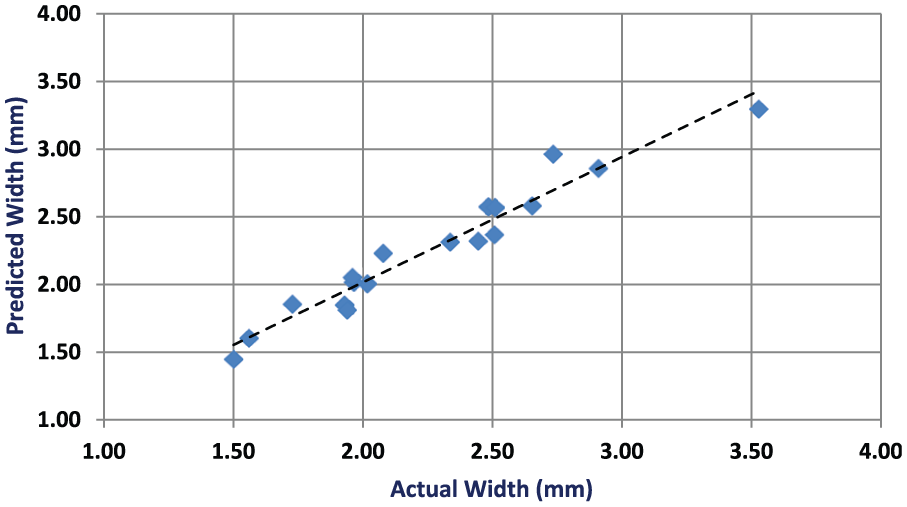
Predicted width values by the model versus the actual values.
Moreover, an important result from the design of experiment is the effect of each process parameters on the studied response. In order to better understand the behaviour of the process, the effect of varying the robot velocity on the resulting width of maskant lines under different values of pressure and needle diameter is plotted in Figure 8. Each point on the graph represents the average width of the five maskant lines resulting from an individual experimental run. The graphs show that a change of width in the range of 0.5 mm is possible within the tested range of robot velocities (20–40 mm/s). The choice of needle diameter and applied pressure can clearly shift the range of possible width values. Thus, the width of dispensed maskant lines can be controlled during the masking process through the robot velocity, while the range of feasible variation in the line width is determined by the selection of the pressure input and needle diameter at the beginning of the process.
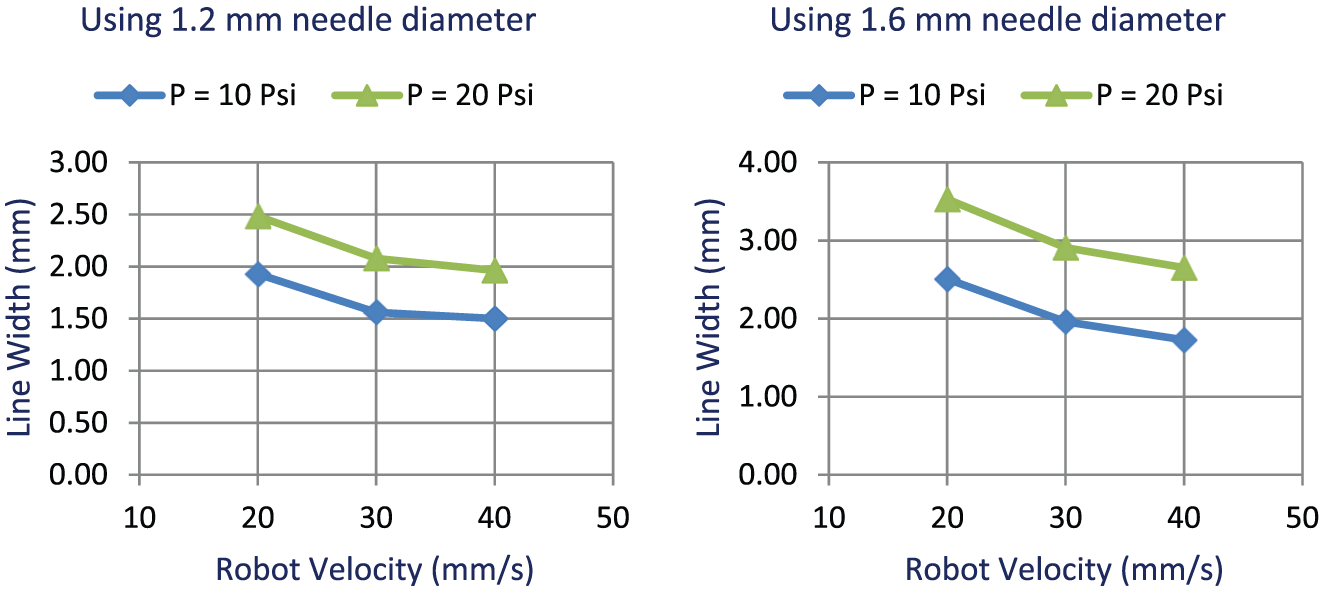
Effect of robot velocity on line width at different values of pressure and needle diameter.
Samples of the dispensed masking lines in raster pattern with a different combination of factor levels are shown in Figure 9. This further illustrates that by varying the values of the investigated parameters, the width of the dispensed masking lines can be changed. However, care must be taken to avoid odd combinations of input values that might result in discontinued lines as shown in sample 12 in Figure 9. This resulted from excessively increasing the robot velocity relative to the fluid velocity leaving the needle. It is recommended to maintain the robot velocity to be less than or equal to the fluid velocity (can be approximated using equation (6)) at any instance during the dispensing process. Any further reduction required to the width of the dispensed lines should be achieved by initially selecting a finer needle diameter or smaller pressure value, rather than excessively increasing the robot velocity during operation.
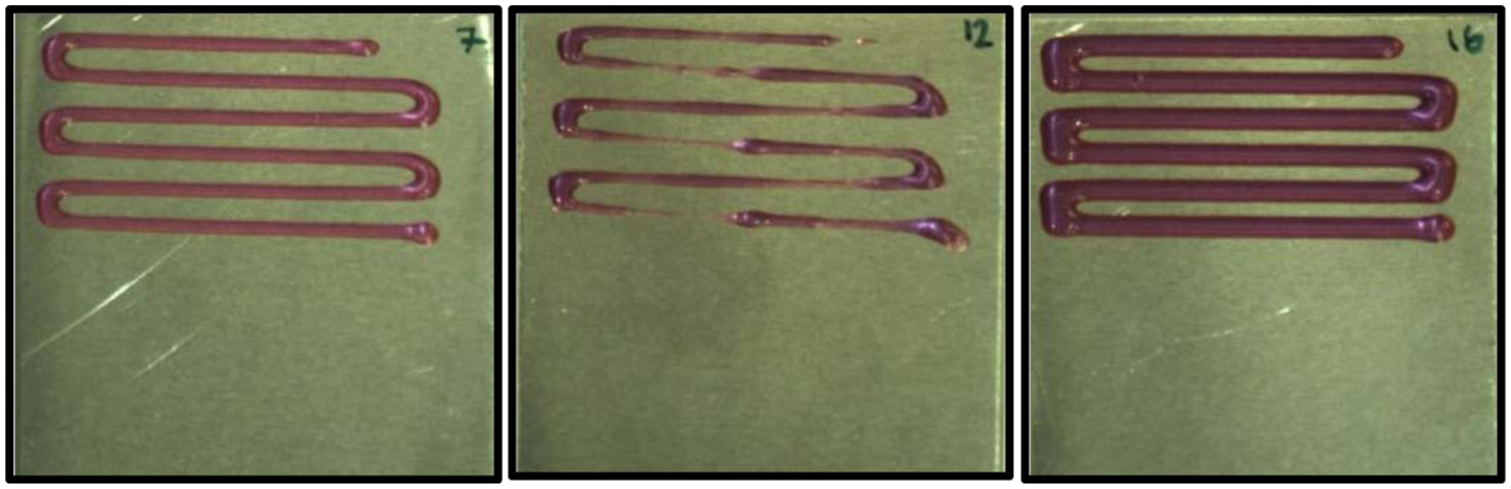
Samples of dispensed masking lines from the conducted experiment.
As mentioned earlier, the modelling of the system has been simplified by ignoring the start and the end delay that occurs before a steady-state condition is reached. This is demonstrated in the sample shown in Figure 10, in which the location of the start point is delayed by an offset distance, while the endpoint shows an accumulation of some excess material due to the delay in stopping the maskant flow. However, due to the nature of this application, the start and end delay can be practically overcome by starting and ending the masking at non-critical points. For example, when masking an area, the process can be started and ended inside the masked areas rather than at the edges. Hence, overcoming the effect of any variations in the width of dispensed lines at the start and end conditions can be achieved by appropriate path planning. In addition, a simple weighting function can be used based on the experimental data to minimise the start/end delay issues as mentioned in section ‘Mathematical modelling’. This was implemented in the final experiment outlined in the next section.
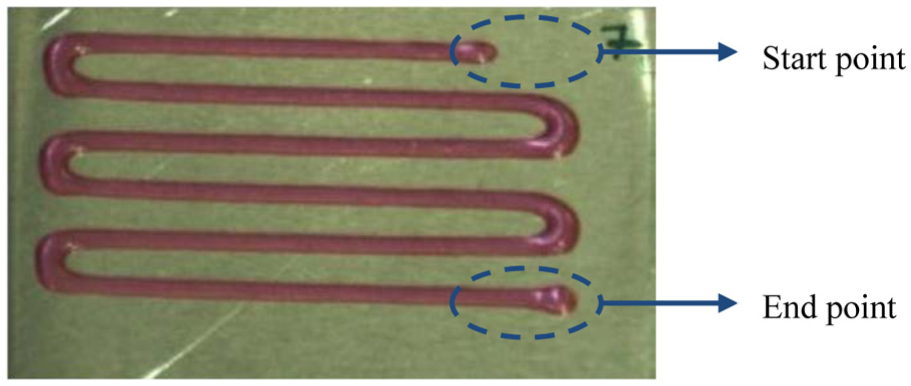
The effect of delay at the start and end points.
Model validation
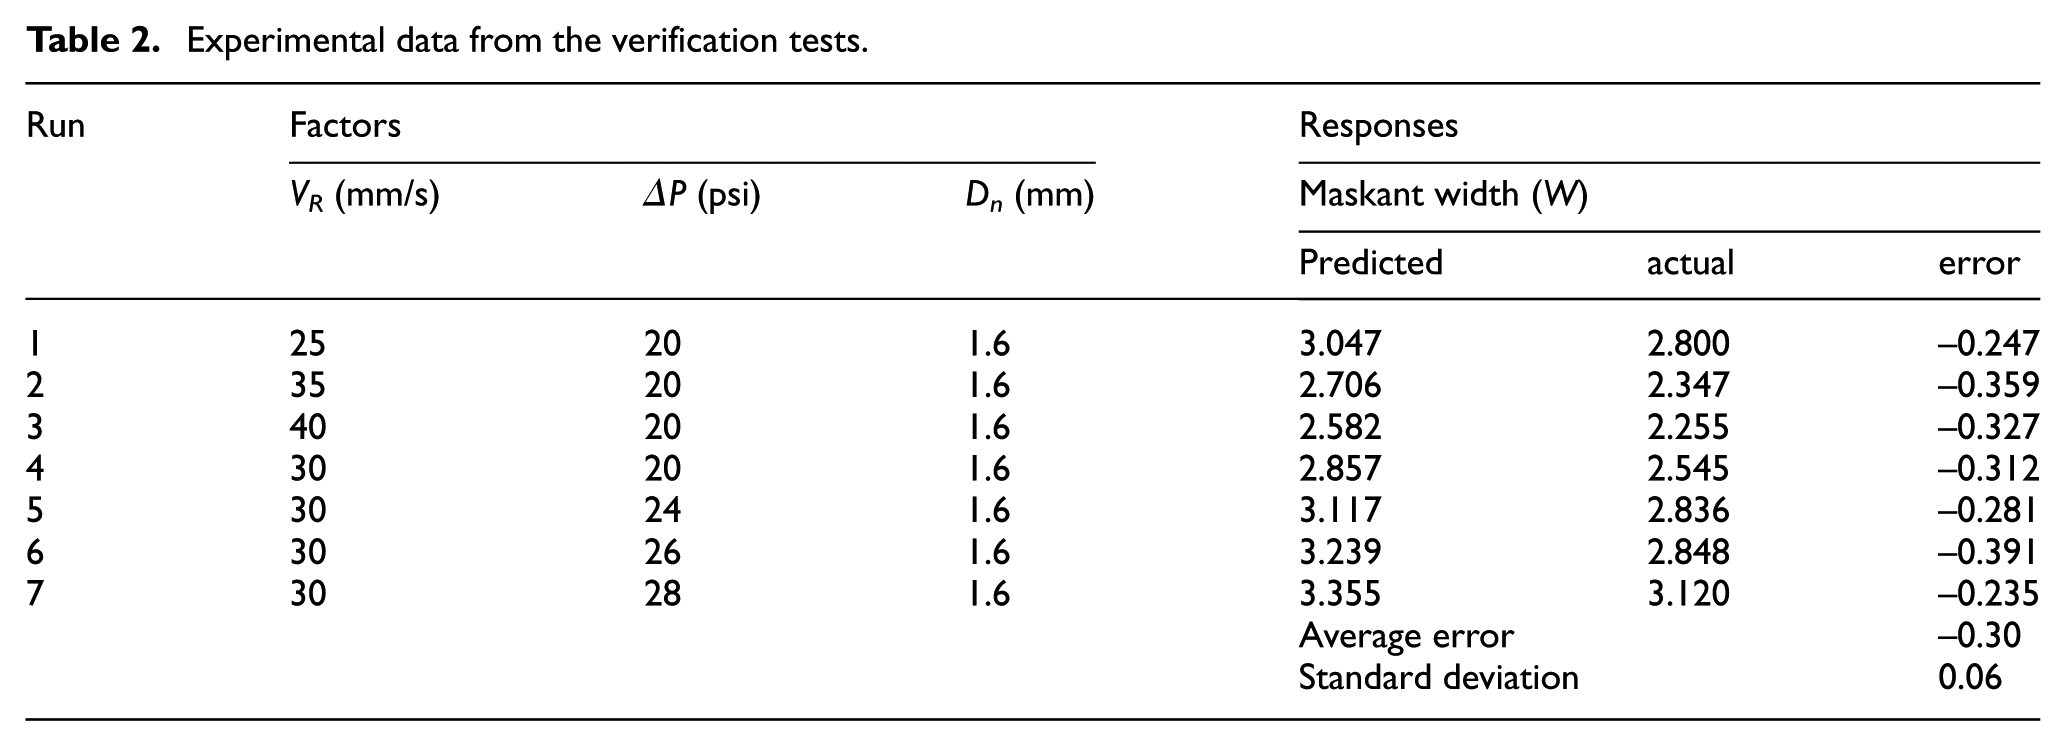
In order to validate the empirical model, another experiment was conducted by feeding the model with new combinations of process parameter values and comparing the measured width of dispensed lines to the values predicted by the derived empirical model. Table 2 summarises the values of the tested factors and the resulting maskant width measured using the imaging process, in comparison to the value predicted by the model. The results of the experiment showed that the model was still able to estimate the resulting masking line widths successfully with an average error of −0.3 mm and a standard deviation of only 0.06 mm. Figure 11 shows a plot comparison between the actual and predicted width values at the new tested input conditions.
Experimental data from the verification tests.
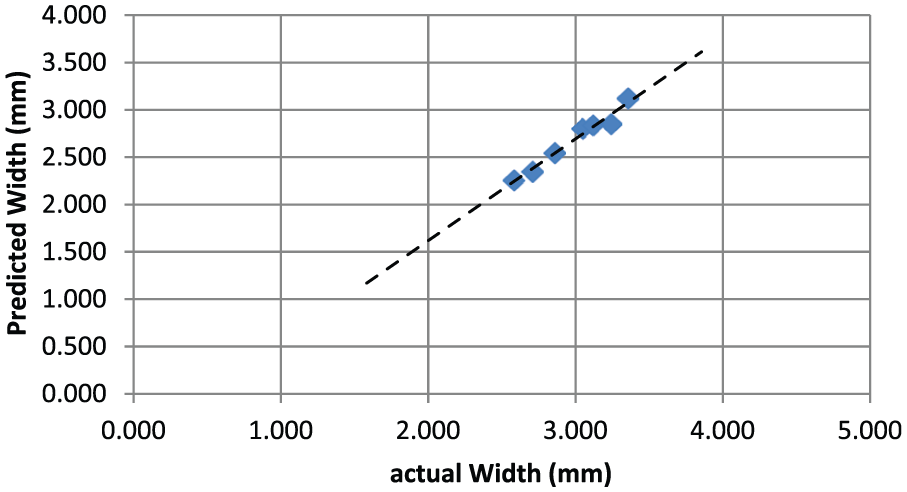
Comparison between the predicted and actual width of masking lines as a verification for the empirical model.
The temperature was kept constant during the initial experiment to develop the empirical model and was again kept constant for the verification experiment. However, it has been noted that there was a room temperature difference of nearly 4.5°C between the days of the development and verification experiments. This temperature difference is expected to be the cause of the systematic shift error witnessed in the results. Thus, insulating the syringe to limit the temperature variations alone is not sufficient, since room temperature may vary considerably on the long run, causing a slight deviation from the width values predicted by the model. Hence, for applications requiring enhanced accuracy, it is recommended to also heat the syringe to a fixed known temperature, to ensure that the system will always be operating at the same exact temperature and yield consistent masking results.
Surface masking test
A final experiment was conducted with the aim of verification of the proposed automatic masking approach by masking a rectangular area on a flat surface. The derived model was used to decide on the proper combination of process parameters necessary to mask a rectangular area on a flat surface. A programme was developed to automatically generate raster pattern paths for the robot arm based on the inputs parameters of (1) the starting point, (2) number of maskant lines, (3) line length, and (4) the spacing between lines. Currently, the first three inputs are provided by the user based on the geometry of the area to be masked, while the spacing parameter is automatically calculated based on the expected line width generated from the derived model. However, in future, a path-planning algorithm can aid in automating the first three inputs based on scanning the target area to be masked.
During this experiment, the robot arm was directed to place one corner of the rectangular test piece horizontally beneath the needle and record the coordinates of this point as the starting point. Knowing the dimensions of the test piece, the maskant line length was set to cover the length of the target plate, while the width of the plate and the desired number of lines in the raster pattern were fed to the controller to calculate the required line width and set the line spacing accordingly to achieve consistent area coverage. Since the number of lines must be an integer value and the width of each line can be varied as desired by adjusting the robot velocity, it made sense to supply the number of lines as a fixed input to the programme and rely on the derived empirical model to calculate the robot velocity that would result in the desired line width for a given input pressure and needle diameter. A pressure adjustment might be necessary if the resulting robot velocity is significantly larger than the maskant flow velocity. This might otherwise result in the dispensing of discontinuous lines as previously discussed. Hence, the value of the applied pressure and the needle diameter have to be set manually at the beginning of the operation based on the required range of masking widths, so that the range of robot velocities required throughout the masking operation would not result in any discontinuities.
A sample test piece that was successfully masked is shown in Figure 12, which shows the result of masking an area of the plate following the raster pattern as described. An additional step to be implemented when more precise masking is required would be to apply a fine masking line accurately around the circumference of the area before filling the inside with thicker lines following a raster pattern. During the dispensing process, the robot velocity can be modified accurately with a fast response through the robot controller to increase the width of dispensing lines when filling large areas and reduce it when masking accurately around the circumference of the masked area.
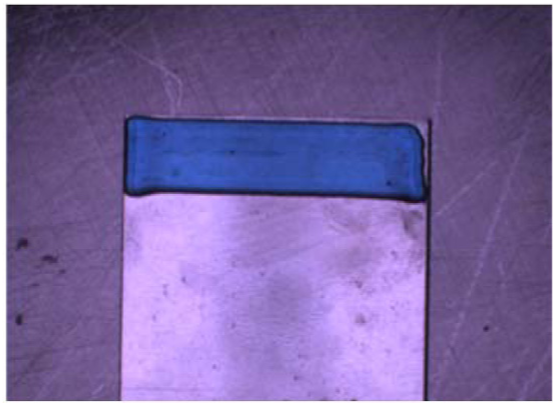
Masking a rectangular area on a flat plate.
Conclusion and future work
In this article, the T/P dispensing–based masking process using a robotic manipulator has been modelled mathematically and empirically in order to control the automated masking of areas with a consistent maskant layer. A mathematical model for the T/P dispensing process was derived, extending previous models from the literature by incorporating the robot velocity for controlled masking line width. The mathematical study laid the theoretical foundation for identifying the key parameters that affect the output of dispensing-based masking process. An experimental study was designed accordingly to derive an empirical model from the generated data that incorporates the losses that are otherwise difficult to model mathematically. The final empirical model was experimentally validated by dispensing masking lines under new combinations of input parameters, measuring their actual width values using image processing and comparing them to the values predicted by the model. The results showed a mean error of only −0.3 mm and a standard deviation of 0.06 mm, which confirms the perdition accuracy of the derived model for the tested operating range. In the final verification of the proposed approach, the proposed automated masking system was used to coat a planar area successfully with consistent coverage. This was achieved in a single stage as opposed to the current multi-stage manual masking, which is expected to reduce the overall masking time under similar conditions to around one-third of its current value (single masking and coating cycle rather than three).
The next stage of this work should involve masking of more complex objects, which will require investigating additional process parameters including the following: the needle angle, needle height, and robot velocity and acceleration. In addition, the simplification of the masking process into a steady-state one is only suitable for masking parts with simple geometries. However, for more complex shapes, precise dynamic control will be required for masking around edges, sharp corners, and intricate features. This will enable dynamic compensation for the start/end delay according to the chosen process parameter. Furthermore, automatic path generation will be an essential improvement to the current system in order to automatically decide the most efficient pattern for the robot to follow when filling the scanned target area.
Footnotes
Declaration of conflicting interests
The author(s) declared no potential conflicts of interest with respect to the research, authorship, and/or publication of this article.
Funding
The author(s) disclosed receipt of the following financial support for the research, authorship, and/or publication of this article: The reported work has been partially funded by the EPSRC Centre for Innovated Manufacturing in Intelligent Automation (EP/IO33467/1), which the authors have gratefully acknowledged.