
Abstract
Finding sustainable ways of machining exotic materials is gaining more and more importance in the manufacturing industry. Application of advanced measuring instruments for quantifying performance measures is a crucial requirement for making machining processes viable. The presented work aims to ameliorate machining of a high-strength β-titanium alloy using information from measurements of key responses, such as cutting energy consumption, tool deflection, and tool damage. Acoustic emission data and tool’s acceleration data are utilized to work out the magnitudes of energy consumed and deflection undergone by the tool, respectively. The article focuses on quantifying the effects of tool’s inertia, strength of work material, and two cutting parameters on the aforementioned responses. A total of 54 continuous cutting experiments are performed in which a fixed volume of material per experimental run is removed. Tool deflection method helped to determine the significant effects of varying tool inertia, work material strength, and cutting speed on the machining process. Likewise, acoustic emission method highlighted the strong effects of material strength and cutting speed caused on the cutting energy consumption. The effect of feed rate is found to be significant regarding tool wear only. Finally, the tool wear data are tested for correlation against the corresponding data sets of the other two responses. It is found that both tool deflection and cutting energy possess strong uphill relationships with tool wear.
Introduction
A lot of research effort is being carried out to make machining processes more sustainable by optimizing cutting parameters, selecting right cutting tool material, and applying appropriate cutting fluids. Machining sustainability is realized by simultaneously achieving the goals of reduced energy consumption, high productivity, low cost of production, and less generation of waste and toxic emissions. As the work material gets stronger and chemically more reactive, its sustainable machining conditions get hard to come by. Moreover, the opposing requirements of key performance measures/sustainability metrics, with regard to optimizing input parameters, add to complexity of the goal.
Hi-tech measuring instruments and their apt usage for precise and accurate evaluation of performance measures are vital for correct optimization of machining processes. True measurements of key performance measures, such as energy consumption, tool wear, work surface roughness, and cutting forces, are dependent on modern measurement tools and systems. These systems become even more imperative for gauging machining of exotic work materials because of high levels of process costs involved. Among the advanced approaches adopted recently in the machining domain are the measurements of acoustic emission (AE) and tool’s acceleration during work material removal. Acoustic signals coming out of cutting zones possess rich data regarding metal cutting state, which can be processed to extract accurate quantifications of process responses, such as power and energy consumption. Moreover, emission frequencies of the acoustics are higher than those of machine vibrations and audible noise; thus, the true signals can be easily filtered out. 1 Likewise, the data related to tool’s acceleration can be helpful for evaluating tool displacement in various directions, which in turn can lead to estimation of other performance measures, such as machining vibrations, chatter, and tool damage state. A brief literature review covering the applications of the aforementioned measurement methods in machining domain is presented as follows:
Maradei et al. 2 reported that acoustic signals are directly related to the machining condition, since they are generated by plastic deformation, debris fracture, abrasion, and crack propagation. Acoustic data, thus, are admissible for estimation of power consumed by a machining process. Li has described that the application of AE in machining is a process divided into the following three steps: AE generation in metal cutting processes, AE signal processing with various methods, and pattern classification for estimation of the process state. 3 Tool flank wear was estimated using wavelet representation of AE data by Kamarthi et al. 4 The authors have claimed superiority of wavelet representation over Fourier transform in computing AE power spectral density. Min et al. 5 have used AE for accurate measurement of cutting tool length and setting up of work coordinates in an ultra-precision machining process. Guo and Ammula 6 have reported monitoring of work surface integrity, including formation of white layer, in hard machining using a real-time AE monitoring system. Neslušan et al. 7 have reported detection and prediction of catastrophic failure of a cutting tool made of a brittle material using AE. The authors have also claimed success in characterization of chip formation with the acoustic signals. In a recent publication, a relationship between audible acoustic signals in a machining process and resulting work surface finish has been worked out. 8 An estimation accuracy in excess of 95% is claimed. Maia et al. 9 have reported estimation of tool wear and prediction of tool life based on AE data in turning of AISI 4340 steel. Another work has focused on estimation of tool’s flank wear using AE signals. 10 The authors have used the root mean square value of AE recorded at the chip-tool contact to detect the progression of flank wear in turning of a titanium alloy with coated carbide tool. Similarly, Bhaskaran et al. 11 have used the skew and kurtosis parameters of the root mean square values of AE signal to estimate tool wear in a hard turning process. Cedergren et al. 12 have studied the effect of heat-treatment controlled work material microstructure on cutting forces and AE and correlation of these responses with chip morphology in machining of Ti-6Al-4V alloy. Devin and Rychev 13 have put forward an experimental investigation to split AE signals into two groups: (1) those associated with chip formation and (2) those produced by tool–workpiece friction. Machai et al. 14 have presented a novel method for quantifying power and energy consumed in a metal cutting process by integrating amplitudes of acoustic signals comprising all recordable frequencies.
Ryu et al. 15 have utilized tool deflection data for predicting form error in side wall milling process. Oliaei and Karpat 16 have studied the influence of milling forces due to tool wear on tool deflections and tool breakage using a finite element method as well as an experimental approach. Duan et al. 17 have presented a method for measuring tool deflection in five-axis sculpture surface milling. The measured deflections were related to tool orientations to seek support for the study of tool orientation planning. Mamedov and Lazoglu 18 have presented an approach to predict tool deflections in order to control machining process and to avoid tool failure. A tool deflection model is developed and validated on micro-milling of an aerospace aluminum alloy. Suyama et al. 19 have described the effects of tool deflections on work surface roughness in internal turning of long holes in hardened AISI 4340 steel. The reported work has utilized two levels of tool overhang for each of steel and carbide tool holders.
Magnitude of cutting energy consumed per unit volume of material removed (specific cutting energy) is considered as one of the most important metrics of machining sustainability. High levels of this metric correspond to high levels of electricity production and as a high proportion of electric energy comes from burning fossil reserves, it relates indirectly to the increased impact on natural resources and the environment. Mativenga and Rajemi 20 have presented an experimental work and a search method for finding ideal cutting speed, feed rate, and depth of cut for minimizing energy consumption in a turning process. In another experimental work, the machinability of Ti-6Al-4V has been compared with that of a high-strength low alloy steel in respect of specific energy consumption, tool damage, and cutting forces under various modes of cryogenic cooling. 21 It was found that in most of the cooling modes, machinability of the titanium alloy remained worse than that of the alloy steel. Recently, a multi-pass turning process has been investigated for simultaneous minimization of specific energy consumption and machining quality. 22 Jia et al. 23 have presented an approach for modeling cutting energy of a machining process undertaken at variable material removal rates. Energy calculations regarding four kinds of end face turning processes were performed and a prediction accuracy of 90% was claimed. Priarone et al. 24 have presented a model for the system-level energy analysis of machining processes, which encompasses material production, material removal, tool and cutting fluid production and usage. The model was applied to turning of a commonly used titanium alloy under dry, wet, and near-dry machining conditions. Another study has reported that cryogenic cooling in machining of Ti-6Al-4V alloy yields longer tool life than flood coolant and dry machining. 25 The authors have also reported that cryogenic cooling can help attain lower levels of specific cutting energy in machining of the titanium alloy as higher level of cutting speed can be employed in comparison with dry machining. In an experimental investigation, the cutting parameters, namely, spindle speed, feed rate, and depth of cut were optimized for the sake of minimizing tool wear, surface roughness, and cutting forces in micro-milling of Ti-6Al-4V. 26 A recent study has put forward quantification of the effects of segmentation-driven vibration on the end milling’s performance measures. 27 The experimental investigation based on the milling of Ti-6Al-4V has found that the frequency of chip segmentation possesses significant effects on tool vibration, cutting forces, and work surface texture.
β-titanium alloys possess excellent mechanical and anti-wear properties and, thus, are considered as highly difficult-to-machine materials. It has been reported that β-alloys are most difficult to machine among all the titanium alloys. 28 The cutting process is characterized by accumulation of intense heat around the cutting edge of the tool that drastically accelerates its damage. Various levels of material strength can be achieved by varying heat-treatment process. Stronger β-alloys are obtained by precipitating higher proportions of α-particles in β-phase and by deeper solid solution strengthening. 29 Arrazola et al. 30 have reported greater difficulty encountered in machining a β-titanium alloy as compared to Ti-6Al-4V, especially at cutting speeds in excess of 90 m/min. Machai and colleagues1,14 have utilized Joule-Thompson effect of cooling by expanding compressed stream of CO2 gas close to cutting region in continuous machining of a β-titanium alloy (Ti-10V-2Fe-3Al). The authors have reported significant enhancement of tool life. Bai et al. 31 have utilized fine-grain WC/Co (tungsten carbide/cobalt) tools in dry turning of a β-titanium alloy (Ti-10V-2Fe-3Al). They found that the damage on the flank face was caused by micro-chipping and also that adhesion incurred on the rake face was more pronounced than that on the flank wear. In another study, the effects of using physical vapor deposition (PVD)-coated carbide cutters were investigated in interrupted machining of an α + β titanium alloy (Ti-6Al-4V) and a near β-titanium alloy (Ti 5553). 32 Ti5553 was found to be more difficult-to-cut than Ti-6Al-4V at the same cutting conditions because of existence of higher temperatures in the cutting regions. Sun et al. 33 have reported an experimental study aimed for improving machinability of Ti 5553 alloy by using cryogenic cooling, minimum quantity of lubrication (MQL), and flood cooling. In total, 30% reduction in cutting forces was reported with cryogenic cooling when compared with flood cooling and MQL. The effect of varying fraction of β-phase in titanium alloys was experimentally investigated on the tool wear characteristics of a turning process. 34 Abrasion, abrasion with built-up edge, and plastic deformation of cutting edge were found to be the main tool damage mechanisms in α, α + β, and β-rich alloy, respectively.
This article aims to utilize tool deflection and AE data to quantify the important machining sustainability metrics: cutting energy and tool damage. The presented work focuses, mainly, on experimental investigation of the effects of varying tool inertia and work material strength on the aforementioned metrics and tool deflection. The aforementioned literature review suggests that most of the published work has focused on application of cryogenic coolant for enhancement of tool life in machining of titanium alloys. It means they have relied on just one way of increasing machinability of titanium alloys, that is, suppression of temperature-dependent tool damage modes by efficiently dissipating process heat from the cutting zones. They have overlooked a very important aspect of machining viability, which is process’ dynamic stability. This aspect gains more vitality when machining of stronger forms of titanium is performed at higher cutting speeds. The current work has addressed this issue by quantifying machining dynamic stability in terms of tool deflections, attempting to suppress them by increasing inertia of the tooling system and finding a correlation between tool deflections and tool wear. Another facet of this work’s novelty is the quantification of cutting energy consumption by processing acoustic signals emitted by the machining zones. The previous papers have mostly relied on measurement of electric current drawn by machine tools in quantification of cutting energy. Furthermore, the current work has also investigated the possibility of the estimating tool wear state through the responses of cutting energy consumption and tool displacement area.
Experimental work
This section presents the details regarding the machining process investigated, experimental setup, work material, controlled predictors, measured responses, fixed parameters, measuring instruments utilized, and experimental results.
The process, predictors, and responses
The machining process chosen for experimental work is cylindrical grooving. The process creates a channel in the cylindrical surface of a rotating work by radially feeding in the tool. It is the process which most closely resembles orthogonal cutting process. The following four predictor variables are controlled in the experiments:
Work material’s yield strength, Rp (MPa);
Additional inertia of the tooling system characterized by extra weight applied to the tool holder, W (kg);
Cutting speed, Vc (m/min);
Feed rate, f (mm/rev).
Table 1 presents the levels of the four predictor variables tested in the experiments. This is to be noted that all the four predictors are numeric. Three levels each of first three predictors and two of the fourth generate a total of 54 (=3 × 3 × 3 × 2) experimental runs following a full-factorial design.
Levels of the four predictors controlled in the experimental work.
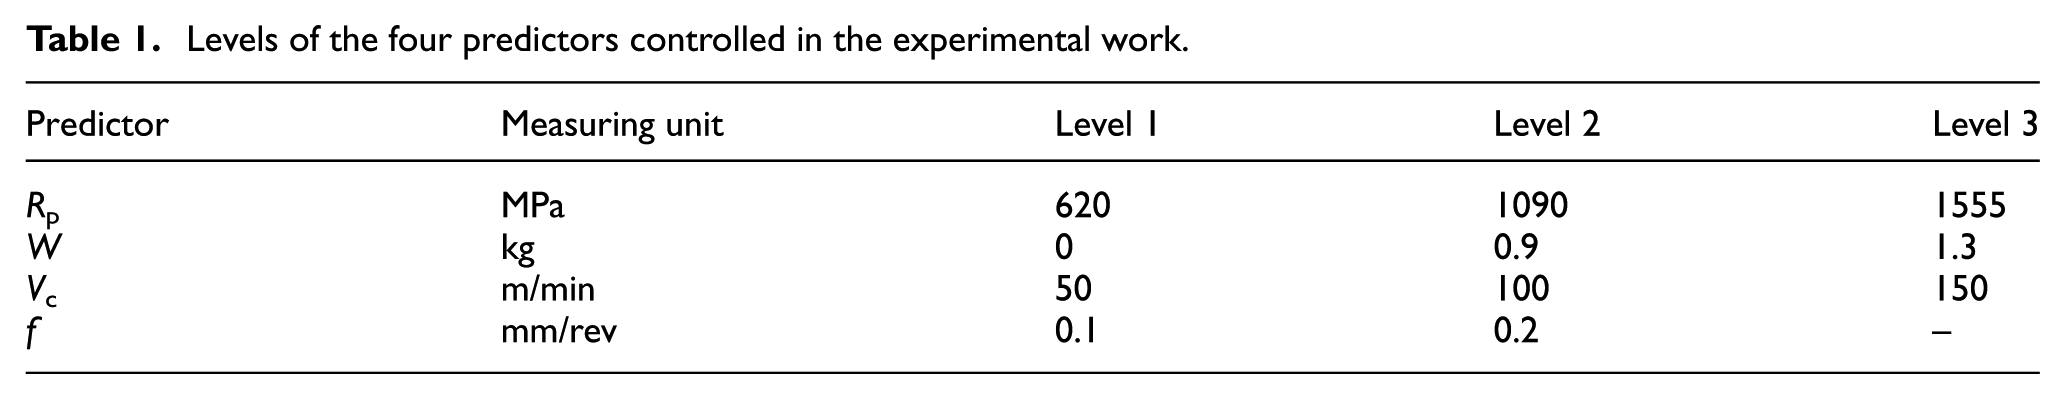
The work material used in the experimental runs is Ti-10V-2Fe-3Al, a metastable β-titanium alloy. For this work, the alloy is used in the form of wrought solid rods, 45 mm diameter each, heat-treated to achieve three distinct levels of yield strength. The first level of Rp, as shown in Table 1, is achieved by solution treatment. The alloy is heated to a temperature of 830 °C followed by water-quenching. The two stronger states of the alloy are achieved by solution treating and age hardening. Level 2 was obtained by following the three steps: (1) heating up to 830 °C with a soaking time of 1.25 h followed by water-quenching; (2) heating up to 725 °C with a soaking time of 1.25 h followed by air cooling; and (3) heating up to 540 °C with a soaking time of 8 h followed by air cooling. Level 3 is the strongest possible temper state of Ti-10V-2Fe-3Al, which is achieved by following the two steps: (1) heating up to 830 °C with a soaking time of 45 min followed by air cooling and (2) heating up to 480 °C with a soaking time of 8 h followed by air cooling. The measured elongation and hardness (HV30) values of the tempers associated with levels 1, 2, and 3 are 35% and 350 HV, 9% and 390 HV, and 0.5% and 420 HV, respectively.
One groove was cut per experimental run and a new cutting insert was used for cutting each groove. Before start of the experiments, square shoulders with 3 mm width and 5 mm depth were cut into the cylindrical surface of the work material rods so as to avoid frictional interference with groove walls and get true measurements of the responses. The following three responses were measured for each experimental run:
Tool displacement area (TDA) (μm2). TDA is the effective area of the two-dimensional space (the one normal to the feed direction) swept by the cutting insert because of its forced displacement during the machining process.
Energy consumed in cutting one groove, E (dB), as determined from the AE signals.
Average width of flank wear land after cutting one groove, VB (μm).
TDA is a response variable that gives measure of the process’s dynamic stability. A low value of TDA represents a dynamically stable process. Among other machining parameters, such as work material strength, cutting speed and feed, and tool geometry, its value depends also on tool damage state. E is an important sustainability metric that gives indication of amount of energy consumed in removing a given volume of material. VB is a measure of tool damage. Its low value is desirable as it would lead to long tool life and, consequently, low processing cost.
Experimental setup
The experimental runs are carried out on a CNC horizontal lathe “Monforts RNC 200A” having maximum spindle speed and motor power of 6000 r/min and 9 kW, respectively. TiN-coated cemented carbide inserts “N123G2-0300-003” having cutting edge width (ap) 3 mm (equal to width of each shoulder), corner radius (rε) 0.3 mm, rake angle (γ) 10°, and clearance angle (α) 0° are used for the grooving process. A total of 27 grooving inserts are used in the experiments as each insert possesses two cutting edges and cutting of each groove is done with a new cutting edge.
Emulsion (a 6% oil-to-water mixture)-based flood coolant was applied at the cutting region to dissipate the machining heat. The aforementioned emulsion stoichiometry is the one recommended for machining difficult-to-cut materials at high cutting speeds. Figure 1 presents the experimental setup.
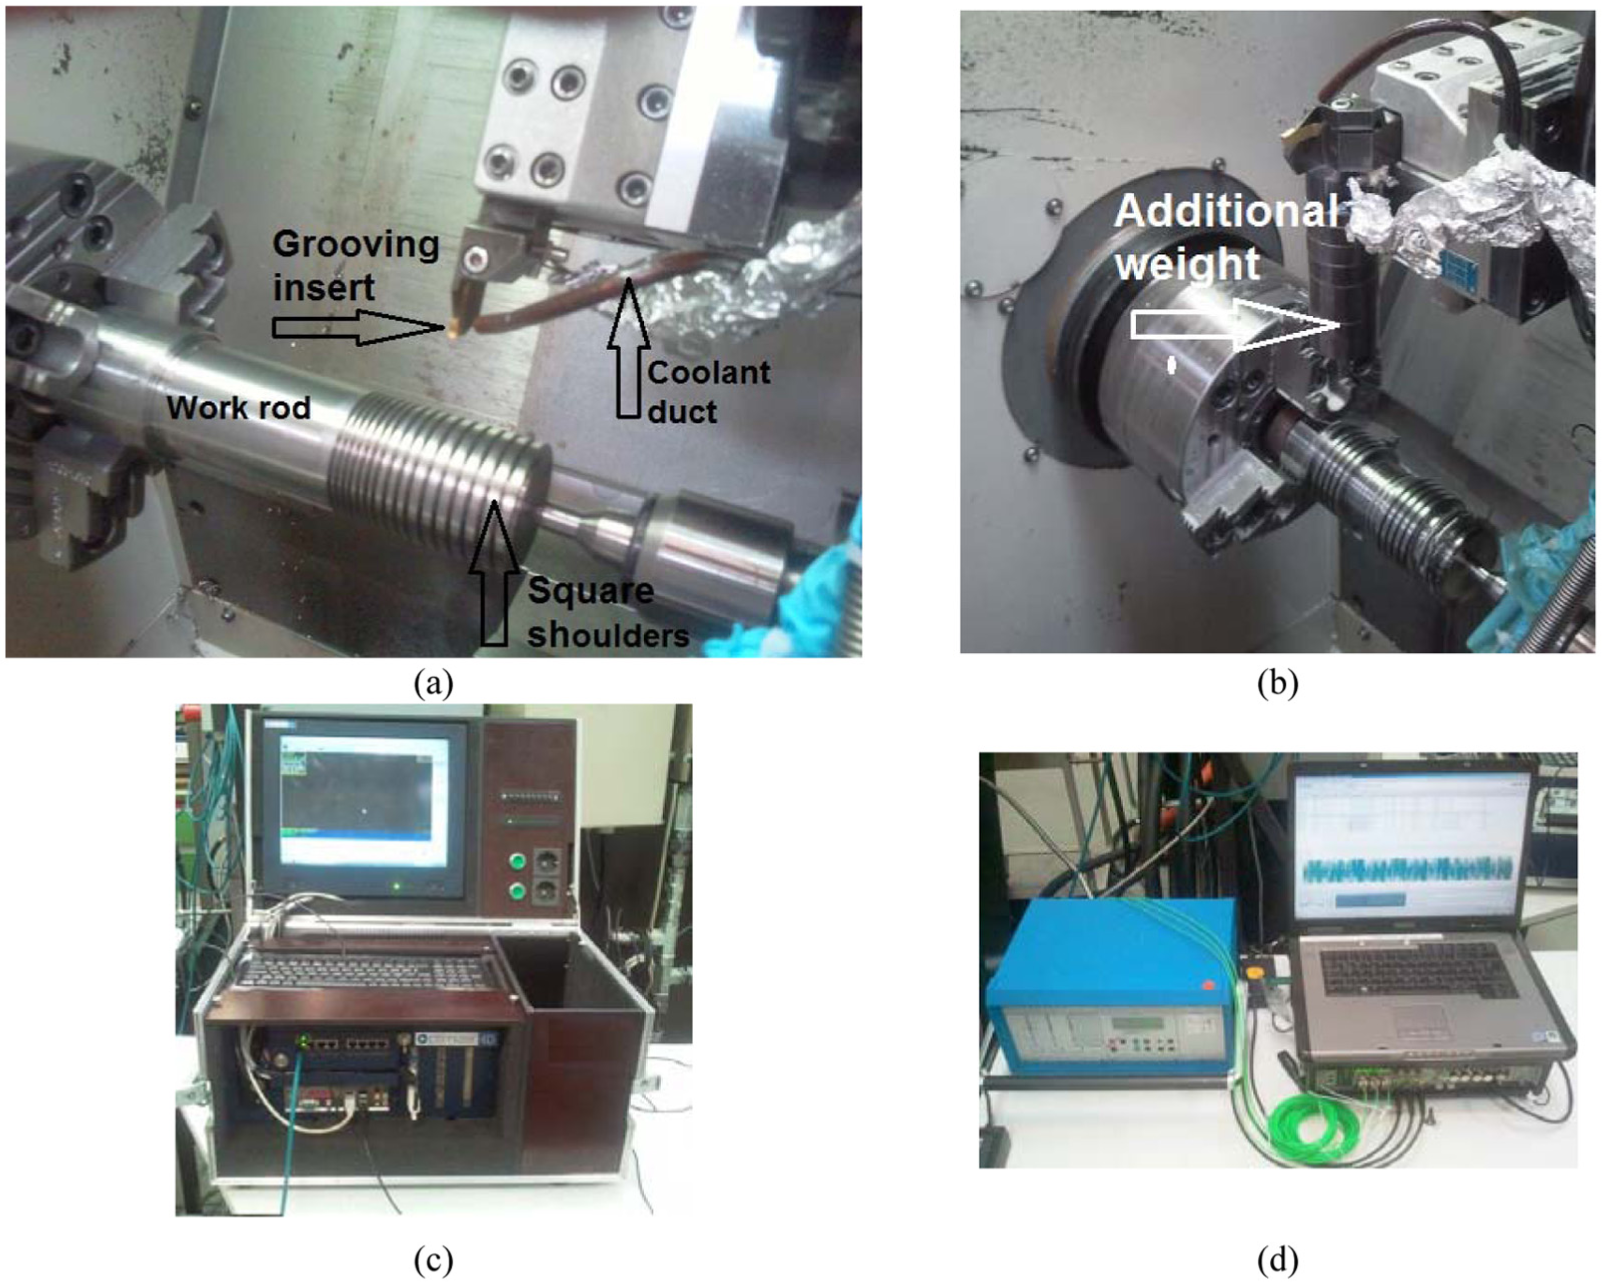
Experimental setup: (a) the work and the cutting tool; (b) the provision of additional inertia provided at the bottom of the tool holder; (c) the AE sensing and processing equipment; and (d) the tool displacement measuring system.
Measurements
The VB of the used grooving inserts is measured using a compound microscope, Mitutoyo Tool Measuring Workstation, type MF. The scanning electron microscopy (SEM) images are taken with “Philips XL40 ESEM” microscope.
Acoustic signals emitted from the cutting zones are recorded by a high-frequency impulse measurement system, QASS Optimizer-4D (Figure 1(c)). The recorded data for each experimental run are in form of a three-dimensional (3D) distribution of emission amplitude (in dB) over a time (seconds)–frequency (kHz) plane. The recorded data are processed using MATLAB to get quantification of energy consumed in cutting the grooves. Figure 2(a) presents a 3D spectrogram of the unprocessed data (time–frequency–amplitude) for the experiment number 45 (Rp = 1555 MPa; W = 0.9 kg; Vc = 100 m/min; and f = 0.1 mm/rev). Figure 2(b) presents a two-dimensional (2D) spectrogram of the same set of acoustic data with colored contours indicating distribution of energy spectral density.
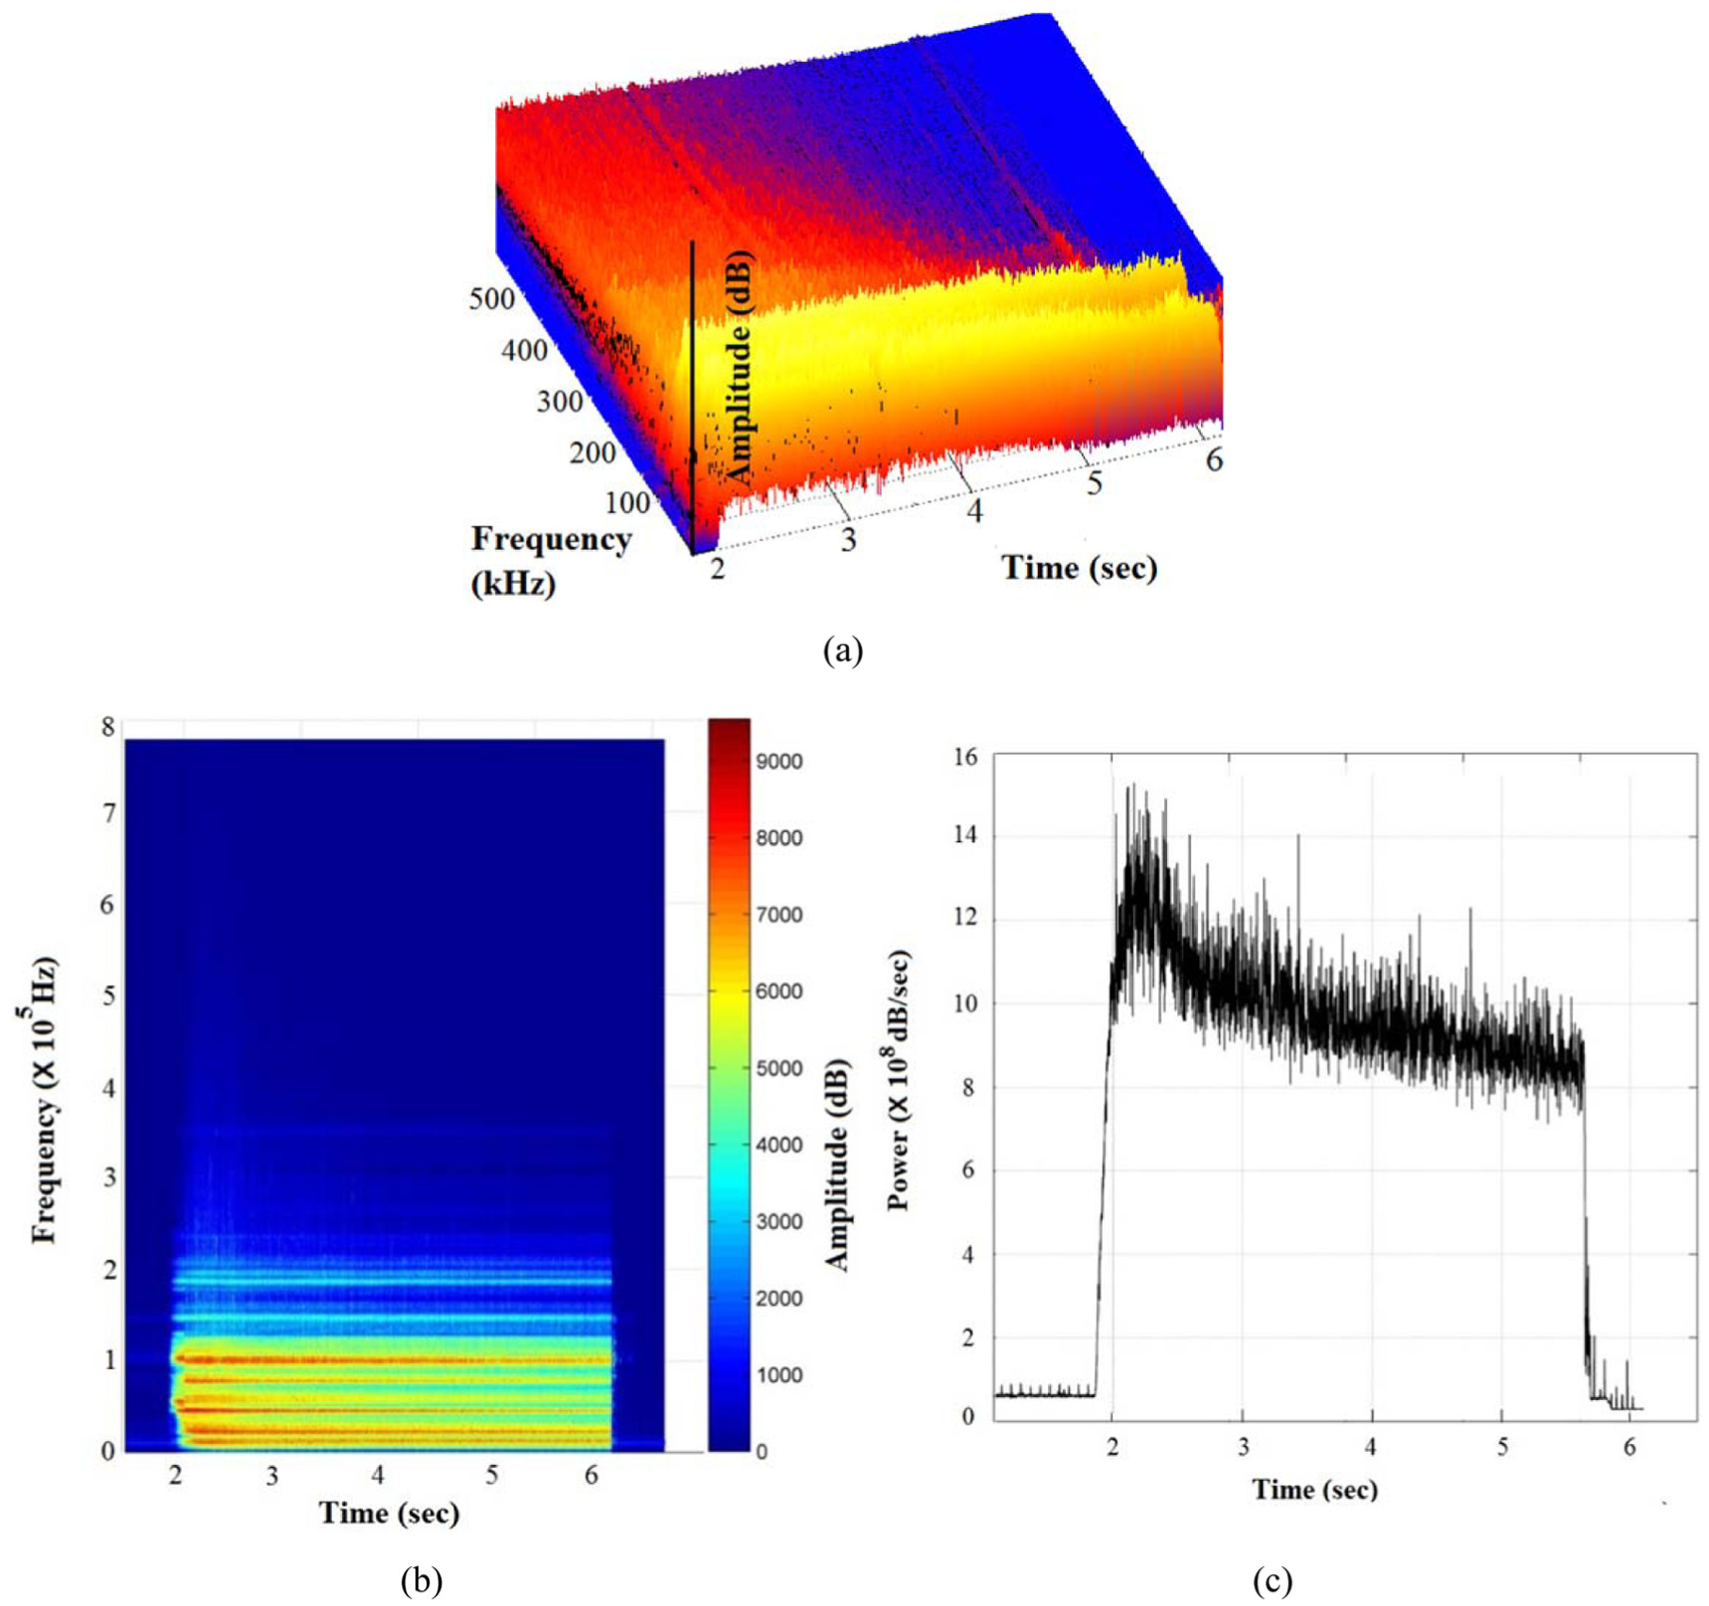
AE data processing for quantification of energy consumed in material removal: (a) 3D acoustic spectrogram relating time, frequency, and amplitude; (b) 2D spectrogram showing distribution of energy spectral density; and (c) Power–time graph obtained by integrating amplitude values for all frequencies against each time interval.
For this spectrogram, the amplitude of the given AE data is integrated for all the recorded frequencies against the given time intervals. The integration yields the value of power consumed by the machining process for each time interval, expressed in dB/s. The resulting power–time curve is shown in Figure 2(c). In the next step, the power values are integrated along the actual cutting time to get energy consumed (E) in dB for the given experimental run. This is to be clarified that E is a term solely representing the energy consumed in cutting process. It does not include energy consumed by other modules of the CNC lathe during cutting, such as coolant pump, control electronics, machine lighting, or others.
Tool deflection during cutting process is determined from the tool acceleration data. Tool acceleration is measured using Kistler 8395A triaxial MEMS capacitive accelerometer. The signals from the accelerometer sensor are augmented using a three-channel amplifier. The measurements, through an analog-digital converter, are stored on a standard computer with a LabVIEW-based data acquisition and processing software (Figure 1(d)). The acceleration data recorded along the two axes normal to the feed direction are twice integrated with respect to time to get tool deflection values along the two axes. The TDA values are obtained by computing areas of the rectangles formed by the extreme positions taken by the tools on both sides of the two axes.
Experimental results
This section presents the experimental results regarding tool deflection, cutting energy consumed, and tool’s flank wear.
Tool displacement area
Tool deflection is a measure of machining difficulty for a given combination of input parameters. Its low values reflect dynamic stability of a cutting process. Figure 3 presents the measurements of TDA for the 54 experimental runs. The scale on the TDA-axis is kept same for the three plots in order to have a clear, though modest, observation of the effect of material strength on tool deflection. The plots suggest that tool’s deflection during cutting is increased with increase in the material’s strength. Furthermore, the effect of increasing tool’s inertia on deflections is significantly positive, though it is not well pronounced when the additional weight is increased from 0.9 to 1.3 kg in machining of the two stronger tempers of the alloy. In addition, the two cutting parameters seem to have uphill relationships with TDA.
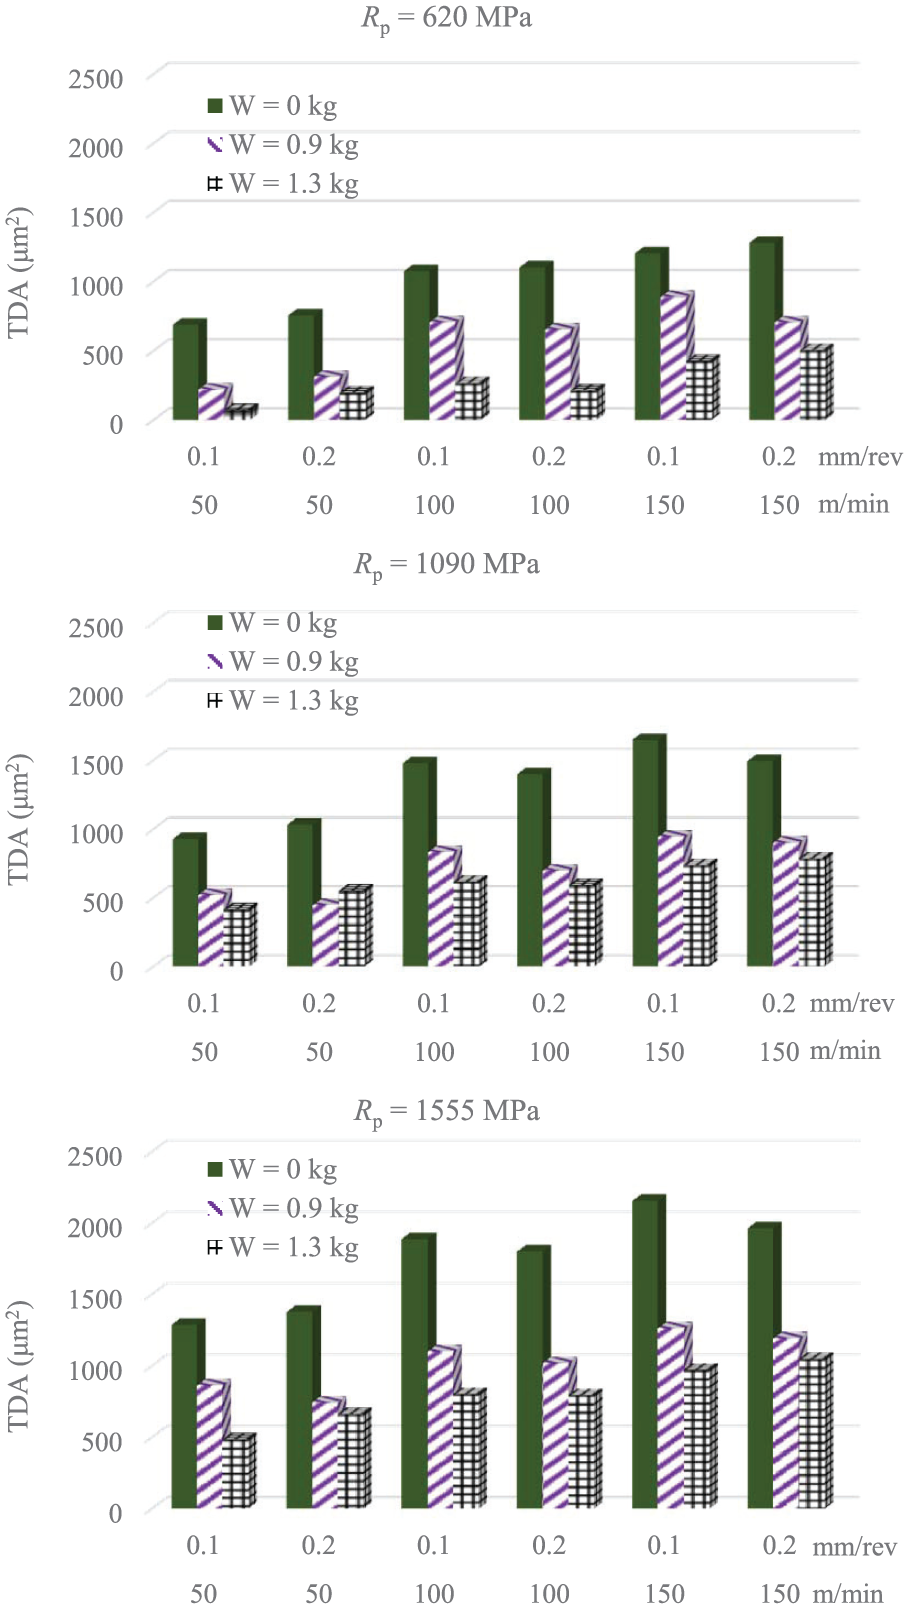
The three plots present the measured values of TDA for the 54 experimental runs.
For a thorough analysis of the experimental data regarding TDA, analysis of variance (ANOVA) is performed. The ANOVA results are summarized in Table 2. The analysis revealed that the most significant effect on TDA is of additional inertia of the tooling system (F-value = 209) followed by that of work material strength (F-value = 133) and cutting speed (F-value = 94). Contrary to the expectations, the effect of feed rate is found to be insignificant. The insights into the effects of material strength and cutting parameters on tool deflections and cutting vibrations have been well documented. High resistance to shear plastic deformation of work material, in the form of high strength, at high speed of contact between tool and work gives rise to intense chip serrations. These chip serrations induce strong vibrations in the machining system causing the tool to deflect in wayward directions.
Analysis of variance performed on the experimental results regarding TDA
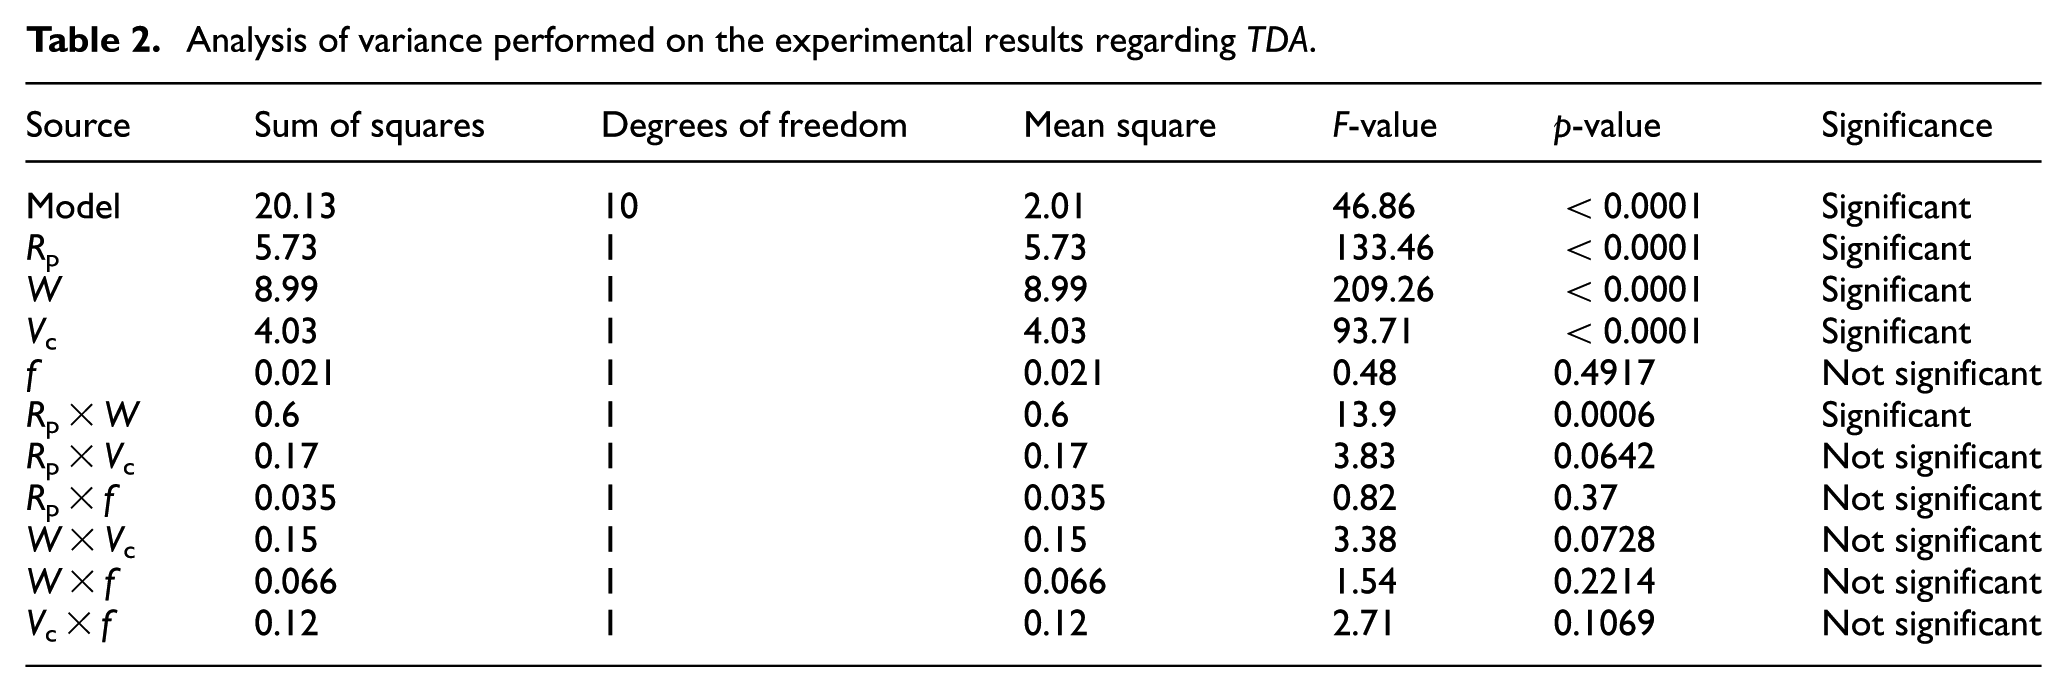
A significant finding of this work is that addition of extra weight to a tool for the sake of increasing inertia works favorably toward suppressing magnitude of tool deflections. The claim is supported by the ANOVA outcome, which reveals that W is the most influential predictor for the sake of quashing TDA. The addition of extra mass to the tool holder, as shown in Figure 1(b), raises the inertia of the tooling system. Higher level of inertia is helpful to curb the tool accelerations and ultimately the deflections. The curbed level of tool deflections is reflected by the low values of TDA for the runs involving high levels of W. It is interesting to look into the interactive effect of the top two influential predictors, W and Rp. The W × Rp interaction is statistically significant possessing an F-value of 14. It suggests that the effect of enhancing tool inertia on suppressing tool deflections is more pronounced for the soft material tempers. It seems that the employed levels of additional tool weight might not be adequate enough to effectively curb the stronger levels of chip serrations induced by the cutting of the stronger tempers of the β-titanium alloy. It was also found that the strong effect of tool inertia attenuates also with an increase in cutting speed.
The ANOVA results, with respect to the actual machining process, are realized in terms of factorial plots which relate the isolated effects of each predictor and significant interactions with the response. Figure 4 shows the factorial plots for TDA. Of all the plots, only the one related to f (the only insignificant predictor for TDA) is a near-horizontal line. The steepest curve is that of W, which is actually the most influential predictor for TDA. The analysis suggests that the machining process can be stabilized dynamically by controlling the significant predictors in a way that causes reduction in TDA. Specifically, keeping the low values of work material strength and cutting speed and high value of tool holder’s inertia will cause reduction in tool deflections and improve dynamic stability of the process.
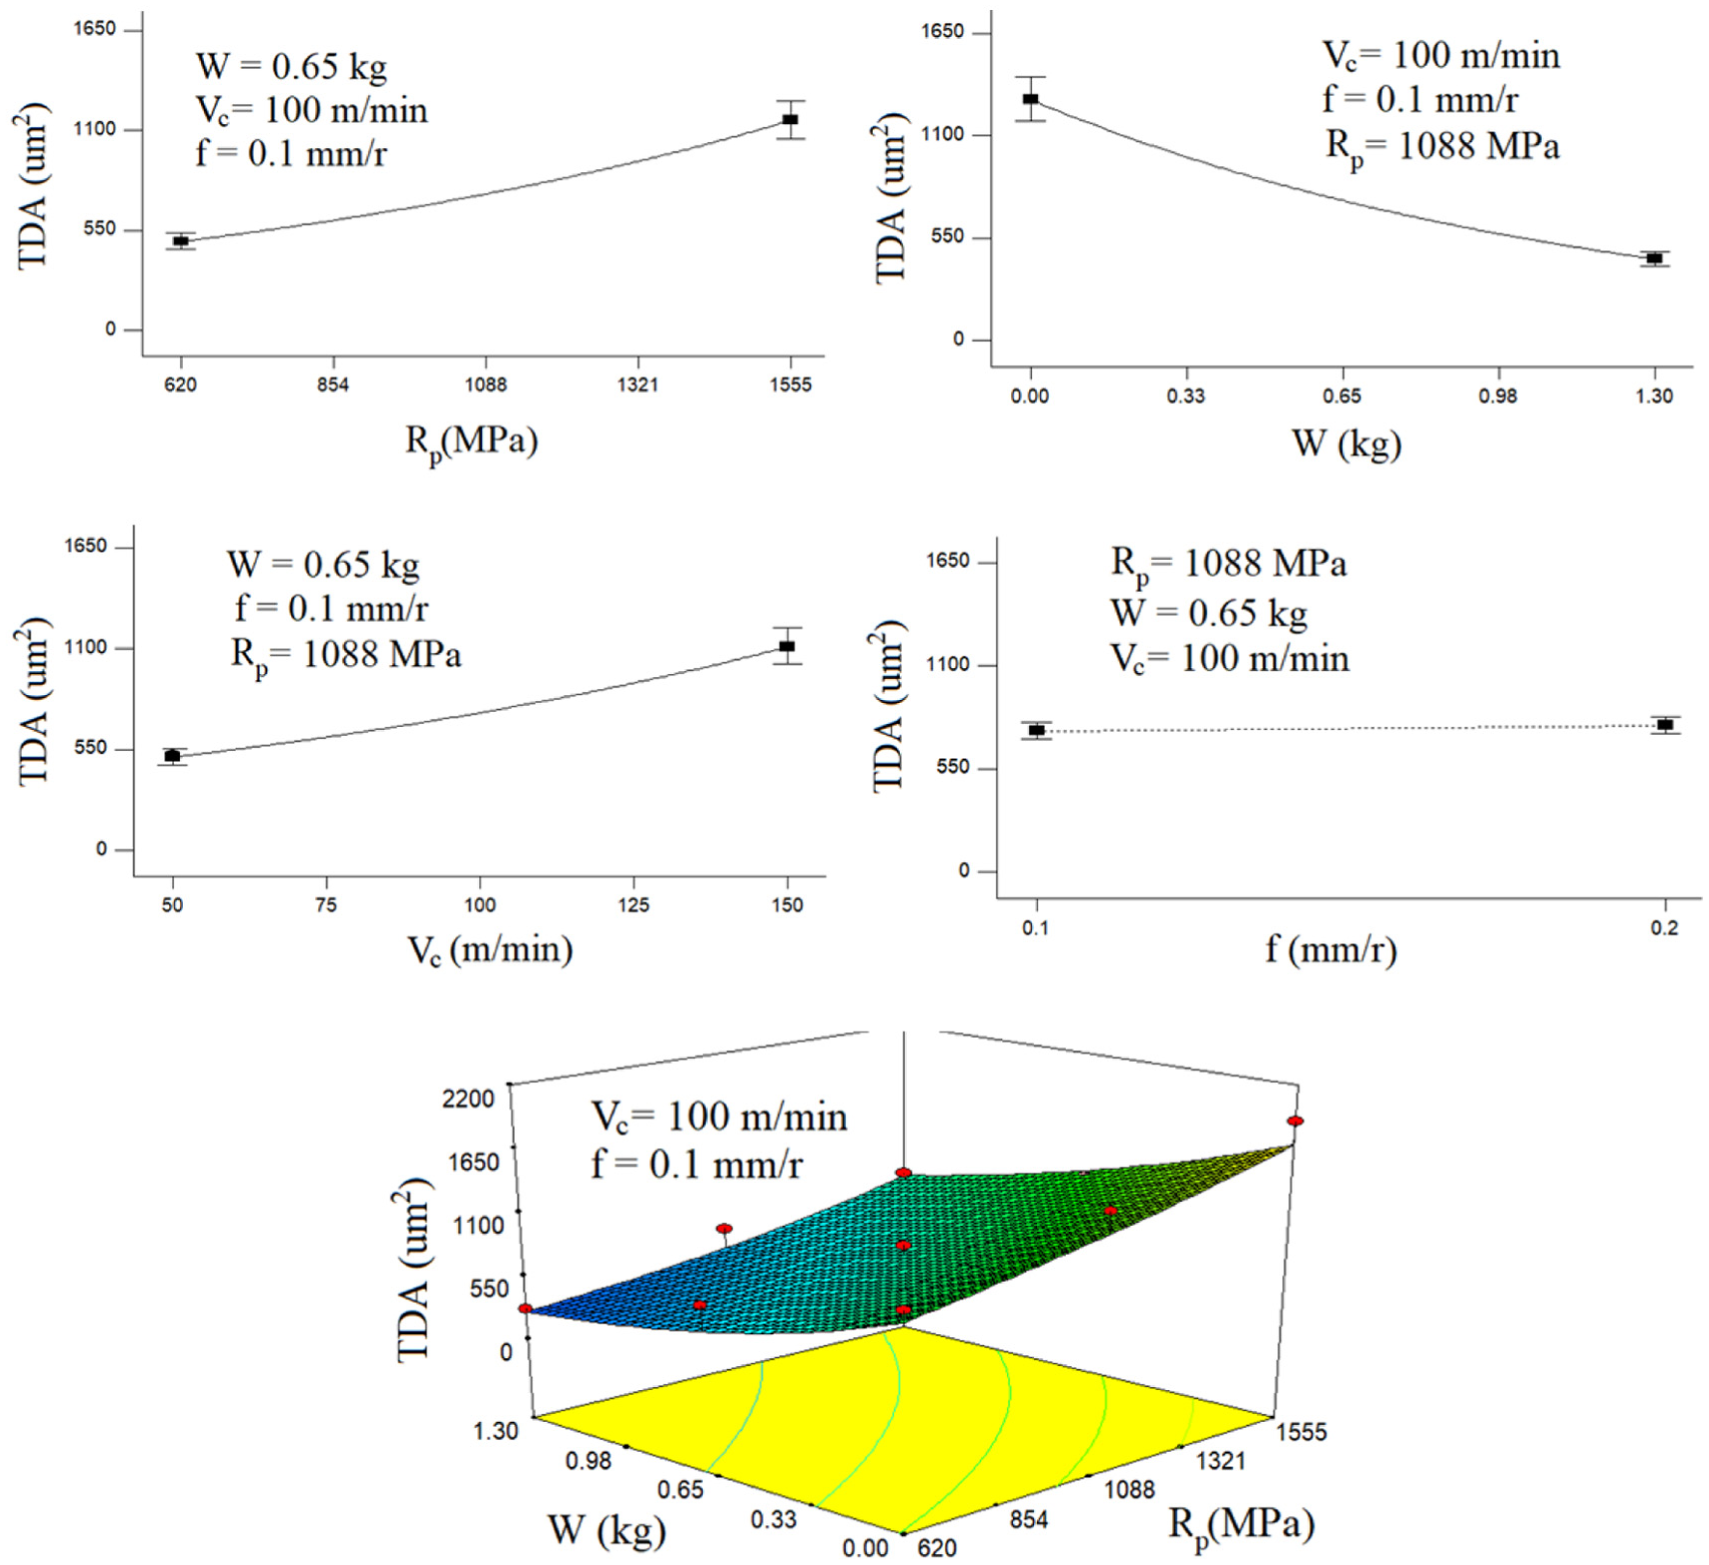
Factorial plots showing the main effects of Rp, W, Vc, and f and interactive effect of Rp and W on TDA
Figure 5 presents tool deflection plots which illustrate wayward movements of the cutting edges along the two axes perpendicular to the feed direction. A (0, 0) position is the one assumed by the center point of the cutting edge prior to contacting the work surface. The red contour in each plot represents the trajectory taken by the cutting edge’s center point during the first complete rotation of machining the respective shoulder.
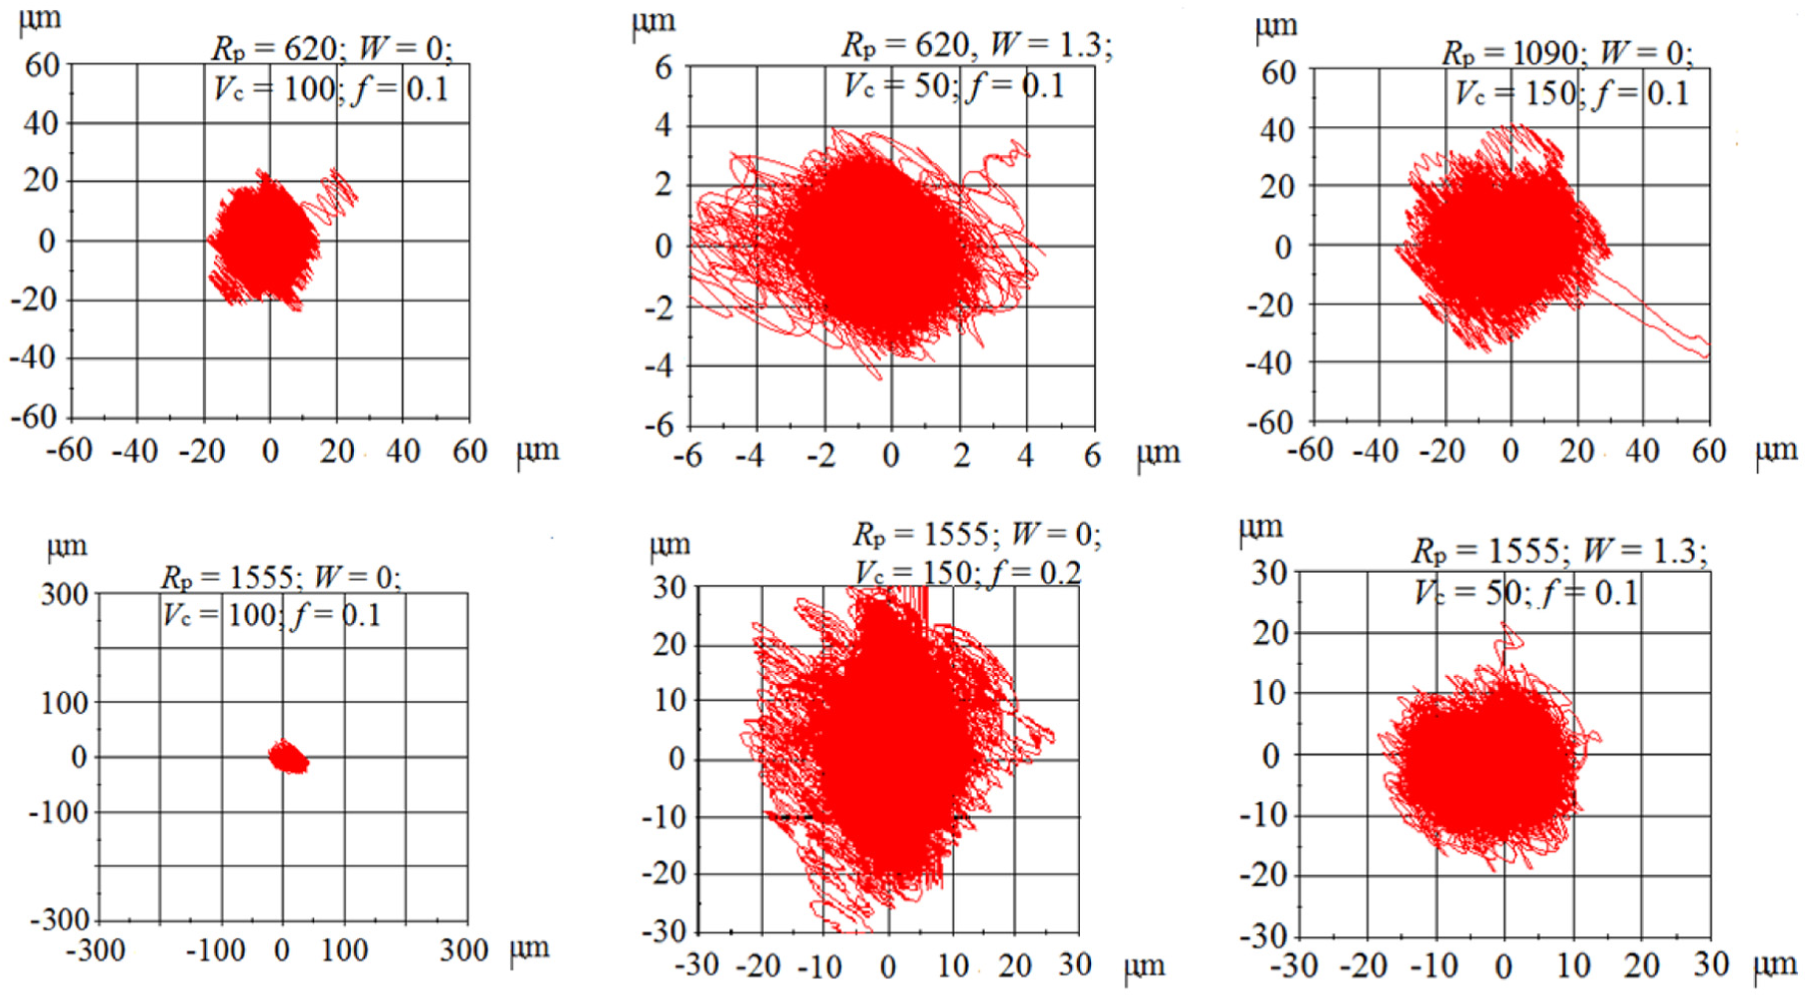
Tool deflection plots of selected experimental runs. The Rp, W, Vc, and f values shown on the images are presented in the units of MPa, kg, m/min, and mm/rev, respectively.
Cutting energy
Figure 6 presents the measurements of E for the 54 experimental results. It can be observed from the three plots that for each 3 bar pack of data grouped together, the mutual difference of bars’ heights is small. This suggests that tool inertia does not have a substantial effect on cutting energy. In all the three plots, E is observed to fall significantly after every two data packs suggesting that an increase in cutting speed (not feed rate) causes a noteworthy slash in cutting energy consumption. Furthermore, moving from the first plot to the second and from the second to the third of the same figure shows an enormous gain in average height of the data bars, suggesting that a stronger temper of the work material consumes a strikingly higher level of cutting energy.
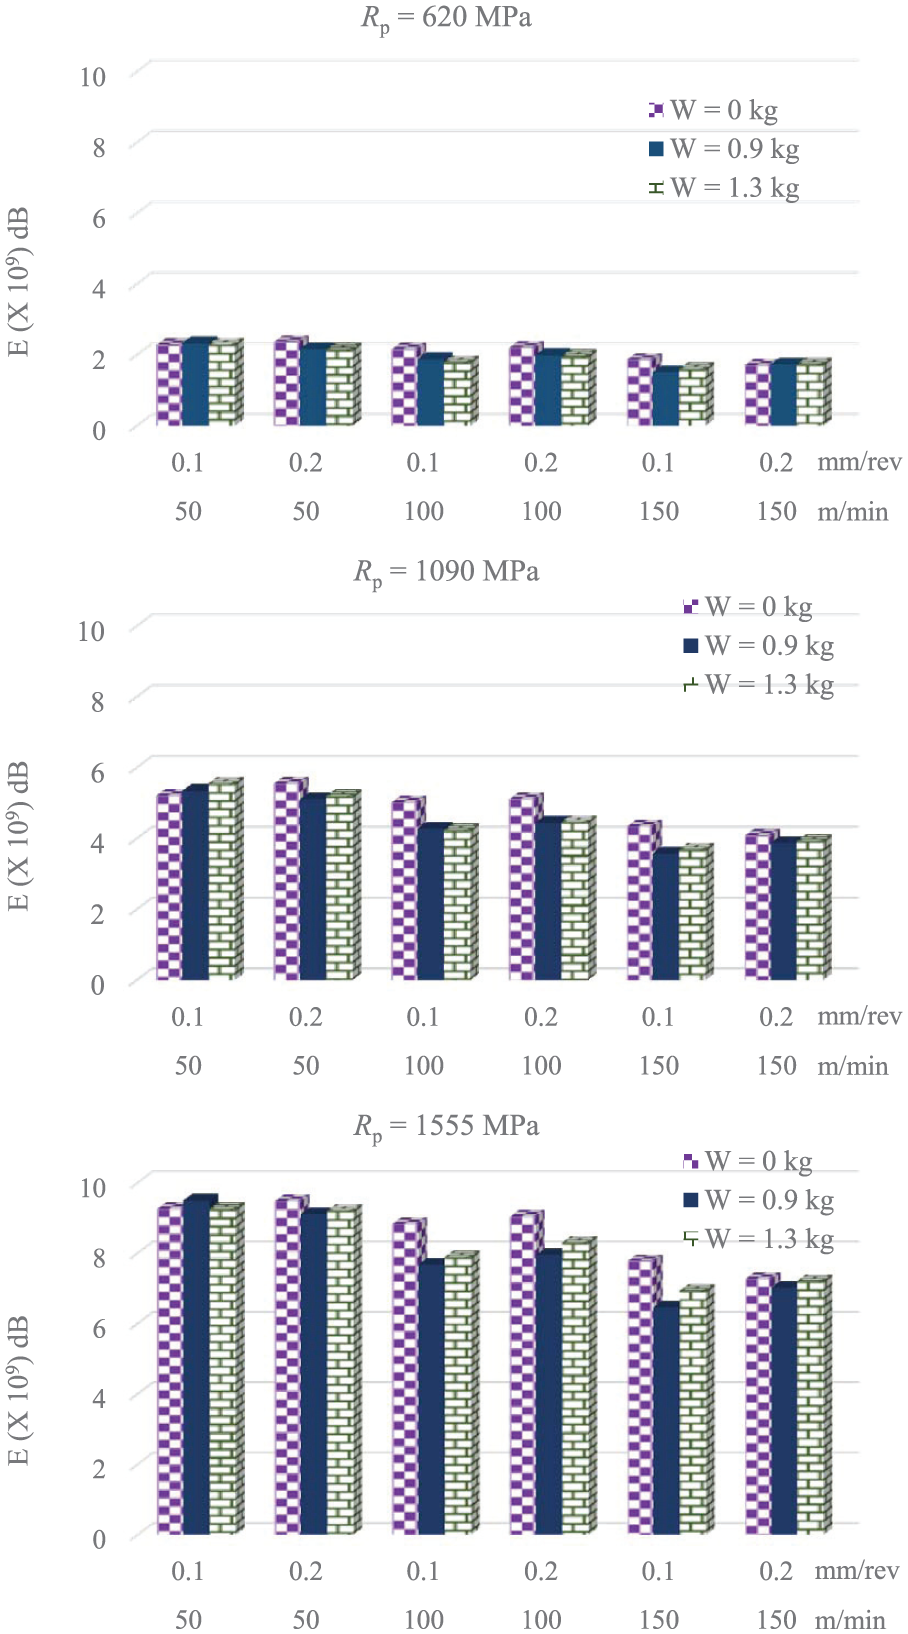
The three plots present the measured values of E for the 54 experimental runs.
Table 3 presents the results of ANOVA carried out on the energy consumption data. It reveals the following arrangement of the predictors and their interactions in descending order of significance of their effects:Rp (F-value=2663), Vc (F-value=133), Rp×Vc(F-value=30), W (F-value=7.6; marginally significant), and f (F-value = 0.47; insignificant). Remarkably dominant effect of work material’s yield strength on energy consumption is attributed to a high level of cutting force required to quell shear yield strength of the work material and convert a part of it into a chip. Thus, a strong temper of the material asks for a high level of energy for its cutting. A higher level of energy consumed in cutting is reflected by a wider frequency range and higher amplitudes of the emitted acoustic signals from the cutting zones. Processing of these signals results in higher values of E. It was observed that increase in cutting speed caused reduction in energy required to cut one groove. A plausible explanation of this observation is that high temperature instigated by cutting at the higher cutting speed levels might have caused decline in shear yield strength of the work material leading to the lower values of cutting energy, a phenomenon known as thermal softening.
Analysis of variance performed on the experimental results regarding E
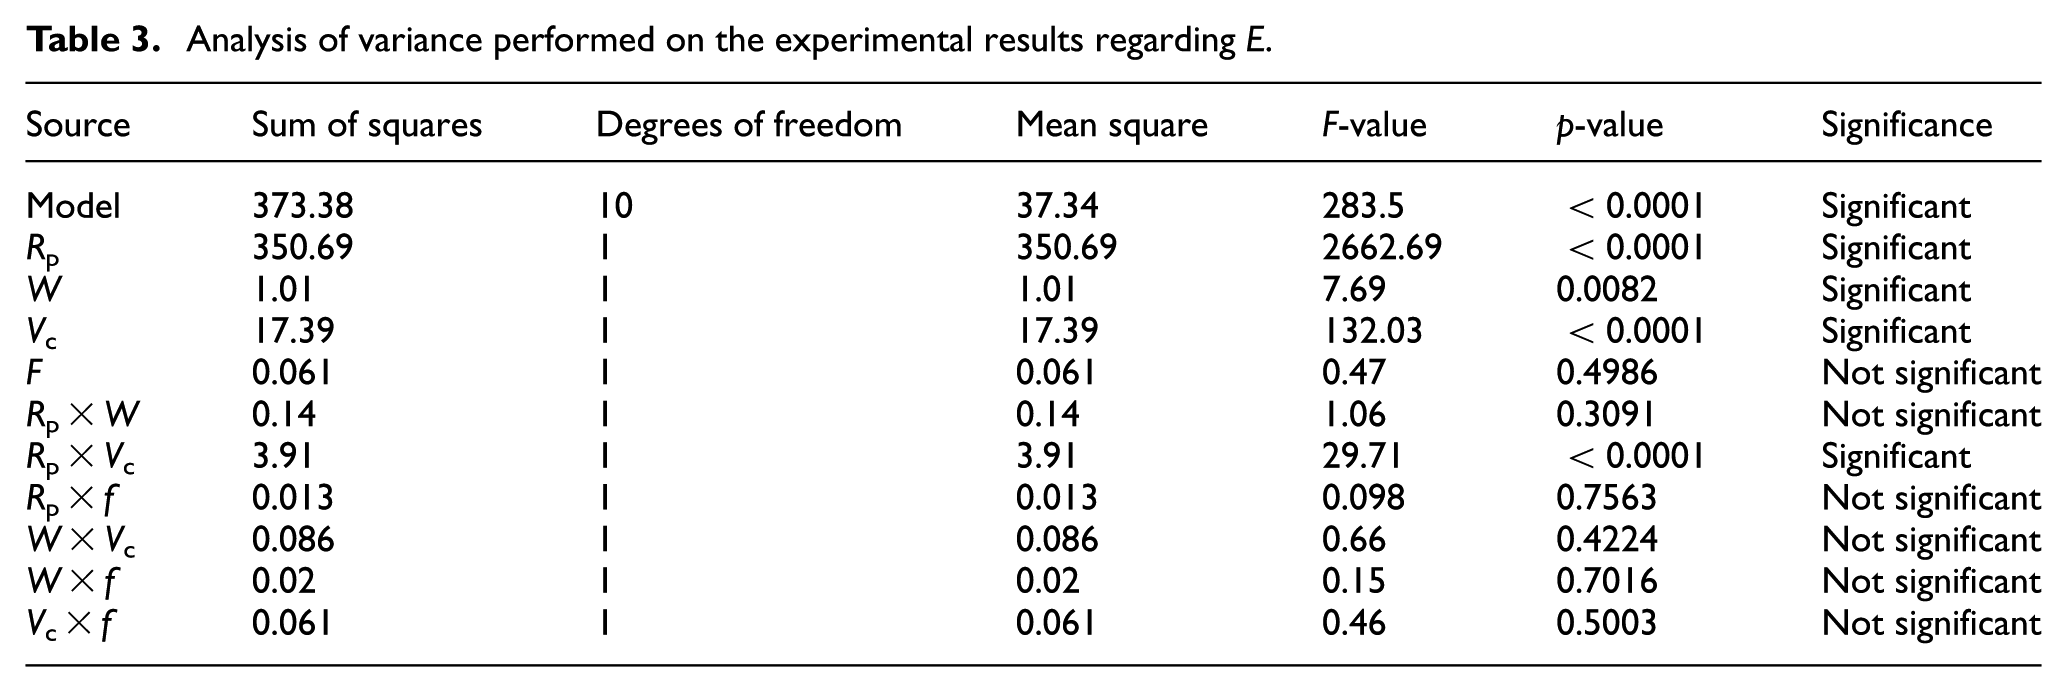
A closer look into the only significant interaction (Rp × Vc) suggests that the effect of reduction in cutting energy caused by an increase in cutting speed is more pronounced in machining of the strong tempers of the work material. Additional weight to the tool was applied for the sake of slashing tool deflections, not cutting energy. The W related results are in line with this expectation. Figure 7 provides the representation of the ANOVA results for the machining process in terms of factorial plots for cutting energy. The slopes of the lines clearly show that material strength is a far more influential predictor than the others. Once again, the plot of feed rate is a near-horizontal line suggesting insignificance of its effect on cutting energy. The analysis suggests that the grooving process can be operated at a minimum level of energy consumption by using high values of cutting speed and inertia of tool holder. Moreover, if material strength of the titanium alloy is a factor of choice, then its low value must be chosen for machining.
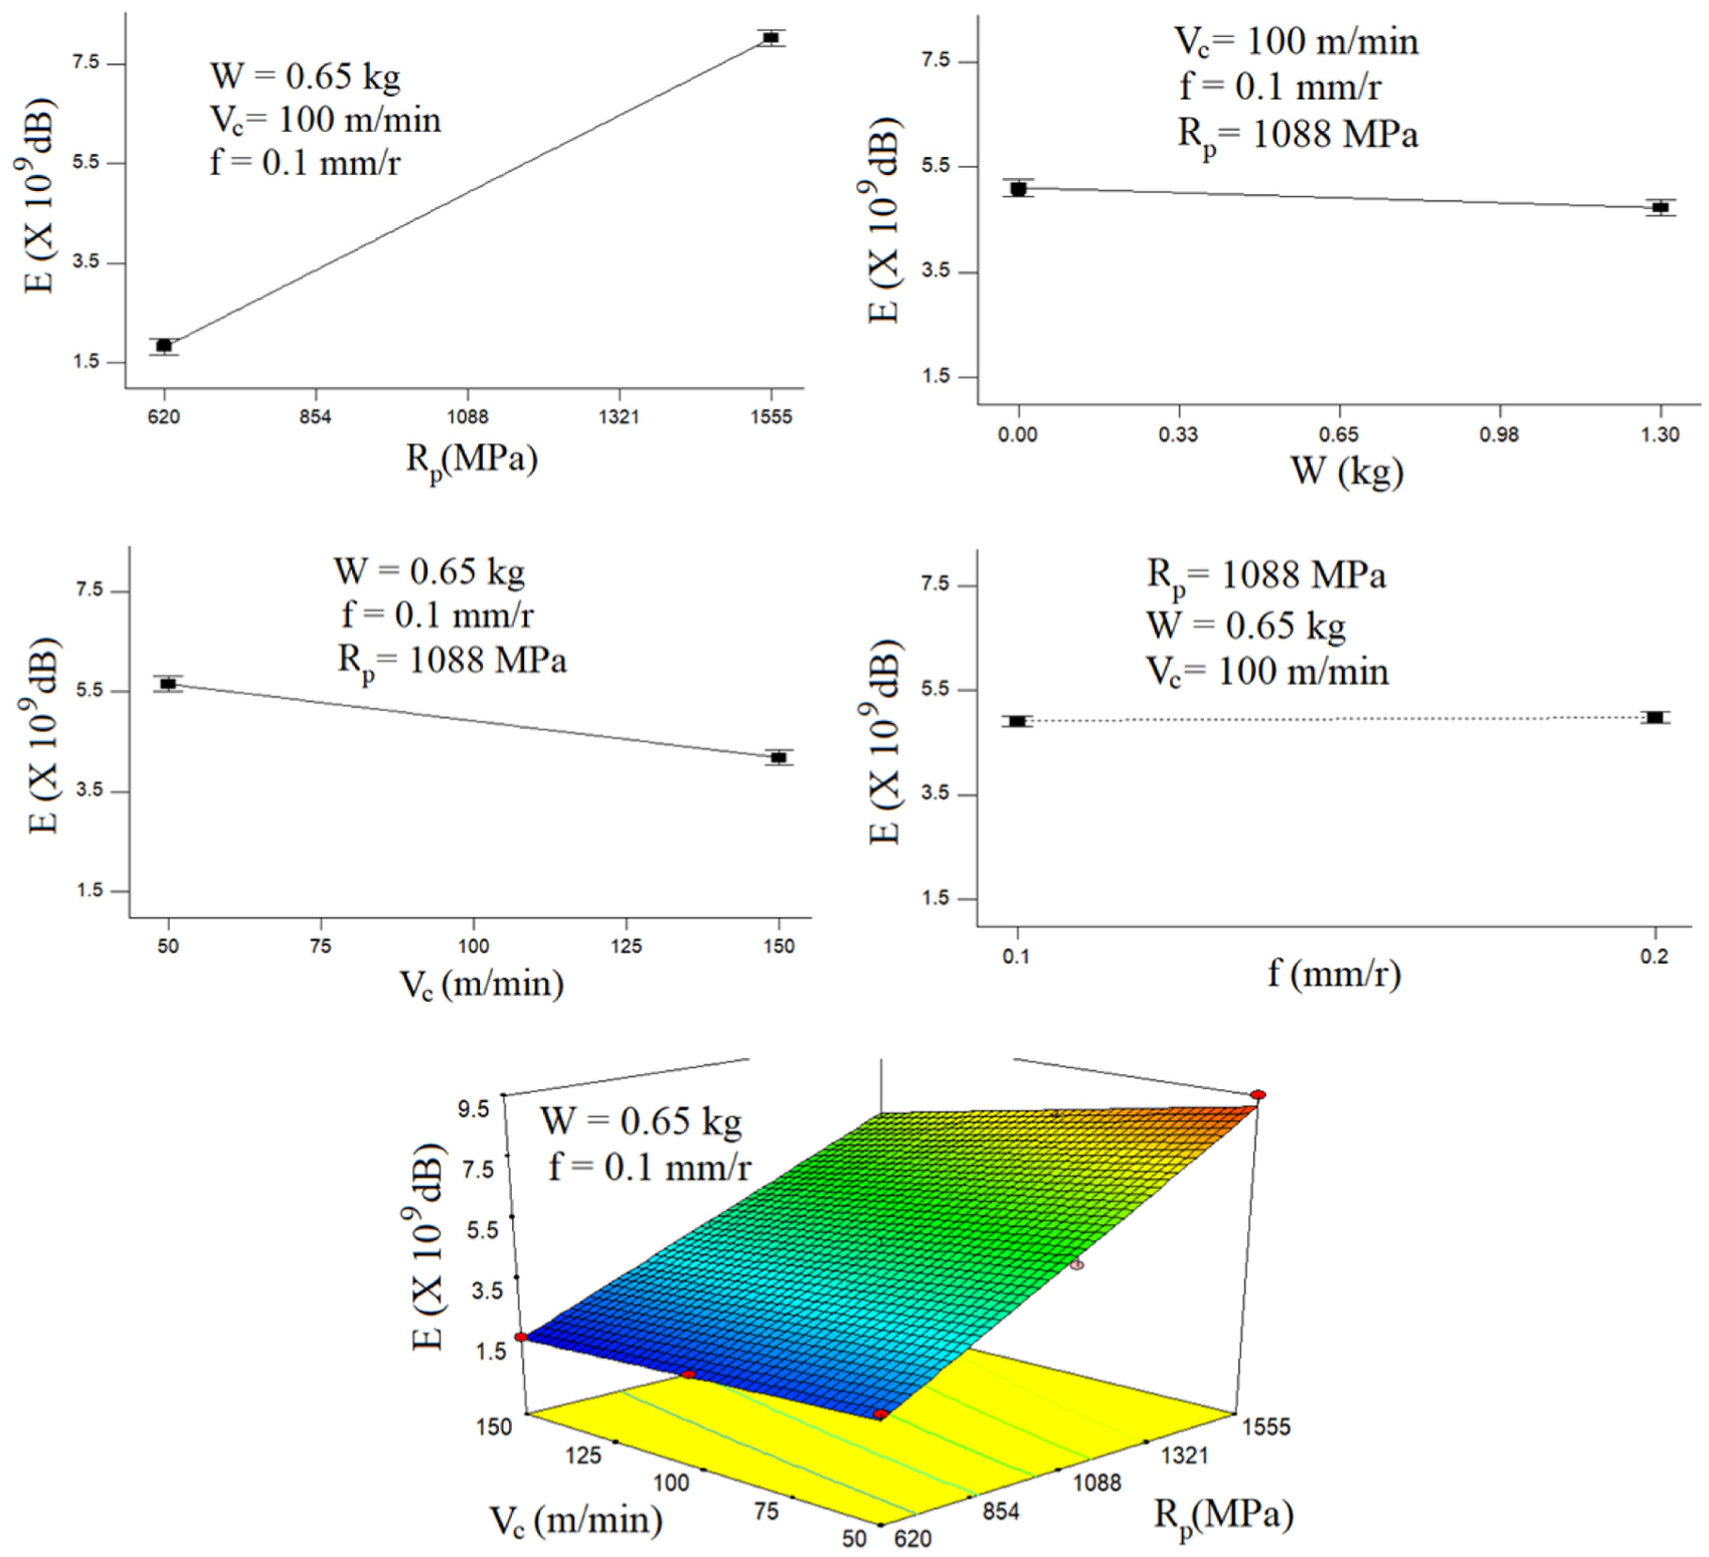
Factorial plots showing the main effects of Rp, W, Vc, and f and interactive effect of Rp and Vc on E
Figure 8 presents the 3D spectrograms related to the selected four experimental runs captured for the purpose of determining cutting energy. It is clearly observable from the figure that the hikes in the values of Rp (from 620 to 1060 MPa and from 1060 to 1555 MPa) cause growth not only in the magnitude of acoustic signal but also in its detectable frequency range (see emergence of the red bars along the frequency axis). Together, both the effects contribute toward increasing cutting power and energy.
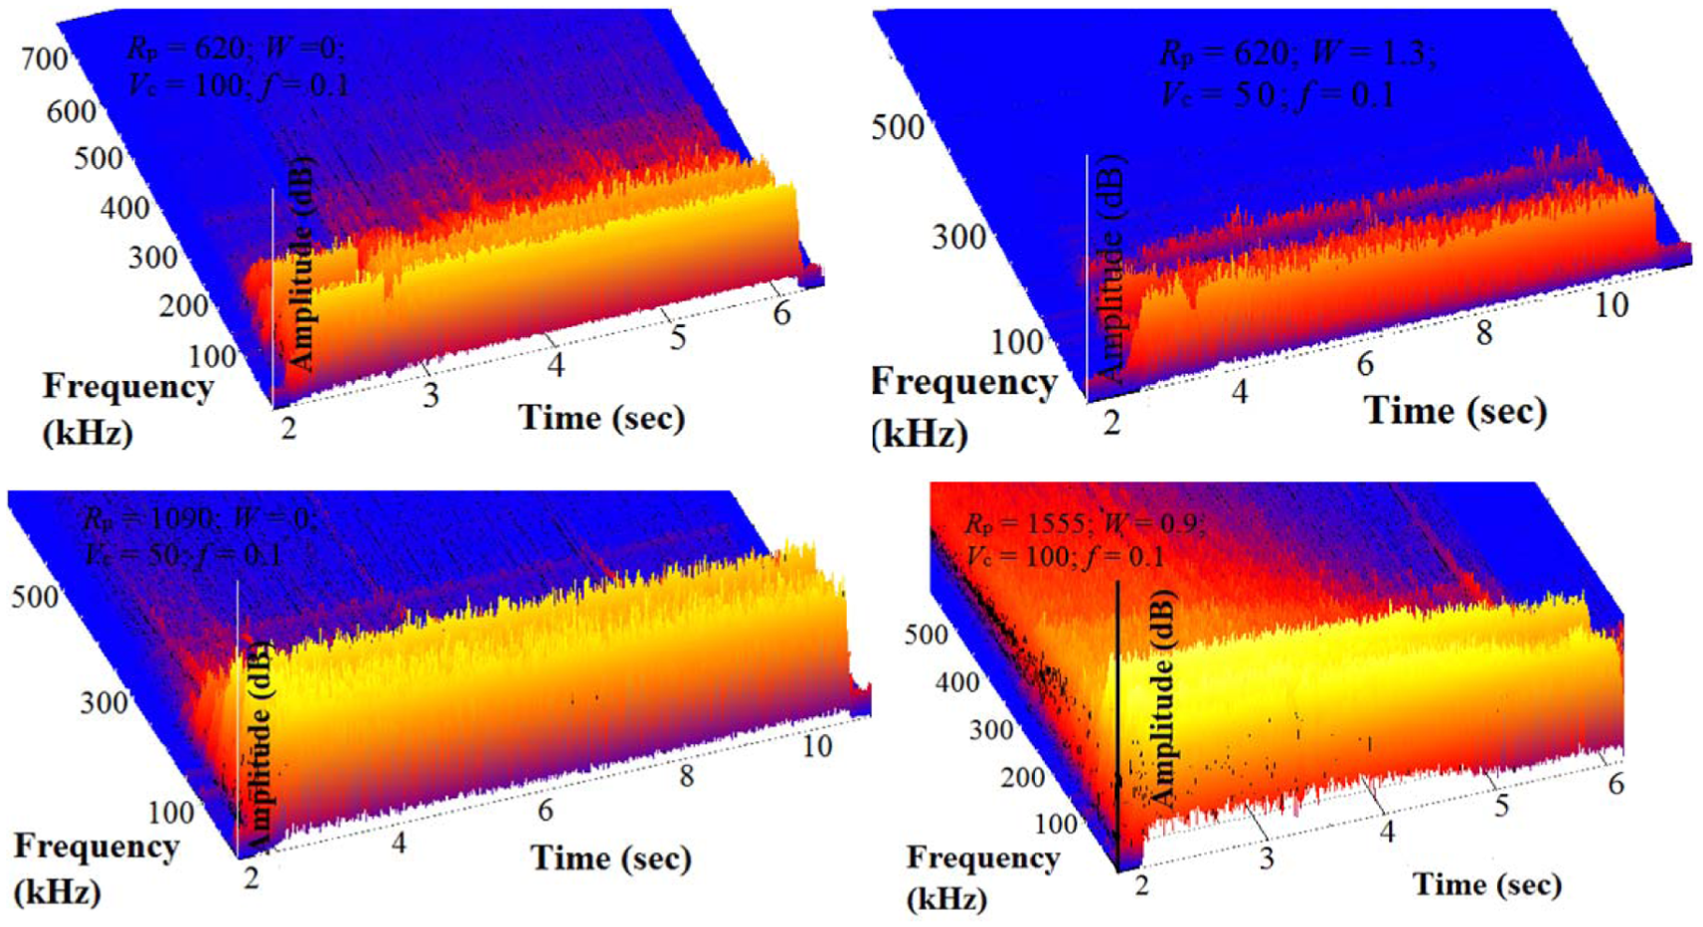
Selected 3D acoustic spectrograms used for determining energy consumption. The Rp, W, Vc, and f values shown on the images are presented in the units of MPa, kg, m/min, and mm/rev, respectively.
Tool’s flank wear
Figure 9 presents the measurements of VB for the 54 experimental results. Comparing the three plots in the figure reveals that flank wear sustained by the tool in cutting one groove is increased enormously by increased strength of the work material. Likewise, the high values of both the cutting parameters seem to have strong damaging effect on the tool. Furthermore, the plots also suggest that an increase in tool inertia, in general, tends to suppress tool wear, though the effect does not seem to be exceptionally strong.
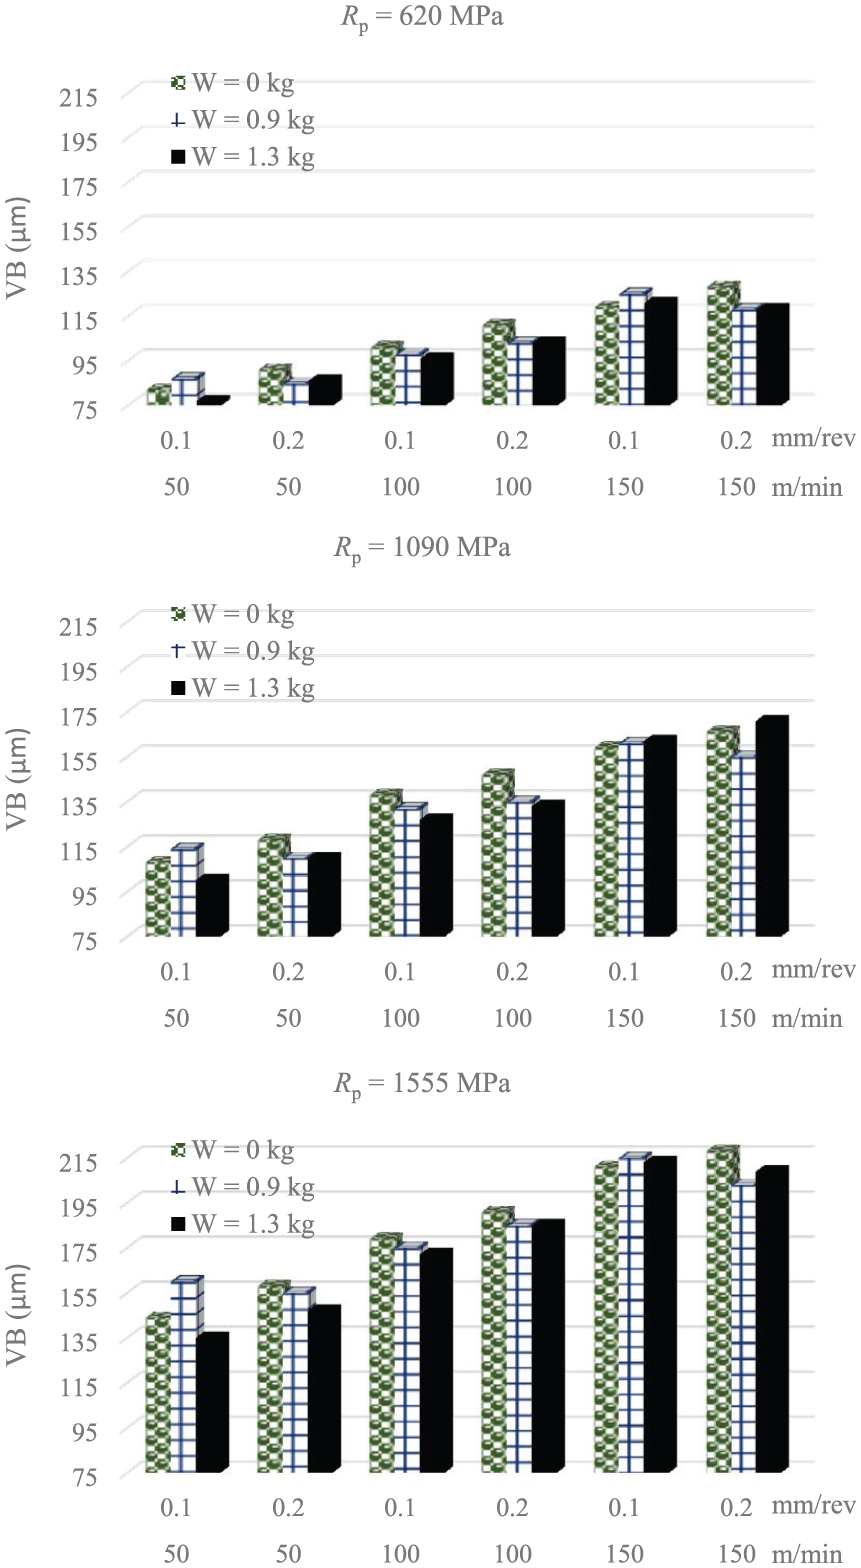
The three plots present the measured values of VB for the 54 experimental runs.
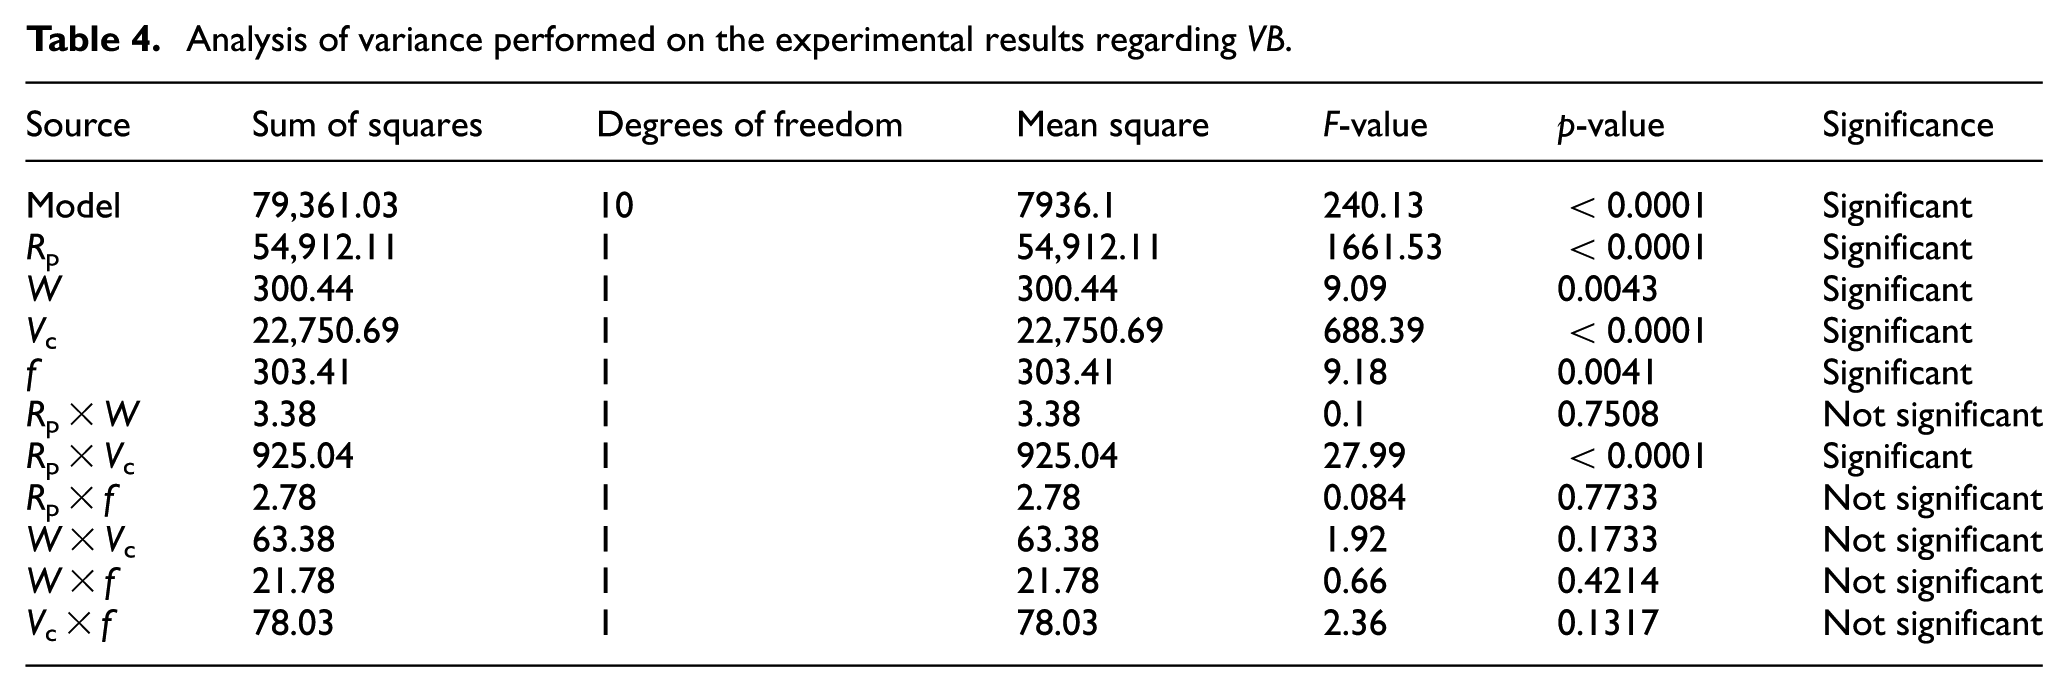
Table 4 presents the results of ANOVA carried out on the VB data. It reveals the following arrangement of the predictors and their significant interactions in descending order of significance: Rp (F-value = 1662), Vc (F-value = 688), Rp × Vc (F-value = 30), f (F-value = 9.2), W (F-value = 9.1). The effects of all the four predictors on tool wear are statistically significant with that of work material strength being the strongest and those of feed rate and tool inertia equally weakest. The effect of only one interaction (Rp × Vc) is observed to be significant. It suggests that the rate of increase in tool flank wear caused by an increase in cutting speed is higher in machining of the strong tempers. Figure 10 provides representation of the ANOVA results for the machining process in terms of factorial plots for flank wear. The slopes of the lines suggest that work material strength and cutting speed are far more influential predictors than inertia of tool holder and feed rate. The weaker form of the titanium alloy (Rp = 620 MPa) prompts mild tool wear because of lower shear yield strength and, thus, causes longer tool life. Strong work material is cut with high cutting force and energy and, thus, the temperature around the cutting edge of the tool is increased enormously due to generation and accumulation of high amount of heat energy. The intense level of heat accelerates temperature-dependent modes of tool damage leading to drastically short tool life. Moreover, the strong tempers of the work material contain hard phases and precipitates in their microstructure, which incur mechanical damage to the cutting tool in form of micro-chipping. Likewise, a high level of cutting speed increases rate of heat generation leading to accumulation of heat near cutting edge and increase in temperature. The resulting temperature speeds up the tool wear. In a nutshell, tool life can be enhanced by cutting at low speed and feed rate and employing a heavier tool holder.
Analysis of variance performed on the experimental results regarding VB
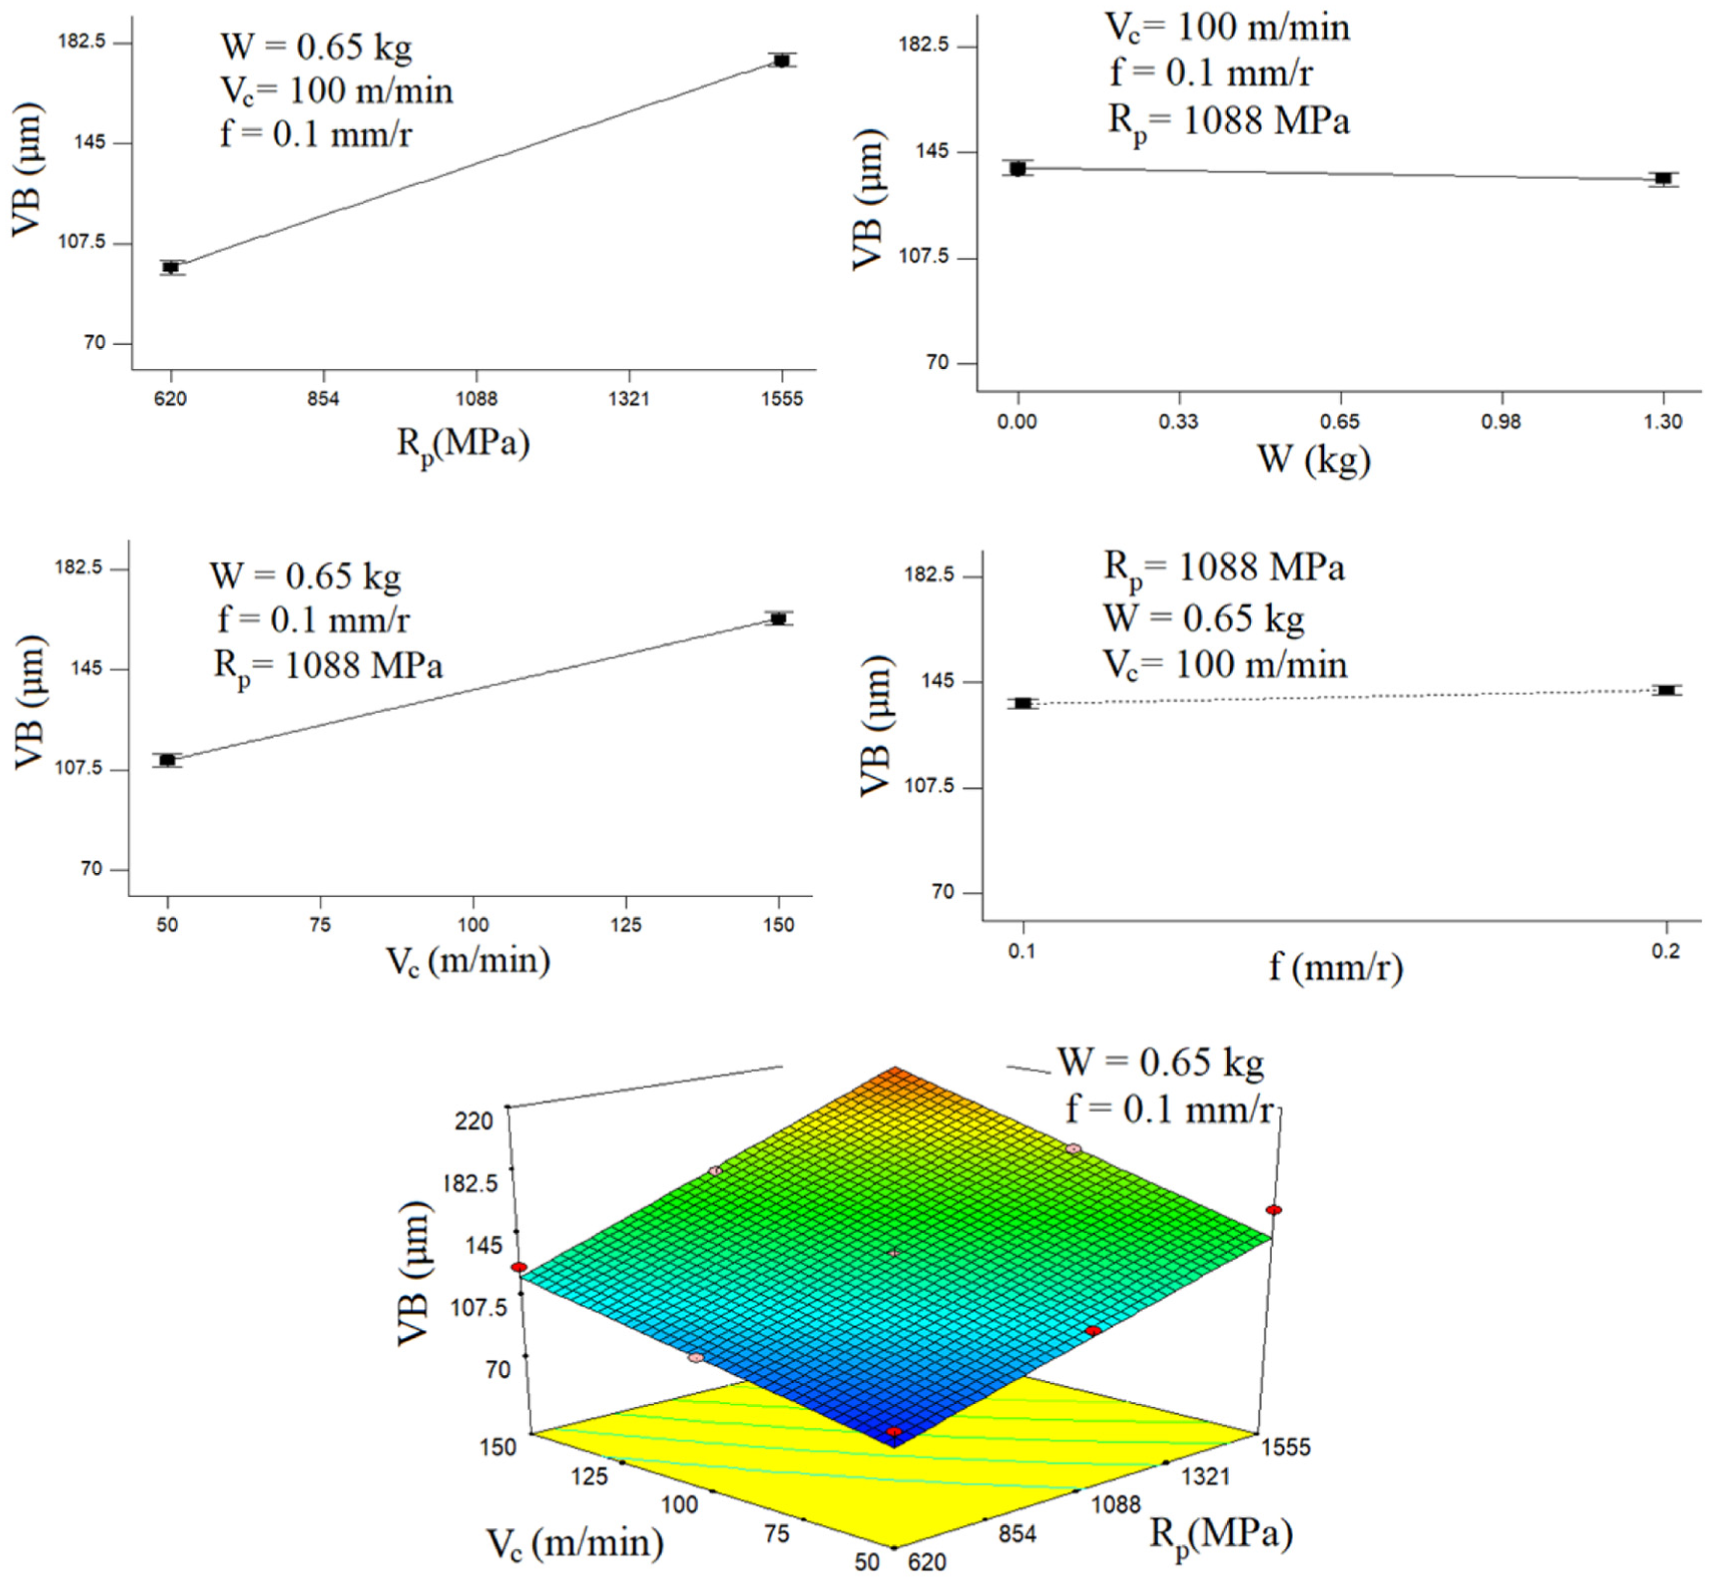
Factorial plots showing the main effects of Rp, W, Vc, and f and interactive effect of Rp and Vc on VB
Figure 11 presents the optical micrographs of the cutting edges regarding the inserts used in the selected experimental runs. The abrasive mode of tool damage is visible in all the six micrographs with a hint of adhesion in the three related to the highest level of cutting speed. Moving downward from the top two images (Rp = 620 MPa) to the middle ones (Rp = 1090 MPa) and then to the bottom ones (Rp = 1555 MPa) clearly indicates increasing areas of flank wear. The observation suggests that an increase in strength of β-titanium alloy causes an increase in the magnitude of flank wear incurred per unit volume of material removed. Likewise, moving from the images placed at the left hand side to those on the right hand side suggest that increasing cutting speed has a direct effect on causing adhesion of work material onto the surface of the cutting inserts.
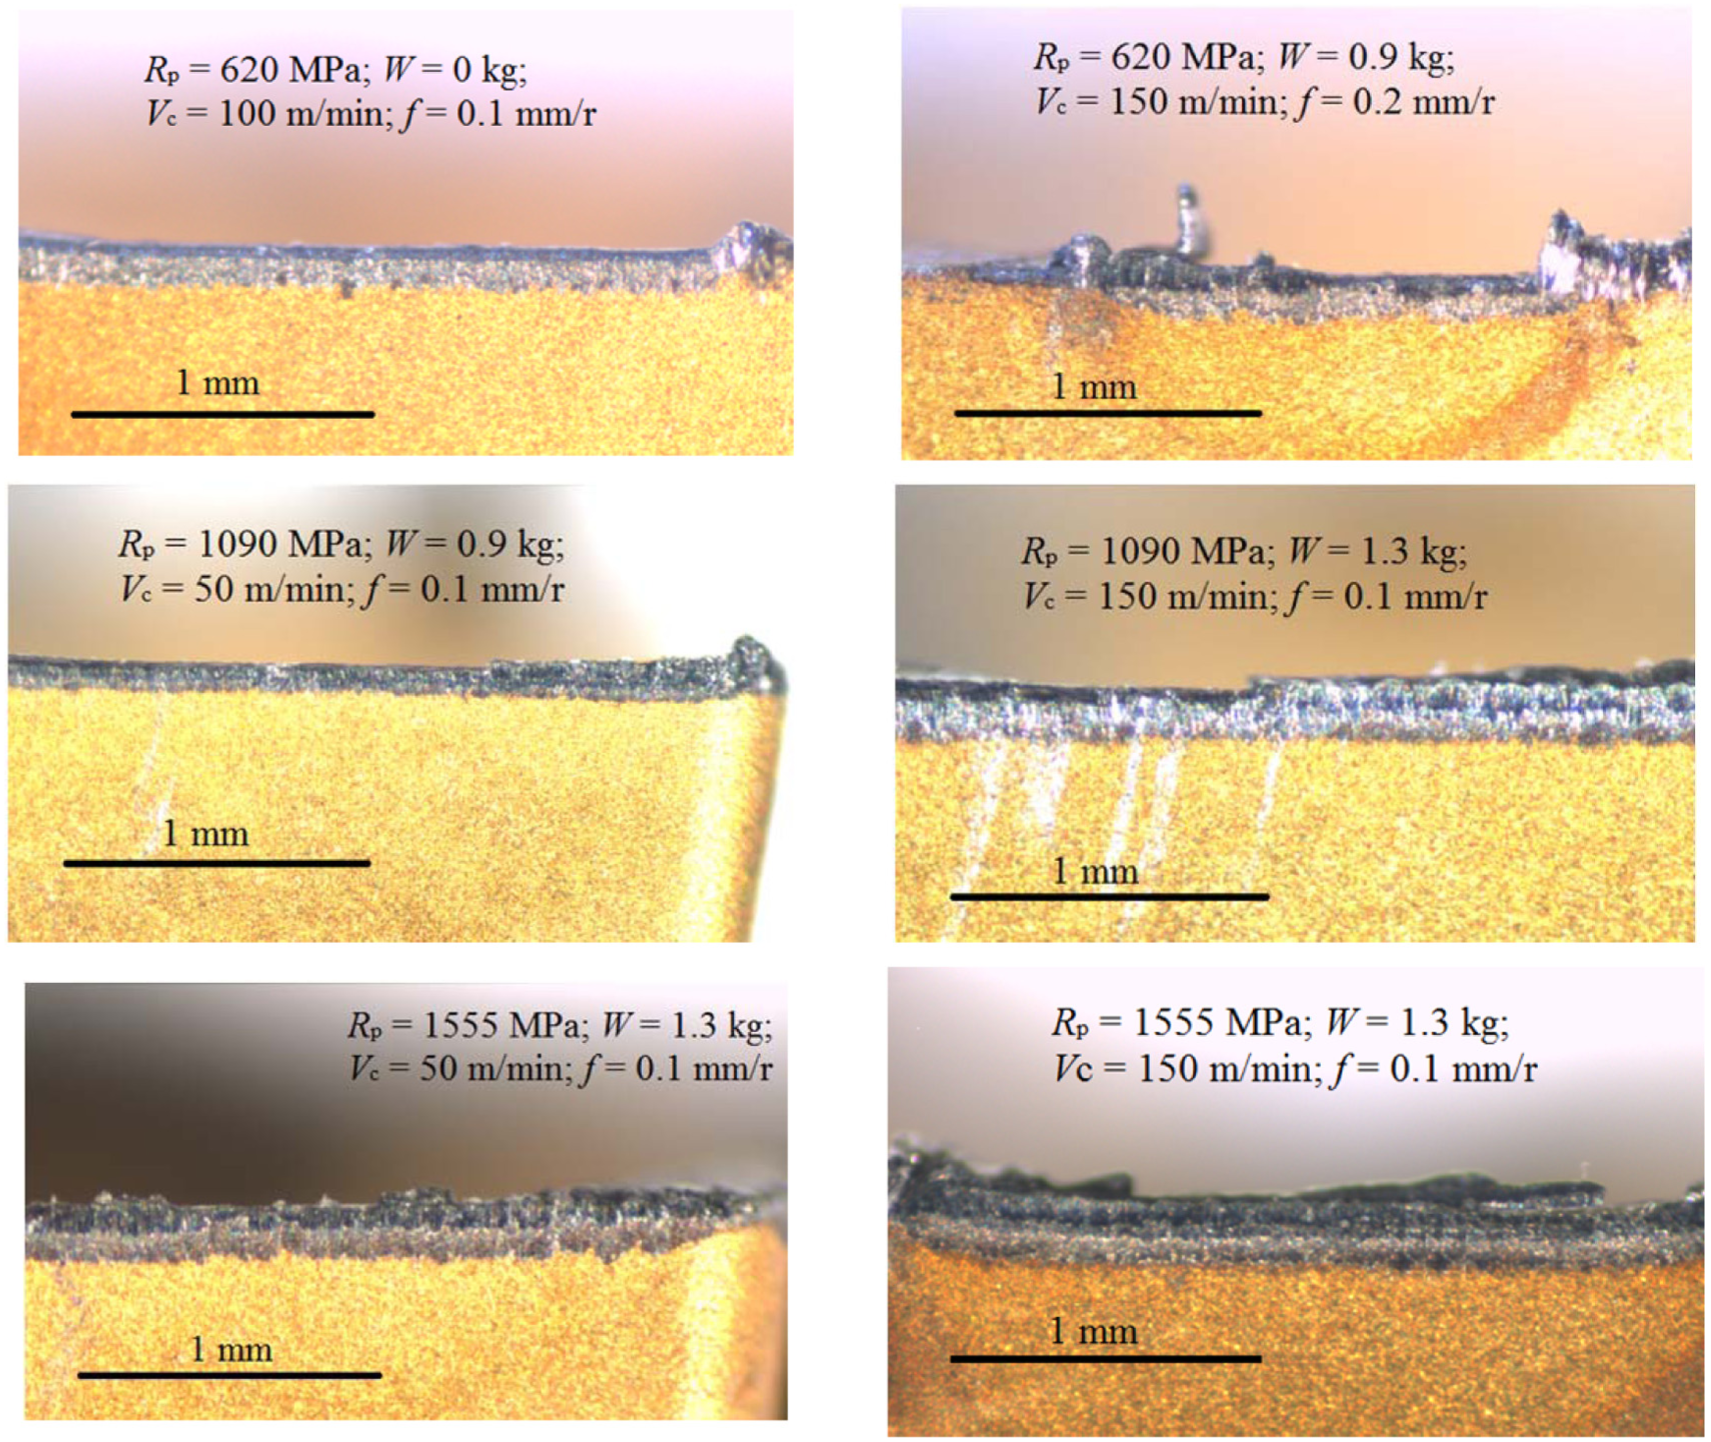
Optical micrographs of the used cutting edges (selected experimental runs).
Figure 12 presents SEM images of the cutting edges used in the selected experimental runs. Adhesion of work material is clearly observable in the images related to the runs involving the highest level of cutting speed. With regard to mechanical damage, gradual abrasive wear is observable in all the six images while micro-chipping is observable in the images related to the runs involving the high level of feed rate.
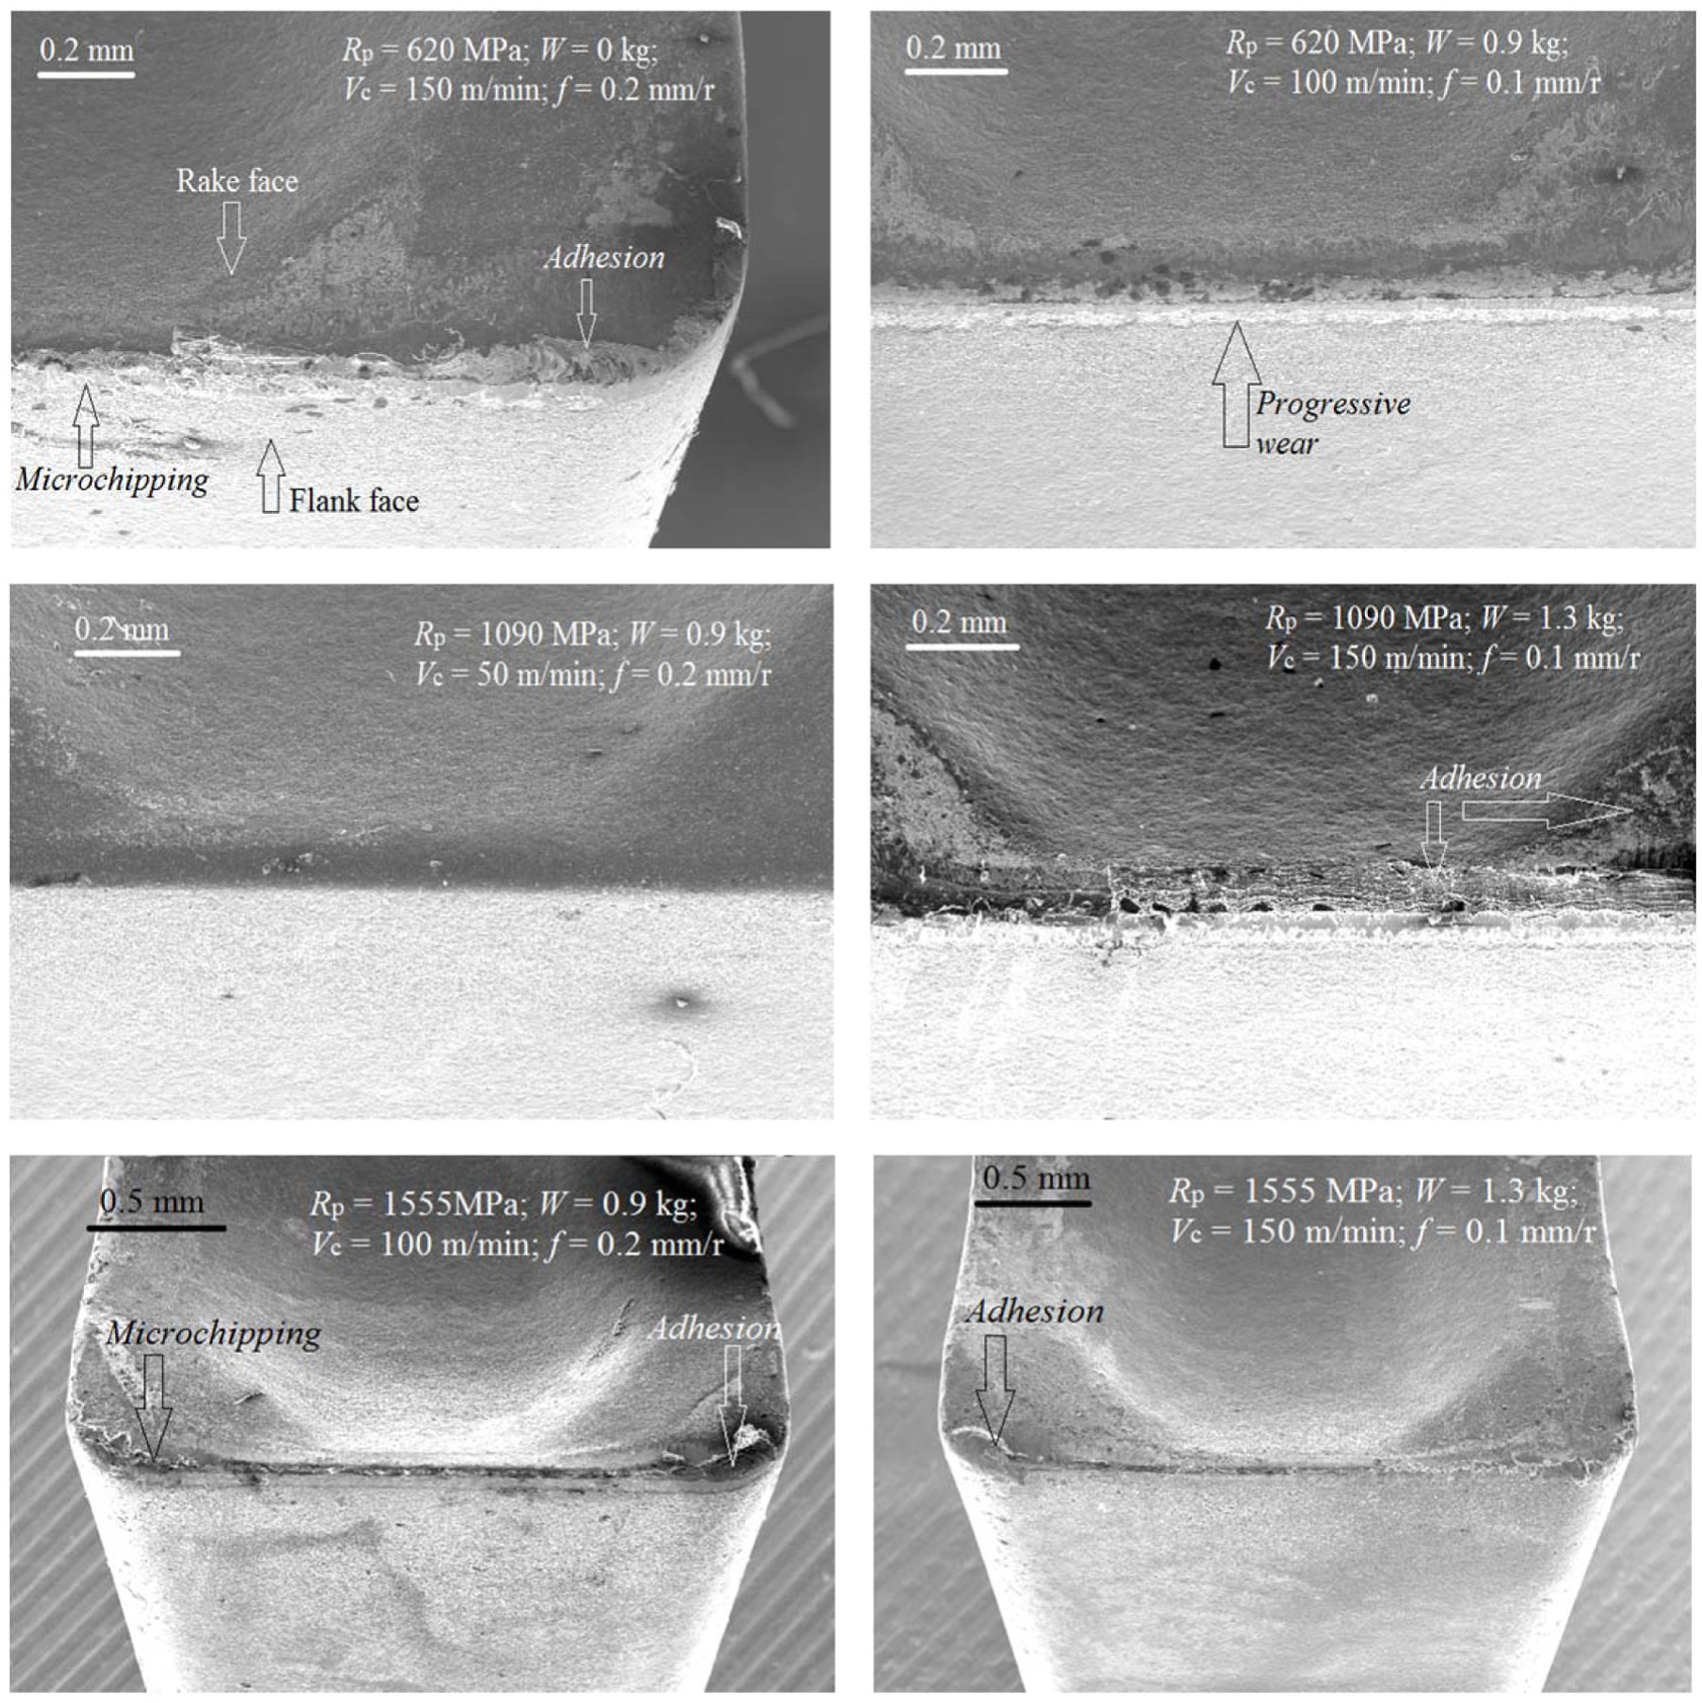
SEM images of the used cutting edges (selected experimental runs).
Numerical optimization carried out on the experimental data for the sake of minimizing all the three responses suggests to perform machining with the high level of tool inertia and low level of feed rate. The high level of cutting speed is recommended for minimizing cutting energy, while its low level is favorable for minimizing the other two responses. The results of the numerical optimization are presented in Table 5. The predictor, yield strength of the work material was fixed to 1090 MPa (the middle of the three levels tested) because, pragmatically speaking, its adjustment is beyond the control of the machining department.
Results of the numerical optimization performed on the experimental data (Rp = 1090 MPa).
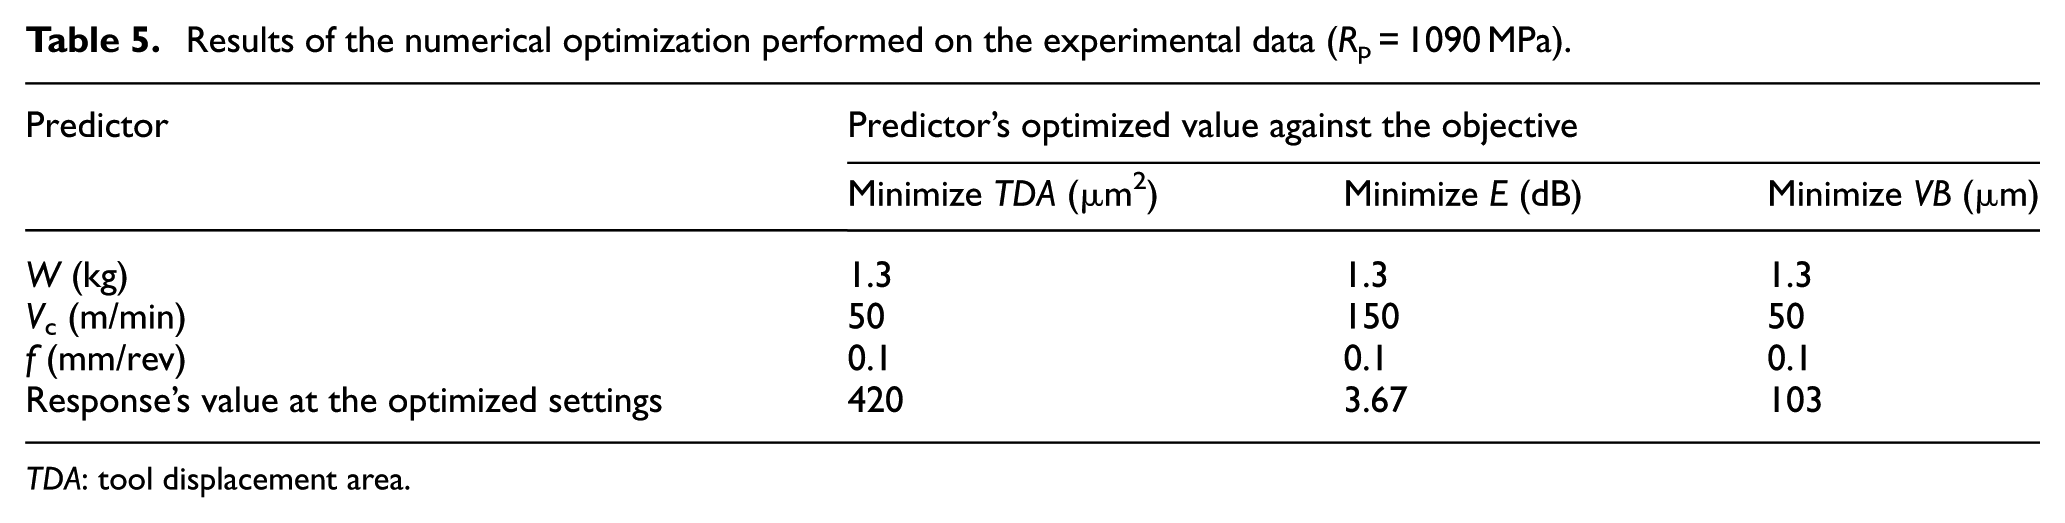
TDA: tool displacement area.
Correlation among the three responses
One of the objectives of the work is to identify the correlations among the measurements of tool damage, tool deflection, and AE. Specifically, it is important to determine whether tool damage state could be estimated fairly accurately without being dismantled from the machine tool using tool deflection and AE signals. In this context, a statistical term “correlation coefficient” is utilized. Correlation coefficient is a number that quantifies dependence or a statistical relationship between two data sets.
Figure 13 presents three scatter plots for visualizing correlations between the experimental data of (1) E and VB, (2) TDA and VB, and (3) TDA and E. It is observable that the randomness of the data shown in plot (c) is significantly larger than those shown in the other two plots. The correlation coefficients for the E–VB, TDA–VB, and TDA–E relations are found to be 0.68, 0.679, and 0.439 respectively, which means that the first two relationships are strong uphill linear relationships, while the third one is just a moderately uphill relationship.
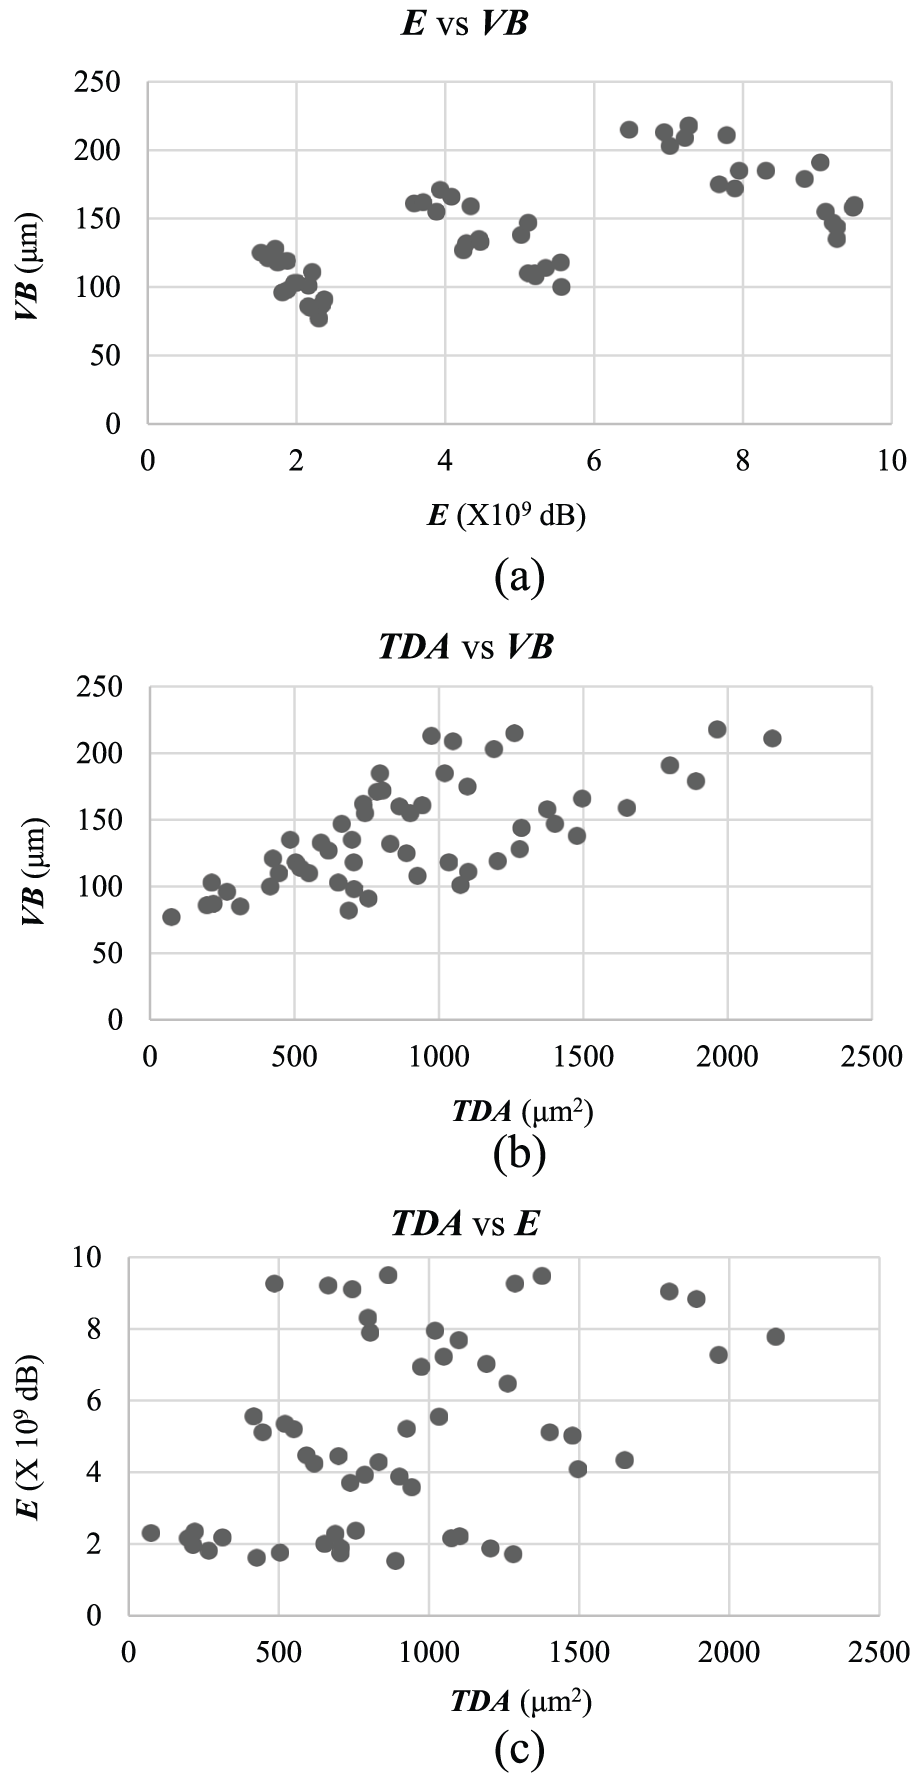
Scatter plots showing relationships between (a) E and VB, (b) TDA and VB, and (c) TDA and E
Tool wear or tool damage state is an important parameter which is commonly used as a tool replacement criterion. Its accurate, quick, and easily processed evaluation is very important because it governs two highly valued machining sustainability metrics: process cost and work surface quality. The commonly applied method of its evaluation is to take geometric measurements of the affected area around the cutting edge using optical aids. The same method is also used in this work for the measurement of tool wear. Unfortunately, the method requires the tool to be dismantled from the machine tool and taken to an optical microscope for measurements, which causes a significant surge in production lead time. The correlation related results suggest that tool wear/damage state can be evaluated by using AE and/or tool deflection (or acceleration) data, thereby, avoiding the requirement of dismantling the tool. The suggested replacement of tool wear measurement by tool wear estimation would surely enhance productivity and lessen processing cost. Detailed analyses and modeling for estimation of tool wear state based on E–VB and TDA–VB relationships are encouraged for future research.
Conclusion
The work, reporting the application of tool deflection and AE in quantifying machining performance measures, focuses on quantifying and analyzing the effects of enhanced tool inertia and work material strength in cylindrical grooving of a high-strength β-titanium alloy. In addition, the effects of cutting speed and feed rate on the measures: tool deflection, cutting energy consumed, and tool flank wear are also enumerated.
Measurements of AEs have successfully led to quantification of an important sustainability metric: energy consumed during the grooving process. The approach has successfully steered to find out significance of the effects of the four predictors on energy consumption. The high and the low levels of work material strength and cutting speed, respectively, are found to cause increased consumption of energy. The other two predictors are not found to be influential. Likewise, tool acceleration measurements have led to quantification of tool deflections during machining. The strong tempers of the material and the high levels of cutting speed induce intense deflections in the tool, while enhanced tool inertia suppresses them. The third performance measure and yet another sustainability metric, tool wear, is affected most by the work material strength followed by cutting speed. The high levels of material strength and the two cutting parameters cause intensification of tool damage, while enhanced tool inertia brings a lessening effect. To summarize, the novel approach of applying extra weight to the tooling system has proved to be beneficial with regard to tool deflection and tool damage.
It is also found that both cutting energy and tool deflection possess strong correlation with tool wear data. The finding would help to have estimates of tool damage with acceptable levels of accuracy without needing to stop the machining process for taking tool wear measurements. Consequently, machining performance is expected to rise as total production time will be reduced.
Footnotes
Declaration of conflicting interests
The author(s) declared no potential conflicts of interest with respect to the research, authorship, and/or publication of this article.
Funding
The author(s) received no financial support for the research, authorship, and/or publication of this article.