
Abstract
Energy modelling for mechanical machining processes is essential for energy labelling of machined products and as a foundation for selecting optimum cutting conditions that meet economic objectives while reducing energy demand and CO2 footprint. Electrical energy demand in machining can be modelled in two parts: ‘Basic Energy’ demand by the machine tool and ‘Tip Energy’ for actual material removal. A significant amount of research and energy evaluation is based on the use of average specific energy values and ignores the impact of machining conditions. In this comprehensive study, the evaluation of specific tip energy is undertaken, and the effect of chip thickness, tool wear, nose radius and cutting environment is quantified. This work is an essential guide for the application of models to estimate energy demand in practical machining processes. It is of significant importance to improve accuracy in energy-centric modelling of machining processes for sustainable manufacture and resource efficiency.
Introduction
The electrical energy demand for mechanical machining processes can be defined and modelled as the basic and tip energy. 1 A third preparatory state called the ‘Ready state’ was also recently proposed. 2 The ‘Basic state’ is the energy demand of the machine tool resource and auxiliary units at zero load. The ‘Ready state’ energy demand represents the energy consumed for all transitional movements made by the machine axes up to the point the tool is just about to cut. ‘Tip’ or ‘Cutting state’ energy is the specific energy demand for the actual material-removing operation. During a machining process, an average three quarters of the total energy is consumed by the machine, which constitutes the basic and ready energy states.3,4 There is thus a need for machine designers to reduce the energy demand in the machine’s basic and ready states. Moreover, the European Union (EU), Eco-design directive, 5 Cooperative effort on process emissions in manufacturing (CO2PE!), 6 ISO 14955-2, 7 ISO 14020:2000 8 and ISO 50001:2011 9 all promote energy demand reduction for machine tools. Design approaches include the improvement in energy efficiency of machine tool auxiliary units and the use of more energy-efficient electric motors and drives.
From the literature,10–13 it has been reported that specific cutting energy can be modelled based on process variables of cutting speeds, un-deformed chip thickness and feeds. In their analysis to model the specific cutting energy, Li and Kara 14 normalized the total energy demand with the rate of material removal. The specific cutting energy values obtained in this way can be interesting as they show that total energy demand during a milling process is machine tool dependent. Özel and Ulutan 15 also correlated specific energy with the chip formation and specific cutting forces. The cutting forces are analysed to investigate the effect of cutting edge radius on the total energy demand at the use phase. Kang et al. 16 reported that the minimum uncut chip thickness can be linked to the cutting force and the specific cutting energy. The specific cutting energy increases as a result of the size effect during the micro-scale milling process. The energy demand in mechanical machining can be reduced by optimizing cutting parameters, synchronizing spindle acceleration/deceleration with rapid traverse, 17 reducing non-productive modes, 18 optimizing energy demand for coolant pumps and centralizing coolant systems,19–21 using low coefficient of friction tool coatings 22 and selecting optimum cutting conditions.17,23 In a recent analysis, both He et al. 24 and Anderberg et al. 25 reported that choosing an effective energy-efficient strategy and adequately selecting a machining tool path for numerical control machining have the potentials for sustainable machining. Also, Balogun and Mativenga 10 reported that the specific cutting energy can be characterized through the process parameters, especially with the un-deformed chip thickness. They reported that as the ratio of the un-deformed chip thickness to cutting edge radius tends towards unity, the process mechanisms tend towards shearing-dominated cutting. Therefore, machining at this ratio has the potential of reducing the specific cutting energy by more than 50%.
For manufacturers and machine shops, energy demand reduction can be achieved through process planning by selection of energy-efficient machine tools and cutting conditions. The energy demand for material removal, that is, the specific cutting energy, is driven by material machinability factors. It is this tip energy that is under the direct control of end users and machinists because its magnitude is influenced by machining conditions. The operators (through proper scheduling) can also reduce the idle time of the machines or shut down the machine to save energy during the machining operations.26,27 The tip energy is the evaluation of the specific energy for material removal as defined in equations (1) and (2)
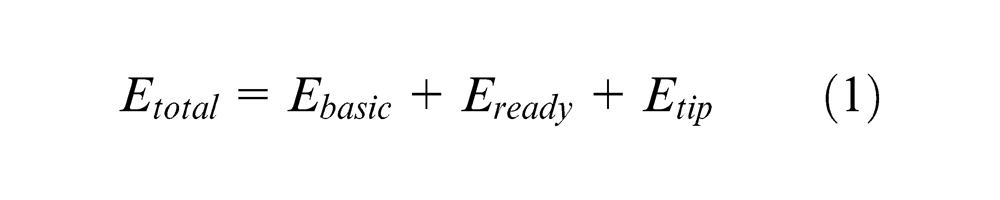
where Etotal is the direct total energy demand, and Ebasic, Eready and Etip represent the electrical energy demand for basic, ready and cutting states, respectively, in Joules in a machining process.
Equation (1) can be further expanded to explicitly model tip energy. The basic and ready energies depend on the machine design and will be machine specific
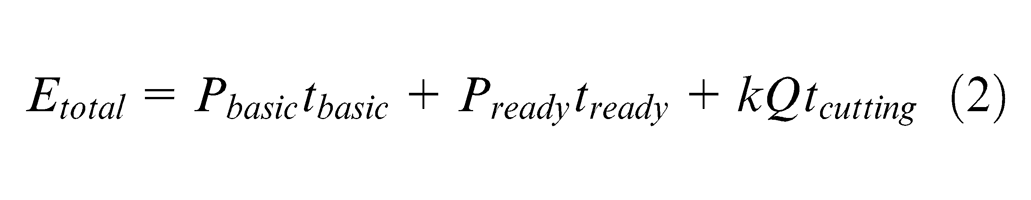
where tbasic, tready and tcutting are the time (s) when the machine is in the basic state, ready state and actual cutting mode, respectively. While Pbasic and Pready are the average power demand in the basic and ready states, respectively, k is the specific cutting energy coefficient (J/mm3) and Q is the material removal rate (mm3/s).
The specific energy coefficient represents the energy demand to remove 1 mm3 from a workpiece material. To date, there is no comprehensive study that examines how this key energy modelling parameter varies with cutting conditions. The aim of this article is to address this knowledge gap and to raise the integrity of data used for specific energy modelling and at the same time provide guidance for end users in energy demand modelling of machined products.
Research aim and motivation
The research aim is to understand the factors that influence the tip energy in mechanical machining processes. To achieve this, cutting tests were undertaken to assess the impact on specific energy coefficients of the cutting tool geometry (nose radius), cutting environment (dry and flood coolant) and tool wear in machining American Iron and Steel Institute (AISI) 1045 steel alloy and EN8 steel alloy materials. This information is essential because at present, most data on energy demand modelling are based on constant specific energy values derived in short-run cutting tests. Understanding how the changes in cutting conditions will influence the normalized tip or specific tip energy will enable accurate analysis of the direct electrical energy requirements in mechanical machining processes.
Research strategy and experimental details
Research strategy and procedure
The research approach is to measure the electrical current demand in mechanical machining processes and hence evaluate the associated power and electrical energy demand. The electrical current consumption was measured with a FLUKE 345 power clamp meter that was connected to the main electrical power input. Given that the total electrical energy in mechanical machining can be modelled as proposed in equation (1), the specific tip energy can be obtained by plotting the power demand for different material removal rates. The gradient for such a curve represents the specific cutting energy coefficient. This specific energy coefficient is to be evaluated at different values of flank wear, tool nose radius and cutting fluid in order to quantify and assess the effect of such variables on the electrical energy demand in mechanical machining processes.
Experimental details – milling tests
For the cutting tests, the machine used is the high-speed milling Mikron HSM 400 machining centre that has an HVC140-SB-10-15/42-3F/HSK/E40 spindle and HEIDENHAIN TNC 410 NC controller. For the milling tests, a tool holder E90X-D08-C10-06 with an overhang of 25 mm was used. The holder had single cutting tool insert.
To evaluate the variation of specific cutting energy with feed per tooth, cutting tests were performed using a single milling insert SOMT 060204-HQ. The insert has a 0.4-mm nose radius, the edge radius was evaluated to be 60 µm, the rake face primary chip breaker length was 60 µm and the rake and clearance angles were 5° and 7°, respectively. This tool was used for the end milling operations. The insert is a general purpose, TiAlN-coated carbide insert with geometry as described above.
Side milling tests were conducted under a dry cutting environment on AISI 1045 alloy steel under the ‘one-factor-at-a-time’ design of experiments. To evaluate the effect of different nose radii, three insert types HM90 APKT 100304PDR IC328, HM90 APKT 100308PDR IC328 and HM90 APKT 100312PDR with nose radii of 0.4, 0.8 and 1.2 mm, respectively, were used. These inserts have a cutting edge radius of 70 µm and primary rake face land of 130 µm.
The cutting variables were derived from the insert manufacturers’ recommendations. The cutting velocity was kept constant at 156 m/min in order to fix the spindle speed and avoid large variations in basic power requirement. The depth of cut was 3.5 mm as defined by the end-milled plate thickness. The feed per tooth and radial width of cut were varied from 0.01 to 0.55 mm/tooth and from 0.25 to 1.0 mm, respectively, as shown in Table 1.
Cutting parameters for cutting tests.
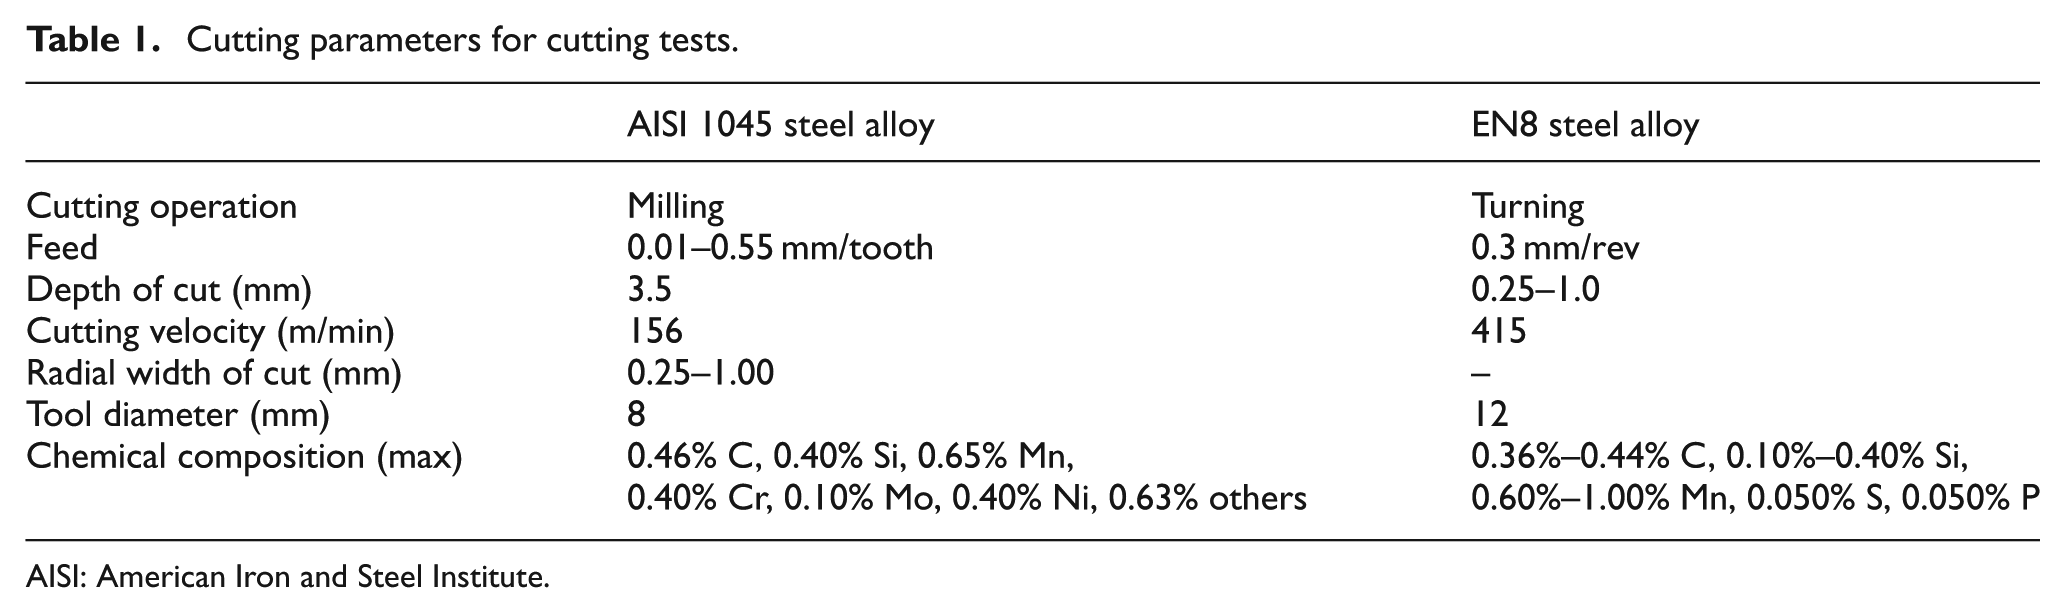
AISI: American Iron and Steel Institute.
To generate the specific energy coefficient for each feed (chip load) engaged during the milling test, seven different milling tests were conducted based on the experimental design shown in Table 2 for each feed. The experimental design shown in Table 2 is a sample of the cutting tests conducted for each of the varied chip loads. The chip load for each set of milling tests was varied seven times with a new chip load value for a set of cutting tests as represented in Table 2. The chip load was kept constant for each milling test (i.e. chip load of 0.01, 0.10, 0.19, 0.28, 0.37, 0.46 and 0.55 mm/tooth, respectively), and the radial width of cut was varied accordingly. Three milling runs were conducted for each milling test. This is to ensure the repeatability of the data collated.
Experimental design.
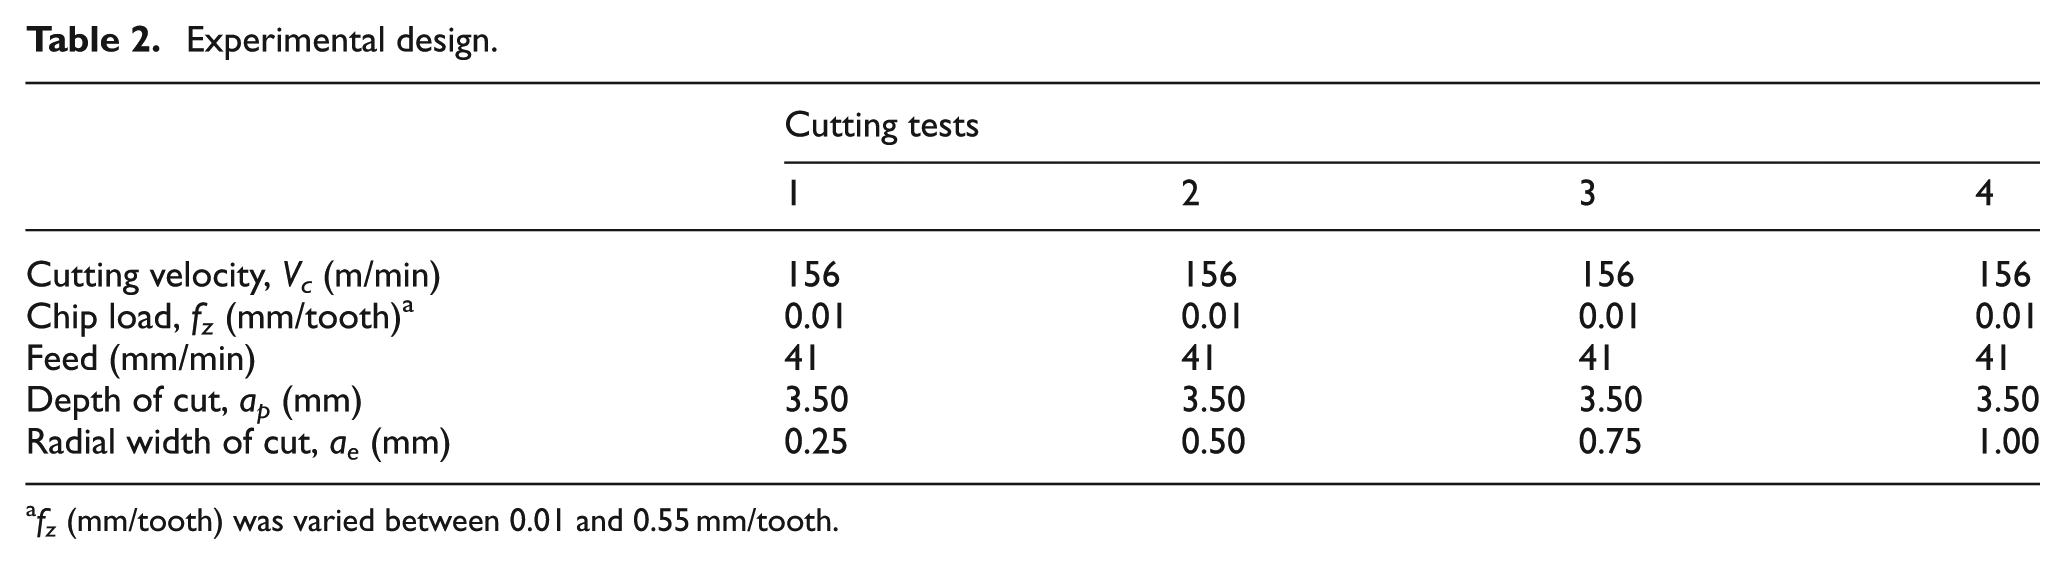
fz (mm/tooth) was varied between 0.01 and 0.55 mm/tooth.
Experimental details – turning tests
Turning tests were conducted on the MHP CNC Lathe for continuous cutting in order to enable a systematic evaluation of tool wear and electrical energy demand for each wear land value. The MHP CNC Lathe had an 18 kW–rated DC Servo motor spindle. A tool holder PCLNL2020K12 and cutting tool insert CNMG 120408-WF 4215 were used. The insert was coated with TiCN + Al2O3 + TiN. The turning tests for tool wear evaluation were conducted under a flood cutting environment on EN8 steel alloy. The cutting fluid used was Blasocut BC25-MD, made by Blaser Swisslube with 7% concentration. The pump flow rate was 30 L/min at an operative pressure of 300 kN/m2.
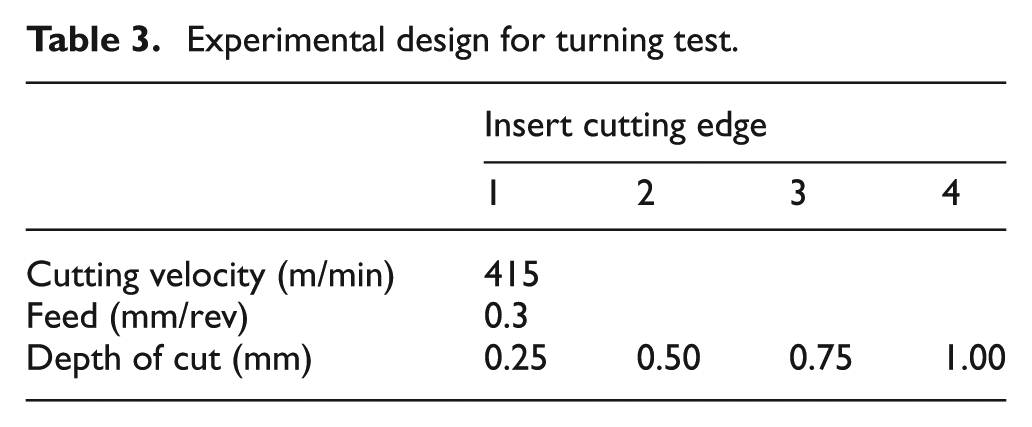
The turning tests involved establishing a pre-defined wear land value by cutting for extended times. Each test was repeated to generate a sufficient number of tools (i.e. six turning inserts in this case) with particular wear land values. In order to standardize the turning test, the tool rejection criteria were considered in relation to the ISO 3685:1993 28 standard for tool life testing. Flank wear land width (VB) is the criterion of tool life according to the ISO 3685:1993 standard. When the wear patterns formed on the relief face of the cutting tool are regular, VB ≥ 0.3 mm is the criterion of tool life. The flank wear land was evaluated based on this standard. Using these cutting inserts and at a particular wear land, more experiments (as shown in Table 3) were conducted to evaluate specific energy coefficient values in relation to the wear previously generated. A CNMG 120408-WF 4215 insert was used in the turning tests to evaluate the effect of cutting tool flank wear and cutting fluid on the tip energy. This was used during the turning operations conducted on EN8 steel alloy at 0.3 mm/rev for a range of depth of cut varying from 0.25 to 1.0 mm (to generate different material removal rates (Q)) and a cutting velocity of 415 m/min, as shown in Table 1. The cutting variables were selected to be within the process window as recommended by Sandvik Coromant, the tool manufacturer. To generate the specific energy coefficient for each turning pass, six different turning tests were conducted based on the experimental design shown in Table 3 for pre-defined flank wear land and at 2, 4, 6, 8, 10 and 12 turning passes. Three machining runs were conducted for each turning test. This is to ensure the repeatability of the data collated.
Experimental design for turning test.
Results and discussions
Effect of chip thickness on specific cutting energy
During the end milling tests, the radial width of cut was varied from 0.25 to 1.0 mm to generate different values for the material removal rate. The feed (chip load) was also varied from 0.01 to 0.55 mm/tooth, and the total power demand measured for each feed was plotted against the material removal rate generated by varying the radial width of cut. The slope of the curves obtained represents the specific energy coefficient of milling AISI 1045 steel alloy, as shown in Figure 1. This procedure was repeated for 0.01, 0.10, 0.19, 0.28, 0.37, 0.46 and 0.55 mm/tooth to generate power–material removal rate curves. The specific energy coefficient data generated at different chip loads when side milling AISI 1045 steel alloy are shown in Table 4.
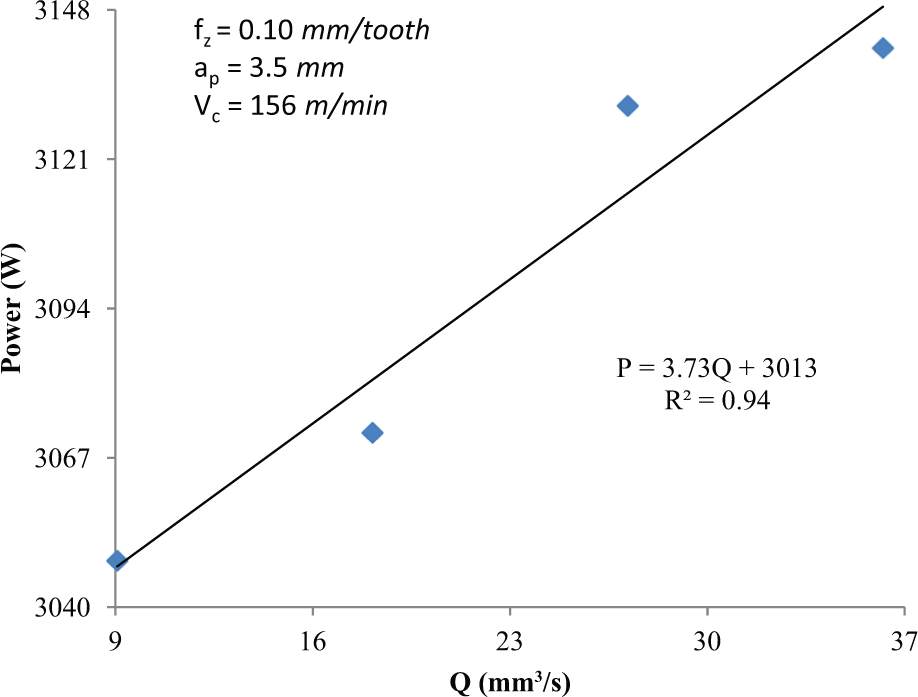
Determination of specific energy coefficient at 0.10 mm/tooth chip load.
Specific energy coefficient values.
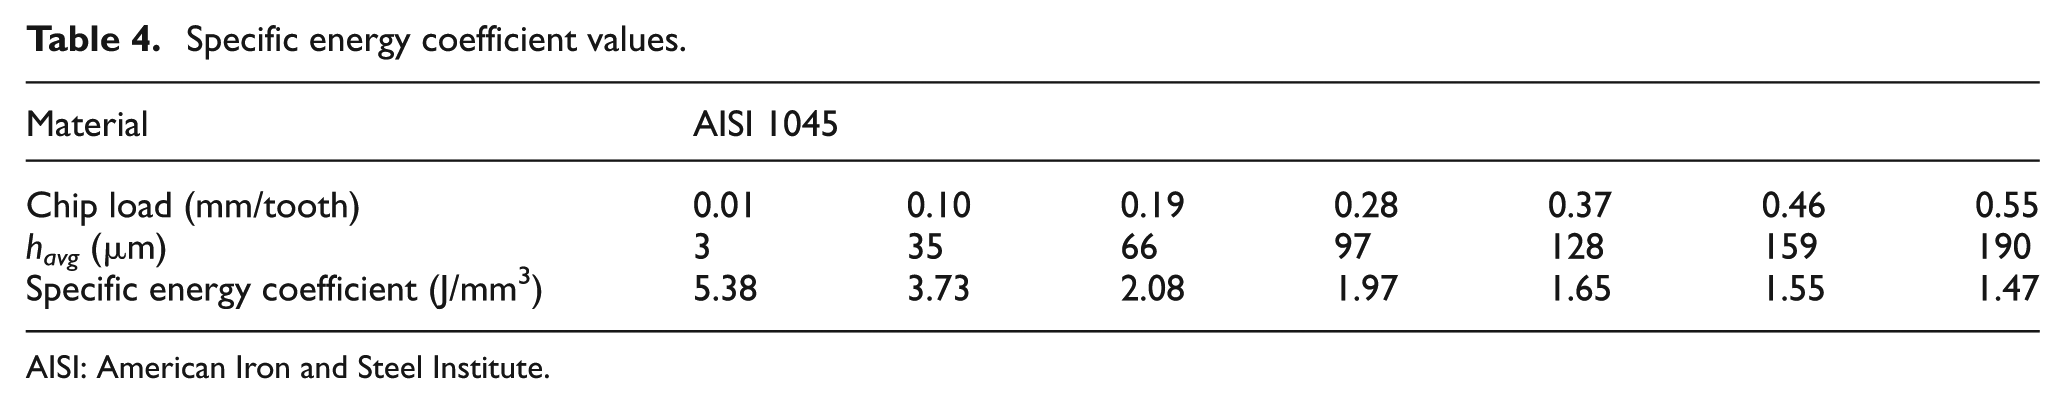
AISI: American Iron and Steel Institute.
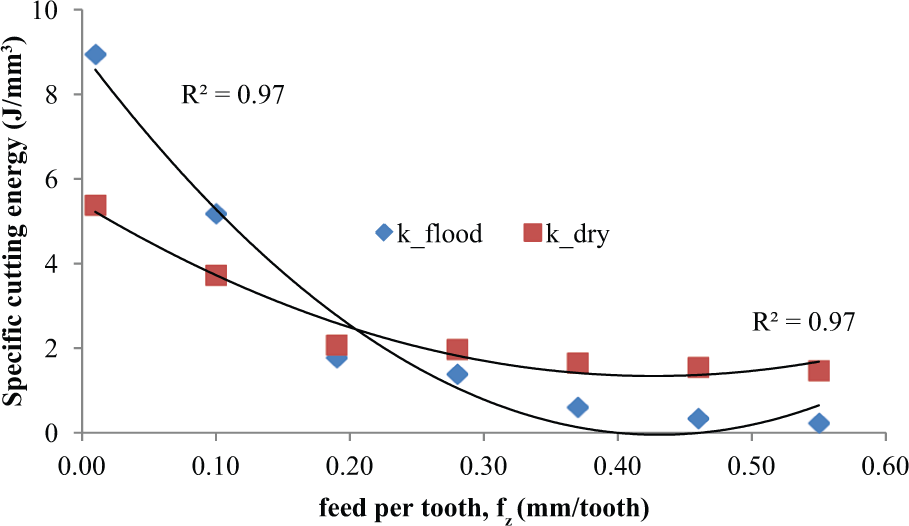
In order to understand the effect of feed on the tool tip energy, the specific energy was plotted against the feed (chip load), as shown in Figure 2. The best curve fit equation deduced from Figure 2 is shown in equation (3). It can be observed from Figure 2 and equation (3) that the specific energy decreases by a power function. By increasing the feed from 0.01 to 0.55 mm/tooth, the specific energy decreases from 5.38 to 1.47 J/mm3 for AISI 1045 steel alloy

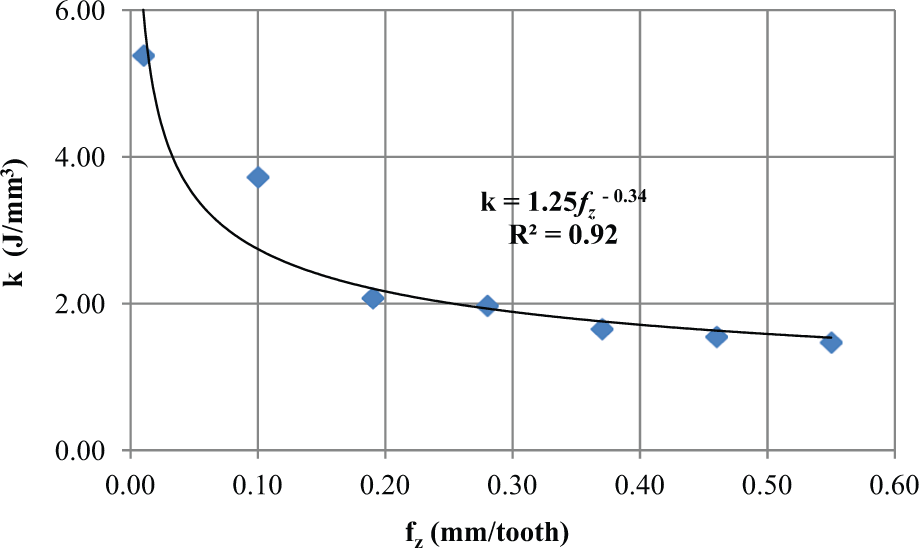
Specific cutting energy variation with feed per tooth in milling AISI 1045 steel alloy.
where k is the specific cutting energy (J/mm3) and fz is the feed per tooth (mm/tooth).
Figure 3 shows the relationship of the specific cutting energy coefficient and the un-deformed chip thickness.
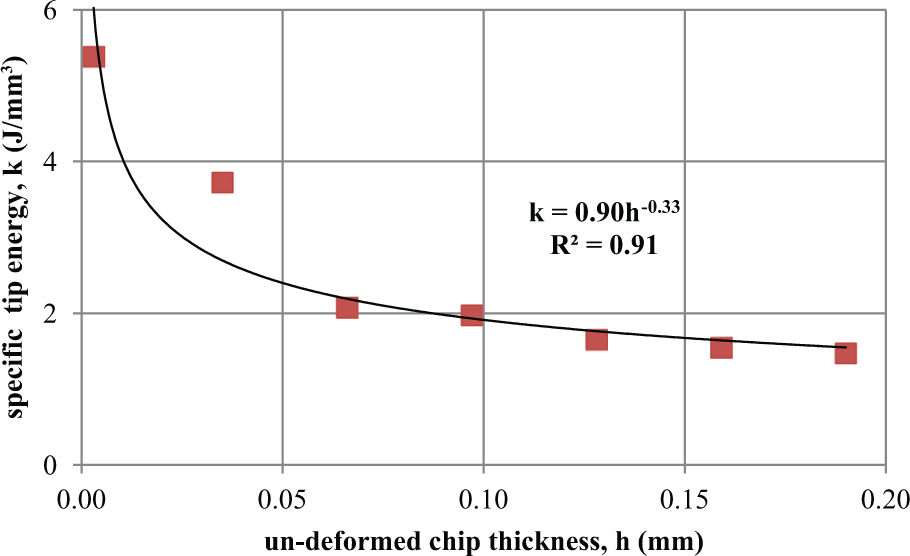
Specific cutting energy variation with un-deformed chip thickness in milling AISI 1045 steel alloy.
The average un-deformed chip thickness is estimated using equation (4b)
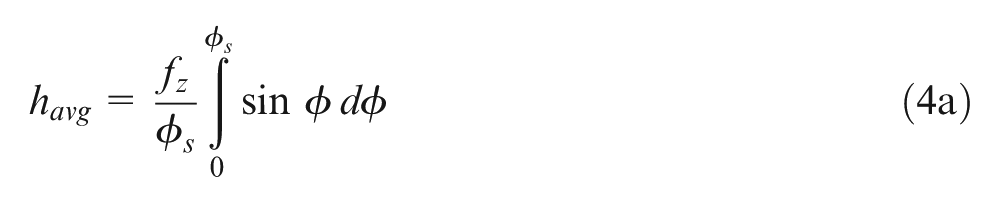
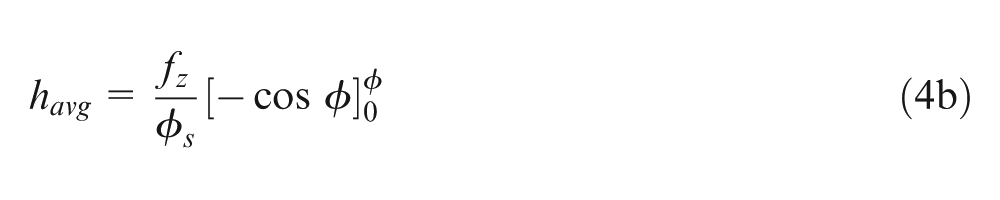
where havg represents the average un-deformed chip thickness (mm), fz is the feed per tooth (mm/tooth), ϕ is the swept angle (°) and ϕs is the swept angle (rad).
Figure 3 shows that as the un-deformed chip thickness increases, the energy efficiency of the cutting process tends to improve, that is, the specific cutting energy decreases. This can be related to the changing of the process mechanisms towards a shearing-dominated process as a result of the effective reduction in rake angle from being highly negative to a more positive angle. This decreasing trend implies that as the process mechanisms shifted from ploughing- and rubbing-dominated zones to shearing-dominated zones, the specific energy decreases by 73% (considering the lowest un-deformed thickness of 3 µm, as shown in Figure 3).
Thus, based on tip energy, the energy intensity of the actual material removal process depends on the process mechanism at play. These process mechanisms are driven by the ratio between the un-deformed chip thickness and the tool edge radius. 10
The values of the specific energy gradually decrease as un-deformed chip thickness increases up to a point whereby it is greater than the cutting edge radius. At this value, the process mechanism would have shifted to dominant shearing. This zone tends to be the value for the specific energy at which roughing operations are conducted. This represents an energy-efficient tip energy material removal zone. Inappropriate process parameter selection, especially when the ratio of un-deformed chip thickness to the cutting edge radius is less than unity, can cause an increase in the specific energy demand during machining operations. It is important to select chip thickness that ensures dominant shear mechanism if the energy intensity of roughing operations is to be reduced.
Effect of nose radius on specific cutting energy
In this section, three insert types HM90 APKT 100304PDR IC328, HM90 APKT 100308PDR IC328 and HM90 APKT 100312PDR with nose radii of 0.4, 0.8 and 1.2 mm, respectively, were evaluated in milling tests. Other geometry and coatings of the three inserts were the same as stated previously. The milling test was similar to that as previously described. To generate the specific energy coefficient for each of the three insert types with nose radii of 0.4, 0.8 and 1.2 mm, each of the milling inserts was used for a side milling test. Five different milling tests were conducted based on the experimental design shown in Table 2 for each feed (i.e. 0.01, 0.10, 0.19, 0.28 and 0.37 mm). The radial width of cut was varied accordingly as previously described. Three side milling runs were conducted for each milling test. The current consumption was measured and the power demand calculated and analysed to determine the specific energy coefficient as described before. Figure 4 shows the variations in the specific energy coefficients when different cutting tool nose radii were engaged at a range of un-deformed chip thickness.
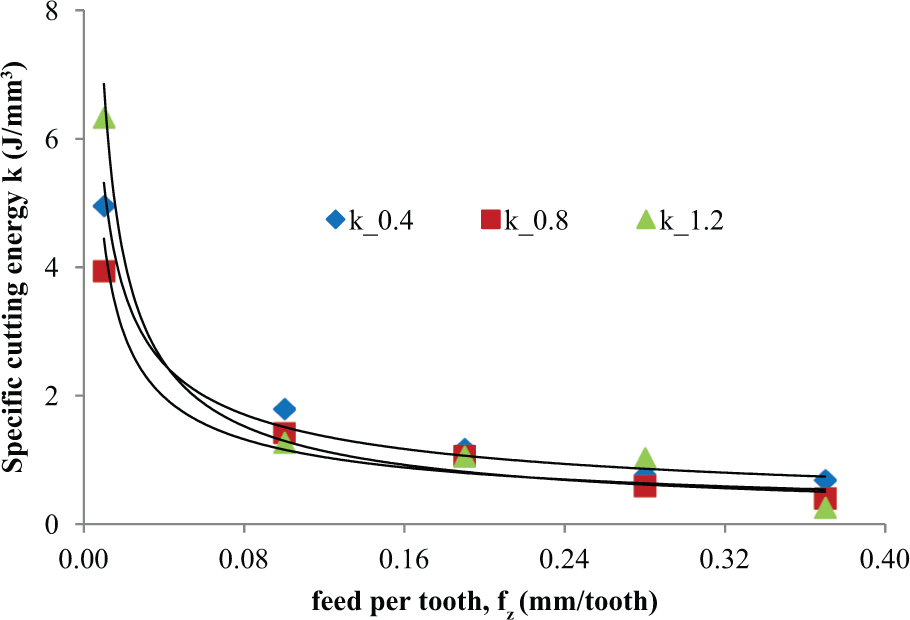
Specific energy comparison for 0.4, 0.8 and 1.2 mm nose radius tools in milling of AISI 1045.
It can be observed that at an average un-deformed chip thickness of 3 µm, the specific energy coefficient was 6.33, 4.95 and 3.94 J/mm3 for 1.2, 0.4 and 0.8 mm nose radii, respectively. This also shows that for energy efficiency, a mid-range tool nose radius of 0.8 mm should be preferred when milling AISI 1045 at a feed per tooth fz of 0.01 mm/tooth. At this feed per tooth (0.01 mm/tooth), and a stepover of 1 mm for 8 mm diameter tool, the maximum un-deformed chip thickness is 6.6 µm, which is 11% of the 60-µm cutting edge radius. As the un-deformed chip thickness increases to a value closer to the cutting edge radius of the tool, in this case 0.07 mm, the specific energy requirements for different nose radii become comparable in magnitude. The data show that, broadly, for conventional machining in shear-dominated cutting zone, the decision to use a 0.4-, 0.8- or 1.2-mm nose radius insert does not significantly affect the specific tip energy.
Effect of cutting environment on specific cutting energy
Dry and flood cutting environment was tested and analysed based on the method above for generating specific energy coefficient data. The result is displayed in Figure 5.
Specific energy demand for dry and flood cutting environment of AISI 1045 steel alloy.
From Figure 5 and in the region of feed per tooth of 0.01–0.2 mm/tooth, the specific energy in machining under flood coolant is higher than that for dry machining. At 0.2 mm/tooth, the average un-deformed chip thickness was 66 µm and greater than the 60-µm edge radius. This means that the higher specific energy for flood compared to dry is experienced when feed per tooth is lower than the tool edge radius, and in this zone, ploughing and rubbing dominate process mechanisms and have the effect of hindering the penetration of cutting fluid to the cutting zone due to the highly negative rake angle. Additionally, the fluid pressure can generate an additional load that could increase specific energy requirements. When machining at feed rates higher than the tool edge radius, the access of the cutting fluid to the cutting zone reduces the coefficient of friction enabling lower specific energy. It has been suggested by Childs, 29 in 2006, that the effectiveness of cutting fluid is cutting velocity and un-deformed chip thickness dependent.
Figure 5 shows that the impact of cutting fluid as a lubricant was not effective at lower un-deformed chip thickness. This is due to the fact that fluid accessibility to the contact zone becomes extremely difficult at such lower un-deformed chip thickness of less than 0.02 mm (i.e. 0.10 mm feed per tooth). The pressure of the cutting fluid increases the energy required for the machining processes.
The increased specific energy observed from Figure 5 at feed rates lower than 0.10 mm/tooth is an indication that flood cooling increases ploughing and rubbing effects at lower feed rates. This phenomenon occurs at ploughing- and rubbing-dominated mechanisms during the side milling operations. During ploughing and rubbing mechanisms, chips are built up until the size is up to the minimum chip thickness and could therefore be removed as chip. The chip build-up is inhibited by the flood cooling at the tool–chip contact interface. Hence, higher specific energy was observed at lower un-deformed chip thicknesses.
It can also be noted from Figure 5 that as the un-deformed chip thickness is increased further, the average specific energy coefficient for dry milling is 2.26 J/mm3, while that for flood milling is 1.26 J/mm3. This implies that the tip energy can be reduced by approximately 28% with flood cutting when compared to dry cutting under the same process parameters. Assuming tip energy to be 25% of total direct electrical energy demand, 7% energy reduction due to effective use of cutting fluid is possible. At a feed of 0.2 mm/tooth, the specific energy of flood cutting is equal to that of dry cutting. This suggests that cutting conditions should be set above 0.2 mm/tooth to realize the effectiveness of cutting fluid lubricating effect.
Effects of tool wear on specific cutting energy
For the tool wear evaluation, a turning operation was conducted on the MHP CNC Lathe and EN8 workpiece material. The cutting tool and process parameters are stated in Table 3. After the turning operations, each cutting tool edge was examined under the optical microscope for tool wear measurement. Figure 6(a)–(c) depicts the flank wear as imaged by the optical microscope after turning EN8 steel alloy for 4.16, 7.17 and 8.06 min, respectively, on an MHP CNC Lathe. It is observed, as expected, that flank wear grows with cutting time. Although an evidence of notch wear is observed, this work only evaluates the effect of flank wear and process dependent on specific cutting energy.
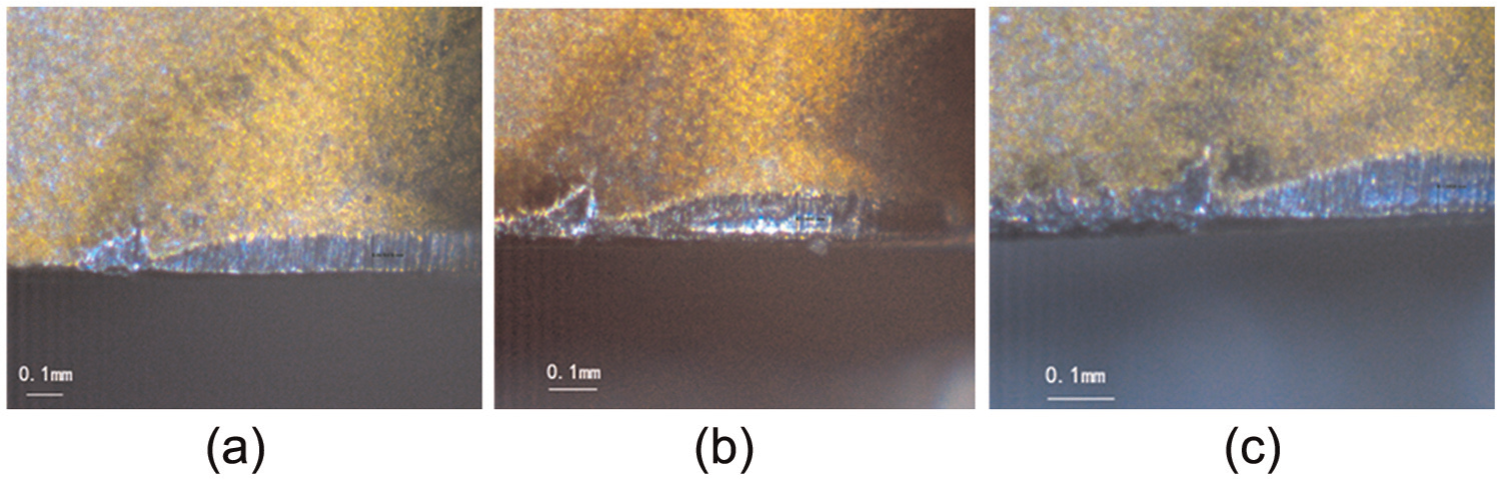
Optical microscope view of flank wear land: (a) flank wear at k = 2.27 J/mm3 after 4.16 min, (b) flank wear at k = 3.88 J/mm3 after 7.17 min and (c) flank wear at k = 4.50 J/mm3 after 8.06 min.
To generate the specific energy coefficient for each turning pass, six different turning tests were conducted based on the experimental design shown in Table 3 for pre-defined flank wear land and at 2, 4, 6, 8, 10 and 12 turning passes. Figures 7–9 show the estimated specific cutting energy coefficient for 2, 6 and 12 passes, respectively, when turning EN8 steel alloy at a feed of 0.3 mm/rev. From Figures 7–9, the specific energy coefficient represented by the slope of the graph is 3.40, 3.64 and 4.50 W s/mm3 with R2 of 0.86, 0.94 and 1.00, respectively.
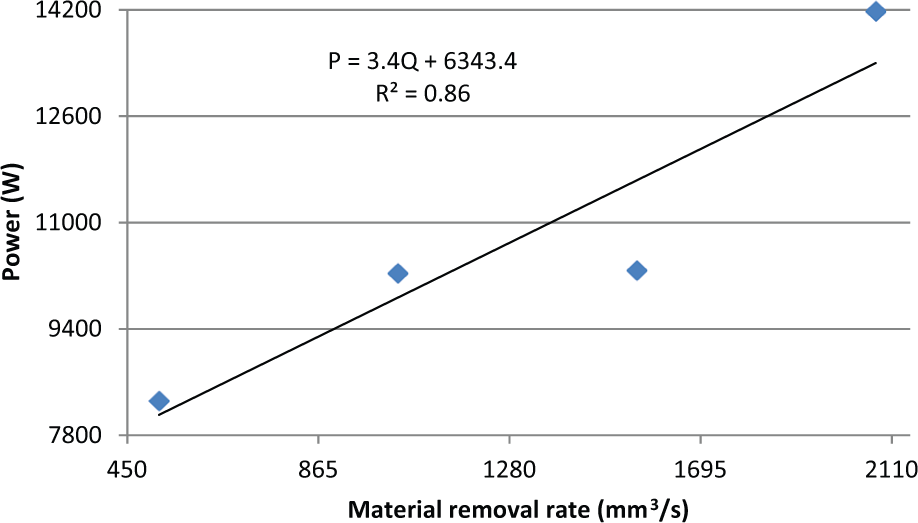
Evaluation of specific cutting energy coefficient for a two-pass turning of EN8 steel alloy.
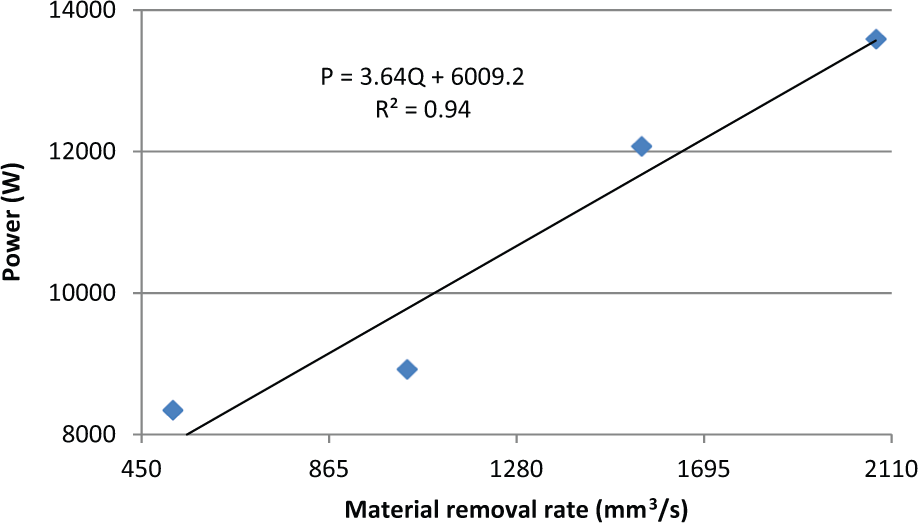
Evaluation of specific cutting energy coefficient for a six-pass turning of EN8 steel alloy.
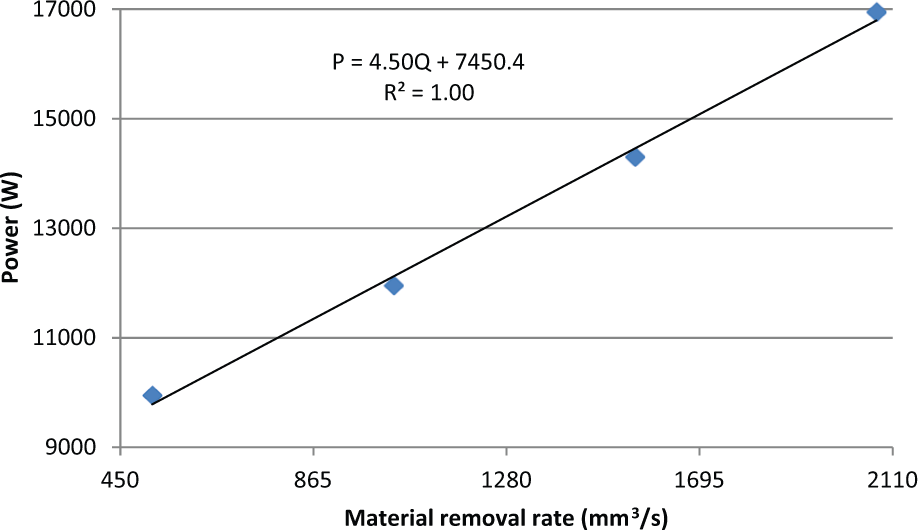
Evaluation of specific cutting energy coefficient for a 12-pass turning of EN8 steel alloy.
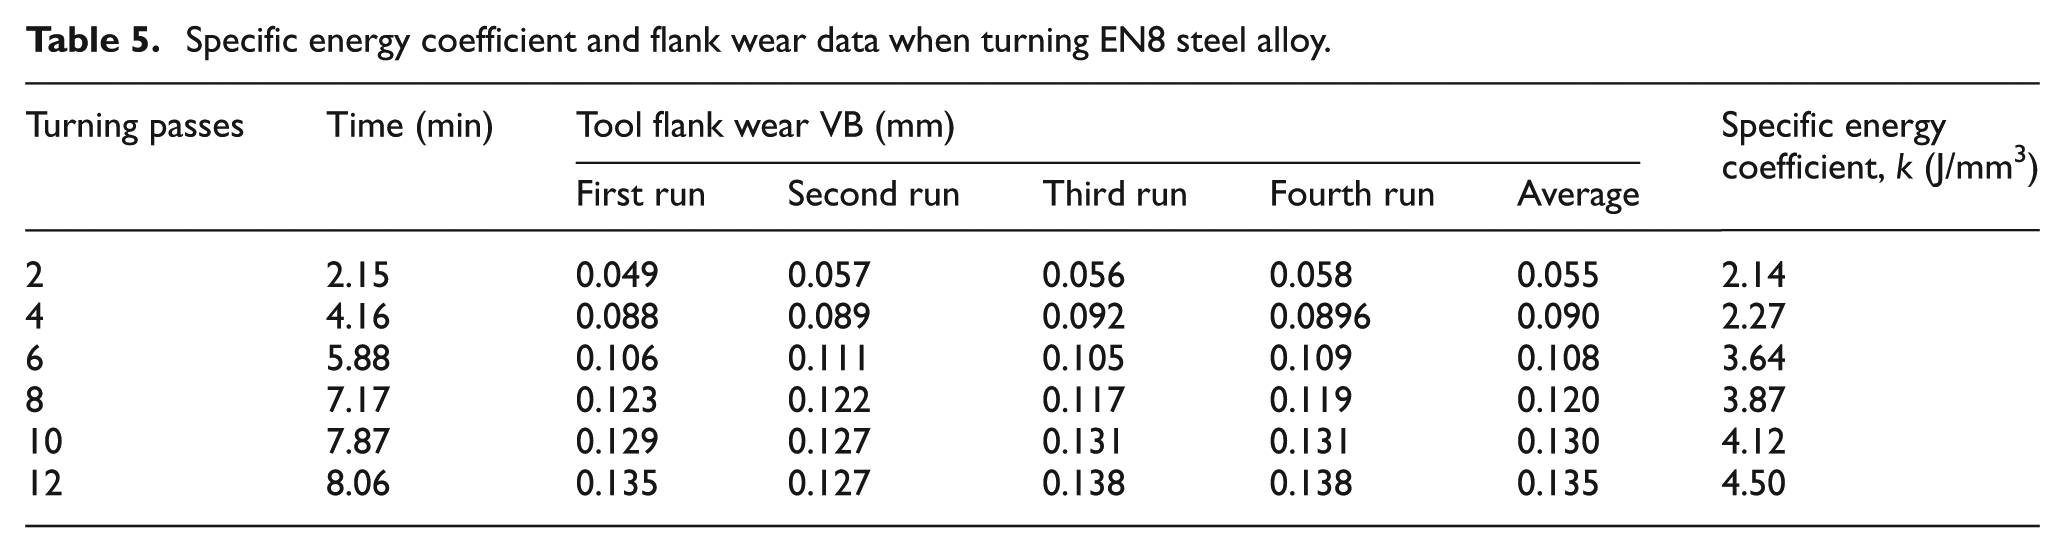
The evaluation of specific energy coefficient was conducted for 2, 4, 6, 8, 10 and 12 turning passes. For the purposes of saving space, the graphs shown are for 2, 6 and 12 turning passes. Table 5 shows the specific energy coefficient evaluated and the flank wear measured for all turning passes. The specific energy coefficient values obtained are in agreement with the range of values specified for steel alloy (i.e. 2–9 J/mm3) by Kalpakjian and Schmid. 30
Specific energy coefficient and flank wear data when turning EN8 steel alloy.
From Figure 10, it is deduced that the specific energy coefficient is directly proportional to flank wear, and as the flank wear increased from 0.055 to 0.135 mm, the corresponding specific energy also increased from 2.14 to 4.50 J/mm3. This indicates that, as cutting progresses, tool wear can increase the energy coefficient by an average of 52% when turning EN8 steel alloy. This is the case when the tool life criterion was set at 0.15 mm VB in order not to compromise component accuracy due to change in actual cutting variables as the tool edge recesses.
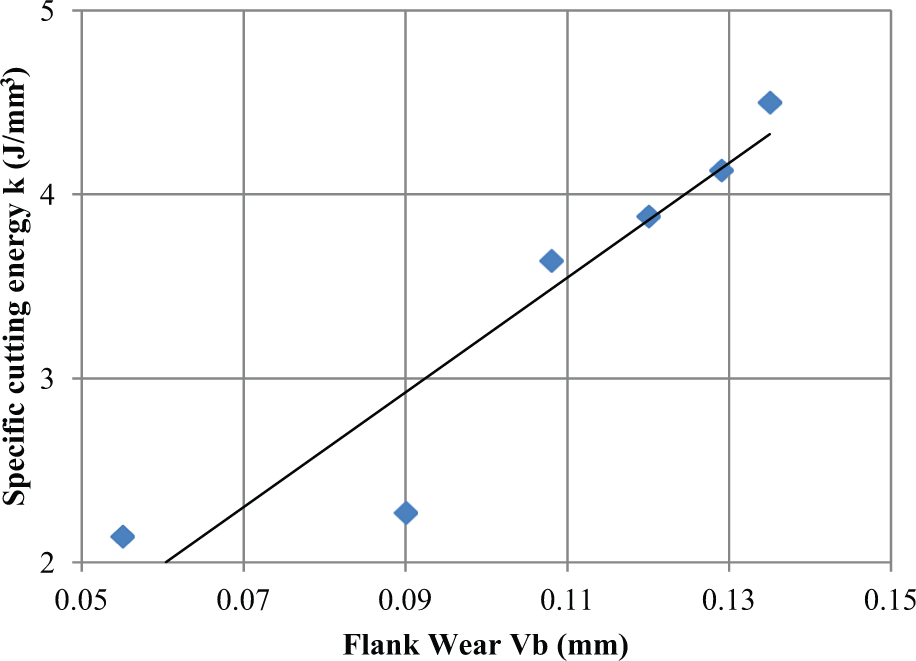
Specific energy coefficient increases with flank wear during turning operation of EN8 steel alloy.
Also, Figure 11 shows that as the cutting time increases, specific energy coefficient also increases. This result is based on the wear land established as indicated in Figure 6(a)–(c) for EN8 alloy steel. The observed linear trend makes it easier to account for the effect of tool wear on energy demand. This is in agreement with the report of Schultheiss et al. 31 in which they showed that the flank wear (VB) is a function of the machining time for each of the turning cases conducted on AISI 4340.
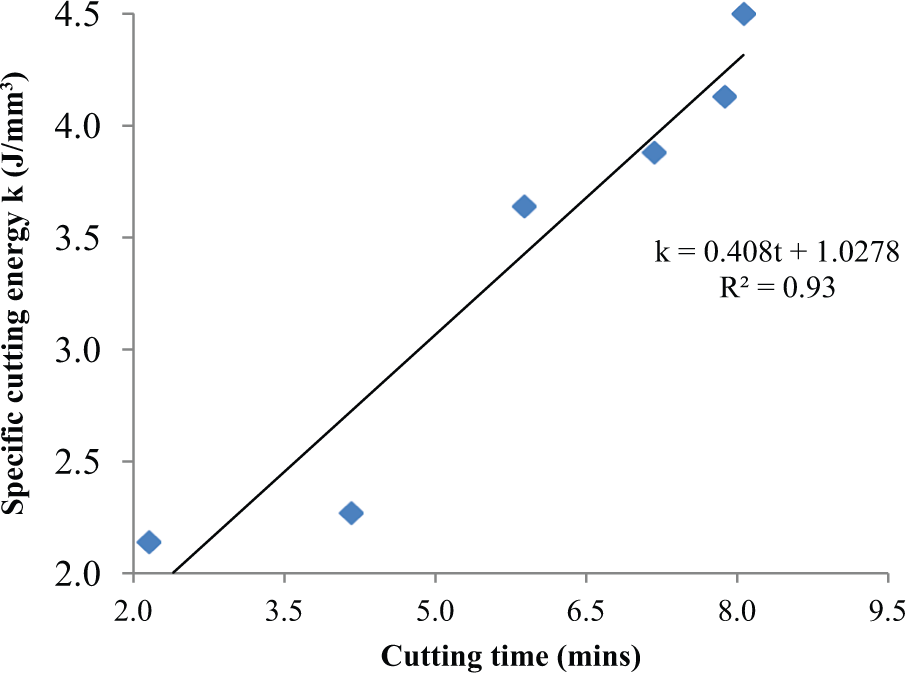
Effect of cutting time on k during a turning operation of EN8 steel alloy.
Conclusion
This work was focused on improving the integrity of specific cutting energy coefficients for mechanical machining processes. The study has provided data on how the specific cutting energy varies with un-deformed chip thickness, tool wear, cutting tool nose radius and dry and flood coolant. The following conclusions were drawn from the study:
By increasing the feed from 0.01 to 0.55 mm/tooth, the specific energy decreases from 5.34 to 1.47 J/mm3 for AISI 1045 steel alloy. There is a 72% reduction in tip energy, which is about 18% reduction in total direct energy demand assuming that tip energy is on average 25% of total direct energy demand. The change from low feed per tooth to high feed per tooth shifts the dominant process mechanism from rubbing/ploughing to shearing-dominated zones. Therefore, to reduce the energy intensity of the machining processes, roughing or bulk material removal should be undertaken at un-deformed chip thickness greater than the tool edge radius.
Tool wear can increase the specific energy coefficient by an average of 52% when turning EN8 steel alloy. Assuming that tip energy is 25% of the total energy demand, tool wear can increase total energy by an average of 13%.
The flood cutting environment decreases the specific energy coefficient by an average of 28% when compared to dry cutting in normal shear mode cutting conditions. This is estimated to be a 7% reduction in total energy demand in machining when assuming that tip energy is on average 25% of the total energy demand.
For nose radii of 1.2, 0.8 and 0.4 mm, the specific energy does not significantly change in shear-dominated cutting mechanism zones. However, at very low un-deformed chip thickness, the 0.8-mm nose radius tool appears to give the best and lowest specific energy values.
This study has provided a benchmark that total energy demand in mechanical machining processes can be reduced or increased by 18%, 13% or 7% by selection of un-deformed chip thickness, tool wear and use of cutting fluids, respectively. These factors need to be taken into account if the margin of energy demand improvement is comparable. There is a strong case for selection of optimum feed rates and hence chip thickness in order to reduce the energy intensity of machining processes.
Choosing between a tool nose radius of 0.4, 0.8 or 1.2 mm does not significantly alter the specific energy demand in shear-dominated cutting zones. These choices are within the grasp of machine shops and end users since they may not significantly influence the basic power demand unless by choice of machines.
Footnotes
Declaration of conflicting interests
The authors declare that there is no conflict of interest.
Funding
This research received no specific grant from any funding agency in the public, commercial or not-for-profit sectors.