
Abstract
Deformation of thin-walled structure during machining will influence the surface quality of the final part. Present article investigates this problem and develops a method to predict the surface roughness of the machined surface. To achieve this, the prerequisite is to obtain the dynamic deformation along the milling path. To calculate it accurately, the workpiece is simplified as thin-walled shell and the milling force is simplified as moving input. An expression of the dynamic deformation of the whole structure, which under the excitation of moving milling force, is derived by solving the vibration equation using modal superposition method. Then, the deformation along the milling path is computed by substituting the path coordinates into the expression. The deformation along the milling path is filtered to remove its low-frequency and mid-frequency signals before it is used to evaluate the surface roughness of the machined surface. At last, several machining cases are implemented to demonstrate the proposed method. The experimental results match well with the predicted results. From the predicted and experimental results, it is founded that the deformation during processing is the main reason leading to the poor surface quality of the flexible machined workpiece.
Introduction
Surface quality is mainly concerned by manufacturers. Surface roughness is one of its most important indexes since it relates to the wear resistance, ductility, tensile, and fatigue strength for machined parts. Besides, as widely use of computer numerical control (CNC) technique in the machining practice and accurate prediction of surface roughness can provide a very economical way to determine the machining process using CNC machines. Therefore, it has drawn much attention. To date, many methodologies to predict the surface roughness were developed. Benardos and Vosniakos classified these methodologies to four categories, namely, methodologies based on machining theory to develop analytical models and/or numerical algorithms to represent the machined surface; methodologies that examine the effects of various factors according to cutting experiments and the analysis of the experimental results; methodologies that use designed experiments; and methodologies based on artificial intelligence (AI) approaches, 1 among which, methodologies based on machining theory and the AI method were commonly used.
Methodologies which are based on machining theory focus on some key factors such as cutter properties, process kinematics, chip formation mechanism, and vibration of tool and workpiece during machining process. 1 General procedures of this method include simulating the generation of the machined surface using computer-aided design (CAD) methods or tools first and then visualizing surface topography and finally evaluating the surface roughness. 1 Generally, using rigorous mathematical equations to develop the geometrical model is the basis of this approach. 1 Based on these procedures, many investigators modeled the surface roughness of milled surface. Lee et al. 2 predicted the surface roughness based on acceleration signals rather than the cutting force. In their investigation, a geometrical milling model is used and the displacement signal was obtained by the fast Fourier transform (FFT) of the acceleration signals. Muñoz-Escalona and Maropoulos 3 developed a geometrical model, which was based on a geometrical analysis of the recreation of the tool trial left on the milled surface, to predict the surface roughness when face milling the Aluminum workpiece with square inserted tools. The developed model can be used for any combination of material of workpiece and cutter when tool flank wear is not considered, and it is suitable for using any tool diameter with any number of teeth and tool nose radius; 98% accuracy can be achieved in terms of predicting the surface roughness when compared to the experimental data. Liu and Loftus 4 predicted the surface roughness of the ball end milling process theoretically based on the surface topography simulation. The authors developed a surface generation algorithm based on the Boolean operation between the tool surface and the part surface, in which the workpiece was modeled by spike elements. Quinsat and colleagues5,6 modeled the 3D surface topography and the areal surface roughness in five-axis milling operation with filleted ball end mill. The method was based on the N-buffer method and integrating of the Inverse Kinematics Transformation. Arizmendi et al. 7 predicted the roughness value of the peripheral milled surface. The model considered the tool vibration during cutting. It can predict the surface topography, form error as well as surface roughness simultaneously. Jiang et al., 8 Surmann and Biermann, 9 and Costes and Moreau 10 also considered the effect of the tool displacement on the surface topography and the surface quality considered the influence of tool wear on the surface topography in milling process. Tool wear will affect the microgeometry of cutting edge, which will affect the cutter edge’s tool path and finally the surface topography and roughness. Thus, it is an important factor to impact the surface quality of the final product. Zhang et al. 11 and Omar et al. 12 also considered its effect on the surface topography. Besides, effects of tool runout, tool deflection, system dynamics, and the tool tilting on the surface roughness were also considered in this investigation.
Methodologies based on AI were developed as the advance of artificial neural network (ANN), genetic algorithms (GAs), fuzzy logic, and expert systems. It is a method to predict the surface roughness by simulating the way in which human beings process information and make decisions. 1 Many literatures employed the methods based on AI to predict the milled surface roughness. Marani Barzani et al. 13 employed the fuzzy logic AI technique to predict the surface roughness of Al–Si–Cu–Fe die casting alloy. Samanta et al. 14 developed the soft computing techniques, which combines the ANN and adaptive neuro-fuzzy inference system (ANFIS) to predict the surface roughness. Erzurumlu and Oktem 15 developed ANN model and a response surface (RS) model to predict surface roughness on mold surfaces. GA coupled with ANN was employed to find optimum cutting parameters leading to minimum surface roughness without any constraint. 16 Razfar et al. 17 predicted the optimum cutting parameters that result in minimum surface roughness based on the particle swarm optimization in face milling. Mahesh et al. 18 used the response surface methodology (RSM) to model the relationship between the surface roughness and the cutting parameters including spindle, feed rate, and depth of cut. Then, GA was developed to find the optimum cutting parameter which results in minimum roughness value. Mithilesh et al. 19 also used RSM to model the roughness of the ball-end-milled surface. Then, composite desirability function and teaching-learning-based optimization algorithm were used to obtain optimal cutting process parameters. Others literature20–22 were also related to this method.
Except for the two commonly used methods as mentioned above, other methods, such as experimental method and designed experiments method, are also used. Raju et al. 20 determined the effect of cutting parameters on the surface roughness by conducting a multiple regression analysis using variance analysis. Cakir et al. 23 examined the effects of cutting parameters including cutting speed, feed rate, and cutting depth onto the surface roughness through a mathematical model developed by using the data obtained from many groups of experiments. Bhardwaj et al. 24 also investigated the effect of machining parameters on the surface roughness. Besides, Ozcelik and Bayramoglu 25 presented the development of a statistical model for roughness prediction in high-speed flat end milling.
The investigation mentioned above is about the surface quality evaluation during milling the rigid components. For thin wall milling, the low rigidity of thin-walled structure will lead to undesirable deformation during machining process, which will deteriorate the surface quality of the final component. So far, several publications are available to model the surface quality of the flexible parts after machining. Michalik et al. 26 mathematically modeled the surface roughness Rz for constant cutting conditions in up and down milling. Montgomery and Altintas 27 presented a model for surface generation in dynamic milling. It was found that when the tooth passing frequency was chosen as an integer ratio of a dominant frequency of tool–workpiece structure, imprint of vibrations on the surface finish was avoided. Schmitz et al. 28 considered the effect of the runout on the milled surface. Joshi and colleagues29,30 investigated the correlation between surface quality and workpiece deflection in ball milling. A strong relationship between the machining vibration and the surface roughness was pointed out by Sebastian et al., but the link between the amplitude and the surface roughness was not given in their investigation. 31
As to the surface roughness affected by the dynamic deformation of thin-walled structure, no researchers paid attention to this within the knowledge of the authors. According to Budak, 32 the static deformation will lead to dimensional error of the final part and the dynamic deformation will influence the surface quality. Thus, this article intends to investigate the dynamic deformation of low-rigidity component during machining and the surface roughness related to the dynamic deformation. Remainder of this article is arranged as follows: The dynamic machining deformation and surface quality of the manufactured surface are modeled in section “Surface roughness modeling.” The deformation and surface quality model by simulation and experiment are demonstrated in section “Case study and discussion,” and the conclusions are drawn out in section “Conclusion.”
Surface roughness modeling
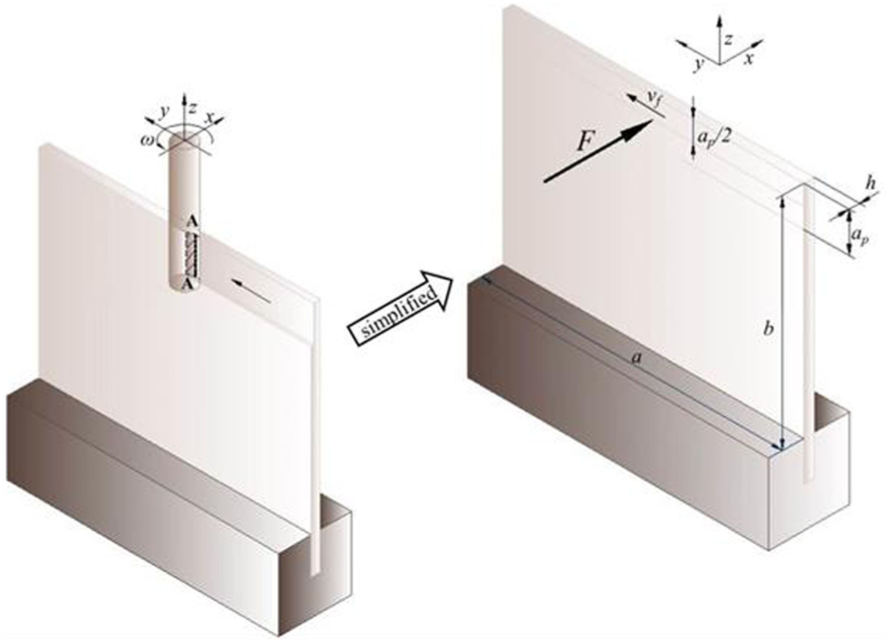
A simple milling case shown in Figure 1 is investigated in this article. The machined surface is generated by the exit cutter edge A-A in down milling. As the cutter shifts along the feeding direction, so does the edge A-A, and the whole surface will be generated gradually. The plate deformation on the line A-A will be imprinted on the milled surface and it will also vary with the cutter location. Namely, the machined surface is related to the plate dynamic deformation on the line A-A along the milling path. Therefore, the key to evaluating the surface roughness is the plate deformation along the milling path.
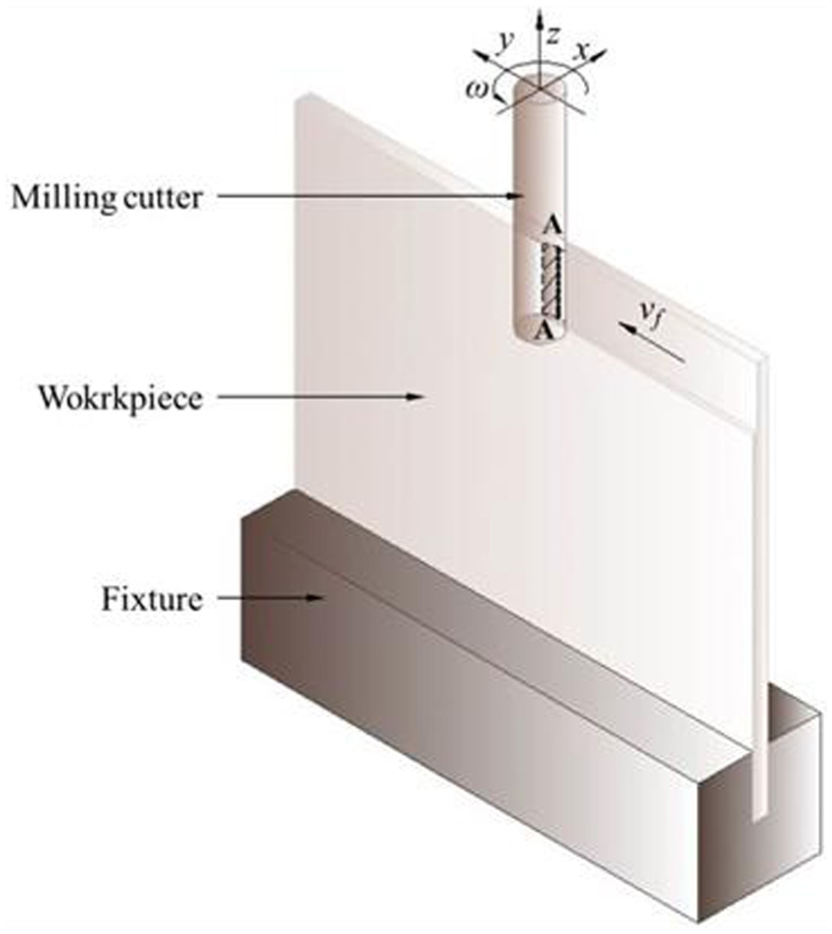
Physical model considered in this article.
Dynamic deformation of the component along the milling path
To compute the plate deformation along the milling path, the precondition is to obtain the dynamic deformation of the whole workpiece. This article uses the shell theory to calculate the plate deformation. The component is simplified to a cantilever plate according to Aijun and Zhanqiang 33 as shown in Figure 2. During milling process, the cutter moves from y = 0 toward y = a. The deformation is mainly caused by the milling force which is perpendicular to the part surface, that is, force along x direction. Therefore, force components of other two directions are neglected during modeling. For simplicity, the distributed milling force along cutting depth ap is treated as a point force applied at the half of axial depth of cut (ap) in z direction, and it will move at a velocity of feeding speed vf during machining. Suppose that the force applying point is donated by (ξ(t), η(t)). Considering classical thin-walled plate theory, 34 motion equation of the component is expressed as
where D is the flexural stiffness, and its expression is D = Eh3/12(1 – υ2) in which E is the Young modulus and υ is the Poisson ratio;

a is the length, while b is the width of the workpiece.
Model simplification.
Equation (1) can be solved by modal superposition method, which means that the dynamic deformation w can be expressed as
in which Tmn(t) is (m, n) order modal coefficient and Wmn (y, z) denotes the corresponding mode shape.
Substituting equation (5) into equation (1) and considering the orthogonality of modal shape, the modal coefficients can be obtained and its expression is
in which ωmn is (m, n) order natural frequency, amn and bmn are related to the initial conditions, Pmn(t) denotes generalized force, and Mmn is the generalized mass.
Choosing proper modal shape functions (the modal shape functions for the cantilever plate are shown in Appendix 1), and then computing the modal coefficients according to equation (6), the dynamic deformation of the whole plate is then obtained by substituting the modal shape functions and corresponding modal coefficients to equation (5).
After the deformation of the whole surface is obtained according to the method presented in section “Dynamic deformation of the component along the milling path,” the deformation along the milling path can be computed. It is obtained by substituting its coordinates (ξ(t), η(t)) into the expression of the deformation of the whole workpiece equation (5), and it is written as
According to Budak, 32 the dynamic error of the resulted surface is
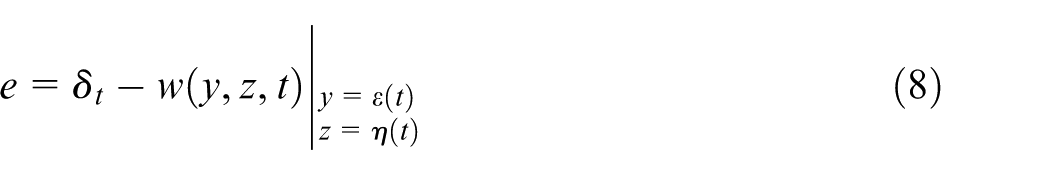
in which δt is the error caused by the cutter deformation, which is neglected in this article because of its higher stiffness compared to the flexible plate. Thus, the machined surface topography is related to the deformation of the milling path only. The surface quality will be evaluated according to the machined surface topography.
Surface roughness modeling
The manufactured surface profile is generally distinguished into four components, that is, form, waviness, roughness, and micro-roughness as shown in Figure 3(a). Different components have different wavelength as shown in Figure 3(b). Form is a component of surface finish with a long wavelength which is similar to the wavelength of the object. It needs to be removed in order to analyze other surface texture such as waviness and roughness. Waviness is a component varying slowly and depending on the horizontal position. Its wavelengths range from 0.5 to 2.5 mm. Roughness is a component of surface texture varying rapidly and depending on the horizontal position. Roughness is defined as wavelength ranging from 20 to 500 µm. Micro-roughness is the finest component of surface texture. It is defined as the set of high frequencies (the smallest wavelengths) in a measurement, coming from either the sampling noise or the microscopic relief and the structure of the material. This article mainly focuses on the roughness, which means that other parts have to be removed. It is realized by filtering, which is an operation that transforms a profile or a surface in order to remove those surface components that are of no or little interest for the analysis of a measurement. The most current form of filtering consists of separating data frequencies (or wavelengths) into two parts. The first one has long wavelengths or low frequencies (waviness), while the other one has short wavelengths or high frequencies (roughness). The component of form, waviness, and micro-roughness should be removed from the milling deformation by filtering before they are used to calculate the roughness.
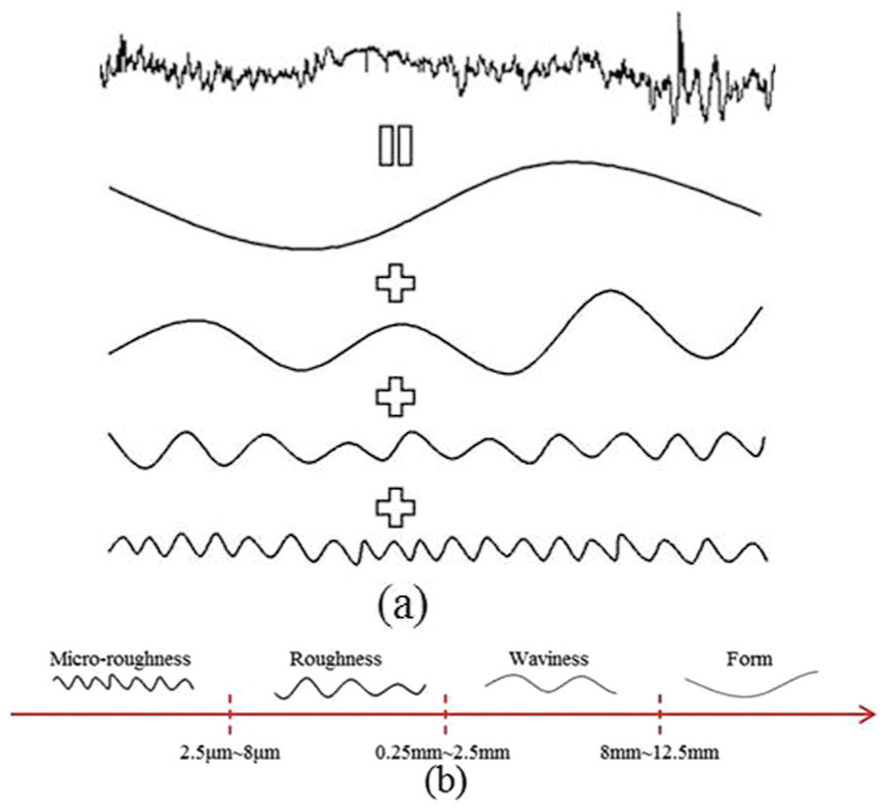
Different components for surface profile: (a) components for a surface profile and (b) different wavelength for different surface components.
However, there exists many surface amplitude parameters, including roughness average (Ra), root-mean-square roughness (Rq), and maximum height of peak-to-valley roughness (Ry or Rmax), to evaluate the surface quality in the engineering practice. 35 In this article, roughness average Ra is employed. It is expressed as
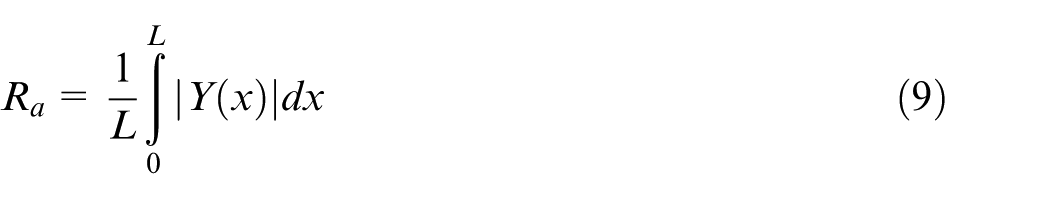
where L is the sampling length and Y is the ordinate of the profile curve. Selecting appropriate L and taking e into the roughness equation (9), the surface roughness of the manufactured surface will be obtained. In summary, the procedures to compute the surface roughness can be shown in the following flowchart (Figure 4).
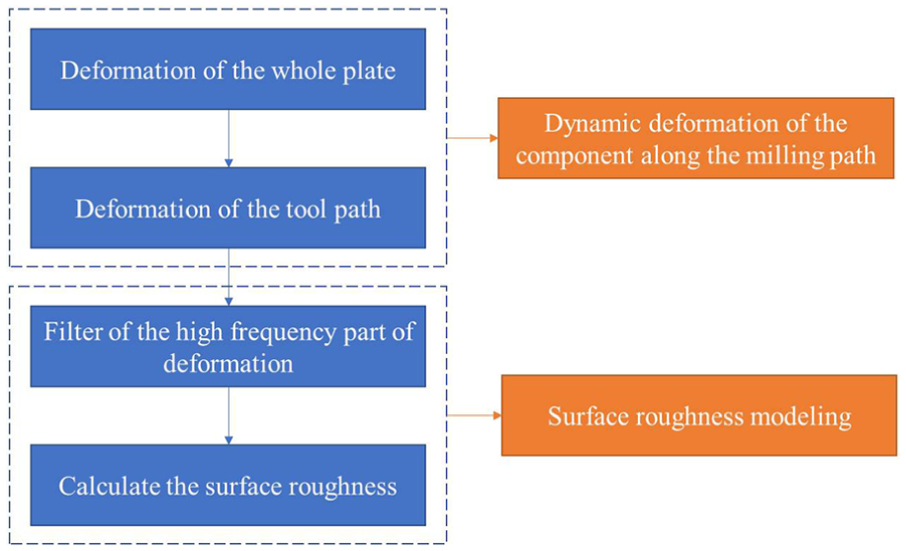
Flowchart to modeling the surface roughness in this article.
Case study and discussion
Case study
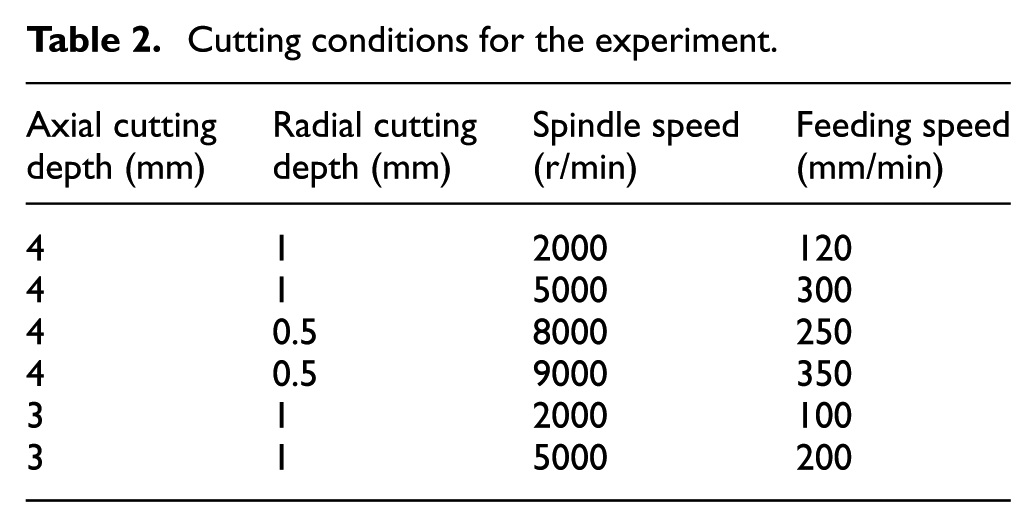
To demonstrate the feasibility of the presented method, a thin-walled aluminum plate with a peripheral dimension of 150 mm × 110 mm × 5 mm is chosen to perform the cutting experiment. The physical parameters for the component are listed in Table 1. Six groups of cutting conditions, shown in Table 2, are selected to implement the experiments. To predict dynamic deformation accurately during processing, both the milling force and structure deformation are detected during cutting process. The experimental setup is shown in Figure 5. The plate is mounted on the dynamometer (Kistler 9257A) which is fixed on the worktable of the CNC machine center. The tool wear will also affect the surface roughness. To avoid it, the cutter is detected after each cutting. The cutter will be replaced by a new one as long as the wear is detected.
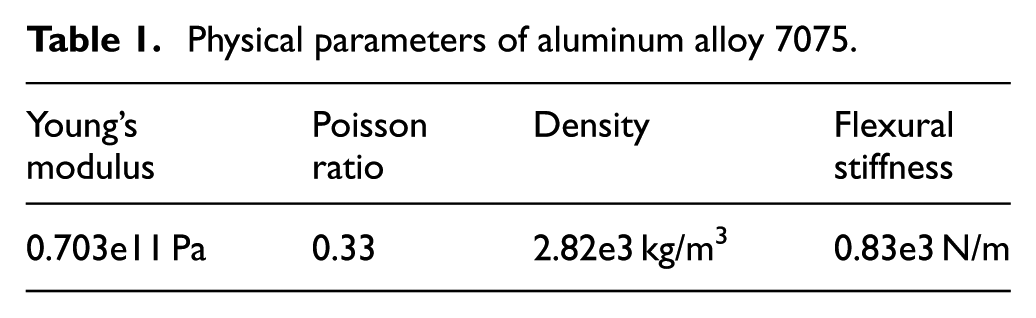
Physical parameters of aluminum alloy 7075.
Cutting conditions for the experiment.
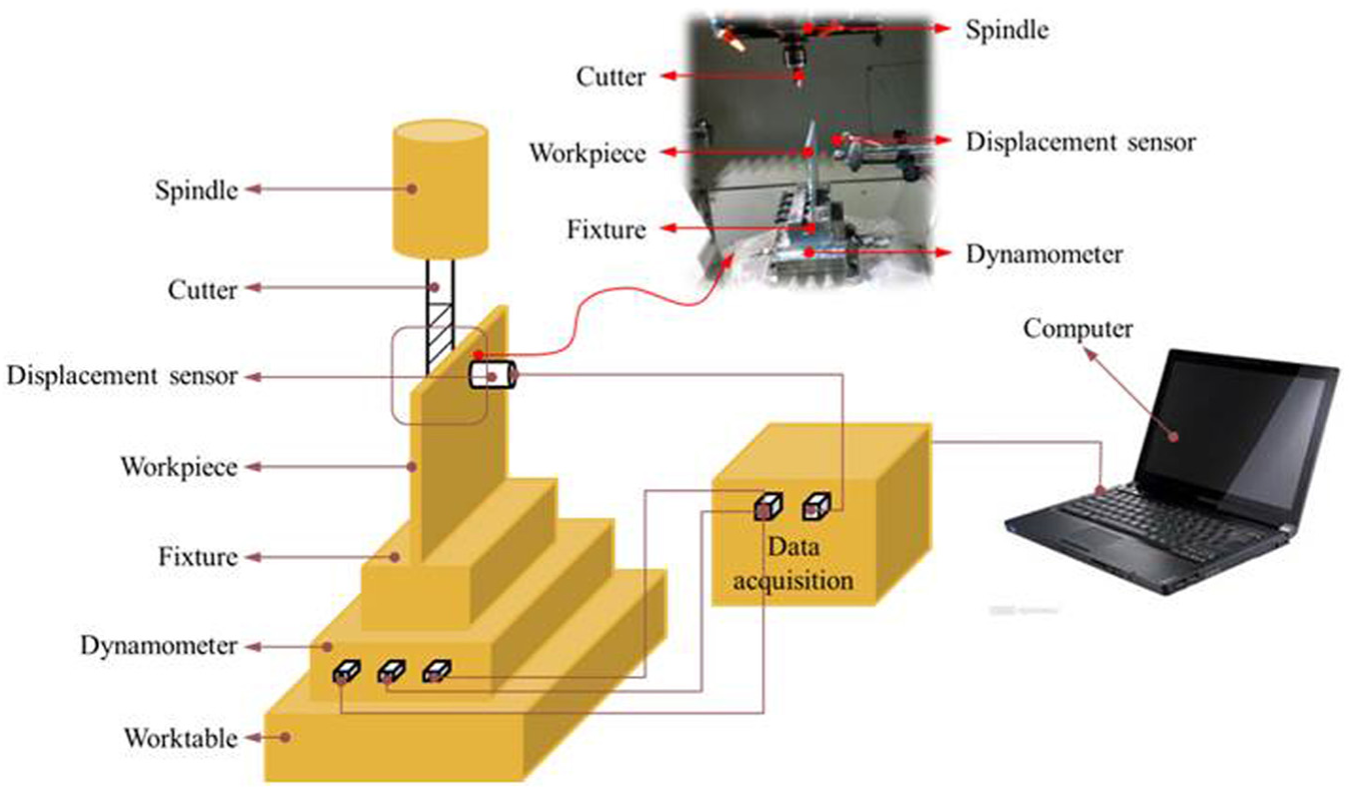
Experimental setup.
The tested milling force is treated as input for equation (1). As is mentioned in section “Dynamic deformation of the component along the milling path,” milling force in other two directions (along the directions of y and z) are neglected during simulation because they make little contribution to the dynamic deformation of the structure. According to the procedures in section “Dynamic deformation of the component along the milling path,” the part deformation under the moving milling force is calculated. And then, the dynamic deformation of the milling path is obtained by substituting the path coordinate (ξ(t), η(t)) into equation (8). In this article, the coordinate of milling path is ξ(t) = b −ap/2 and η(t) = vft. The deformation is filtered according to the ISO 11562:1996(E) before it is used to evaluate the roughness of the machined surface according to equation (9).
Discussion
The predicted Ra is experimentally verified by measuring the surface roughness of the machined surface. The measured results are also shown in Figure 6 for comparison. The comparison results indicate that the Ra of predicted and tested is agreeable, which demonstrates the validation of the proposed method, yet some discrepancy is observed between the predicted results and the experimental ones. This may be caused by other factors such as tool edge geometry and dynamic runout of tool rotation. A more accurate model will be constructed to take these factors into account in the future investigation.
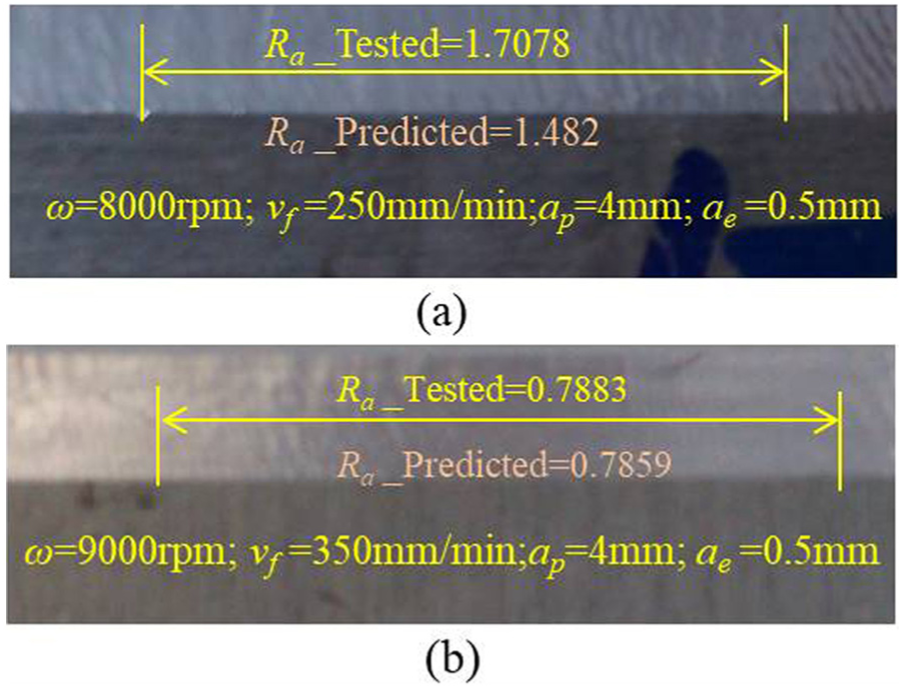
Comparison between the predicted and tested roughness: (a) predicted roughness and tested roughness of third group and (b) predicted roughness and tested roughness of fourth group.
Unlike simulate the surface topography considering the interaction between the tool edge trajectory and the workpiece as mentioned in previous studies.2–6 And then, model the roughness based on the profile. This article just considered the high-frequency part of the workpiece vibration along the milling path to calculate the roughness value. Thus, the method in this article reduces the procedures to calculate the roughness value.
Conclusion
In this study, an expression to compute the dynamic deformation of the whole workpiece during machining process is firstly constructed. The deformation along the milling path is obtained by substituting the path coordinate to the deformation expression. The surface roughness of the milled surface is finally computed according to its basic definition. Several cutting experiments under different cutting conditions are implemented to demonstrate the proposed approach. During cutting, both the cutting force and the deformation of the part are tested. The milling force is employed as an input to compute the deformation. The computed deformation is compared with the tested one. They match well with each other. The surface roughness is predicted using the high-frequency part of the workpiece deformation of the milling path. At the same time, the value of surface roughness for the manufactured surface is also detected to compare with the predicted results. It shows that the measured results agree with the predicted one. From these experimental and analyzed results, main conclusion can be drawn as follows:
During milling of thin-walled structures, the dynamic deformation along the milling path is the key factor to affect the surface topography of the resulting surface. Thus, calculating the dynamic deformation of the workpiece during milling process accurately is the prerequisite to investigate the surface quality.
The flexible workpiece can be simplified to a thin-walled shell during machining. Its dynamic deformation can be thought as the vibration displacement of the thin-walled shell under the excitation of the moving milling force. To obtaining it precisely, its damping effect should be considered in the deformation governing equation.
The surface roughness of the machined surface can be predicted using the high-frequency part of dynamic deformation of the workpiece along the milling path. A prediction method based on the dynamic deformation is presented in this article and it is experimentally validated.
The presented surface roughness prediction method is not only feasible for the simple structure such as plate but also can be used to predict surface quality of manufactured flexible structures with complex surface.
The milling force in this article is experimentally measured. Actually, it can be theoretically predicted and many milling force models (such as milling force proposed by Eksioglu et al.
36
) can be used to compute it accurately. Thus, the excitation (i.e.
In this article, only deformation of the part is considered to model the surface roughness. However, other factors such as tool edge geometry and cutting parameters will also affect the topography of the machined surface and thus the surface roughness. In the future investigation, these factors will be taken into account.
Footnotes
Appendix 1
According to Zhiyuan, 34 the (m, n) order mode shape function of the workpiece can be obtained by the so-called beam function combination method. In this article, the mode shape of the plate has a following form
in which p and q are integers and
where
Yi(y) and Zj(z) in equation (10) are chosen functions that satisfy the corresponding boundary conditions of the plate in the y and z directions, respectively. They are quasi-orthogonal to each other; corresponding beam functions of this article are
where α is the frequency coefficient of beam function; a and b is the length and width of plate, respectively; C is the coefficient of beam function; and α and C can be obtained according to Zhiyuan. 34
Declaration of conflicting interests
The author(s) declared no potential conflicts of interest with respect to the research, authorship, and/or publication of this article.
Funding
The author disclosed receipt of the following financial support for the research, authorship, and/or publication of this article: This work was financially supported by the National Basic Research Program of China (973 Program; No. 2014CB046603).